Introduction
According to the Japanese Census of Agriculture and Forestry in 2015, the number of farmers has fallen by half since the 1980s, and only 7.2% (i.e. 90,000 people) of them are under 50 years old (Static Agriculture Census, 2015). This raises obvious questions for other soon-to-be aged countries. Technical management succession is one of the most significant issues in agricultural production. The concept of precision agriculture has a potential to solve the abovementioned problem with three steps in technology development. The first step is introducing conventional farming with intensive mechanization, reducing labor input such as robot tractor application (Noguchi, Reference Noguchi, Ishii and Terao1997). The second step involves development of mapping-oriented variable-rate application technology, such as remote sensing. The last step implies the maturity of mapping-oriented and wisdom-oriented technologies for benefit driven field management (Shibusawa, Reference Shibusawa2002). The proliferation of on-the-go devices in a communicating–actuating network creates the Internet of Things (IoT), wherein sensors and actuators blend seamlessly with the environment around agricultural production, and the information is shared across agriculture machinery/grower in order to develop smart agriculture. The smart devices should be smoothly integrated within precision farming service delivery models such as “sensing as a service”. The most obvious effects of the IoT introduction will be visible in both on-the-go variable application and field mapping (Burrell et al., Reference Burrell, Brooke and Beckwith2004). In addition, many studies attempt to quantify input factors, such as operator age, formal education, or years of farming experience (Fernandes-Corejo et al., Reference Fernandez-Cornejo, Beach and Huang1994). In response to the declining of both production and population, this study proposed a Japan-model smart agriculture. Japan-Model smart agriculture is an evolution of precision agriculture, focusing on the collection and utilization of field information for management succession. We developed series of agricultural machines that can be categorized as smart agricultural machinery systems (SAMS). The objectives of this research are to evaluate the operator skills, farmer knowledges, field characteristics, in conjunction with the database obtained from the SAMS, and the successful adoption among producer in Japan.
Materials and Method
Smart agricultural machinery system (SAMS)
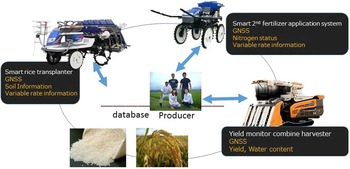
Smart agricultural machinery system is a schema of precision paddy agriculture, aiming for standardization of smart agriculture Japan model. The SAMS consisted of two paradigms. First, is field condition and geo-location obtained from agricultural machinery (i.e. smart rice transplanter, smart 2nd fertilizer application system and yield monitor combine harvester). The sensors in these machinery systems enable collection of immense quantities of data without the necessity of laboratory analysis. All the parameters listed below intend to be applied for relative field evaluation. The second paradigm is the translation system to convey digital data to the grower. The blueprint of SAMS is database creation for growers’ communication as shown in Fig.1.
Concept of Smart agriculture machinery system.

Smart rice transplanter (SRT)
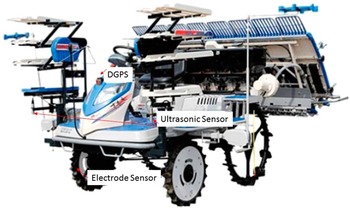
Smart rice transplanter (NP80DLPEV, ISEKI) consisted of 3 types of on-the-go soil sensors and variable rate fertilizer applicators (VRA), mounted on the machine as shown in Fig. 2. An ultrasonic sensor, electrodes and a platinum resistance thermometer were employed for topsoil depth (TD), apparent electrical conductivity (ECa) and soil surface temperature measurements, respectively (Morimoto et al., Reference Morimoto, Hirako, Yamasaki and Izumi2013). The interval sampling of sensing was 5 Hz, and the volume of VRA could be adjusted every second. Adjustment of the fertilizer application is not decided scientifically, but rather while farming by trial and error based on the field information. The detail of the algorithm will described at the ECPA meeting.
Outline of Smart rice transplanter with on-the-go soil sensor.

Smart 2nd fertilizer application system (SFAS)
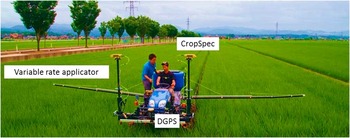
Smart 2nd fertilizer application system (SFAS) provides the capability to vary the application rate of fertilizer inputs. On-the-go canopy sensors (CropSpec, TOPCON) were mounted on a high clearance tractor (JKB23, ISEKI) for measuring N status as shown in Fig. 3. The vegetation index (VI) value obtained from this sensor was used to estimate the N status. The VI is similar to NDVI but is calculated using NIR and Red bands with the wavelength range 800–810 nm and 730–740 nm respectively. Spectral reflectance data could be easily recorded on-the-go as a text file in the controller internal memory. Real-time variable fertilization was performed while traveling according to the control value obtained from the controller. The SFAS was also equipped with GNSS in order to enable georeferenced information.
Smart 2nd fertilizer application system.

Farm activity record management system (FARMS)
Farm activity record management system (FARMS) is a georeferenced information system that consists of a main program running on a standalone PC, which browses and stores data in a data logger interface (Hayashi, Reference Hayashi2014). The powerful analytical capabilities of this device allow the examination of farm conditions and precisely monitor the influence of farm management practices, soil condition, nitrogen status and yield amendment analyses as obtained from the SRT, SFAS and yield monitor combine harvester.
Result and Discussion
Studied area
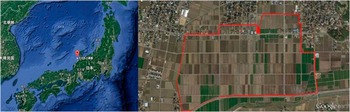
The studied area is located to the north west of Japan (N: 36.429107, E:136.500854) as shown in Fig. 4. The location owned by Takemoto Farm Association, consisting of 400 fields with total area of 50 ha. Half of the fields (i.e., 200) represent actual field activity and applied as test site (applied VRA), while the rest were used as a control (conventional uniform application).
Location of test site (Takemoto farm association).

Statistical analysis of TD and SFV
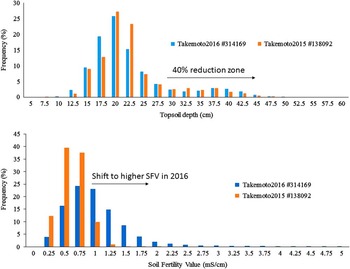
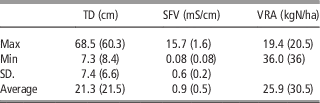
In total, 314,169 datasets of TD and SFV were obtained using the SRT in 2016. These data were complemented by 138,092 additional data, collected in 2015. The statistical analysis of TD in 2015 and 2016 are shown in Table 1. Based on experience, the grower can set-up three steps of fertilization reduction rate from conventional amount by API. In the first Step, the TD measured more than Average+SD. On the next step, the TD measured less than Average+SD. Finally, the SFV measured more than Average+SD. If these three conditions cannot meet, the SRT will apply the conventional amount of fertilizer. In this experiment the grower set Step 1 and 2 to 40% and 30% respectively. In this way, we defined “ATARI” as a variable fertilization model that combines the growers’ experience and measurement by using SAMS. Figure 5 shows the results of comparing the distribution of TD and SFV in 2015 and 2016. The result of comparing big data of TD for 2 years, suggest that the trend of TD remains the same. However, since this grower applied manure at the end of 2015, SFV in 2016 was higher than that of 2015. As a result, fertilizer reduction rate increased from 15.2% in 2015 to 27.2% in 2016.
Histogram of TD and SFV in test site.

Statistical analysis of TD, SFV and VRA (2015 is shown in brackets)

Big data of crop status
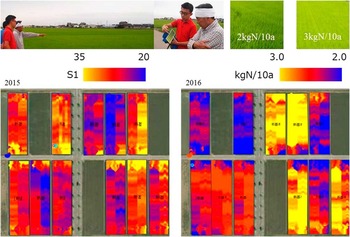
Since the second fertilization timing is limited, setting of ATARI is very important in order to incorporate expert knowledge into variable fertilization as shown in Fig. 6. As a result, producers designed fertilization applications with 3.0 kgN/10a at S1=15 and 1.5 kgN/10a when S1=30. A map of S1 and the results of variable rate fertilization is shown in Fig. 6. From 20 ha of the initial study, 67,000 datasets were obtained. It revealed that the S1 map was able to evaluate in-situ variability in the field, in particular a high S1 was observed among the heading area. The variable application fertilizer system could reduce 2.2kgN/10a and 12% of fertilizer application as compared to uniform application (2.5kgN/10a).
Schema and map of Smart 2nd fertilizer application (up): Onsite decision making for VRA (down): 2 years in-situ variability map of S1 by using FARMS.

Harvesting time evaluation
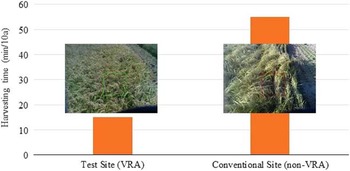
The most important parameter in the field assessment is the expansion of the appropriate work area during harvesting season, because the rate of fine-weather in Japan is only 40%, due to Typhoons and monsoon rain. Harvesting on a good day is very important for saving energy for grain drying. In this study, we applied harvesting efficiency for VRA evaluation. The result of the time series study indicated that harvesting in conventional practice (non-VRA site) took 3.5 times longer as compared to the VRA site, shown in Fig. 7. However, this result might be changing due to the weather conditions during the growing season. Further investigation is needed to include the climate database for sophisticate crop evaluation with SAMS database.
Comparison of harvesting time between VRA and non-VRA application site.

Conclusions
This paper conducted the feasibility study of VRA by using SAMS as smart agriculture Japan model. Results obtained from 2-years in-situ tests consist of: (1) 442,261 dataset of topsoil depth and soil fertility value as created by using SRT, (2) 67,000 dataset of N status was obtained by using SFAS. From this study almost 20% of fertilizer application could be reduced during the SAMS adoption. In conclusion, this study suggests that a new paradigm should be created for the precision agriculture technology extension. Considering that the precision agriculture market is still benefit-driven, it offers a considerable opportunity for skilled people with knowledge and expertise in this field. When considering the extension of precision agricultural technology, authors think that it is important not to aim for improvement of yield and income, but to visualize points where farmers can feel intuitively, such as shortening harvest time or making field operations easier.
Acknowledgements
This project was supported by Council for Science, Technology and Innovation (CSTI), Cross-ministerial Strategic Innovation Promotion Program (SIP), ‘Technologies for creating next-generation agriculture, forestry and fisheries’ (funding agency: Bio-oriented Technology Research Advancement Institution).