


Introduction
Inter-ice-stream ridges and domes with in theWest Antarctic ice-stream system preserve a record of past ice-flow patterns that can contribute to an assessment of the current stability of the ice sheet. Interpreting the relict features, such as scars, flowlines and undulations, requires knowledge of their topography. The measure of the shape of the features, and their heights relative to surrounding features, can provide semiquantitative information on their age, the nature of the ice dynamics that formed them, and the mechanisms that support their shape today.
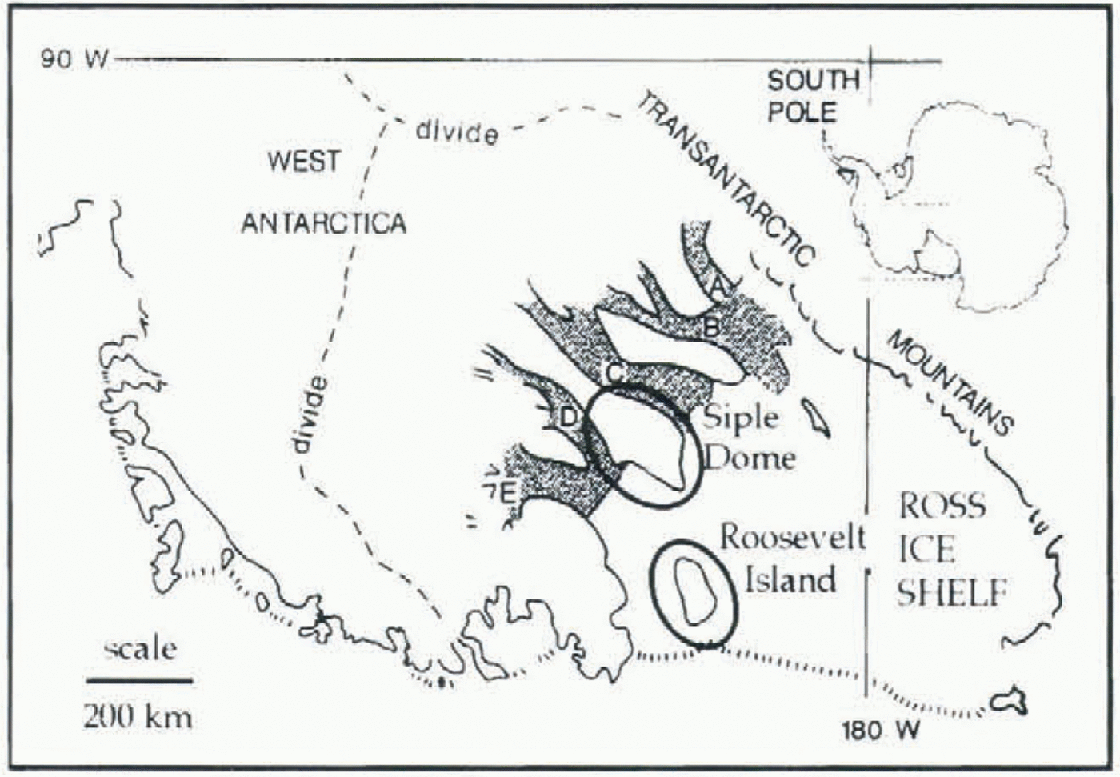
Siple Dome (81.6° S, 148° W) and Roosevelt Island (79.4° S, 162°W) (Fig. 1) are of particular importance to determining the current mass balance of the West Antarctic ice sheet (WAIS). At the Last Glaciol Maximum (LGM; ~20 000 BP), the WAIS was grounded out to near the continental-shelf edge, and both Roosevelt Island and Siple Dome, if I hey existed as separate ice domes, were surrounded by grounded ice (e.g. Shipp and Anderson, 1994; Eicht and others, 1996). Since the LGM, the ice has retreated; but it is unclear whether that retreat was abrupt and quickly brought the ice sheet to a stable configuration, or whether the retreat and its commensurate effect on sea level continues today. As developed below, the relative elevations of active and relict features on the sides of the domes may contribute to resolving this question.
Prior to this study, the best elevation maps of these areas were based on satellite radar altimetry, which provided digital elevation models (DEMs) having a grid spacing of 5-10 km and a spatial resolution of approximately 20-30 km. At this resolution, the scar features and relict ice-stream surfaces are not detected (fig. 2c and d). Fieldwork at Siple Dome in 1994 and 1996, and at Roosevelt Island in the 1960s, provided several accurate topographic profiles of both domes (Clapp, 1965; Thomas and others, 1980; Jacobel and others, 1996; Seambos and Nereson, in press) using global positioning system (GPS) and optical leveling. However, these profiles are of limited extent. This paper uses a third source of elevation information, satellite imagery, to attempt to refine and extend the existing data. The technique is based on photoclinometry, or “shape from shading”, where image pixel brightness values are translated into a quantitative measure of the mean surface slope over the area covered by the pixel. As seen in figure 2a and b, satellite images (in this case, advanced very high-resolution radiometer (AVHRR) images) reveal much detail in the ice surface, beyond the detail visible in the altimetry DEMs (fig. 2c and d).
Location map of Siple Dome and Roosevelt Island.
AVHRR imagery and satellite-radar-altimetry DEMs of Roosevelt Island and Siple Dome. (a,b) AVHRR channel 1 images of Roosevelt Island and the northern flank of Siple Dome. Boxes in (a) show location of Landsat subscenes shown in figure 5c and d. (c,d) Radar-allimetry DEMs of Roosevelt Island and Siple Dome shown in shaded relief illuminated from the same direction as the respective images. For scale, the scenes are all 170 km along the vertical edge and north is up. The images are m polar stereographic projection with center longitudes of 160° wfor Roosevelt Island and 145° Wfor Siple Dome.

Overview of the Data Sources and Methods
The radar-altimetry-bascd DEM used here was generated by J. Bamber (Bamber and Bindschadler, 1997), based on a compilation of recent elevation profiles acquired by the European remote-sensing satellite, ERS-1. The DEM is slope-corrected using an iterative process which determines a most likely surface that generates the observed profiles. The datum for the altimetry DEM is the OSU91A geoid. Absolute errors for the DEM are cited as less than ± 10 m in the areas of the domes (much lower over the ice-shelf areas); however, this error refers to the measurement of a spatially smoothed surface. At a given point in the DEM, the elevation represents the average height of an area of ~20 km diameter. The actual elevation at that point may differ by as much as 100 m if there are abrupt slope breaks with in the spatially averaged area. This error can be largely removed by using images to correct or enhance the radar altimetry through photoclinometry.
Traditional survey techniques used for the Roosevelt Island elevation profiles, using theodolite and stadia rod, are described in Clapp (1965). GPS profiles at Siple Dome-were determined (in 1994 and 1996) by a differential kinematic method similar to that described in Hulbe and Whil-lans (1993). A base station of “known” location relative to the dome summit and a U.S. Geological Survey (USGS) GPS benchmark at McMurdo (determined using static GPS position measurements) was occupied with one GPS receiver, while a second receiver was towed over the surface. The towed receiver provides elevation and position measurements relative to the local base receiver every 10 50 m, depending on the towing speed (GPS fixes were recorded once every 15 seconds). Accuracy and repeatability of the measurements is 10-50 cm. All the GPS data are referenced to the World Geodetic System 1984 (WGS84) ellipsoid.
The photoclinometric technique we use is described in Seambos and Fahnestock (1998), and a closely related technique is described in Bindschadlcr and Vornbcrgcr (1994). The method combines two satellite images of an area with an existing DEM to generate an enhanced elevation map based on the brightness values of small features in the images. One image from each of the two pairs is shown in figure 2a and b. Two images, with solar azimuths close to 90° apart, are used to provide accurate absolute slope infor-mation (a single image can provide slope information only in its sunward direction). The images are selected to be as cloud-free and uniform in snow cover as possible. Both these attributes occur most often in early-spring images, when hoar development on the surface is rare (see Shuman and others, 1997) and the air over the ice sheet is relatively dry. The slope-to-image-brightness relationship, or “photometric function”, is determined by comparing the images with the existing low-resolution DEM. A best-fit relationship between the surface solar incidence angle and raw sensor brightness value (averaged to the same spatial scale as the DEM resolution) is determined. This relationship is well approximated by a linear fit since the ranges of solar incidence angle and sensor brightness value are relatively small over the subscenes. The relationship is then applied to unftltered versions of the images to provide topographic detail in the form of sunward slope maps. The unfiltered images show features smaller than the spatial resolution of the DEM, i.e. features at a scale of ~2 to 25 km. The two image-derived sunward slope maps are recombined into two absolute slope maps, in the image x and y directions, a step which requires the images to be very accurately co-registered. Co-registration of the two images is accomplished by finding the image registration vector for which the elevation closure of small loops through the absolute slope maps is closest to zero. This method provides registration to a sub-sensor-pixel accuracy. The images are resampled to 600 m ground-equivalent scale from the sensor pixel scale of ~1100 m prior to registration, to yield a more precise registration vector. Once the slopes are determined, they are converted to elevations and filtered (smoothed so that they are zero-mean at the spatial scale of the original DEM) to reduce noise in the elevation field.
The detail elevations are added to the original DEM to provide the enhanced elevation map. Since the technique relics on an accurate base DEM, only areas covered by existing radar altimetry DEMs may be enhanced. For this reason, only the portion of Siple Dome north of 81.5°S was mapped. Table 1 lists the images used and the coefficients of the slope-to-brightness function. As discussed in Seambos and Fahnestock (1998), the measurement error of the detail elevations is on the order of a few meters; however, any albedo variation or cloudiness with in the image can increase this error significantly. in the images selected for this study, these effects are small in magnitude. Crevassed surfaces also cause deviations from the true elevation, due to shadows; large areas of crevasses will appear as an erroneous step in topography. This is the case for some limited areas in the active margin oflce Stream D near the grounding line, and small patches within Ice Stream D. Springtime images reduce this effect, because many of the crevassed areas are still bridged with snow.
Comparisons of a profile derived from the enhanced Siple Dome DEM and a GPS elevation survey (profile C from Figs 3b and 4b) show that the technique tracks the small-scale surface features with reasonable accuracy. However, it should be noted that even the photoclinomctrically enhanced DEM is a spatially smoothed representation of the surface, with a smoothing scale of approximately 2 km (i.e. about two sensor pixels). The GPS profile has a smoothing scale of roughly 100 m along its track.
AVHRR images and photometric functions used for DEM enhancement

Morphology of the Domes, Ice Shelf and Scars
figures 3 and 4 show the new elevation data derived in this study. Both domes are essentially long biconvex ridges, close to an equilibrium Nye Yialov shape in profile, with slight asymmetry. Both domes have sharp breaks in slope across their crests. Summit heights are 621.3 ± 0.1 m for Siple Dome (GPS-determined; WGS84 ellipsoid datum) and 554 ± 5m for Roosevelt Island (determined from the image-enhanced DEM; OSU91A gcoid datum). The summit of Siple Dome is 81.6543° S, 148.81° w(GPS-determined); Roosevelt Island's summit is 79.39° S, 161.46 ° w(determined from the enhanced DEM; ~2 km accuracy). However, the Roosevelt Island ridge crest is nearly flat, and there is a second summit of 549 m very close to a previous estimate of the summit from surface traverse), called “Point Susan” (79.263°S, 162.29° W; Clapp, 1965). The previously estimated height at that point (using barometric altimetry and survey closure from floating ice of measured thickness) is 553-563 m.
Slope profiles for the two domes are shown in figure 4c, illustrating their slight asymmetry. At 10 km from the summit, mean slopes for Siple Dome are 0.006 and 0.007 for the south and north sides, respectively. Roosevelt Island is characterized by sleeper slopes, 0.010 on the west side and 0.017 on the east at 10 km from the summit. in both cases, the asymmetry in slope is associated with accumulation gradients across the domes, with the steeper slopes associated with higher accumulation. At Siple Dome, the ice-equivalent accumulation varies from 0.06 m a−1 on the south side to 0.11 ma−1 on the north (personal communication from K. Kreutz, 1997). Roosevelt Island has higher overall accumulation: 0.14 m a−1 on the west side, 0.18 m a−1 at the summit and 0.24 ma−1 on the east side (Thomas and others, 1980).
figure 4c also illustrates the abruptness of the slope change at the crests of both domes. The region of rapid slope change is roughly 1.5 km wide at Siple Dome, and 2.5 km at Roosevelt Island, although in the latter case the limit of the images to resolve the crest may increase the apparent width. As has been observed by several previous studies, the break in slope occurs within roughly 1-2 ice thicknesses. Ice thickness is 1009 ± 7 m at the summit of Siple Dome (Raymond and others, in press) and 815 m (no error cited) at Roosevelt Island's summit (Thomas and others, 1980). At Siple Dome, the slope break across the summit is aligned with a local upward doming of internal reflectors of the same width, determined by radar profiling (Raymond and others, in press). The upward doming, and the sharpness of the divide, is the result of the non-linear nature of flow for ice and the fact that the divide is a plane of near-symmetry (e.g. Raymond, 1983; Hvidberg, 1996). We expect that, given the similarity of Roosevelt Island's size, shape and slope profile to Siple Dome's, it too has an upward doming of its internal layers along its crest.
Photoclinometrically enhanced DEMs of Roosevelt Island (a) and the flank of Siple Dome north of 81.5° S (b). The mapped regions are identical to the areas of the satellite images in figure 2a and b, in the same projection. Scale is the same for both maps, approximately 1:1500 000. Shaded areas are regions where data are invalid due to clouds in the enhancement images or limits of radar altimetry coverage. Profiles Α-D are shown in Figure 4.

Ice-shelf and ice-stream areas near the domes are also mapped in the enhanced DEMs. A comparison of the shelf elevations with previous mapping by Bamber and Bentley (1994) shows a good general agreement in surface shape of the ice shelf, but with significant details added by the imagery. in particular, an unnamed, 12 m high, ice rise to the southwest of Roosevelt Island is shown, and the grounding-line shape of the ice plain of Ice Stream D (roughly equivalent to the 110 m contour in figure 3b) has a more irre-gular, flame-like front, as previous image-based mappings have suggested (Seambos and Bindschadler, 1991). in Ice Stream D, undulations are 10-30 m high, with some evidence for 2-5 m scale flowbands. As noted above, areas of extensive crevassing may show erroneous step-like topographic features in the photoclinometric mapping due to shadowing. Both domes have “aprons” extending past their grounding lines into the surrounding shelf, i.e. areas where shelf elevation rises above the more distant ice shelf by 30- 50 m. This may be due to increased ice-shelf thickness immediately adjacent to the domes, or to residual problems with slope corrections in the radar altimetry near the domes. The field-surveyed elevation profiles at Roosevelt Island (Clapp, 1965) also show an apron on the west-side ice shelf, interpreted in that study as thicker shelf ice there.
The scar features in the two study areas are long curvilinear troughs or steps in the ice surface on the flanks of both domes. They are, in general, higher than the current level of adjacent rapid-ice-flow surfaces by a substantial fraction of the total dome relief For Siple Dome the scar is 50-100 m above the adjacent surface of Ice Stream D. Towards its upstream end, the scar appears perched on the flank of Siple Dome, while downstream the scar and adjacent area is topographically distinct from the dome (Figs 3b and 4b). For Roosevelt Island, the scar features are 150-250 m above the Ross Ice Shelf at the upstream end. All the scars are high at their upstream end and intersect ice shelves at their downstream end. However, in the case of the western scar of Roosevelt Island, the scar is highest just downstream from the apex of the two scars. Landsat images of the scars (Fig. 5; Jacobel and others, 1996) reveal subtle changes in surface morphology on the downslope sides of all the scars, with structures suggestive of flowbands parallel to the scars, and, at Roosevelt Island, subtle undulations on the lower portion of the dome. To varying degrees, there is a break in the regional dome slope across the scars. This is most pronounced along profile C in Figures 3b and 4b, and across the southeast scar of Roosevelt Island.
Elevation and slope profiles of the two domes, (a) A comparison of the overall shapes of Siple Dome (top) and Roosevelt Island (lower two). (b) Profiles across the northernflank of Siple Dome. Note that the two lower profiles are both of the “C” track from figure 3b. (c) Surface slope profiles for the two domes across their summits. (d) Elevation profiles for the scars, with regional slope removed. The profiles are offset vertically at 10 m intervals -fit clarity.

The cross-sectional shape of the scars varies somewhat among them, and along the length of any one scar. in the case of Roosevelt Island, the scar profiles are difficult to discern (Figs 3a and 4a, bottom) because of the steep gradient of the dome. To enhance the structure of the scars, as distinct from the dome morphology, in figure 4d we have plotted the photoclinometric elevations with the radar-altimetry DEM removed. This plot shows just the high-frequency spatial details of the scars that are added by the images, and reveals that the scars are 1 -4 km wide, 4-10 m anomalies in the dome surface topography. The shapes of the anomalies range from a simple groove (western Roosevelt scar) to a more complicated scries of parallel ridges and troughs (Siple Dome scar).
Drawdown in the WAIS vs Ice-Dome Growth
The scar feature on Siple Dome and its associated surface morphology has been noted in satellite images previously, and was interpreted as a possible former ice-stream margin, with an adjacent former ice-stream trunk (e.g. Bindschadler and Vornbergcr, 1990; Seambos and Bindschadler, 19911 More recently, this scar was profiled using ice-penetrating radar along part of the figure 3b profile C path. A pattern of disrupted reflectors directly beneath the scar was observed, with rumpled reflectors on the downslope side. The rumpled, or folded, nature of the reflectors is very similar to the patterns observed in other radar profiles of Ice Streams C and Β Jacobel and others, 1993), supporting the interpretation that the area is a relict shear margin and former ice stream : “Siple Ice Stream"; Jacobel and others, 1996). The depth to the disrupted layering beneath the scaryields an estimate of the maximum period since shut-down of 400-600 years (earlier estimates by Jacobel and others (1996) of 1300 years are probably too high; personal communication from T. Gades, 1997). The similarity of the surface features revealed in the AVHRR and Landsat images suggests that the Roosevelt Island features may be former ice-stream margins as well. Casassa andjezek (1991) expressed a contrasting view that the scars and lower sections of the dome re prese n ted a change in bed slope or bed geology; however, this was based on AVHRR image data only, without the supporting morphological evidence from Landsat, and they made their assessment before the nature of the very similar feature on Siple Dome was determined.
Landsat images of the (a) southeast and (b) southwest flanks of Roosevelt Island (areas shown as boxes in figure 2a), scar features and undulating surface downhill from the scars. The Landsat image was acquired on 17 January 1987 (Path 30, Row 117; USGS scene id LT5030117008701710).

If the scar features are surface remnants of former shear margins, they must persist long after active shearing stops. Gudmundsson and others (1998) show that once surface undulations are produced by streaming flow, short-wavelength features (<~1 ice thickness) decay away very slowly, even in the absence of fast ice flow. The scar features as mapped here would appear to be near the upper limit in scale to be preserved, since ice thicknesses in the mapped areas are ~ 1000 m. Another possibility is that thermal or stiffness (i.e. fabric) properties of the ice associated with the former shear margins are sufficiently different from the surrounding dome ice to affect the local ice flow and deformation, creating a ripple in the surface topography. in this case, the scar would persist as long as the mechanical properties of the marginal ice remained distinct.
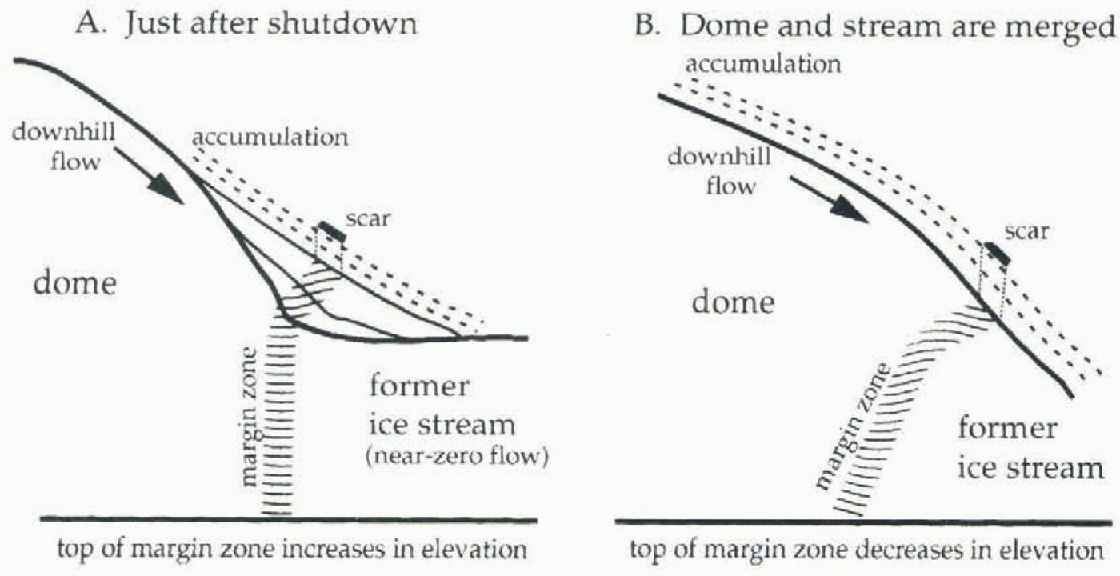
Given our interpretation, the scars represent a window into the past for the ice sheet. Scar features hold clues to the past ice flow and mass balance of the WAIS in their present location and elevation. However, interpreting past ice-sheet thickness and configuration from the scars is complex. Clearly, the scars are not at the same elevation as at the time of ice-stream shut-down, since the slope of the scar profiles along flow is in places much steeper than current ice streams, and in some areas the scar elevations increase in the presumed former downstream direction. To unravel the events which may control scar elevation changes after shutdown, we consider an idealized case based loosely on Siple Dome at profile D (Fig. 6).
After rapid flow ceases on an ice stream, the evolution of the margin scar and the adjacent dome is controlled by two processes. Given an equilibrium state prior to shut-down, ice flowing off the dome in the period just before shut-down is carried away by the ice stream. Immediately after an idealized shut-down, the ice-stream flow is zero, and the mass balance in the margin area is strongly positive. Since no mass is removed by ice-stream flow, the region must accommodate the outflow of that side of the dome largely by vertical thickening. This results in a rapid rise in elevation on both sides of the former margin, elevating the margin scar and extending the topographic perimeter of the dome. However, as the slope across the former margin increases, the ice begins to flow downhill as part of the newly extended dome, lowering the elevation of the scar. Superimposed on these processes is accumulation, which buries the former shear margin but elevates the surface expression of the scar. Depending on the time since ilie shutdown event, and the relative magnitudes of uplift, downhill (low and accumulation, the scars maybe presently higher or lower than the elevation of their parent shear margins at the time of shut-down. Development of a numeric model to investigate the events cartooned in Figure 6 is currently under way.
Cartoon of ice-sheet surface, shape and margin scar evolution in the vicinity of a former ice stream.
If the scars surrounding Siple Dome and Roosevelt Island are shown to be derived from margins that were higher than the present fast-flow surfaces, it implies that the WAIS was previously thicker and has recently thinned. An order-of-magnitudc estimate may be derived from the topography of profile D and the <f)00year estimate of the timing of the shut-down of the Siple Ice Stream. Profile D indicates the scar is approximately 70 m above Ice Stream D. If the present location of the scar is close to its elevation at the time of shut-down (i.e. the combination of uplift, downhill flow and accumulation roughly cancel), a drawdown rate of at least 12 cm a−1 for actively flowing areas is implied.
However, it is quite plausible that most uplift of the scar relative to Ice Stream D is due to changes in dome topography in response to shut-down and other events. Nereson and others (1998a, b) have shown that ice-dome topography can respond quickly to changes in boundary conditions (on the order of 500 800 years for Siple Dome), resulting in uplift at their margins and migration of the dome crest. Radar profiles of Siple Dome indicate that the crest is indeed migrating towards the Siple Ice Stream scar, due to either accumulation changes, thinning of Ice Stream C, shut-down of Siple Ice Stream or (most likely) a combination of all of these.
This behavior of Siple Dome is still not inconsistent with a gradual, uniform drawdown of the ice sheet which leaves the divide position largely unchanged in the process. Superimposed on this uniform drawdown may be the specific response to changing activity of the bounding Ice streams and possible growth of the ice dome.
Summary
Photoclinometrically enhanced DEMs and GPS data show that the shapes of Siple Dome and Roosevelt Island are similar, with dome flank slope correlated with accumulation rate. Further, the photoclinometric enhancement of the radar altimetry adds detail in a quantitative way from the images into the DEM, which can, in the future, facilitate modelling studies of more subtle dynamic features of the domes, ice streams and ice shelves.
Scars and other features on the flanks of Roosevelt Island appear to be former ice-stream margins and trunks, judging from their morphological features and their simi-lariiy to features on Siple Dome. Radar profiling at Siple Dome confirmed that a similar group of surface features represents a former ice stream and shear margin. Similar measurements are planned for the 1997-98 field season for the Roosevelt Island scars by other investigators.
It is not immediately clear whether the present position of the scar features is indicative of general WAIS thinning, the growth of local ice domes into failed ice-stream trunks, or both. The important point is that these propositions emerge directly from the detailed topography described in this paper which has not been previously available. The detailed topography of these and other WAIS scar features could reveal a wealth of information about the history and recent evolution of the WAIS.
Acknowledgements
This work was supported by U.S. National Science Foundation grants OPP-9418723, OPP-9419223 and OPP-9317007. AVHRR images were made available by the U.S. National Snow and Ice Data Center. The Landsat image was acquired under NASA grant NAG-5-3438 from Eros Data Center.



