Implications
This study conducted over 2 years showed a higher average daily gain of grazing goats pastured together with cattle compared with goats reared alone, considering either the individual gain or gain per hectare. This increased gain occurred irrespective of the infection status of the goats. Moreover, the biomass was lower in mixed grazing conditions, likely due to improved use of the pasture by goats that were mixed with cattle. These results suggest that integrated grazing could be employed as an alternative agroecological strategy to increase performance per hectare and control residual biomass. In addition, this strategy represents an important alternative to reduce the use of anthelmintics.
Introduction
Mixed grazing of sheep and cattle has most often been studied in tropical areas (Zeeman et al., Reference Zeeman, Marais and Coetsee1983; Marshall et al., Reference Marshall, Gebrelul, Gray and Ghebreiyessus2012; d’Alexis et al., Reference d’Alexis, Sauvant and Boval2013). These studies met various principles established for the design of agroecological systems of animal production (Altieri et al., 2012; Dumont et al., Reference Dumont, Fortun-Lamothe, Jouven, Thomas and Tichit2013). The goals of management strategies are to improve animal health, decrease pollution, enhance the diversity of species within animal production systems and preserve the biological diversity of the agroecosystem. Some studies utilizing intensive systems have shown that mixed grazing of cattle and sheep leads to an increase in meat production per hectare and reduce parasitic infestations (d’Alexis et al., Reference d’Alexis, Sauvant and Boval2013). However, few studies have investigated mixed systems involving goats even though over 90% of goats are used for meat in developing countries, which is affected mainly by gastrointestinal nematodes (GIN), a major pathology in the tropics (Over et al., Reference Over, Jansen and Olm1992; Hoste and Torres-Acosta, Reference Hoste and Torres-Acosta2011). Mixed grazing could be an efficient strategy for goat production in the pasture, as their vulnerability to GIN and selective behaviour is superior to those of sheep (Goetsch et al., Reference Goetsch, Gipson, Askar and Puchala2010; Rutter, Reference Rutter2010). Complementarity in the feeding behaviour of associated species is expected to lead to a better quality of available biomass and thus promote animal production (Abaye et al., Reference Abaye, Allen and Fontenot1994; Sehested et al., Reference Sehested, Soegaard, Danielsen, Roepstorff and Monrad2004). The behaviour of grazing cows is known to differ from that of goats, which are very selective (Fraser et al., Reference Fraser, Vale and Dhanoa2013). As a result, in a system of cattle mixed with goats, goats have greater access to edible regions of the sward.
Increased growth performance in mixed grazing systems has been mainly attributed to a decrease in the parasite population (Torres-Acosta and Hoste, Reference Torres-Acosta and Hoste2008). Thus, mixed grazing could represent an integrated approach to obviate the frequent use of anthelmintics used to control GIN, which has led to increased drug resistance (Jackson and Coop, Reference Jackson and Coop2000). Mixed grazing is a diluting strategy that is used to decontaminate pastures and is based on the relatively high specificity of many nematode species to one host (Waller, Reference Waller2006). Thus, the infectivity of a pasture is reduced when a second, less-sensitive host is permitted to graze simultaneously (Marley et al., Reference Marley, Fraser, Davies, Rees, Vale and Forbes2006).
The present study was designed to appraise the effects of a continuous mixed grazing system on the performance of goats infected with Haemonchus contortus, which is one of the main digestive parasites of small ruminants, causing up to 40% of the mortality of preweaned kids (Aumont et al., Reference Aumont, Pouillot, Simon, Hostache, Varo and Barre1997b). Within the mixed grazing system, we also aimed to isolate the specific contributions of complementary behaviour and of the dilution of parasites between the two species. Therefore, we simultaneously tested the mixed grazing of goats with and without infection. The effects on the gain of heifers and biomass of herbage were also evaluated.
Material and methods
The study was conducted in 2008 and 2009 at the experimental station of the National Agronomic Research Institute (INRA) in Guadeloupe, French West Indies, (16°16′N, 61°30′W). All of the animal care, handling techniques and procedures, and the license for experimental infection and blood sampling were approved by the INRA and compliant with authorized conditions for experimentation on live animals established by the French Ministry of Agriculture.
Experimental design
The effects of four grazing treatments were compared: control goats grazing alone and infected with H. contortus (CI); infected goats grazing together with heifers (MI); non-infected control goats grazing alone (CnI); non-infected goats grazing together with heifers (MnI), using a 2×2 factorial design.
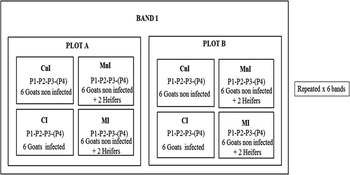
The four treatments were tested in four groups of goats grazing continuously on four subplots (each group comprising six goats and, in MI and MnI only, two heifers each). This pattern was replicated in space with four other groups of goats on a second set of four subplots (Figure 1). In total, eight groups of goats were evaluated simultaneously with monthly measurements over 3 to 4 months. In addition, the experimental protocol (eight groups in two sets of plots) was replicated in time with six successive cohorts of animals (i.e. bands 1 to 6). AA together, the experiments lasted 2 years. The effects of the four treatments were evaluated based on the individual performance of the goats and heifers and the forage characteristics per band.
Experimental design. CnI=control non-infected; MnI=mixed non-infected; CI=control infected; MI=mixed infected; P1=1st measurement period; P2=2nd measurement period; P3=3rd measurement period; P4=4th measurement period, which took place only for bands 2 and 6.

Sward management
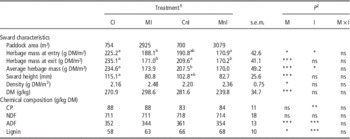
The two sets of plots (placed 0.3 km apart, based on a Digitaria decumbens sward) each were divided into four subplots for simultaneous grazing by animals assigned to the four treatments. The individual plot sizes were 754, 2925, 700 and 3079 m² for CI, MI, CnI and MnI, respectively (Table 1).
Herbage production and chemical composition for mixed and control treatments by infected and non-infected animals

DM=dry matter.
a,bValues with different superscripts within infected or non-infected treatments differ (i.e. P<0.05).
1 Treatment: CI=control infected; MI=mixed infected; CnI=control non-infected; MnI=mixed non-infected.
2 Statistical significance: ns is P>0.05, *P<0.05; **P<0.01; ***P<0.001; M=mixed effect; I=infection effect; M×I=interaction of mixed and infection effect.
Before beginning the experiment, to homogenize the regrowth of grass, all of the subplots were mown with a machine (BCS S.p.A., Milan, Italy) set at a mowing height of 3 cm. Each subplot received 28 kg of mineral nitrogen per hectare (the goal was to achieve 1 kg/ha per day of regrowth using a mineral fertilizer consisting of 27N, 9P, 18K; SCIC Guadeloupe, Mahault Bay, Guadeloupe, FWI France). From the end of the second band (i.e. 7 months after the beginning of the experiment), to the end of the experiment, regrowth homogenization was required due to increasing biomass. Consequently, grass was cut at the end of each band, and a new band of animals was established after 28 days of grass regrowth.
Animal management
Animals were managed to maintain the same stocking rate at the beginning of each band (i.e. every 3 to 4 months).
To compare the different species, the stocking rate of goats and cattle on the same plots was based on their metabolic BW, with respect to food intake which when expressed in metabolic BW, can be directly related to energy requirements, whatever the species (Illius and Gordon, Reference Illius and Gordon1992; Clauss et al., Reference Clauss, Schwarm, Ortmann, Streich and Hummel2007). For all of the subplots assessed, the stocking rate was based on the metabolic weight up to the second band. However, compared with the first band, the grass in the second band was higher (i.e. after 7 months of experimentation). Therefore, based on previous similar observations, we decided to control the stocking rate based on the BW from band 3 to the last band (Table 2).
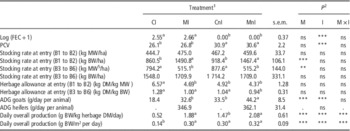
Effect of grazing management on performance of goats (infected and non-infected) and heifers, and herbage utilization

FEC=faecal egg count; PCV=packed cell volume; MW=metabolic weight; DM=dry matter; ADG=average daily gain.
a,bValues with different superscripts within infected or non-infected treatments differ (i.e. P<0.05).
1 Treatment: CI=control infected; MI=mixed infected; CnI=control non-infected; MnI=mixed non-infected.
2 Statistical significance: ns is P>0.05, **P<0.01; ***P<0.001; M=mixed effect; I=infection effect; M×I=interaction of mixed and infection effect.
The study was completed for each band consisting of a new cohort of growing female Creole goats between 7 and 11 months of age. Each cohort corresponded to a new wave of reproduction, which occurs every 4 months in Creole goats at the experimental station. The average initial BW was 15±2.6 kg. The groups were normalized based on the BW of the goats as well as on the genetic index of resistance to GIN (Mandonnet et al., Reference Mandonnet, Aumont, Fleury, Arquet, Varo, Gruner, Bouix and Khang2001). Before establishing the animals on the subplots, all of the goats were dosed orally with netobimin (75 µl/kg BW; Hapadex®, Schering-Plough Animal Health, Morris Avenue Union, NJ, USA) and levamisole (0.40 g per 10 kg BW; Polystrongle®, Coophavet, Ancenis, France) to remove all GIN. The parasite level was verified 3 days later, after dosing.
Goats that were subjected to CnI and MnI treatments were sprayed thoroughly with moxidectin (300 µg/kg BW; Cydectine®, Fort Dodge Veterinaria S.A., Tours, France) every 4 weeks during the grazing period.
Goats that were subjected to treatments CI and MI were infected orally 21 days before the beginning of the experiment with a single dose of H. contortus (500 infective larvae (L3)/kg BW). Larvae were obtained from Creole goats that had been infected orally with H. contortus (500 L3/kg BW). At the beginning of the egg-excretion stage, 21 days after oral infection with larvae, faeces were collected in collection bags that had been fitted to each goat. The faeces samples were then incubated for 1 week to allow the release of infective larvae from eggs. The larvae were then extracted using a 24-h Baerman device (Urquhart et al., Reference Urquhart, Armour, Duncan, Dunn and Jennings1988). The concentration 4 to 6-week-old L3 was evaluated by counting them under a microscope (ct×40). Individual infective doses were prepared in tap water, and the quantity of L3 was determined for each infected goat (i.e. treatments CI and MI) according to its BW.
For the mixed treatments (MI and MnI), eight growing female Creole heifers aged 9 to 11 months were selected after weaning and maintained at set stocking rates on the subplots for 3 bands. When the BW was too high to maintain an equivalent stocking rate, another group of eight weaned heifers replaced the first one for the last three bands. The initial BW at the beginning of the experiment was 170±20.0 kg. Each group of two heifers per mixed treatment was selected based on their BW to balance the stocking rate.
Before introducing them to the subplots, the heifers were dosed orally with netobimin (7.5 ml/100 kg BW; Hapadex®, Schering-Plough Animal Health, Morris Avenue Union, NJ, USA) and levamisole (0.40 g/10 kg BW; Polystrongle®, Coophavet) to remove all bovine GIN. This treatment was performed every 3 to 4 months during the experiment at the beginning of each band.
Sward variables
Sward variables were measured on the four subplots used to assess the four treatments and for two sets of plots (i.e. replication in space). Therefore, for each of the eight subplots, 10 and 6 sites were measured for the subplots grazed by animals MI and MnI and by animals CI and CnI, respectively. From one measurement period to the next, measurements were collected on the same 10 or 6 sites per subplot as identified by fence markings.
The sward height was measured monthly at each site per subplot with a rising-plate meter (Michell, Reference Michell1982). The herbage mass was measured in parallel by cutting the herbage to ground level inside a 0.40×0.20 m quadrant (0.08 m²) using handheld electrical shears. One 200 g sample of fresh forage was collected at each site. The bulk density of the herbage was calculated by dividing its mass by the sward height.
Chemical characterization was completed for ground samples collected from the pasture. Dry matter (DM), N and ash were analysed according to Association of Official Analytical Chemists (AOAC) methods 935.29, 990.03 and 942.05 (1997), respectively. NDF, ADF and lignin contents were determined using an Ankom 2000 Fiber Analyzer (Ankom Technology, Macedon, NY, USA). NDF was determined according to the procedure described by Van Soest et al. (Reference Van Soest, Robertson and Lewis1991) without heat-stable α-amylase for the sodium sulphite, as tropical forages are known to have low levels of CP content and starch (Leng, Reference Leng1990). ADF was evaluated by boiling the samples in an acid solution and then filtering them (973.18, AOAC, 1997). Lignin was determined using the direct sulphuric acid method (Robertson and Van Soest, Reference Robertson and Van Soest1981). The same samples were used to determine amounts of NDF, ADF and lignin; NDF and ADF included residual ash. The organic matter, NDF, ADF, lignin and CP content of forage samples are expressed according to the DM.
Animal variables
The level of goat infection was assessed by measuring the faecal egg count (FEC). Faecal samples (5 g) were collected directly from the rectum of each goat and stored at 4°C until analysis. All of the samples were analysed using a modified McMaster method (Aumont et al., Reference Aumont, Pouillot and Mandonnet1997a) with a lower limit of detection of ~30 eggs/g of fresh faeces. The health of the goats was evaluated by measuring the packed cell volume (PCV), which is the proportion of blood that is red blood cells. The normal PCV percentage for goats is ~30%; values ⩽20% indicates anaemia. The PCV was measured using the capillary microhaematocrit method by centrifugation for 5 min at 15 300×g in capillary tubes (Bull et al., Reference Bull, Fujimoto, Houwen, Klee, van Hove and van Assendelft2003).
Goats and heifers were weighed at the beginning of the experiment in the morning and then monthly thereafter at the same time of day. The stocking rate was calculated by adding the BW (kg), expressed as either the metabolic weight or BW of all goats in each control treatment or as all goats and heifers in each mixed treatment, divided by the paddock area (in ha). The herbage allowance (kg DM/kg BW) was calculated by multiplying the biomass (kg DM/ha) by the paddock area (ha) and then dividing by the total BW gain (kg). The average daily BW gain (ADG, g/day) was calculated for goats and heifers by individual linear regression over time with the interaction of time×animal. The data from each animal were used for each of the six bands from the time of plot entry to exit after 3 or 4 months, depending on the bands. Thus, a total of 288 goats and 48 heifers were assessed. The daily overall production was calculated by adding the ADG for goats and heifers, as measured per plot, and expressing the results per hectare. The daily overall production was calculated per kg of DM and per day by dividing the overall ADG by the herbage mass (i.e. in g BW/kg herbage DM per day); this expression give an idea of feed efficiency ratio. The daily overall production was also calculated per m² by dividing the overall ADG by the area of the paddock (i.e. in g BW/m² per day), representing the land use efficiency
Statistical analyses
All of the sward variables, both measured (i.e. sward height, herbage mass, chemical components) and calculated (i.e. density), were averaged per period (3 or 4), subplot (4), set of plots (2) and band (6) to generate means for statistical analyses (n=144, Table 1). Animal production variables were averaged first by the animal and then by the period, similarly to the sward variables. Data relating to FEC/g faeces were normalized using a logarithmic transformation.
Sward and animal variables were analysed by a linear mixed model of variance using the MIXED procedure in SAS (2010). The model included fixed effects of mixed management (M), infection (I), band (B), plot per band (P) and their interactions, as defined below for the sward variables:
 $$\eqalign{y_{{ijkl}} =\mu {\plus}{\rm M}_{i} {\plus}{\rm I}_{j} {\plus}{\rm B}_{k} {\plus}{\rm P}_{l} \left( {{\rm B}_{k} } \right){\plus}\left( {{\rm M}_{i} {\times}{\rm I}_{j} } \right){\plus}\left( {{\rm M}_{i} {\rm \times B}_{k} } \right) \cr \quad{\plus}\left( {{\rm I}_{j} {\times}{\rm B}_{k} } \right){\plus}{\rm Per}_{{\rm m}} {\plus}e_{{ijkl}} ,$$
where y ijkl is the observed values in mixed management M, considering the infection status I and the band B and plot P at each band; μ the mean value for all observations; M i the fixed effect of mixed treatment (2 levels); I j the fixed effect of infection (2 levels); B k the fixed effect of the band (6 bands), and P=fixed effect of the plot (A or B) nested per band; M i ×I j the interaction between mixed treatment and Infection treatment; M i ×B k the interaction between mixed treatment and band; I j ×B k the interaction between infection treatment and band; Perm the repeated effect of the intra-band measurement period.
The same model was applied for the animal variables, excluding repeated subject, which was evaluated as the animal examined during each period of measurement in comparison to the period of measurement (Perm) for the sward.
All of the interactions were tested for all variables and included in the model if they were statistically significant. P<0.05 and trends at P<0.10 were indicative of significant effects. Herbage mass, herbage allowance at entry, stocking rate and ADG were analysed using the GLM procedure in SAS.
Results
Characteristics of the herbage
The herbage mass at entry of each band was the same for MI, CnI and MnI; higher values were obtained for the CI treatments (Table 1). The herbage mass at exit was higher for the control treatments than for the mixed treatments (P<0.001). The average herbage mass and sward heights were higher for the controls than for the mixed treatments for both infected and non-infected goats (P<0.001), but the extent of the increase was greater for infected groups. The DM, CP, NDF and ADF levels of the herbage were similar for all treatments. The interaction M×I was not significant for any variables. For all variables, there was an effect of the band. The plot effect was not significant for any of the tested variables (Table 1).
Animal performance
The FEC and PCV illustrated the infection status of the goats that underwent experimental infestation (CI and MI treatments). Infected goats had higher FEC values and lower PCV values, presenting a level between 20% and 30% compared with non-infected goats (Table 2). The stocking rate at entry expressed in MW per hectare was well balanced for the four treatments for bands 1 and 2, and this stocking rate expressed in kg of BW/ha was well balanced for bands 3 to 6 (Table 2). The herbage allowance at entry of each band, expressed in kg of DM per kg of MW (bands 1 and 2) and in kg of DM per kg of BW (bands 3 to 6), was similar among MI, MnI and CnI but was higher for CI (Table 2).
There was a higher average daily gain (ADG) of goats in mixed treatments irrespective of their infection status (Table 2). Treatment MnI showed better performance than the other three treatments, and treatments MI and CnI were not significantly different. There was no significant interaction between infection and grazing management with respect to goat performance. The BW gains of heifers did not differ significantly among the mixed treatment, infected (MI) and non-infected (MnI) groups (Table 2).
The daily overall production (g BW/kg herbage DM/day), considering both goats and heifers (Table 2), was greater in mixed treatment (MI and MnI) compared with control conditions (CI and CnI). In the treatments with infection, the effect of mixed grazing was significant. In non-infected treatments, mixed grazing again resulted in better daily production. The daily overall production considering the grazed area (BW g/m² per day) evolved with the gain (expressed per kg of grass DM (BW g/kg grass DM/day)) and was higher for the mixed treatment, irrespective of the infection status of the goats (Table 2). The MI treatment was not significantly different from the MnI or CnI treatment.
Discussion
Utility of mixed grazing on goat performance
In the present study, mixed grazing was found to be advantageous with respect to individual goat performance, consistent with previous studies investigating mixing grazing systems of sheep and cattle. Fraser et al. (Reference Fraser, Davies, Vale, Hirst and Wright2007) reported a gain in lamb performance of 30% more than the control for 3 consecutive years as a result of mixed grazing with cattle. Hamilton and Bath (Reference Hamilton and Bath1970) and Nolan and Connolly (Reference Nolan and Connolly1989) observed a gain of 10% of BW compared with the control for mixed grazing.
In treatments MI and CI, without anthelmintic treatments and with animal infection similar to standard farm conditions, there was an increase in weight gain from 18 g/day in goats reared alone (CI) to 32 g/day in goats reared with heifers (MI) without anthelmintic treatments. This gain of 32 g/day was similar to values reported for goats in other grazing systems that were treated with anthelmintics (e.g. 37 g/day, as reported by Alexandre et al., Reference Alexandre, Aumont, Fleury, Coppry, Mulciba and Nepos1997), which suggests that mixed grazing may provide a substitute for anthelmintic treatments. In mixed pastures, while the ADG for goats was higher than the control, the herbage mass was lower. Of the initial mass of grass available at the beginning of the experiment, the herbage mass after 3 to 4 months of continuous grazing was lower in mixed subplots than in those grazed by goats alone (Table 1). This result was not predicted based on the classical positive relationship between livestock performance and grass present (Humphreys, Reference Humphreys1991), raising questions about the validity of general relationships that have been established between animal production and biomass in different grazing situations. Indeed, this relationship depends on how the biomass is used by the grazing animals. Thus, careful consideration of the type of biomass present, the amount available to the animals (expressed either per kg of MW or kg of BW) and the amount actually exploited for their performance, is essential to better anticipate animal production in the pasture (Abaye et al., Reference Abaye, Allen and Fontenot1994; Allen et al., Reference Allen, Batello, Berretta, Hodgson, Kothmann, Li, McLvor, Milne, Morris, Peeters and Sanderson2011). In the present study, mixed grazing had no effect on any chemical composition of the grass. For example, the CP content was the same regardless of the management of the plots (mixed or control). These results may best be explained by a better use of the grass as a result of mixed grazing and improved complementary feeding between the two species (Goetsch et al., Reference Goetsch, Gipson, Askar and Puchala2010), resulting in a decreased residual biomass.
Effect of mixed grazing on parasitism and pasture use
There was an increase in ADG in mixed grazing conditions compared with the control in infected (32 v. 18 g/day) and non-infected (44 v. 33 g/day) goats, with no interaction observed between mixing and infection. The level of infection measured using FEC and PCV revealed a difference between non-infected and infected goats but no additional differences due to mixed grazing. Despite a number of infective doses similar to previous studies (Lacroux et al., Reference Lacroux, Nguyen, Andreoletti, Prevot, Grisez, Bergeaud, Gruner, Brunel, Francoise, Dorchies and Jacquiet2006; Bambou et al., Reference Bambou, de la Chevrotiere, Varo, Arquet, Kooyman and Mandonnet2008), the FEC was 1300 egg/g and the PCV was 26%. Typical signs of H. contortus infection, such as anorexia, prostration, apathy and anaemia, were rarely observed in infected goats in mixed conditions, and therefore, the infection was characterized as subclinical. The animals in the present study were infected with nematodes similarly to the goats in the experiments reported by Bambou et al. (Reference Bambou, de la Chevrotiere, Varo, Arquet, Kooyman and Mandonnet2008), who also observed subclinical infection with the same dose of infective larvae.
We expected a greater impact of mixed grazing on BW gain in infected compared with non-infected goats, due to an improved use of the pasture and additional effects related to the diluting hypothesis. As previously confirmed, dilution can occur with two animal species because there is no possibility of H. contortus cross-infection between Creole goats and heifers (d’Alexis et al., Reference d’Alexis, Mahieu, Jackson and Boval2012). However, the mowing plots between each band starting from the second band to control biomass may have slowed development of Haemonchus larvae in the pasture, limiting natural infection. Under these conditions, the dilution of larvae between goats and heifers would not have occurred in a short period of continuous grazing of 3 to 4 months. However, during continuous grazing, no effects of mixed grazing on FEC were detected in Creole goats (Blaes et al., Reference Blaes, Mandonnet, Arquet and Mahieu2010). The work of Mahieu et al. (Mahieu, M., INRA, Guadeloupe; unpublished data) clearly showed that mixed grazing decreased FEC after 5 months of rotational grazing. It is possible that the type of paddock management, continuous or rotating, interacts with the impact of mixed grazing on pasture infection.
Unlike the impact of mixed grazing on parasitism, the effects of better pasture use on intake have been rarely explored. Brelin (Reference Brelin1979) found a reduced number of worm eggs under mixed grazing conditions but suggested that the overall worm numbers were too low to have influenced production. Rather, they concluded that better utilization of the pasture due to the complementary grazing activities of sheep and cattle was the main reason for improved animal performance under mixed grazing conditions. According to Nolan and Connolly (Reference Nolan and Connolly1977), the value of mixed pasture conditions may be linked to better use of pastures due to the complementarity of the animal species, notably via consumption by sheep but not by cattle of grass surrounding dung.
Few studies investigating mixed grazing have focused on measuring pasture use through frequent measurements of parameters such as herbage mass, sward height and chemical composition. However, additional measurements would have been useful for understanding how animal species exploit grass differently when mixed on the same plot, as complementarity may be horizontal (i.e. some areas are avoided by cattle but grazed by small species) or vertical (i.e. there is a variable depth of grazing). Heifers may graze at the top of the sward, thereby improving the accessibility of grass to goats and allow them to take larger bites compared with goats reared alone. A greater influence on DM intake of bite size as compared with bite rate in goats was observed by Dziba et al. (Reference Dziba, Scogings, Gordon and Raats2003). Celaya et al. (Reference Celaya, Olivan, Ferreira, Martinez, Garcia and Osoro2007) demonstrated that with a lower sward height, ewes and goats were still able to increase their BW while the BW of cows decreased. These results demonstrated that different species have variable reactions to the sward structure.
Effect of mixed grazing on overall animal performance
In addition to the gains in BW observed for goats in our mixed system, there was also a gain for heifers as well as the added advantage of goat protection against predator attack. The ADG of heifers was similar to that demonstrated in previous studies (400 g/day) investigating Creole and Nellore steers in the pasture (Boval et al., Reference Boval, Cruz, Ledet, Coppry and Archimede2002; Ribeiro et al., Reference Ribeiro, Hernandez, Zanella, Mizubuti, da Silva and Reeves2008; Agastin et al., Reference Agastin, Farant, Bocage, Godard and Naves2010). However, the ADG of Creole cattle has been shown to reach 800 g/day in the absence of supplementation (Mahieu and Naves, Reference Mahieu and Naves2008; do Canto et al., Reference do Canto, Bona Filho, de Moraes, Hoeschl and Gasparino2009).
Considering the overall gain of BW per subplot for goats and heifers, the gain per kg of DM was higher than that in the control systems. This result highlights the utility of mixed grazing, which was augmented under these conditions compared with goats that were fed alone and treated (CnI). In the latter system, breeders will have to consider the cost and impact on the soil of the required anthelmintics. The best gain was obtained in a mixed system in which goats were treated with anthelmintics (2 g of BW/kg DM). For all treatments, costs were much higher for non-infected conditions treated with moxidectin than for infected ones. Parasite control on conventional farms is based mostly on use of anthelmintics, and Svensson et al. (2000) has shown mixed grazing would be advantageous for farmers who already have sheep or goats reared with cattle on the same farm.
Mixed grazing systems appear to be of high utility for farmers, resulting in better performance (both individual and overall) of goats and cattle together with a reduced use of anthelmintics. However, to be effective, farmers must manage the system correctly. Management according to BW or MW does not lead to the same herbage mass evolution with time (Table 2), which may explain the differences observed between the first band and the others. What basis should be used to manage grazing in relation to BW? Based on the MW, the herbage mass was not controlled in the first two bands. With homogenization and a stocking rate based on BW for bands 3 to 6, the herbage mass was more balanced between the first and last period of each band. Other parameters must be considered for mixed systems, such as the management of the two ‘stocks’ of animals, the ratio between species, and the long-term management of herbage.
Conclusions
Mixing of animal species in the pasture provides the potential to achieve higher individual production for goats as well as better overall production of BW per ha or kg of dry biomass, as assessed by summing the BW gains of goats and cattle. In the present study, we did not observe an effect of mixed grazing on the dilution of parasites in the pasture; however, this grazing strategy may obviate the use of anthelmintics and result in greater animal performance. The measured BW gain was associated with a lower biomass available to the animals, which suggested a more efficient use of the pasture. Thus, of the two components accounting for the observed impact of mixed grazing (i.e. feeding and health), feeding appeared to be more important, consistently with previous studies. Further experiments on pasture feeding are needed to gain a better understanding of how the gain in BW occurs in mixed pastures.
Acknowledgements
The authors gratefully acknowledge the staff of the Duclos and Gardel experimental unit for managing the experiment. The authors are particularly grateful to Alain Farant for selecting the heifers and to Rémy Arquet for managing the goats. They also thank the Duclos lab for performing the analyses and the field staff for their technical assistance: Caroline Anaïs, Frederic Pommier, Pierre-Justin Dumoulin, and Fernand Labirin. This work was partly supported by the European Union (FSE), La Région Guadeloupe and the ‘Animal Change’ project http://www.animalchange.eu/.