INTRODUCTION
The Mid-Atlantic Ridge (MAR) separates the eastern and the western basins of the North Atlantic along the majority of its length, but there is flow of deep water between the basins through the Charlie–Gibbs Fracture Zone (CGFZ) (Lackschewitz et al., Reference Lackschewitz, Endler, Genrke, Wallrabe-Adams and Thiede1996). This major transform fault, where the ridge is offset 5° (east–west), lies at approximately 52°N. The average depth of the CGFZ is 3000 m, but it reaches ~4500 m in its deepest part (Felley et al., Reference Felley, Vecchione and Wilson2008). This fracture is the deepest connection between the north-east and north-west Atlantic basins, it is also the only deep-sea connection between faunas of the two basins. It was already shown that the CGFZ is important in biogeographical schemes of the North Atlantic since there is a pronounced change in benthic fauna in the bathyal on the MAR just south of the CGFZ (Mironov & Gebruk, Reference Mironov, Gebruk, Mironov, Gebruk and Southward2006; Gebruk et al., Reference Gebruk, Budaeva and King2010). The CGFZ fauna is also essential for understanding of ecology of mid-ocean ecosystems.
Samples of benthic fauna from fracture zone areas cannot be obtained using conventional tools such as trawls, dredges or corers. The present study is based on direct observations and video records made on three dives of the submersibles ‘Mir-1’ and ‘Mir-2’ in July 2003 during the 49th cruise of the RV ‘Akademik Mstislav Keldysh’. These dives were the first in the CGFZ.
This study was a part of the ‘Census of Marine Life’ project MAR-ECO: Patterns and process of the ecosystems of the northern Mid-Atlantic (www.mar-eco.no). The major goal of MAR-ECO (spanning from 2001 to 2010) was ‘to understand the biodiversity, distribution patterns, abundance and trophic relationships of pelagic, benthopelagic and epibenthic macrofauna inhabiting the mid-oceanic North Atlantic, from Iceland to the Azores’ (Bergstad & Godø, Reference Bergstad and Godø2003; Bergstad et al., Reference Bergstad, Falkenhaug, Astthorsson, Byrkjedal, Gebruk, Piatkowski, Priede, Santos, Vecchione, Lorance and Gordon2008).
Based on video records and observations from the same Mir dives in the CGFZ, Vinogradov (Reference Vinogradov2005) presented data on vertical distribution of macroplankton, and Felley et al. (Reference Felley, Vecchione and Wilson2008) described small-scale distribution of demersal nekton and selected species of megafauna. In the present study we analysed epibenthic megafauna from two contrasting habitats—rocky outcrops and steep slopes on the northern wall and soft sediments in the abyssal depression at the bottom of the CGFZ. We examine the species composition, describe frequency of species occurrence on the fracture wall and its base and evaluate density of megafauna in the depression at the fracture zone bottom.
MATERIALS AND METHODS
Dives of the submersibles ‘Mir-1’ and ‘Mir-2’ were conducted in the north-western part of the CGFZ in June 2003 during the 49th cruise of the RV ‘Akademik Mstislav Keldysh’ of the Russian Academy of Sciences. Two double dives (using both submersibles) were performed. In the present study we use data from three dives (1/326, 1/339 and 2/340) (details in Table 1).
Dive details.

Both submersibles were equipped with high-resolution (720 lines) pan-and-tilt video cameras, mounted in frontal area in the upper part of submersible at the height of approximately 2.1 m. During video transects on the even seafloor cameras were looking almost vertically down.
Video transects were performed at a speed of approximately 0.3 m s−1. The altitude was 1 m (controlled by submersible echosounder) on the dive 2/340, but it could not be kept constant on the dives 1/326 and 1/339 due to extremely rough topography. The number of transects selected for the analysis from each dive depended on quality of the video records. The quality in turn was sensitive to conditions of the dive (speed and altitude) that were influenced by seafloor topography, currents and technical aspects. The speed and the altitude of submersible were slightly different between transects but constant within each transect.
For dives 1/326 and 1/339 we estimated frequency of occurrence (FO) of megafauna species (or morphospecies) over transect time. In all 13 transects from these dives were used for the analysis, varying in duration from 5 minutes to 47 minutes. For comparative analysis, occurrences from each transect were standardized to 5 minute units.
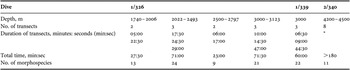
For dive 1/326 (up the slope of the fracture zone) we analysed occurrences of megafauna separately for the following depth horizons: <2000 m, 2000–2500 m, 2500–3000 m and >3000 m. The exact depth ranges of transects that fell into these horizons were 1740–2006 m, 2022–2493 m, 2500–2797 m and 3123–3000 m. The number of transects per depth zone was 2–3 (Table 2). Total duration of transects for each depth zone varied from 23 minutes (for 2500–2797 m depths) to 71 minutes 30 seconds (for 3000–3123 m) (Table 2).
Number and duration of transects and number of morphospecies for different depth ranges.

*On dive 2/340 the length of transects was used (Table 4).
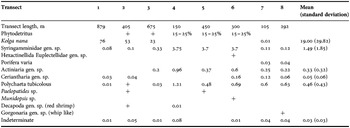
For dive 2/340 (bottom of 4500 m deep depression) we estimated abundance of megafauna (number of individuals per m2) separately for eight transects varying in length from 105 m to 879 m. The area of the bottom surveyed was estimated based on the transect length and the width of the field of view. The width of the field of view of the pan-and-tilt ‘Mir’ camera at a given altitude is a standard (~2 m at 1 m altitude) and can be taken from ‘Mir’ protocols. Benthic megafauna (animals large enough to be recognized on video records, usually of a size >1 cm) were identified and counted. Also we estimated approximately (visually) areal coverage in percentage of phytodetritus.
Calculations and analyses were carried out with SYSTAT 11 (2006).
RESULTS
The upslope dive (‘Mir-1’ dive 1/326)
On this dive along the northern wall of the fracture the submersible ‘Mir-1’ rose up the slope from 3100 m to almost 1700 m, traversing a variety of topographic features such as flattened areas of soft sediment, sediment clad slope with rocky outcropps and talus, rocky slopes and steep rocky cliffs.
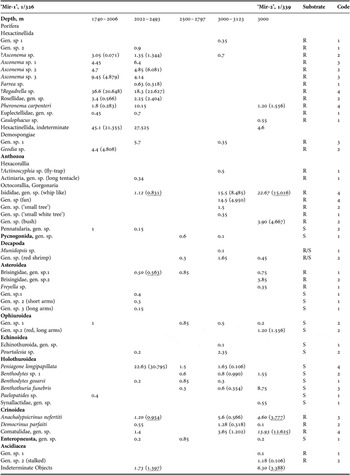
At the base of the slope (3000–3123 m) prevailing substrates were soft sediments, talus and rocky outcrops. In total 21 morphospecies were observed in this depth zone at three transects with the total observation time of 71 minutes 30 seconds (Table 2). Highest frequencies of occurrence (FO) per 5 minutes at this depth were shown by two forms of gorgonian corals: whip-like (family Isididae) (mean FO 15.5) and fan-like (14.5), and the stalked crinoid Anachalypsicrinus nefertiti Clark, 1973 (5.6). All of these forms were attached to hard substrate. Also common were unstalked comatulid crinoids (3.65) usually associated with gorgonian corals and recorded up to five per gorgonian. Soft sediment fauna showed lower frequencies: the highest FO was in pourtalesiid echinoid (2.35), partly buried into sediment and leaving characteristic winding trails. Though, the pourtalesiid was observed only at one transect among three at this depth. FO >1 on soft sediment were shown by Acanthephyra-type shrimp and the elasipodid holothurian Peniagone longipapillata Gebruk, Reference Gebruk2008 also recorded at only one of the transects.
In the depth layer between 2500 m and 3000 m the variety of substrates was the same as in the previous zone. At this depth we recorded only nine morphospecies of megafauna at two transects over a vertical range of 297 m (total time of observation 23 minutes). One characteristic feature of this depth zone was a high frequency of the holothurian P. longipapillata: mean FO 22.63, with the maximum 44.4 per 5 minutes at one of the two transects. All other forms at this depth showed FO < 1 and were seen only at one of the transects. Not a single attached form was observed at this depth, and the only form occurring on hard substrate was a brisingid sea star.
At depths between 2500 m and 2000 m prevailing substrates were rocky outcrops, vertical cliffs and steep partly sedimented slope with talus. In total 24 morphospecies of megafauna were observed in this depth zone at three transects over a vertical range of 471 m with the total time of observation 71 minutes. Most frequent at this depth were different species of sponges, primarily Hexactinellida but also Demospongiae. Beside sponges, mean frequencies of >1 appeared among the crinoid A. nefertiti (1.2) and the whip-like gorgonian corals (1.12), both recorded at all three transects. At one of the transects frequency 1.4 was shown by comatulid crinoids associated with gorgonians. Soft sediment forms at this depth supported holothurians, a pourtalesiid echinoid, asteroids, a sea pen and an enteropneust, all with FO <1.
In the shallowest depth zone, between 2000 m and 1500 m, prevailing substrates included rocky cliffs and outcrops with rare sedimented terraces and rare sedimented slope with talus. We recorded at this depth 13 morphospecies at two transects over a vertical range of 266 m, total time of observation 27 minutes 30 seconds. The prevalence of sponges in this depth zone was even more pronounced: 11 morphospecies out of 13 recorded were sponges, 10 among them Hexactinellida. Highest mean frequencies were shown by ?Regadrella sp. (36.6), one species of Asconema (9.45) and the demospongian Geodia sp. (4.4). Two other morphospecies apart from sponges included a sea pen and an ophiuroid each with FO 1.
The dive along 3000 m isobath (‘Mir-2’ dive 1/339)
On this dive the submersible ‘Mir-2’ travelled along the 3000 m isobath at the base of the fracture zone slope. The topography along the dive track was very rugged, substrates included rocky outcrops and cliffs mixed with sediment pockets and terrains. The variety of megafauna in this environment included 20 morphospecies, total time of observation 60 minutes. Majority of species (13; 65%) were associated with hard substrates (Table 3). On hard substrates whip gorgonian corals (family Isididae) were the most common: mean FO 22.67 based on three transects. Associated with whip gorgonians, comatulid crinoids also were observed frequently (mean FO 13.93). Common forms included the stalked crinoid Anachalypsicrinus nefertiti, Acanella-type gorgonians and brisingid sea stars. On soft sediments most frequently observed was the synallactid holothurian Benthothuria funebris Perrier R, 1898 (8.75). Frequencies of >1 were recorded for the holothurians Peniagone longipapillata and Benthodytes sp., and also a species of ophiuroid.
Frequency of occurrence (FO) of megafauna on video transects. For morphospecies recorded at more than one transect, means with standard deviation in parentheses are given. Underlined values are based on records at three transects.

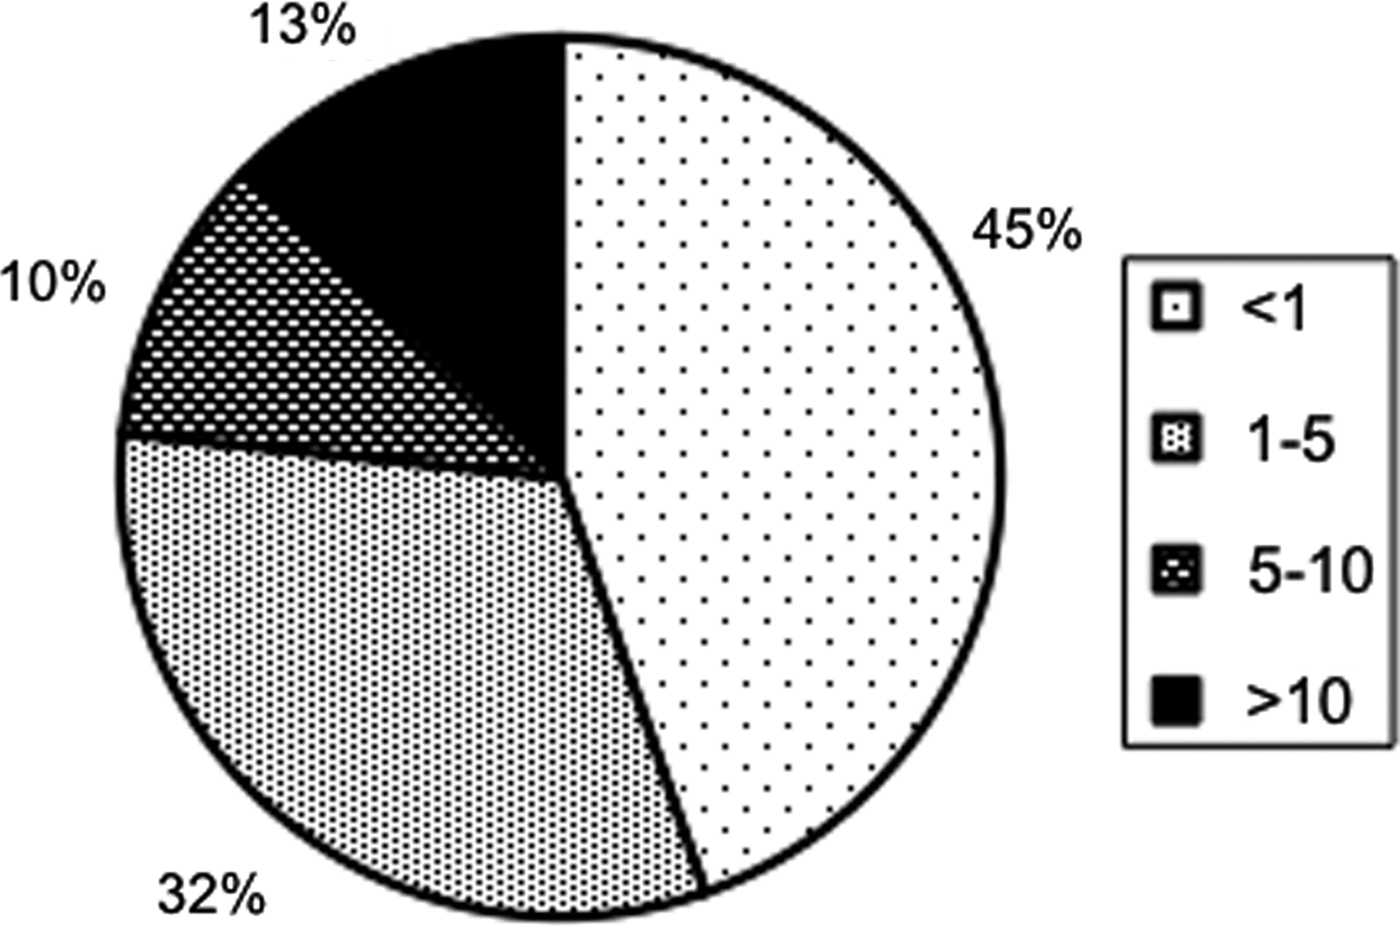
Substrate: R, rocks; S, soft sediment. Code: 1, FO <1; 2, FO 1–5; 3, FO 5–10; 4, FO >10 (see also Figure 3).
Compared to observations made on the vertical transect on dive 1/326 in the depth zone 3000–3123 m, on the dive along the 3000 m isobath we recorded more morphospecies of hard substrate fauna: ascidians (two species) and brisingid sea stars (three species) were observed only on the horizontal transect (dive 1/339). At the same time soft sediment echinoids were observed only on the vertical transect (dive 1/326). Overall nine morphospecies were common between these two transects, representing 43% and 45% of morphospecies observed on dive 1/326 and dive 1/339, respectively. One of the most frequent forms at the base of the wall on the vertical transect, a fan-like gorgonian (mean FO 14.50), was not recorded on the horizontal dive pointing at patchiness in distribution of common forms in the rocky environment on the ridge.
The abyssal dive (‘Mir-2’ dive 2/340)
On this dive the submersible ‘Mir-2’ travelled at 4200–4500 m. The total list of megafauna revealed over three hours of records included 11 morphospecipes. Nine of them were soft sediment dwellers and two attached to the hard substrate (glass sponges and a gorgonian coral) (Table 4).
Abundance of megafauna (ind. m2) in the abyssal depression (dive 2/340). + indicates presence/single occurrences; % for phytodetritus – area coverage.

Bioturbation of the sediment was very pronounced. Common tracks included spirals left by Enteropneusta and star-shaped prints left by echiurans. Mounds and holes of various size of unknown origin were also numerous.
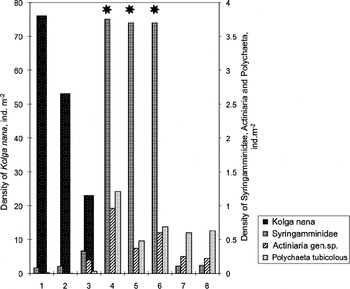
Table 4 shows the density of megafauna (number of individuals per m2) at eight video transects on this dive. A prominent feature in the depression was a phytodetrital material distinguished as a green–brown fluff on the seafloor. Estimated visually, the phytodetritus formed patches covering from 15 to 25% of the seafloor. At this density it was present over 20 minutes of the transect time (transects 4, 5 and 6 in Table 4, Figure 1).
Abundance of selected taxa on transects on the dive 2/340. Stars designate transects with areal coverage of phytodetritus 15–25%.

The megafauna was different in areas with and without the phytodetritus on the sediment. At the bottom of a depression with no phytodetritus we recorded a very high density of the small elpidiid holothurian, Kolga nana (Théel, 1879): 76 individuals per m2 (ind. m2) (Figure 1). The density declined, first to 53 ind. m2 and then to 23 ind. m2. Kalga nana disappeared suddenly when patches of phytodetritus appeared. In the area with abundant phytodetritus occurred a sharp rise in density of monotholamus foraminiferans of the family Syringamminidae: from 0.33 ind. m2 to 3.7 ind. m2. The density of polychaete tubes and anemones also significantly increased (from 0.03 ind. m2 to 1.21 ind. m2 and from 0.2 ind. m2 to 0.96 ind. m2, respectively).
The phytodetritus disappeared at the base of depression slope and this was followed by a sharp decline in density of Syringamminidae from 3.7 ind. m2 to 0.11 ind. m2 and some increase in density of polychaete tubes: from 0.48 ind. m2 to 0.69 ind. m2 (Figure 1).
DISCUSSION
First data on megafauna of the Charlie–Gibbs Fracture Zone on the Mid-Atlantic Ridge has been received using manned submersibles. On three ‘Mir-1’ and ‘Mir-2’ dives, a total of 47 morphospecies were recorded. Although this number is not high, it should be noted that a number of species seen on video records of the seafloor usually is less than that revealed by trawling in the same area (Galkin & Moskalev, Reference Galkin and Moskalev1990). There is no trawl data from the CGFZ area available for comparison. Gebruk et al. (Reference Gebruk, Budaeva and King2010) reported 102 epibenthos species from the nearby area—the southern tip of the Reykjanes Ridge, based on four otter-trawl catches in this region at depths from 1600 to 3060 m by the ‘G.O. Sars’ MAR-ECO expedition in 2004.
Among the 47 recorded morphospecies, only six were identified to the species level: the hexactinellid sponge Pheronema carpenteri (Thomson, 1869), the holothurians Benthothuria funebris, Benthodytes gosarsi Gebruk, Reference Gebruk2008 and Peniagone longipapillata, and the crionoids Anachalypsicrinus nefertiti and Democrinus parfaiti Perrier, 1883. Most of these species are common in the North Atlantic. The two species of holothurians, B. gosarsi and P. longipaillata, have been described from the MAR and were thought to be endemic to the ridge (Gebruk, Reference Gebruk2008), but recently they were found on the European continental margin in the Whittard Canyon (Masson, Reference Masson2009).
Holothurians are known among most abundant forms at lower continental slope and abyssal plains. The synallactid, B. funebris, one of the most frequently observed in our records around 3000 m depth, is also rather abundant at slightly greater depths (~3500 m) at the slope base in the Porcupine Abyssal Plain in the north-east Atlantic (Billett, Reference Billett1991). At the same time the species P. longipapillata, most frequently observed in our data between 2500 m and 2800 m, is not common outside the MAR. In the Porcupine Seabight and Abyssal Plain areas, species of Peniagone were not reported at all (Billett, Reference Billett1991). In the Whittard Canyon area P. longipaillata was regularly seen but it was not among the most common forms (Masson, Reference Masson2009). Thus, our results indicate that the lower slope fauna on the MAR has some differences from the continental slope.
At depths between 1700 and 2500 m hexactinellid sponges were the most diverse and common. In deeper parts of the slope and its base, anthozoans (especially gorgonian corals) and echinoderms were more diverse and abundant. These results in general are consistent with data based on trawl catches for the MAR-ECO area north-west of CGFZ (Gebruk et al., Reference Gebruk, Budaeva and King2010). A similar pattern of megafauna distribution also was reported based on trawl catches for the Goban Spur slope between 49°N and 50°N (north-east Atlantic) (Lavaleye et al., Reference Lavaleye, Duineveld, Berghuis, Kok and Witbaard2002).
Among 47 morphospecies in our data, 29 forms were associated with hard substrates, 16 with soft sediments and two were mobile crustaceans with no certain affiliation to the substrate. The ratio of rock and soft sediment megafauna varied between depth zones (Table 3) depending on availability of these two types of substrate. The ratio of soft sediment fauna was lower between 1700 m and 2500 m compared to deeper parts of the slope and its base.
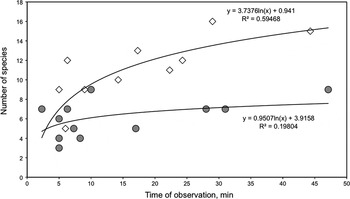
Hard substrates apparently provide more heterogeneous habitat compared to the soft sediment, hence the species diversity appeared higher on rocks. This also follows from data of Felley et al. (Reference Felley, Vecchione and Wilson2008). Our results also showed that the number of species per set observation time period was higher on rocks than on soft sediments, and the trend of growth of this number was steeper on hard rocks (Figure 2).
Number of species per observation time on rocks (diamonds) and soft sediment (circles).

One of the reasons for higher species diversity on rocks is the fact that some species are associated with others that provide them with a substrate: e.g. comatulid crinoids or ophiuroids living on gorgonian corals.
In terms of depth-related distribution, the highest number of species in our observations occurred at the horizon 2000–2500 m (24 morphospecies) and at the base of slope, between 3000 and 3100 m (Table 2). However, both total observation time and the number of transects were higher at these depths, so we cannot make here any firm conclusions. Also at depths between 2000 and 2500 m a large part of the slope was covered with sediment adding soft sediment species to the diverse fauna of hard rocks.
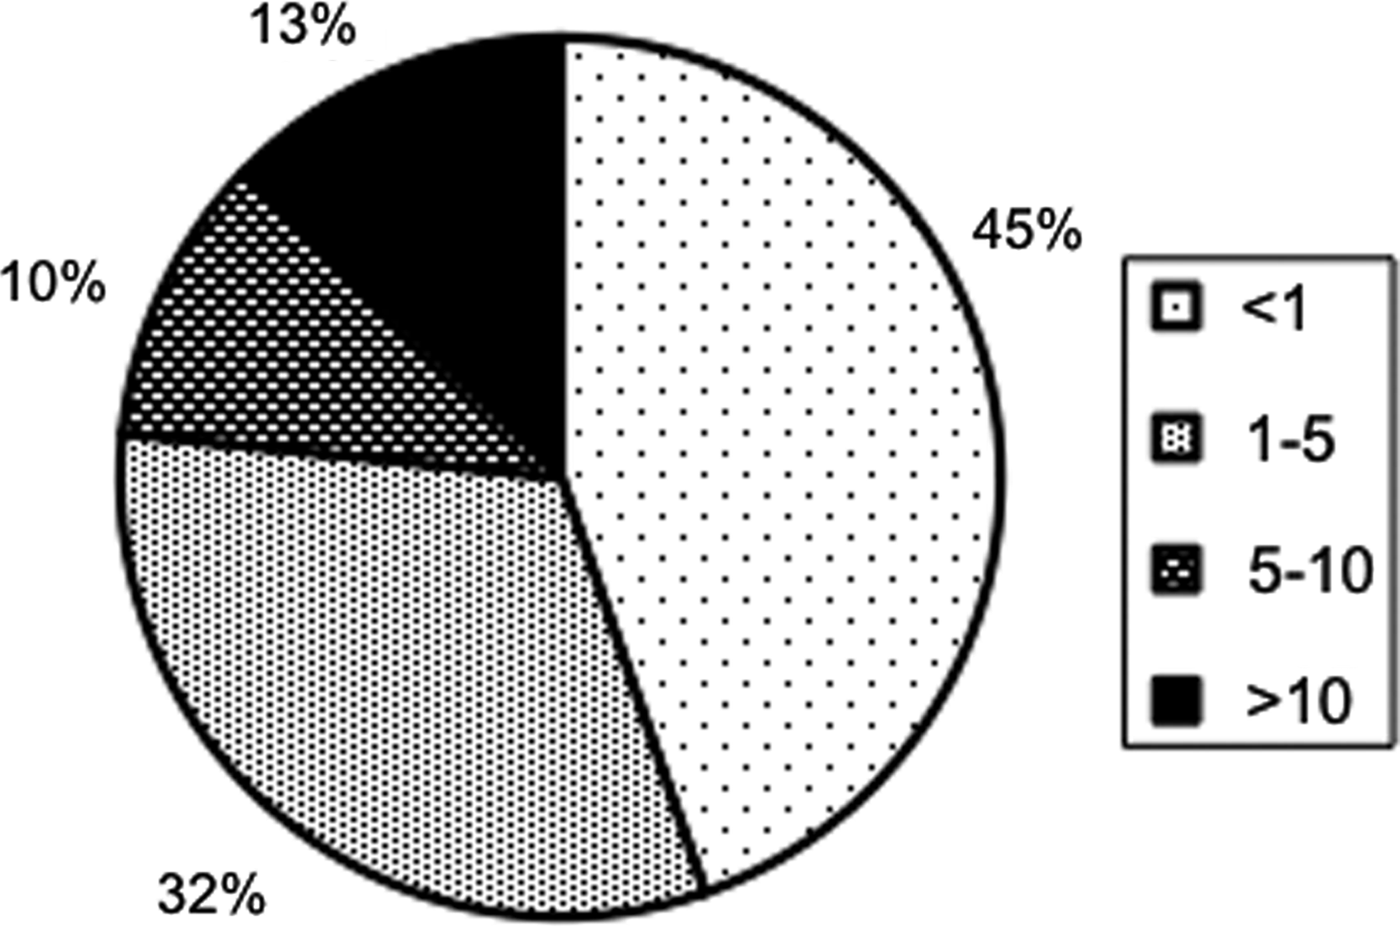
We have categorized observed morphospecies of megafauna into four groups by frequency of occurrence on a relative scale from <1 per 5 minutes, 1–5, 5–10, and >10. Our results show that almost half of the observed 47 species (44%) can be considered as ‘rare’ (with frequency <1) (Figure 3). In ecological studies, rare species may have a minor role in terms of abundance and biomass, but they may constitute the largest component of species richness (Cao et al., Reference Cao, Williams and Williams1998; McGill, Reference McGill2003; Cunningham et al., Reference Cunningham and Lindenmayer2005). Frequencies from 1–5 were shown by 15 morphospecies (32%) and from 5–10 by 5 (11%). Most frequently (>10) occurring were six forms (13%): sponges ?Regadrella sp. (Hexactinellida) and P. carpenteri (Demospongiae), whip-like (family Isididae) and fan-like gorgonian corals, the holothurian P. longipapillata and comatulid crinoids.
Percentage of species with different frequencies of occurrence per 5 minute intervals.
Aggregation of holothurians Kolga at the bottom of the abyssal depression is an important feature of the CGFZ. Billet & Hansen (Reference Billet and Hansen1982) observed in the Porcupine Seabight in the North Atlantic an abyssal aggregation of a species of Kolga identified as K. hyalina Danielssen & Koren, 1881. Re-examination of this species showed that it belongs to K. nana (Rogacheva, Reference Rogacheva2012), the same species that we recorded in the CGFZ. The abundance of K. nana at 4480 m depth in the CGFZ reached 76 ind. m2 and remained very high (from 23 to 76 ind. m2) over more than 43 minutes of a video transect, indicating large and very dense aggregation of this holothurian at the bottom of the depression.
In the data of Billet & Hansen (Reference Billet and Hansen1982), the maximum mean density of Kolga was 50 ind. m2 at 3700 m (with the peak density found in small patches 716 ind. m2), and 34 ind. m2 around 4000 m depth. These high densities were associated with the Gollum Channel System. This fact and our new data suggest that a high abundance of small elpidiid holothurians in the abyssal can be related to the seafloor depressions, even inside fracture zones in open mid-ocean areas. Rowe (Reference Rowe1971) regarded aggregations of elpidiid holothurians as a typical feature of canyons.
Billett & Hansen (1982) discussed two possible interpretations of holothurian aggregations: a synchronous reproductive strategy and a response to periodic accumulation of organic matter. Our data are not appropriate to test a reproductive hypothesis. At the same time, the ‘trophic’ interpretation of aggregations seems likely since depressions at the seafloor (especially canyons and trenches) are known to trap organic matter attracting deposit-feeding holothurians (review in Gebruk, Reference Gebruk1990; Billett, Reference Billett1991; Bluhm & Gebruk, Reference Bluhm and Gebruk1999).
However, according to our data, K. nana was avoiding patches of phytodetritus in the CGFZ abyssal depression. The size of food items used by holothurians depends on the size of holothurians (Roberts et al., Reference Roberts, Gebruk, Levin and Manshi2000). Kalga nana is a small-sized holothurian (<15 mm in length) that apparently feeds on detrital particles of a size smaller than clumps of fresh phytodetritus. In the abyssal of the North Atlantic the latter is often consumed by larger holothurians, such as Oneirophanta mutabilis Thiel, 1879 (Roberts et al., Reference Roberts, Gebruk, Levin and Manshi2000) and Amperima rosea (R. Perrier, 1896) (Billett et al., Reference Billett, Bett, Rice, Thurston, Galéron, Sibuet and Wolff2001).
In our data a clear positive correlation was found between the amount of phytodetritus on the seafloor and densities of the monotholamus foraminiferans of the family Syringamminidae. The type of Syringamminidae we observed resembles Galatheammina sp. reported from 4300 m depth in the Nazaré Canyon, off the coast of Portugal (Tyler et al., Reference Tyler, Amaro, Arzola, Cunha, de Stigter, Gooday, Huvenne, Ingels, Kiriakoulakis, Lastras, Masson, Oliveira, Pattenden, Vanreusel, Van Weering, Vitorino, Witte and Wolff2009). This single-celled protozoan grows to considerable size, often exceeding 10 cm in diameter. In the Nazaré Canyon it occurred in very high densities on the canyon floor enriched in organic matter.
High densities of Syringamminidae in our data apparently were related to seasonal flux of phytodetritus to the seafloor. Our observations were conducted in early June, a period of the year when in the North Atlantic phytodetritus appears on the seafloor in the abyssal as a result of a spring bloom (Bett et al., Reference Bett, Malzone, Narayanaswamy and Wigham2001; Lampitt et al., Reference Lampitt, Bett, Kiriakoulakis, Popova, Ragueneau, Vangriesheim and Wolff2001). Seasonal fluxes of organic matter have a strong effect on deep-sea benthic biota, manifested in increase of activity, reproduction, population size, etc. In the abyssal ocean areas this effect is most evident among smaller organisms, particularly bacteria and protozoans (Gooday, Reference Gooday2002). Our new data show that the effect of seasonal fluxes of phytodetritus on benthic biota is also pronounced in the abyssal mid-ocean ridge ecosystems.
This study was one of the first investigations of the CGFZ megafauna. It has revealed a unique set of dominant species in the lower bathyal in this area. We also demonstrated an important contribution to local species richness of species that can be considered as rare. We discovered high density of holothurians in the abyssal depression and found evidence of the effect of seasonal fluxes of phytodetritus on benthic biota at abyssal depths on the MAR. These observations may help in better understanding of the mid-ocean ridge ecosystems.
ACKNOWLEDGEMENTS
The authors are grateful to the pilots and team of the ‘Mir’ submersibles and to the crew of ‘Akademik Mstislav Keldysh’ on the 49th cruise for their dedication and help. The following experts (IORAN, Moscow, Russia) helped us with identification of megafauna on video records: O.E. Kamenskaya (Syringamminidae), A.N. Mironov (Crionoidea), T.N. Molodtsova (Anthozoa) and K.R. Tabachnik (Porifera). We are grateful to Bruce Marshall (Te Papa Museum, Wellington, New Zealand) for editing the style of English and to two anonymous referees for improving the manuscript. This work was an element of MAR-ECO, a field project of the Census of Marine Life programme. Partial support received from Minobrnauki of the Russian Federation, contract number 8664.