Implications
The applied objective of this study was to identify a pre-grazing herbage mass (HM) to optimise both animal and pasture productivity. This study found that maintaining low levels of pre-grazing HM (1150 kg DM/ha) reduces pasture growth rates and herbage accumulation without an increase in milk output per cow or per hectare. Adapting the practise of grazing low HM pastures is not a suitable management strategy to increase milk production from perennial ryegrass pastures.
Introduction
Optimising the intake of high quality pasture is a characteristic of successful pasture-based dairy systems. Grass dry matter (DM) production and utilisation are two key factors influencing the profitability of pasture-based dairy systems, accounting for ∼44% of the variation in total profit per hectare on Irish dairy farms (Shalloo, Reference Shalloo2009).
Pre-grazing herbage mass (HM) has been described as a major determinant of grass DM intake (GDMI) (Combellas and Hodgson, Reference Combellas and Hodgson1979), pasture quality (Hoogendoorn et al., Reference Hoogendoorn, Holmes and Chu1992) and milk production (Curran et al., Reference Curran, Delaby, Kennedy, Murphy, Boland and O’Donovan2010). Hodgson and Wilkinson (Reference Hodgson and Wilkinson1968) reported that lowering pre-grazing HM (7950 to 2180 kg DM/haFootnote 1 ) increased GDMI, because of higher leaf proportions and lower stem and dead proportions in the grazing horizon (O’Donovan and Delaby, Reference O’Donovan and Delaby2008). Lowering pre-grazing HM has also been shown to increase milk production (Curran et al., Reference Curran, Delaby, Kennedy, Murphy, Boland and O’Donovan2010; 2480 to 1650 kg DM/ha) because of the intake of higher quality herbage (Holmes et al., Reference Holmes, Hoogendoorn, Ryan and Chu1992; 5100 to 2900 kg DM/ha, above ground level). However, grazing very low HM pastures may reduce GDMI as intake per bite declines on low HM pastures and cows are unable to fully compensate for the reduction in intake rate by increasing grazing time (Hodgson, Reference Hodgson1985). This has been reported under continuously stocked grazing systems where GDMI and milk production were shown to decline with sward height (Gibb et al., Reference Gibb, Huckle, Nuthall and Rook1997). However, there is a paucity of information on the effects of grazing very low HM pastures (<1200 kg DM/ha) on the GDMI and milk production of rotationally grazed cows.
Timing of defoliation or grazing is critical – a balance must be struck between optimising pasture growth rate and herbage utilisation (Parsons and Chapman, Reference Parsons and Chapman2000). It is therefore important to have reliable criterion in place to assist farmers in determining when to graze. Such criterion may be based on day rotation length or the use of leaf stage, a plant-related indicator (Fulkerson and Donaghy, 2001). In Ireland, pre-grazing HM is used as a criterion for determining when to graze (O’Donovan et al., Reference O’Donovan, Kennedy and Hennessy2011), as visually assessing HM offers a precise, reliable (O’Donovan et al., Reference O’Donovan, Dillon, Rath and Stakelum2002) and quick assessment of a pasture. Therefore, it is important to investigate the effects of maintaining varying levels of pre-grazing HM on pasture output at a system level. Although numerous studies (Curran et al., Reference Curran, Delaby, Kennedy, Murphy, Boland and O’Donovan2010, 1650 to 2480 kg DM/ha; McEvoy et al., Reference McEvoy, O’Donovan, Kennedy, Murphy, Delaby and Boland2009, 1780 to 2360 kg DM/ha; Holmes et al., Reference Holmes, Hoogendoorn, Ryan and Chu1992, 5100 to 2900 kg DM/ha above ground level; O’Donovan and Delaby, Reference O’Donovan and Delaby2008 2365 to 3100 kg DM/ha above 5 cm; Wales et al., Reference Wales, Doyle, Stockdale and Dellow1999, 3100 to 4900 kg DM/ha above ground level) have investigated the impact of pre-grazing HM on the GDMI and milk production of grazing dairy cows there is little information available in the literature on the effect of maintaining varying levels of pre-grazing HM on pasture growth rates, grazing efficiency and pasture output.
It was hypothesised that maintaining a medium level of pre-grazing HM (1400 kg DM/ha) would optimise milk production per cow, pasture production and grazing efficiency. It was therefore, the objective of this study to examine the effect of maintaining three levels of pre-grazing HM on the milk production performance and GDMI of grazing dairy cows, pasture growth rates, grazing efficiency and pasture output.
Material and methods
The experiment was conducted at the Moorepark Animal & Grassland Research and Innovation Centre, Fermoy, Co. Cork, Ireland (50º09′N; 8º16′W) as a randomised block design from 13 April to 10 November 2009. The soil type was a free draining acid brown earth of sandy loam-to-loam texture. The pastures used consisted of predominately (∼80%) perennial ryegrass (Lolium perenne L.).
Sixty nine Holstein–Friesian dairy cows (21 primiparous and 48 multiparous) were selected and blocked using days in milk (mean 46; s.e.m. 3.1), lactation number (mean 2.6; s.e.m. 1.6), and the following data collected during the 3 weeks before application of the experimental treatments: milk yield (mean 26.1 kg; s.e.m. 0.6), body weight (BW; mean 496 kg; s.e.m. 9.4) and body condition score (BCS) (mean 2.7; s.e.m. 0.1 – scale 1 to 5). Animals were randomly assigned to one of three target pre-grazing HM treatments: 1150 – Low (L), 1400 – Medium (M) or 2000 kg DM/ha – High (H). HM was calculated above 4 cm. Before the application of experimental treatment all cows grazed pasture as a single herd from calving and were offered concentrate at a rate of 3 kg DM/cow daily.
Pasture management
A similar experimental area (farmlet) of 8.6 ha was available to each treatment, which was divided into 12 paddocks and permanently fenced. An additional two lactating dairy cows were added to each treatment, the measurements from which are not reported in this paper, therefore a global of stocking rate (SR) of 2.9 cows per ha was carried on each farmlet. The entire experimental area was grazed once during the pre-experimental period (23 February to 7 April) to a post-grazing sward height of 3.5 cm. During this period the differences in pre-grazing HM were created by varying the regrowth interval between the initial grazing and applying the experimental grazing treatment. The H pastures were grazed first (23 February to 7 March), followed by the M pastures (8 to 20 March) and finally the L pastures (21 March to 7 April), creating different regrowth intervals and thus differences in pre-grazing HM.
During the experimental period, the residency time in each paddock was determined by targeting a post-grazing sward height of 4 to 4.5 cm (O’Donovan et al., Reference O’Donovan, Kennedy and Hennessy2011). Paddocks were grazed in a rotational order and cows remained in their paddock until the target post-grazing residual was achieved. The use of break fences allowed a fresh allocation of pasture to be offered every 24 to 36 h. In order to achieve the target post-grazing residual, the area grazed daily or the effective grazing area differed between treatments. Daily herbage allowance (DHA) was calculated as a product of the area offered to the herd and the pre-grazing HM.
Grass supply on each farmlet was managed independently using the farm cover technique (O’Donovan, Reference O’Donovan2000). Briefly, pasture HM of each paddock was estimated weekly by visual assessment (O’Donovan et al., Reference O’Donovan, Dillon, Rath and Stakelum2002) to determine the average farm cover of each farmlet. Net herbage accumulation was calculated weekly from the increase in HM on un-grazed paddocks (MacDonald et al., Reference MacDonald, Penno, Lancaster and Roche2008). Grazing management decisions were based on the following rules: matching daily pasture consumption with pasture growth rate (O’Donovan and Dillon, Reference O'Donovan and Dillon1999), achieving a post-grazing residual of 4 to 4.5 cm, the pre-grazing HM targets of each treatment and the average farm cover targets of each treatment (H – 1000 kg DM/ha, M – 750 kg DM/ha, L – 600 kg DM/ha). Pasture surplus to grazing requirements was immediately conserved as round bale silage. In addition, planned silage events were also carried out; 25% of the area available to each treatment was closed for first and second cut silage harvests, conserved in the form of pit silage. Grass silage conserved from each treatment was kept separately for use by that treatment and was fed back with concentrates as required during periods of pasture deficit, that is, when pasture growth was insufficient to maintain the grazing management rules set in place. Concentrate supplementation was only used when a feed deficit occurred, because of a reduction in pasture growth for all treatments and at a similar rate per cow on those occasions. When feed deficits arose, for individual treatments, conserved forage produced within that treatment was used to supplement feed supply (McCarthy et al., Reference McCarthy, Pierce, Delaby, Brennan, Fleming and Horan2013). Pastures were not topped (mechanically conditioned) during the experiment. Nitrogen fertiliser was applied at a mean rate of 268 kg N/ha per annum for each treatment (Table 1).
Nitrogen (N) application on the low (1150 kg DM/ha), medium (1400 kg DM/ha) and high (2000 kg DM/ha) HM treatments

DM=dry matter; HM=herbage mass.
Pasture measurements
HM (>4 cm) was calculated by cutting four strips (1.2 m×10 m) with a motor Agria (Etesia UK Ltd, Warwick, UK) from each treatment area, three times per week. Ten grass height measurements were recorded before and after harvesting on each cut strip using a plate meter with a steel plate (diameter 355 mm and 3.2 kg/m2; Jenquip, Fielding, New Zealand). All mown herbage from each strip was collected, weighed and a sub-sample of ∼0.5 kg was taken. Of the initial 0.5 kg sub-sample, a further sub-sample of 0.1 kg fresh weight was dried for 16 h at 90°C for DM determination. Post-grazing HM was calculated by cutting one strip (1.2 m×20 m) from each treatment area directly after grazing three times per week as described above.
The pre-grazing and post-grazing HM from each paddock were used to calculate grazing efficiency as follows:
 $$\left( {{\rm pre\hbox-grazing}\,{\rm HM}-{\rm post\hbox-grazing}\,{\rm HM}} \right)/{\rm pre\hbox-grazing}\,{\rm HM}$$
Pre- and post-grazing pasture height was measured daily throughout the experimental period by recording ∼30 heights per treatment across the two diagonals of each grazing area using a plate meter as described above.
Herbage accumulation between grazings was calculated as the difference between pre-grazing HM and the post-grazing HM of the previous rotation. Total herbage accumulation was calculated as the sum of the herbage accumulated at each grazing for each treatment. Growth rate was calculated by dividing herbage accumulation between grazings by the grazing interval.
The following grazing outcomes were calculated by rotation for each treatment according to the methodology of Hoden et al. (Reference Hoden, Micol, Liénard, Muller and Peyraud1986).
Grazing days per hectare was calculated by rotation:
 $$\eqalign{{\rm grazing}\,{\rm days}\,{\rm per}\,{\rm hectare}= \cr {{{\rm number}\,{\rm of}\,{\rm cows}{\times}{\rm rotation}\,{\rm length}} \over {{\rm grazing}\,{\rm area}\,({\rm ha})\,{\rm used}\,{\rm during}\,{\rm rotation}}}$$
Grazing area used per rotation was used to calculate the mean grazing area used for each treatment:
 $$\eqalign{{\rm grazing}\,{\rm area} = \cr {{\mathop{\sum}{{\rm grazing}\,{\rm area}\,{\rm used}\,{\rm during}\,{\rm rotation}{\times}{\rm rotation}\,{\rm length}} } \over {{\rm experimental}\,{\rm duration}}}$$
Grazing days per hectare was summed for each treatment to calculate total grazing days per hectare. Using total grazing days per hectare, grazing SR was calculated:
 $${\rm grazing}\,{\rm SR}={{{\rm grazing}\,{\rm days}\,{\rm per}\,{\rm hectare}} \over {{\rm experimental}\,{\rm duration}}}$$
Milk production per hectare was also calculated for each treatment:
 $${\rm milk}\,{\rm production}\,{\rm per}\,{\rm hectare}={{{\rm total}\,{\rm milk}\,{\rm production}} \over {{\rm grazing}\,{\rm area}}}$$
Leaf, stem and dead proportions of each treatment (>4 cm) were recorded during GDMI measurement periods. Herbage was cut to ground level using hand shears and then separated into its lower and upper sward horizon (>4 and <4 cm). The upper sward horizon layer was manually separated into leaf blades, stem (true stem, pseudostem and flower heads if present) and dead material. Each fraction was dried for 16 h at 90°C for DM determination.
Animal measurements
Milking took place at 07.00 and 16.00 h daily. Individual milk yields (kg) were recorded at each milking, using electronic milk meters (Dairymaster, Causeway, Co. Kerry, Ireland). Milk fat, protein and lactose concentrations were calculated weekly from one successive evening and morning milking sample for each animal. A Milkoscan 203 (Foss Electric DK, Hillerød, Denmark) was used to determine the concentrations of these constituents in the milk. Body weight was recorded weekly during the experimental period using an electronic portable weighing scale and the Winweigh software package (Tru-test Limited, Auckland, New Zealand). BCS was recorded fortnightly during the experimental period on a scale of 1 to 5 (Lowman et al., Reference Lowman, Scott and Somerville1976).
GDMI was estimated four times during the experimental period, May, June, July and September using the n-alkane technique (Mayes et al., Reference Mayes, Lamb and Colgrove1986) as modified by Dillon and Stakelum (Reference Dillon and Stakelum1989). Cows received no grass silage or concentrate supplementation during periods of GDMI measurement. All cows were dosed twice daily for 12 days before both morning and evening milking with a paper pellet (Carl Roth, GmbH, Karlesruhe, Germany) containing 500 mg of dotriacontane (C32-alkane). From days 7 to 12 of dosing, faeces samples were collected from each cow twice daily before both morning and evening milking and stored at −20°C. The faeces samples were then thawed and bulked (10 g of each collected sample) by cow and dried for 48 h in a 60°C oven. Samples were then milled through a 1 mm screen and stored for chemical analysis. During the period of faeces collection, the diet of the animals was also sampled. Herbage samples were manually collected with Gardena hand shears, (Accu 60, Gardena International GmbH, Ulm, Germany) following close observation of the treatments’ previous defoliation height to collect a representative sample of the herbage grazed. Herbage samples were frozen at −20°C following collection. Herbage samples were then bowl chopped, freeze-dried and milled through a 1 mm screen before chemical analysis. The ratio of herbage C33 to dosed C32 was used to estimate intake. The n-alkane concentration of the dosed pellets, faeces and herbage were determined as described by Dillon (Reference Dillon1993).
Grazing behaviour data were collected from 15 cows on each treatment over two 24 h periods. Grazing behaviour data were recorded in August and data were corresponded to the GDMI measurements in July and September. Following the morning milking, five cows from each grazing treatment were fitted with IGER (Institute of Grassland and Environmental Research) behaviour recorders (Rutter et al., Reference Rutter, Champion and Penning1997). Following recording, jaw movements were analysed using Graze analysis software (Rutter, Reference Rutter2000). Total grazing, ruminating and idling times were measured using this software. Additionally, the numbers of grazing and ruminating bouts were counted, as well as the number of boli within each ruminating bout. Handling time was calculated as grazing time plus ruminating time. Intake per minute was calculated as [GDMI (kg/day)·1000]/grazing time.
Herbage nutritive value
Three times weekly herbage above 4 cm was harvested from each treatment area as previously described. A sub-sample of this herbage was then dried for 48 h in a 40°C oven after which it was milled through a 1 mm screen and stored for chemical analysis. The herbage samples were analysed for DM content (90°C for 16 h), ash (500°C furnace for 12 h) and CP (Leco FP-428; Australia Pty Ltd.). The ADF and NDF (using sodium sulphate with results inclusive of ash) fractions (Van Soest et al., Reference Van Soest, Robertson and Lewis1991) were determined using an Ankom200 Fiber Analyser (ANKOM Technology, Macedon, NY, USA) using the procedures of AOAC (1995; method 973.18). Pasture digestibility (organic matter digestibility) was determined using the method outlined by Morgan et al. (Reference Morgan, Stakelum and Dwyer1989) using the Fibertec™ System (FOSS, Ballymount, Dublin 12, Ireland).
Statistical analysis
All statistical analyses were carried out using SAS (SAS, 2005). All pasture measurements were analysed using ANOVA. Herbage data were analysed using the following model:
 $$Y_{{ij}} =\mu {\plus}H_{i} {\plus}P_{j} {\plus}e_{{ij}} $$
where μ is the mean; H i the HM (i=1 to 3); P j the paddock (j=1 to 12) and e ij the residual error term. The same model was used to analyse daily pasture growth rates, with the term month (1 to 7) added to the model.
Herbage nutritive value data were analysed using the following model:
 $$Y_{{ik}} =\mu {\plus}H_{i} {\plus}M_{k} {\plus}H_{i} {\times}{\rm }M_{k} e_{{ik}} $$
where μ is the mean; H i the HM (i=1 to 3); M k the month (k=1 to 7); H i ×M k the interaction between month and HM and e ik the residual error term.
Two cows were removed from the experiment because of health problems unrelated to treatment. These animals were replaced with non-experimental cows to achieve a constant grazing pressure. Data collected from these animals were not used for statistical analyses nor were data from their corresponding blocks. Animal variables were analysed as 63 individual variables using covariate analysis. Milk yield, milk composition, milk constituent yield, BW and BCS were analysed using the following model:
 $Y_{{ijk}} =\mu {\plus}P_{i} {\plus}H_{j} {\plus}b_{l} X_{{ik}} {\plus}b_{l} {\rm DIM}_{{ik}} {\plus}e_{{ijk}} $
where Y ik represents the response of animal k offered HM i; μ is the mean; P i the parity (i=1 to 2); H j the HM (j=1 to 3); b l X ik the respective pre-experimental milk output, BW or BCS variable; b lDIM ik the DIM at start of the experiment and e ijk the residual error term. GDMI and grazing behaviour were analysed using the same model as above, however, values for pre-experimental milk yield were included as covariate values in the model.
Results
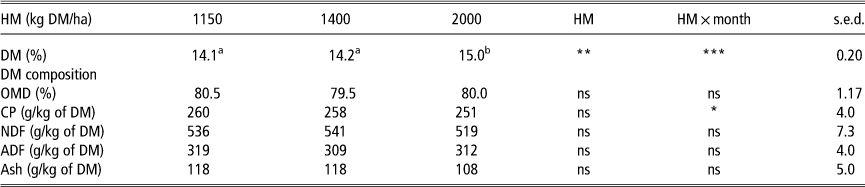
Pre-grazing HM treatment did not influence the nutritive value of the herbage on offer (Table 2).
Nutritive value of the herbage offered on the low (1150 kg DM/ha), medium (1400 kg DM/ha) and high (2000 kg DM/ha) HM treatments

DM=dry matter; HM=herbage mass; s.e.d.=standard error of the difference; ns=not significant; OMD=organic matter digestibility.
a,bMeans within a row with different superscripts differ (P<0.05).
* P<0.05; **P<0.01; ***P<0.001.
Grazing area utilisation and output per hectare
Mean rotation length was shortest (P<0.001) on the L pastures (17 days) and longest on the H pastures (25 days) with 12.1, 10.4 and 9.7 grazing rotations completed on the L, M and H farmlets, respectively (Table 3).
Effect of the low (1150 kg DM/ha), medium (1400 kg DM/ha) and high (2000 kg DM/ha) HM treatments on rotation length during the experimental period

DM=dry matter; HM=herbage mass; s.e.d.=standard error of the difference.
a,b,cMeans within a row with different superscripts differ (P<0.05).
* P<0.05; ***P<0.001.
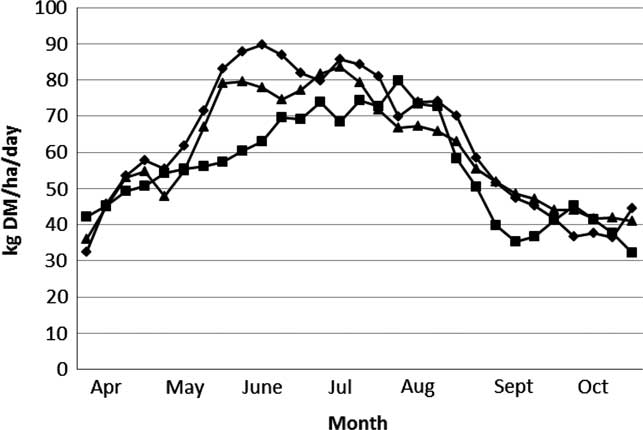
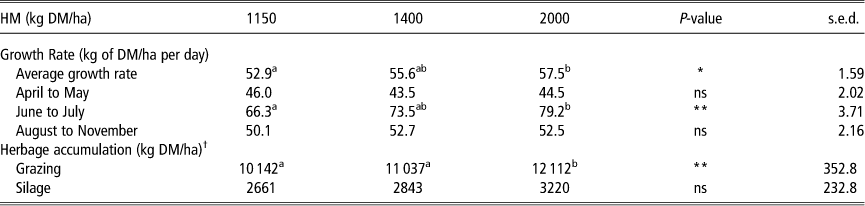
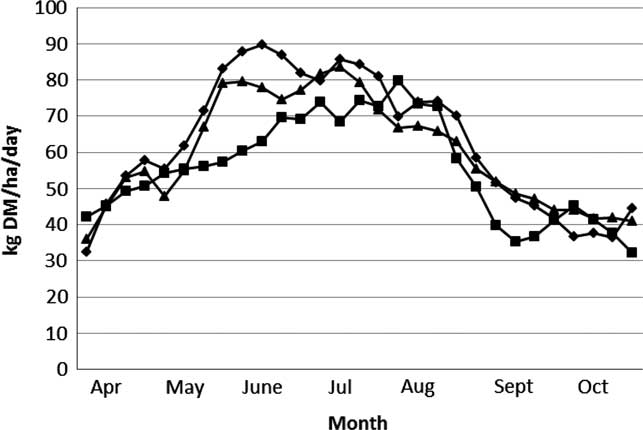
The H pastures recorded a higher mean daily pasture growth rate (+4.6 kg DM/ha; P<0.05) compared with the L pastures (52.9 kg DM/ha) which primarily resulted from differences in pasture growth rate during the June to July period (Figure 1). The reduced pasture growth rate recorded on the L pastures resulted in lower herbage accumulation under grazing (10142 kg DM/ha; Table 4) compared with the H pastures (+1970 kg DM/ha; P<0.01) and the M pastures (+895 kg DM/ha; P=0.09). Pre-grazing HM treatment had no effect on silage accumulation per hectare, although the H pastures tended to accumulate a greater silage yield (+560 kg DM/ha; P=0.09) compared with the L pastures (2661 kg DM/ha).
Effect of pre-grazing herbage mass (HM) treatment (♦, high pre-grazing HM=2000 kg DM/ha; ▲, medium pre-grazing HM=1400 kg DM/ha and ■, low pre-grazing HM=1150 kg DM/ha) on the 3-week rolling average pasture growth rate.
Effect of the low (1150 kg DM/ha), medium (1400 kg DM/ha) and high (2000 kg DM/ha) HM treatment on pasture growth rate and herbage accumulation

DM=dry matter; HM=herbage mass; s.e.d.=standard error of the difference.
a,bMeans within a row with different superscripts differ (P<0.05).
† Herbage accumulation between grazings was calculated as the difference between pre-grazing HM and the post-grazing HM of the previous rotation. Total herbage accumulation was calculated as the sum of the herbage accumulated at each grazing for each treatment.
* P<0.05; **P<0.01.
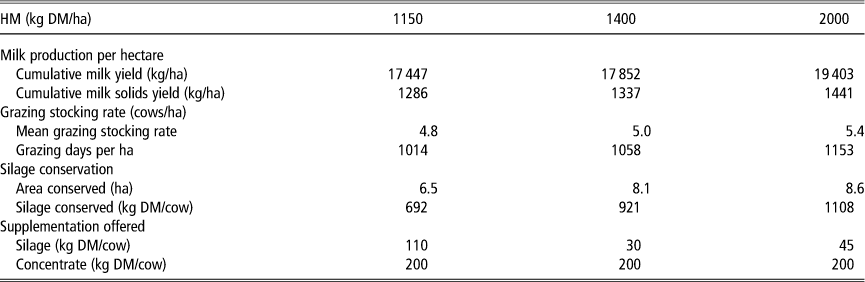
Each farmlet had a global SR of 2.9 cows per ha, however, the grazing SR varied between treatments (Table 5). The L pastures supported a lower mean grazing SR (4.8 cows/ha) compared with the M (−0.2 cow/ha) and H (−0.6 cows/ha) pastures, resulting in milk solids production of 1441, 1337 and 1286 kg/ha for the H, M and L treatments, respectively. A larger area of the H and M farmlets was conserved for grass silage (8.4 ha) compared with the L farmlet (6.5 ha). The higher grass DM production and greater area conserved for grass silage translated into 1108 and 921 kg DM of grass silage conserved per cow on the H and M treatment compared with 692 kg DM/cow on the L treatment.
Effect of the low (1150 kg DM/ha), medium (1400 kg DM/ha) and high (2000 kg DM/ha) HM treatment on area conserved for grass silage, grazing stocking rates, milk production per hectare and supplementation fed per cow

DM=dry matter; HM=herbage mass.
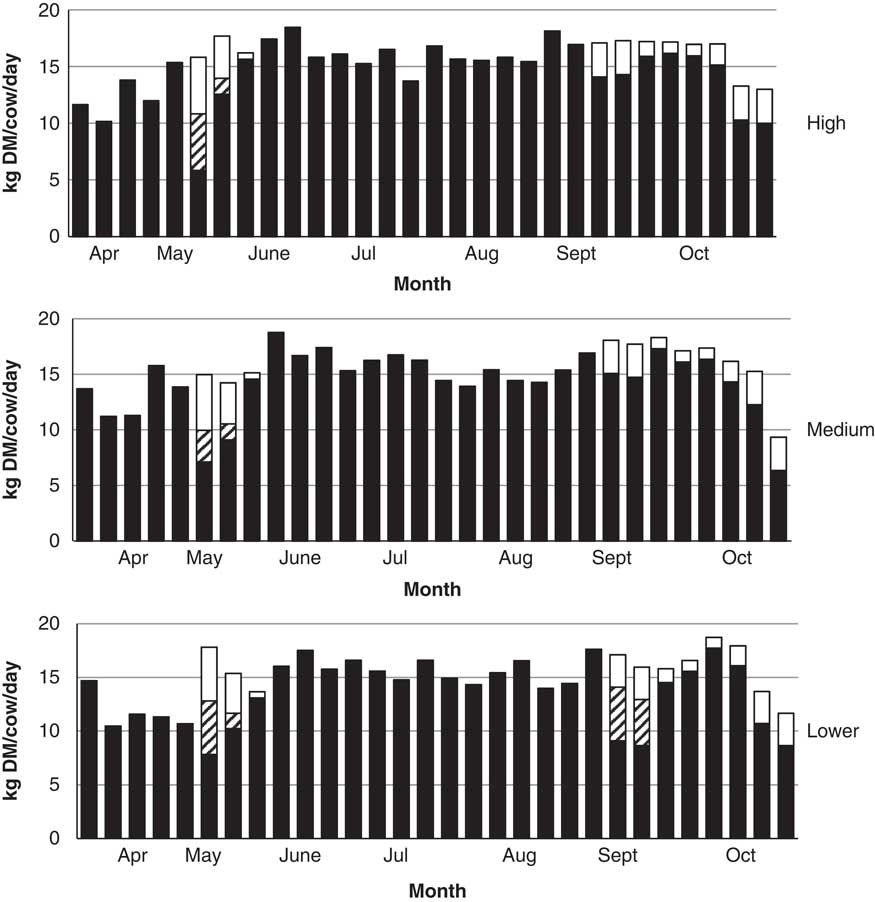
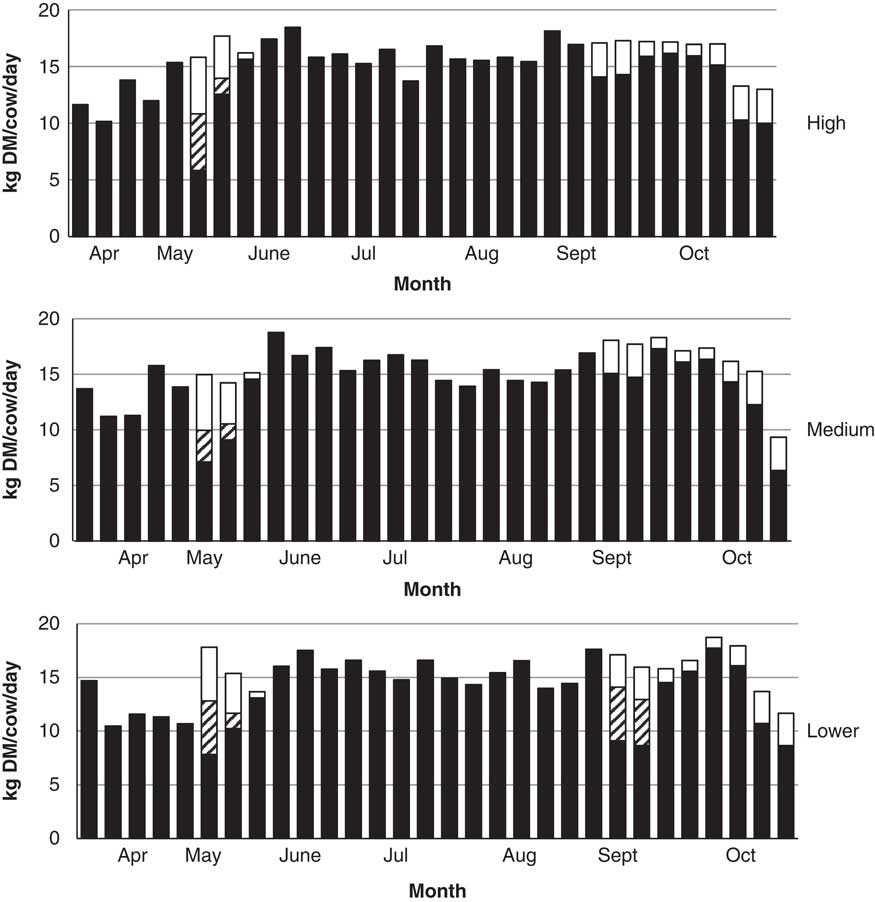
The periods and levels of supplementary feeding are illustrated in Figure 2. A similar level of concentrate supplementation (200 kg DM/cow) was offered to all herds. The level of silage supplementation varied between treatments; cows grazing the L pastures had the greatest requirement for grass silage supplementation at 110 kg DM/cow; +80 and +65 kg DM/cow compared with cows grazing the M and H pastures, respectively.
Weekly composition (■, pasture;  , grass silage; □, concentrate) of diet offered to cows grazing the high pre-grazing HM (2000 kg DM/ha; High), medium pre-grazing HM (1400 kg DM/ha; Medium) and low pre-grazing HM (1150 kg DM/ha; Low) treatments.
Pasture measurements
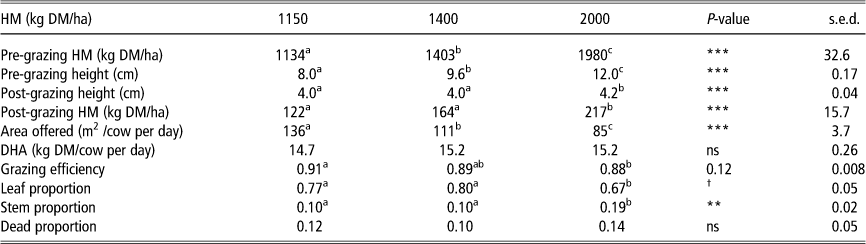
The actual levels of pre-grazing HM recorded were 1134 kg DM/ha, 1403 kg DM/ha and 1980 kg DM/ha (P<0.001) for the L, M and H pastures, respectively, with pre-grazing sward height following a similar trend (P<0.001; Table 6). Higher post-grazing residuals were recorded on the H pastures in terms of both sward height (+0.2 cm; P<0.001) and HM (+74 kg DM/ha; P<0.001). The L treatment recorded the highest level of grazing efficiency (0.91), which was similar to the M treatment but higher (+0.03; P<0.05) than the H treatment. A lower daily grazing area (P<0.001) was offered to cows grazing the H pastures (85 m2/cow per day) compared with cows grazing the M pastures (−26 m2/cow per day) and L pastures (−51 m2/cow per day). There was no effect of treatment on DHA (15.0 kg DM/cow per day).
Effect of the low (1150 kg DM/ha), medium (1400 kg DM/ha) and high (2000 kg DM/ha) HM treatments on pasture measurements, DHA, leaf, stem and dead measurements and grazing efficiency

DM=dry matter; HM=herbage mass; DHA=daily herbage allowance; s.e.d.=standard error of the difference; ns=not significant.
a,b,cMeans within a row with different superscripts differ (P<0.05).
** P<0.01; ***P<0.001; † P<0.1.
The leaf, stem and dead proportions of the pastures during the periods of GDMI measurement are presented in Table 6. Leaf proportion tended to be higher (+0.12; P=0.07) for the M and L pastures, while a higher stem proportion (+0.09; P<0.01) was recorded from the H pastures.
Animal measurements
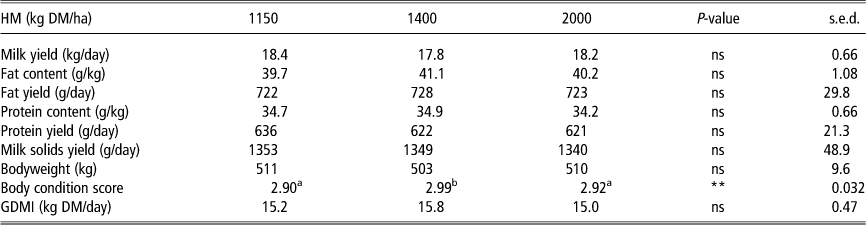
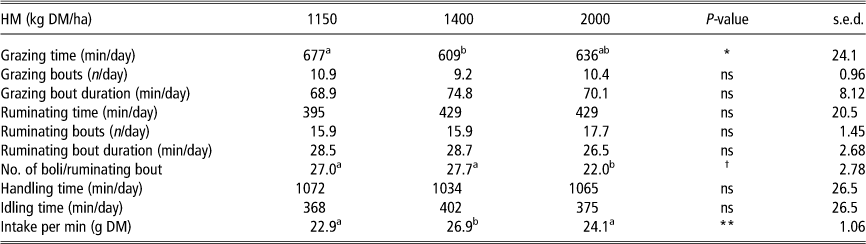
Pre-grazing HM treatment did not affect daily milk production or GDMI (Table 7). Cows grazing the L pastures spent longer grazing (+68 min/day; P<0.05) compared with those grazing the M pastures (609 min/day; Table 8). Cows grazing the M pastures recorded a higher intake per minute (+3.4 g DM/min; P<0.01) compared with their counterparts grazing the L and H pastures (23.3 g DM/min).
Effect of the low (1150 kg DM/ha), medium (1400 kg DM/ha) and high (2000 kg DM/ha) HM treatments on milk production and GDMI

DM=dry matter; HM=herbage mass; GDMI=grass dry matter intake; s.e.d.=standard error of the difference; ns=not significant.
Milk production, bodyweight and body condition score measurements refer to the entire experimental period while GDMI measurement refers to the average of four individual weekly periods in May, June, July and September.
a,bMeans within a row with different superscripts differ (P<0.05).
** P<0.01.
Effect of the low (1150 kg DM/ha), medium (1400 kg DM/ha) and high (2000 kg DM/ha) HM treatments on grazing behaviour

DM=dry matter; HM=herbage mass; ns=not significant; s.e.d.=standard error of the difference.
a,bMeans within a row with different superscripts differ (P<0.05).
* P<0.05; **P<0.01; † P<0.1.
Discussion
Recent work by Pérez-Prieto et al. (Reference Pérez-Prieto, Peyraud and Delagarde2013) has demonstrated that the effect of pre-grazing HM on herbage intake is affected by the height at which HM is estimated. At the same herbage allowance, the effect of HM on herbage intake was reported to be positive, null and negative when HM was estimated at cutting heights of ground level, 2.5 and 5.0 cm, respectively. When HM is measured at ground level, the unavailable fraction (<2.5 cm) is greater at a low HM than at a high HM. On the other hand, when HM is measured above 5 cm, the available fraction (herbage>5 cm and herbage in the stratum between 2.5 and 5 cm) is greater at a low HM than at a high HM. In the current study, post-grazing sward height was controlled; only herbage >4 cm was available to each treatment and therefore removed any confounding effects of herbage availability and HM estimation height from this study.
Grass production and grazing efficiency
Grazing interval in the current study varied between treatments in order to maintain pre-grazing HM targets. This led to differences in pasture growth rate and ultimately to differences in pasture DM production; decreasing grazing interval (or maintaining low levels of pre-grazing HM) reduced pasture DM production. These findings are in agreement with the information available in the literature; short regrowth intervals reduce pasture growth rates (Parsons and Penning, Reference Parsons and Penning1988; McKenzie, Reference McKenzie1996) and annual pasture production (MacDonald et al., Reference MacDonald, Penno, Lancaster and Roche2008). As perennial ryegrass pastures follow a sigmoidal pattern of growth, beginning slowly before increasing exponentially, short grazing intervals do not allow perennial ryegrass plants to reach maximum average growth rate (Parsons and Penning, Reference Parsons and Penning1988) and consequently depress DM production. In the current study, the L pastures recorded the shortest regrowth interval during the June to July period (15 days); it was during this period that the treatment effect on pasture growth was most pronounced. Fulkerson and Slack (Reference Fulkerson and Slack1995) reported that reduced regrowth after frequent defoliation can be attributed to a reduction in the water soluble carbohydrate (WSC) reserves of the frequently defoliated plants, which reduces regrowth capacity. As no stubble WSC measurements were undertaken as part of the current study and plant development stage at grazing was not routinely measured, the contribution of WSC stubble reserves to pasture growth rates cannot be further discussed and represents a shortcoming of the current study. In agreement with the work of Tuñon (Reference Tuñon2013) results from the current study indicate that maintaining a pre-grazing HM of <1150 kg DM/ha for a prolonged period will lead to a reduction in grass DM production because of the short regrowth intervals required to maintain such levels of pre-grazing HM.
Sward structure is an important determinant of grazing efficiency (O’Donovan et al., Reference O’Donovan, Delaby and Peyraud2004). The H pastures contained a greater stem proportion and a reduced leaf proportion compared with the L pastures. Increasing the proportion of green leaf in the lower strata of the sward has positive effects on herbage intake (Parga et al., Reference Parga, Peyraud and Delagarde2000). Conversely, stem acts as a relative barrier to grazing, reducing the ease of herbage removal particularly when cows are forced to graze to low post-grazing sward heights (Wade, Reference Wade1991). The increased stem content of the H swards suggest that relative ease of herbage removal declined on these swards particularly as cows grazed into the lower sward strata thereby reducing grazing efficiency compared with the L treatment, which is evident by the higher post-grazing sward height and HM.
Grazing and system management
The L farmlet was forced to carry a lower grazing SR as a result of an increased demand for grazing area. In order to offer a similar DHA across treatments, the daily grazing area offered to cows grazing the L pastures was ∼33% greater than that offered to cows grazing the H pastures. Although the increased number of grazing rotations compensated for some of the increased demands for daily area, grazing SR and the number of grazing days per hectare were lowest on the L farmlet.
The provision of an adequate amount of conserved grass silage for the winter feeding period is a key requirement of Irish dairy systems (McCarthy et al., Reference McCarthy, Pierce, Delaby, Brennan, Fleming and Horan2013). The current study was executed from late spring to autumn, as it is during this period that grass silage is conserved on dairy farms, it is possible to extrapolate relevant information. Maintaining a low level of pre-grazing HM reduced the level of grass silage conserved for winter feeding. First, maintaining low levels of pre-grazing HM reduced pasture DM production as previously discussed. Second, the increased demand for grazing area resulted in 28% less area conserved for grass silage production on the L farmlet. This resulted in 692 kg DM of grass silage conserved per cow on the L farmlet, resulting in a winter feed deficit, as 1000 kg DM of grass silage per cow is required for the winter feeding period (∼11 weeks; Kennedy, et al., Reference Kennedy, Hennessy and O'Donovan2007).
Due to lower grass growth rates, the L farmlet recorded greater pasture deficits and a greater demand for grass silage supplementation during the grazing season. As grass silage supplementation had to be fed from stocks already conserved by that treatment, winter feed stocks on the L farmlet were further reduced; 582 kg DM of grass silage per cow or 58% of requirements remained for winter feeding on the L farmlet representing a major shortcoming of this approach to grazing management. It should be noted that the requirement for and the level of grass silage conserved may vary from year to year because of inter-seasonal variation in pasture growth. Nevertheless, the underlying reasons for the reduced level of grass silage conserved from the L farmlet are important considerations for pasture-based dairy producers.
Herbage nutritive value
In contrast to the current study, authors have previously reported that as pre-grazing HM increases, pasture digestibility decreases (Curran et al., Reference Curran, Delaby, Kennedy, Murphy, Boland and O’Donovan2010; 1652 to 2480 kg DM/ha, McEvoy et al., Reference McEvoy, O’Donovan, Kennedy, Murphy, Delaby and Boland2009; 1767 to 2358 kg DM/ha, O’Donovan and Delaby, Reference O’Donovan and Delaby2008; 2365 to 3103 kg DM/ha). In these studies, increasing pre-grazing HM was associated with higher post-grazing residual, possibly exacerbating the negative effect of increasing pre-grazing HM on sward nutritive value (Mayne et al., Reference Mayne, Newberry, Woodcock and Wilkins1987; Stakelum and Dillon, Reference Stakelum and Dillon2007). A similar, relatively severe grazing pressure was applied to each treatment in the current study, which may have minimised the impact of increasing HM on sward nutritive value. Furthermore, it is likely that a wider range in pre-grazing HM is required to create differences in herbage nutritive.
Milk production
Curran et al. (Reference Curran, Delaby, Kennedy, Murphy, Boland and O’Donovan2010) showed that the benefits of offering lower pre-grazing HM pastures (2480 to 1652 kg DM/ha) to be cumulative, with improved animal performance observed in the second part of the grazing season. There is little doubt that any cumulative effects would have been captured in the current study as it was executed for the majority of the grazing season. Animal performance on the H treatment was expected to be lower because of unfavourable sward structure (O’Donovan and Delaby, Reference O’Donovan and Delaby2008) and chemical composition (Holmes et al., Reference Holmes, Hoogendoorn, Ryan and Chu1992). However, the H pastures in the current study had a lower HM (1980 kg DM/ha) compared with previous studies, which reported negative effects of high HM pastures on animal performance (Curran et al. (Reference Curran, Delaby, Kennedy, Murphy, Boland and O’Donovan2010) – 2480 kg DM/ha; O’Donovan and Delaby (Reference O’Donovan and Delaby2008) – 3166 kg DM/ha). Furthermore, the range in pre-grazing HM examined (846 kg DM/ha) in the current study was less than that investigated by previous authors. In agreement with the current study, Wims et al. (Reference Wims, Deighton, Lewis, O'Loughlin, Delaby, Boland and O'Donovan2010) investigating a similar range in pre-grazing HM reported no effect on milk production, suggesting that the range in pre-grazing HM investigated was too narrow to influence daily milk production per cow. This suggestion is supported by McEvoy et al. (Reference McEvoy, O’Donovan, Kennedy, Murphy, Delaby and Boland2009) who investigated a range in pre-grazing HM from 1770 to 2360 kg DM/ha and failed to detect any effect of pre-grazing HM on milk production.
During periods of this experiment, pasture availability per cow was reduced on the L treatment relative to the M and H treatment, because of deficits in pasture growth rate. The use of supplements during periods of pasture deficit avoided a reduction in milk yield per cow on the L treatment due to reduced pasture availability. A similar approach was used by Fariña et al. (Reference Fariña, Garcia, Fulkerson and Barchia2011), which resulted in a similar milk yield per cow at a low (2.5 cows/ha) and high (3.8 cows/ha) SR.
Although treatment had no effect on milk production per cow in the current study, milk production per unit land area is an important consideration for pasture-based dairy systems and therefore requires investigation. Although experimental design did not allow statistical analysis of these variables, calculated values for grazing outcomes indicate that the high HM pastures used in this study are capable of supporting a higher number of grazing cow days per hectare and higher milk production per hectare compared with the low HM pastures. On the other hand, given the winter feed and pasture growth deficits recorded on the L treatment due to a reduction in pasture DM production, it appears that maintaining low levels of pre-grazing HM will not support an SR of 2.9 cows/ha. Indeed MacDonald et al. (Reference MacDonald, Penno, Lancaster and Roche2008) states that increasing inter-grazing interval and capturing the advantage of additional pasture grown is an essential element of managing increasing SR. Curran et al. (Reference Curran, Delaby, Kennedy, Murphy, Boland and O’Donovan2010) and McEvoy et al. (Reference McEvoy, O’Donovan, Kennedy, Murphy, Delaby and Boland2009) reported that maintaining higher levels of pre-grazing HM reduces milk output per hectare because of a decline in herbage quality. In the current study, similar herbage quality values were recorded from each treatment, which allowed the H pastures to support increased milk production per hectare compared with the L pastures. Finally, at a system level, a reduction in pasture growth and silage conserved was recorded on the L pastures and cows grazing the L farmlet required more supplementation without an increase in milk output per cow or per unit land area.
Grazing behaviour and GDMI
Although GDMI was similar between treatments, cows grazing the L pastures altered their behaviour in response to the low HM on offer by increasing grazing time and grazing a greater daily area. Cows grazing the L pastures grazed for 677 min/day, which is significantly higher than the average daily grazing times of 450 to 550 min reported in the meta-analysis of Pérez-Prieto and Delagarde (Reference Pérez-Prieto and Delagarde2012). Tuñon (Reference Tuñon2013) observed a similarly high grazing time (648 min) for cows grazing low HM pastures (978 kg DM/ha) at the same site. This behavioural adaption is consistent with reports in the literature; low pre-grazing HM or sward height leads to a reduction in intake per bite causing cows to adapt their grazing behaviour in an effort to maintain GDMI (Hodgson, Reference Hodgson1985). Such responses have been reported under both continuous grazing (Gibb et al., Reference Gibb, Huckle, Nuthall and Rook1997) and strip grazing systems (Pérez-Prieto and Delagarde, Reference Pérez-Prieto and Delagarde2012; Tuñon Reference Tuñon2013) where cows increased grazing time in order to totally or partially compensate for a reduced intake rate on low HM pastures. However, the compensatory response of increasing grazing time may be limited by the time budgets for ruminating and other activities (Gibb et al., Reference Gibb, Huckle, Nuthall and Rook1997) and thus daily GDMI may be limited by grazing short pastures. The lack of treatment effect on GDMI in the current study demonstrates the ability of rotationally grazed cows to adapt their grazing behaviour to maintain GDMI across the range of HM investigated. This is supported by Tuñon (Reference Tuñon2013) who reported that cows offered low HM pastures (978 kg DM/ha) can achieve a similar GDMI to cows offered medium or high HM pastures (1521 and 2330 kg DM/ha, respectively) by grazing a greater daily area and increasing grazing time.
Conclusion
The range in pre-grazing HM investigated in the current study did not influence daily milk production per cow. Although grazing efficiency was higher on the L pastures compared with the H pastures, results from the current study indicate that maintaining low levels of pre-grazing HM (1150 kg DM/ha) reduces pasture DM production. At a system level, grazing low HM pastures (1150 kg DM/ha) resulted in greater pasture deficits at grazing and reduced silage conservation for winter feeding, without an increase in milk output per cow or per hectare. Results from this study also suggest that maintaining low HM pastures will not support increasing SR and milk output per unit land area. For these reasons, it can be concluded that adapting the practise of grazing low HM pastures is not a suitable management strategy to increase milk production from perennial ryegrass pastures.
Acknowledgements
The authors wish to acknowledge M. Feeney, N. Galvin, J.P. Murphy and F. Coughlan for their technical assistance, as well as the Moorepark farm staff for their care of the experimental animals.