Implications
This study provides new information on changes in the patterns of gene expression during the progression of malignant melanoma and its regression in Sinclair swine.
Introduction
The Sinclair Miniature Pig Melanoma model was established in the 1970s by breeding melanoma-bearing pigs to establish a line with up to 70% incidence of melanoma (Hook et al., Reference Hook, Aultman, Adelstein, Oxenhandler, Millikan and Middleton1979; Tissot et al., Reference Tissot, Beattie and Amoss1987). Melanoma in Sinclair swine usually develops in utero or within the first 6 weeks of life (Gomez-Raya et al., Reference Gomez-Raya, Okomo-Adhiambo, Beattie, Osborne, Rink and Rauw2007), with lesions varying from benign flat nevi to large, deeply invasive, exophytic tumors possessing characteristics of malignant tumors (Das Gupta et al., Reference Das Gupta, Ronan, Beattie, Shilkaitis and Amoss1989) as well as some in vitro characteristics of benign neoplastic cells found in childhood tumors such as retinoblastoma or neuroblastoma that are of neural or neural crest tissue origin as are melanocytes. Cutaneous malignant melanoma in Sinclair swine may have multiple primary sites and usually disseminates in the lymph nodes and visceral organs (Das Gupta et al., Reference Das Gupta, Ronan, Beattie, Shilkaitis and Amoss1989; Greene et al., Reference Greene, Townsend and Amoss1994; Greene et al., Reference Greene, Morgan, Rao, Amoss and Arguello1997). Some pigs may die because of widespread disease but a majority develop a cell-mediated immune response that causes complete regression of the tumors (Misfeldt and Grimm, Reference Misfeldt and Grimm1994; Greene et al., Reference Greene, Morgan, Rao, Amoss and Arguello1997), although the immune response also attacks melanocytes in the skin, resulting in varying degrees of vitiligo that may progress to complete depigmentation (Misfeldt and Grimm, Reference Misfeldt and Grimm1994).
Gene expression analysis using DNA microarrays allows the simultaneous monitoring of differential gene expression for thousands of genes in biological samples (Eisen and Brown, Reference Eisen and Brown1999). Microarray gene expression analysis provides a fresh insight into the genetic basis of cancer initiation and progression (Luo et al., Reference Luo, Duggan, Chen, Sauvageot, Ewing, Bittner, Trent and Isaacs2001; Hoek et al., Reference Hoek, Rimm, Williams, Zhao, Ariyan, Lin, Kluger, Berger, Cheng and Trombetta2004; Talantov et al., Reference Talantov, Mazumder, Yu, Briggs, Jiang, Backus, Atkins and Wang2005) and identification of genes that may be of prognostic value (Wang et al., Reference Wang, Jatkoe, Zhang, Mutch, Talantov, Jiang, McLeod and Atkins2004; Barrier et al., Reference Barrier, Lemoine, Boelle, Tse, Brault, Chiappini, Breittschneider, Lacaine, Houry, Huguier, Van der Laan, Speed, Debuire, Flahault and Dudoit2005) as well as genes that may be associated with aggressive tumor behavior (Bittner et al., Reference Bittner, Meltzer, Chen, Jiang, Seftor, Hendrix, Radmacher, Simon, Yakhini, Ben-Dor, Sampas, Dougherty, Wang, Marincola, Gooden, Lueders, Glatfelter, Pollock, Carpten, Gillanders, Leja, Dietrich, Beaudry, Berens, Alberts and Sondak2000). In addition, microarray gene expression profiling has shown promise in evaluating the sensitivity of tumors to chemotherapy or other targeted approaches to therapy (Huang and Sadee, Reference Huang and Sadee2003; Mariadason et al., Reference Mariadason, Arango, Shi, Wilson, Corner, Nicholas, Aranes, Lesser, Schwartz and Augenlicht2003; Alaoui-Jamali et al., Reference Alaoui-Jamali, Dupre and Qiang2004; Clarke et al., Reference Clarke, te Poele and Workman2004). There are no data on gene expression changes in melanoma regression. However, Sinclair swine is a unique model for investigating molecular changes during regression, given their high frequency of cancer regression.
This study hypothesizes that genes are differentially expressed in Sinclair swine with melanoma compared with those not afflicted by the disease. The study also hypothesizes that genes are differentially expressed in melanoma v. non-melanoma pigs during tumor progression and regression. The main objective of this study was to investigate the expression profiles of genes that are modulated during development and metastasis of malignant melanoma in Sinclair swine at 6 weeks using an Affymetrix GeneChip® Porcine Genome Array (Affymetrix Inc., Santa Clara, CA, USA) and quantitative real-time RT-PCR (qRT-PCR), with the goal of improving the understanding of melanoma progression at molecular and gene-expression levels. This study also investigates gene expression at later ages, in an effort to gain further knowledge of the molecular changes that occur during the process of tumor progression and regression in Sinclair swine.
Material and methods
Animals
The Sinclair melanoma swine were derived from a herd maintained at the University of Nevada, Reno Agricultural Experiment Station. They were maintained under animal care and use protocols of the University of Nevada, Reno. The experimental piglets, one female afflicted with melanoma at birth, and its full female sibling that showed no incidence of melanoma at birth and at weaning, were sacrificed at 6 weeks (weaning age). Before euthanasia, the live piglets were bled by jugular venipuncture using a 20-gauge needle. A volume of 5 ml peripheral whole blood was collected in vacutainer tubes containing EDTA anticoagulant (Becton Dickinson Biosciences; Franklin Lakes, NJ, USA). Blood samples were spun in a centrifuge at 3000 × g for 15 min to separate buffy coats containing white blood cells (WBCs), which were stored in liquid nitrogen.
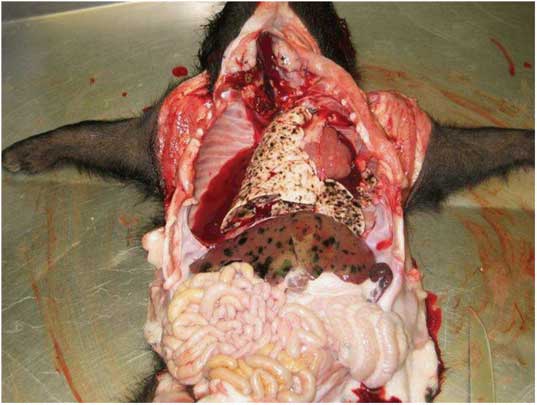
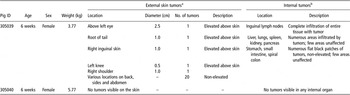
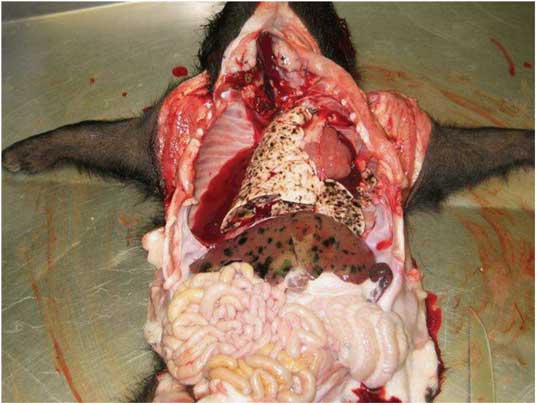
Euthanasia was conducted using sodium pentobarbital at a dosage of 1 ml/10 lb body weight. The post-mortem examination showed that the piglet afflicted by melanoma at birth had numerous metastatic lesions infiltrated into the internal visceral organs and lymph nodes (Figure 1 and Table 1) while the other piglet had no evident metastatic tumors. For the melanoma-afflicted pig, samples were collected from the lymph nodes and internal visceral organs that were infiltrated by tumors including the liver, lungs, spleen, kidneys, pancreas, stomach, small intestines and colon (Table 1). Only sections of the melanoma-afflicted tissues that exhibited almost 100% melanoma lesions were collected to minimize the presence of non-melanoma tissues in the sample. For the pig without melanoma, samples were obtained from equivalent lymph nodes and internal visceral organs, respectively. The harvested tissues were stored in liquid nitrogen in readiness for RNA extraction.
Sinclair piglet at 6 weeks of age exhibiting metastatic melanoma lesions in internal visceral organs.
Characteristics of tumor samples collected from Sinclair swine

Note: Peripheral blood was also collected from both pigs. Buffy coats containing white blood cells were separated and stored in liquid nitrogen along with other sampled tissues.
aFor the melanoma-afflicted pig, skin samples were collected from areas with visible non-elevated tumors and consisted of biopsies measuring about 4 cm2 each. For the normal pig, samples were taken from equivalent areas of the skin with no tumors. The skin samples were not analyzed in this study.
bSamples collected from internal organs of the melanoma-afflicted pig were taken from areas containing almost 100% visible tumors. For the normal pig, samples were taken from equivalent organs showing no tumors.
Of note, skin samples with or without tumors were also collected from both piglets, respectively, but the quality of RNA extracted from samples with tumors was very low, because of the presence of high amounts of dead tissue. Consequently, skin samples were not included in the microarray and qRT-PCR analysis in this study.
RNA isolation
Total RNA was isolated from lungs, liver, inguinal lymph nodes, spleen and WBCs harvested from melanoma-afflicted and normal control pigs, respectively, using the Qiagen RNeasy mini kit (Qiagen Inc., Valencia, CA, USA) according to the manufacturer's instructions. RNA quantity and quality were determined by capillary electrophoresis using the Agilent 2100 Bioanalyzer (Agilent Technologies; Santa Clara, CA, USA) according to the manufacturer's instructions.
Microarray hybridization and data analysis
Labeled cDNA was prepared from total RNA and hybridized with the high-density oligonucleotide Affymetrix GeneChip® Porcine Genome Array (Affymetrix Inc.) consisting of 24 123 probe sets, according to standard manufacturer protocols. Arrays were scanned using Affymetrix protocols and scanners. For subsequent analysis, each of the ten hybridized arrays (five with melanoma and five with normal cDNA, respectively) was considered as an experimental sample, and each probe set on the array was considered as a separate gene. Microarray data acquisition and image analysis was performed using Affymetrix GeneChip® Operating Software (GCOS). GeneSpring 7.0 software (Agilent Technologies; Santa Clara, CA, USA) was used to normalize and analyze the GCOS output data to provide expression values for each gene. Gene names and accession numbers were updated according to the annotated version of the Affymetrix Porcine GeneChip® (Tsai et al., Reference Tsai, Cassady, Freking, Nonneman, Rohrer and Piedrahita2006). Genes with expression values ⩾2.0 (upregulated ⩾2.0-fold) or expression values ⩽0.5 (downregulated ⩾2.0-fold) in at least one out of the 10 experimental samples were selected for further analysis, and a total of 20 177 genes (∼84%) fulfilled this criterion. Genes selected for further analysis were classified into functional subgroups using Simplified Ontology, a feature of GeneSpring.
qRT-PCR
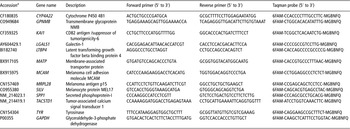
qRT-PCR was performed to validate the microarray data of 12 selected genes that were differentially expressed (up- or downregulated) in the melanoma compared with normal samples (Table 3). Primers and probes were designed using the Primer Express 2.0 software (Applied Biosystems [ABI]; Foster City, CA, USA). Reverse transcription (RT) was performed with 1 μg total RNA isolated from lungs, liver, inguinal lymph nodes, spleen and WBCs harvested from melanoma-afflicted and normal control pigs, using 300 ng/μl random primers and Superscript II Reverse Transcriptase™ (Invitrogen; Carlsbad, CA, USA) according to the manufacturer's instructions. qRT-PCR was performed using the 5′ Nuclease Taqman Assay (ABI) according to the manufacturer's instructions. In brief, 1 μl of cDNA obtained from the RT reaction were amplified in a 25 μl containing 2 × TaqMan® Universal PCR Mastermix (ABI; Foster City, CA, USA), 900 nmol/l of forward and reverse primers and 250 nmol/l of TaqMan hybridization probe. For each sampled time point, the target gene was amplified concurrently with the glyceraldehyde-3-phosphate dehydrogenase (GAPDH) control gene, in separate wells. Non-template controls were included in every run. All reactions were performed in triplicate. Thermal cycling was performed in an ABI PRISM 7000 Sequence Detection System unit (ABI; Foster City, CA, USA).
qRT-PCR data, comprising threshold value (Ct) values, were analyzed using the Relative Expression Software Tool (REST©; Pfaffl et al., Reference Pfaffl, Horgan and Dempfle2002), which uses a mathematical model based on the PCR efficiencies and the mean Ct deviation between the sample and the control group, where the ratio  . The quantification was carried out relative to a non-regulated reference housekeeping control gene (GAPDH). Differences in expression between the control and the treated samples for the investigated transcripts were assessed in group means for statistical significance using the Pair-Wise Fixed Reallocation Randomization Test© running within REST© (Pfaffl et al., Reference Pfaffl, Horgan and Dempfle2002).
Gene expression during tumor progression and regression
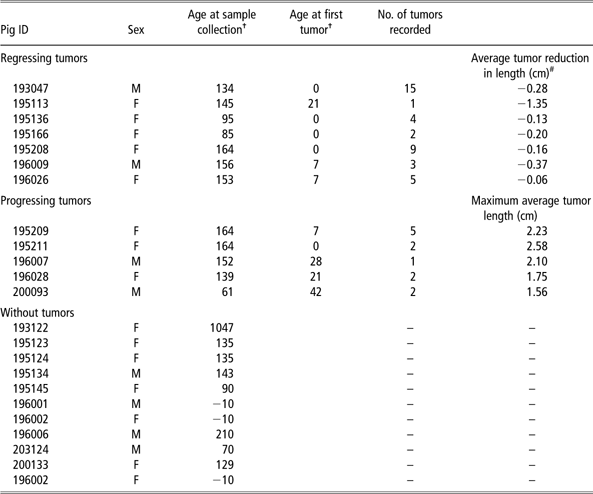
To analyze gene expression during tumor regression, additional frozen liver samples were obtained from the historical Sinclair herd sample collection, from 22 pigs (seven, five and ten with regressing, progressing and without melanoma, respectively). The Sinclair swine herd was established and maintained in the 1980s at Texas A & M University as a resource population for biomedical research. Records including the number of tumors, location and size were documented for each pig. A set of measurements were used to monitor tumor status of each piglet over time including length, width and height that were measured using a caliper. The recording of tumors was carried out weekly. Tissue samples (liver, tail, etc.) from culled animals were systematically collected and stored at −80°C for most pigs and information on those pigs was documented in a database. More information on this population and historical records can be found in Gomez-Raya et al. (Reference Gomez-Raya, Amoss, Da, Beattie, Smith, Ash and Rauw2009). In this study, length was used as a criterion for estimating tumor size based on James et al. (Reference James, Eisenhauer, Christian, Terenziani, Vena, Muldal and Therasse1999), who concluded that unidimensional measurements for tumors are appropriate for estimating regression in solid tumors. Pigs whose tumors had reached the maximum length at collection time were considered as progressing animals. Pigs with tumors that were reduced in length (compared with the maximum registered length) at collection time were categorized as regressing animals. The average change for all tumors within each pig was used to assign piglets into progressing or regressing animals (Table 2). More information on the 22 liver samples used in the analyses of gene expression is given in Table 2. The frozen samples were used in qRT-PCR analysis of 12 genes that were upregulated during metastasis. A one-way ANOVA test was performed to test whether gene expression in piglets with regressing, progressing or without tumors was different.
Information of frozen samples obtained from pigs with regressing, progressing and without tumors
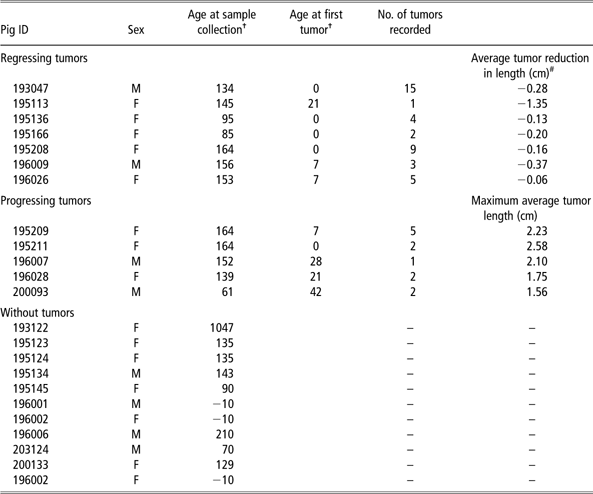
†Age in days.
Reduction in tumor length from the maximum recorded till the last recorded measurement.
For this tumor regression study, the same protocols were followed for RNA extraction from liver frozen samples obtained from the additional 22 pigs described above. qRT-PCR was performed as described earlier for the 12 selected genes (Table 3) that were differentially expressed in the melanoma compared with normal samples. qRT-PCR data comprising cDNA (ng) quantified for each gene were analyzed by one-way ANOVA (Minitab 15 software) contrasting absolute RNA expression for the 12 genes in the animals with melanoma (regression and progression) and without the disease.
Primer and probe sequences for quantitative real-time reverse transcription PCR

6FAM = 6-carboxyfluorescein; MGBNFQ = minor groove binding non fluorescent quencher.
aGenBank database.
Results
Differential gene expression in melanoma compared with normal samples
Microarray analysis compared the gene expression profiles of samples (lungs, liver, inguinal lymph nodes, spleen and WBCs) obtained from melanoma-afflicted and normal control piglets born from the same litter of Sinclair swine, at weaning. For the melanoma-afflicted piglet, metastatic lesions were visually observed in lungs, liver, inguinal lymph nodes and spleen from which samples were obtained (Figure 1). For the purpose of discussion, melanoma samples refer to those obtained from the melanoma-afflicted pig, while normal samples refer to those derived from the pig without melanoma.
After microarray gene expression analysis, genes with expression values ⩾2.0 (upregulated ⩾2.0-fold) or expression values ⩽0.5 (downregulated ⩾2.0-fold) in at least one out of the 10 experimental samples (hybridized arrays) were selected for further analysis, with a total of 20 177 genes out of the original 24 123 (∼84%) fulfilling the criterion.
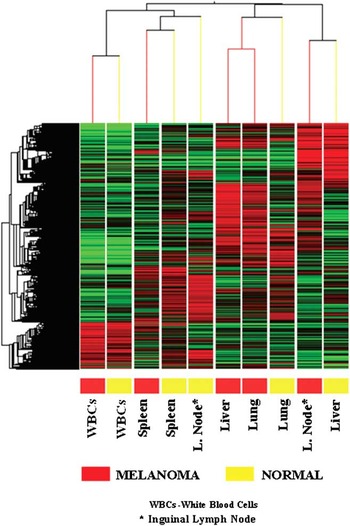
Out of the originally selected 20 177 genes, a total of 7012 genes (displaying ⩾2.0-fold induction in a particular tissue and also ⩾2.0-fold repression in another tissue) were hierarchically clustered by Pearson's correlation using GeneSpring 7.0 software (Figure 2). Hierarchical clustering of gene expression values for the 7012 genes revealed two discrete gene modulation patterns: induced genes (red) and downregulated genes (green), with correlated expression of genes involved in diverse functions and cellular pathways. Hierarchical clustering also revealed a distinct separation between gene expression values for respective samples obtained from the melanoma-afflicted and non-melanoma pigs, with the exception of WBCs and spleen, where the least separation and variation of gene expression values were observed (Figure 2). The liver and inguinal lymph nodes exhibited the greatest separation and variation of gene expression values between melanoma and the non-melanoma pigs, followed by the lungs.
Hierarchical clustering of 7012 genes that were modulated (up- or downregulated) ⩾2-fold in at least one out of the ten experimental samples after microarray analysis. Each column represents a sample and each row is a gene. The condition gene tree shows induced genes (red) and repressed genes (green), while genes whose expression did not change are black. The color code for melanoma samples is red and normal samples are yellow.

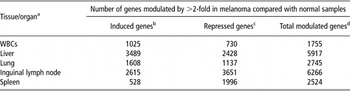
To determine differential gene expression ratios, the gene expression values for samples obtained from the melanoma-afflicted pig were divided by gene expression values for the corresponding samples derived from the animal without melanoma, for each of the selected 20 177 genes. Genes with differential gene expression ratios ⩾2.0 (upregulated by ⩾2.0-fold) or expression values ⩽0.5 (downregulated by ⩾2.0-fold) were considered as significantly induced or repressed in melanoma compared with normal samples. The liver exhibited the highest number of differentially expressed genes (3489) that were significantly upregulated ⩾2.0-fold in melanoma compared with normal samples (Table 4), while the spleen exhibited the least (528). Of the significantly downregulated genes, the inguinal lymph node exhibited the highest number of differentially expressed genes (3651), while WBCs exhibited the least number (730). The sample-specific variation in differential gene expression between the melanoma-afflicted and normal piglets was consistent with that observed after hierarchical clustering.
Distribution of differentially genes modulated by >2-fold in melanoma compared with normal samples

WBCs = white blood cells.
aSource of total RNA for microarray hybridization.
bSignificantly upregulated ⩾2-fold (gene expression ratio ⩾2.0; t-test P-value ⩽0.05).
cSignificantly downregulated ⩾2-fold (gene expression ratio ⩽0.5; t-test P-value ⩽0.05).
dSum of up- and downregulated genes.
Diverse functional categories of genes are modulated during melanoma progression
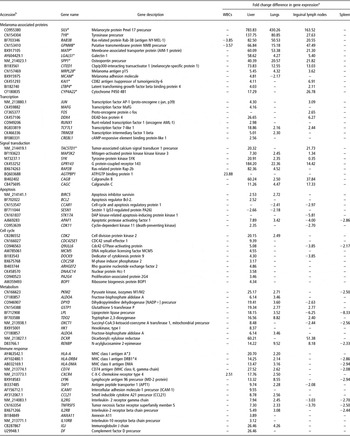
Transcripts representing several functional categories were significantly modulated in melanoma compared with normal samples (Table 5). The modulated transcripts included genes directly involved in melanoma development and progression, as well as genes generally associated with cancer pathogenesis including transcription factors, signal transducers, cell cycle regulators and apoptosis-related genes, as well as genes involved in the immune response and energy metabolism (Table 5). These findings suggest that numerous cellular processes were transcriptionally altered during melanoma progression, with the majority of gene modulations (up- and downregulation) occurring in the liver and inguinal lymph nodes. Table 5 shows a partial list of genes significantly modulated in melanoma compared with normal samples; a complete list of these functionally classified genes can be found in the supplemental information.
Genes differentially expressed between melanoma and normal porcine samples

aGene expression values of samples obtained from the melanoma-afflicted pig were divided by those of the corresponding samples from the non-melanoma pig, to provide differential gene expression ratios. Expression ratios ⩾2.0 (⩾2.0-fold upregulation) and ⩽0.05 (⩾2.0-fold downregulation) are considered significant.
bGenBank accession of cDNA elements spotted on Affymetrix oligonucleotide microarrays.
*Microarray data validated by quantitative real-time RT-PCR.
(–), no significant change in gene expression.
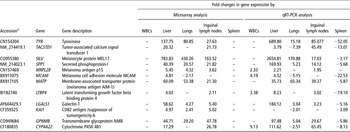
A number of genes directly associated with cancer pathogenesis were differentially expressed in melanoma compared with normal samples including SILV, TYR and RAB28 (Table 5). The SILV gene, which encodes melanocyte protein PMEL17, was the most highly differentially expressed gene in melanoma compared with normal samples, and was over-expressed 784-fold in the liver, 430-fold in the lungs and 164-fold in the inguinal lymph nodes, but remained unchanged in the WBCs and spleen samples (Table 5). qRT-PCR analysis (Table 6) confirmed the induced expression of SILV in the liver, lungs and inguinal lymph nodes, as well as its unaltered expression in the WBCs and spleen. The TYR gene which encodes tyrosinase protein, a copper-containing oxidase enzyme that catalyzes multiple steps in melanin biosynthesis in melanocytes and melanoma cells (Tripathi et al., Reference Tripathi, Hearing, Urabe, Aroca and Spritz1992; Battyani et al., Reference Battyani, Xerri, Hassoun, Bonerandi and Grob1993; Kwon, Reference Kwon1993; Perez et al., Reference Perez, Zhang, Bosserhoff, Buettner and Abu-Hadid2000), was over-expressed by 138-fold in the liver, by 81-fold in the lungs and 28-fold in the inguinal lymph nodes after microarray analysis (Table 5), and similar to SILV, remained unchanged in WBCs and spleen, findings that were confirmed by qRT-PCR (Table 6). Ras-related protein Rab-38 (RAB38) was induced by ∼83-, 50- and 20-fold in the liver, lungs and inguinal lymph nodes with melanoma, respectively.
Validation of microarray data by qRT-PCR

qRT-PCR = quantitative real-time RT-PCR; WBCs = white blood cells.
aFrom GenBank database.
(–), no significant changes in gene expression.
Genes encoding proteins associated directly with cellular transcription (Table 5) were among the majority of genes induced in melanoma compared with normal samples, including the proto-oncogene protein c-Fos (FOS) and the proto-oncogene c-jun (JUN). FOS, an immediate early gene expressed transiently in the G1 phase of the cell cycle after antigen stimulation of T lymphocytes, which plays a role in cell proliferation (Ullman et al., Reference Ullman, Northrop, Verweij and Crabtree1990; Angel and Karin, Reference Angel and Karin1991), was significantly induced by ∼3-fold in inguinal lymph nodes with melanoma, but remained unchanged in the rest of the melanoma samples. JUN, which encodes a protein that interacts directly with specific target DNA sequences to regulate gene expression (Bohmann et al., Reference Bohmann, Bos, Admon, Nishimura, Vogt and Tjian1987) and interacts with FOS to form a dimer, was upregulated 4-fold and 3-fold in the liver and inguinal lymph nodes with melanoma, respectively.
Several genes encoding signal transduction proteins were also upregulated in the samples with melanoma including tumor-associated calcium signal transducer 1 (TACSTD1) and mitogen-activated protein kinase 3 (MAP3K2). TACSTD1, which was induced 20-fold in the liver and 22-fold in the inguinal lymph nodes with melanoma, encodes a carcinoma-associated antigen that functions as a homotypic calcium-independent cell adhesion molecule (Simon et al., Reference Simon, Podolsky, Moldenhauer, Isselbacher, Gattoni-Celli and Brand1990). The induced expression of TACSTD1 was confirmed by qRT-PCR (Table 6). MAP3K2, upregulated >7-fold and >2-fold in the liver and lungs with melanoma, respectively, is a component of a protein kinase signal transduction cascade and regulates the JNK and ERK5 pathways by phosphorylating and activating MAP2K5 and MAP2K7 (Cheng et al., Reference Cheng, Yang, Xia, Karin and Su2000).
Malignant melanomas show impaired ability to undergo programmed cell death (apoptosis) in response to a wide range of external stimuli, conferring them with a selective advantage for progression and metastasis as well as resistance to therapy (Ivanov et al., Reference Ivanov, Bhoumik and Ronai2003; Gong et al., Reference Gong, Chen, Zhou, Yang, Wang and Wang2005; Li et al., Reference Li, Niederkorn, Neelam and Alizadeh2005). In this study, we observed increased transcription of anti-apoptotic genes in the melanoma compared with normal samples (Table 5), including BCL-2, an integral outer mitochondrial membrane protein that blocks cell death by controlling mitochondrial membrane permeability and prevents translocation of pro-apoptotic caspases (Chandra et al., Reference Chandra, Liu and Tang2002) that was upregulated by 2.5-fold in melanoma compared with normal liver, but was unchanged in the rest of the samples. Apoptosis inhibitor survivin (BIRC5) was induced 2.5-fold and 2.7-fold in liver and lungs with melanoma, respectively. Bcl-2 and other inhibitors of apoptosis such as survivin are elevated in a range of human cancers including melanomas, prostate carcinoma and gliomas (LaCasse et al., Reference LaCasse, Baird, Korneluk and MacKenzie1998; Altieri, Reference Altieri2003; Chawla-Sarkar et al., Reference Chawla-Sarkar, Bae, Reu, Jacobs, Lindner and Borden2004).
In contrast, genes encoding pro-apoptotic proteins were repressed (Table 5), including DAP kinase-related apoptosis-inducing protein kinase 1 (STK17A), cell cycle and apoptosis regulatory protein 1 (CCAR1), as well as p53-regulated protein PA26 (Sestrin 1; SESN1). STK17A, which encodes a serine/threonine-protein kinase 17α that acts as a positive regulator of apoptosis (Sanjo et al., Reference Sanjo, Kawai and Akira1998), was downregulated ∼6-fold in inguinal lymph nodes with malignant melanoma. CCAR1, downregulated 3-fold in inguinal lymph nodes with melanoma, mediates apoptosis induction, which involves sequestration of 14–3–3 protein(s) and altered expression of multiple cell cycle regulatory genes including MYC, CCNB1 and CDKN1A (Rishi et al., Reference Rishi, Zhang, Boyanapalli, Wali, Mohammad, Yu, Fontana, Hatfield, Dawson, Majumdar and Reichert2003). SESN1, a potential regulator of cellular growth (Velasco-Miguel et al., Reference Velasco-Miguel, Buckbinder, Jean, Gelbert, Talbott, Laidlaw, Seizinger and Kley1999), was downregulated by ∼3-fold and 2-fold in melanoma liver and lungs, respectively.
qRT-PCR analysis validated the microarray data of 12 genes that were differentially expressed (induced/repressed) or unchanged in melanoma compared with normal samples, and there was a qualitative agreement in the results of the microarray and qRT-PCR analyses (Table 6). The genes TYR, SILV, SPP1, MRPL28, MATP, LGALS1 and GPNMB were over-expressed (⩾2-fold), based on microarray and qRT-PCR analyses, in the liver, lung and inguinal lymph node samples. TACSTD1 was over-expressed based on both methods in the liver and inguinal lymph nodes, but in the lungs, it was unchanged by microarray and downregulated by qRT-PCR analysis. MCAM was upregulated in the liver, downregulated in the lungs and unchanged in the inguinal lymph nodes, while LTBP4 was upregulated in the liver and inguinal lymph nodes, but remained unchanged in the lungs, based on both methods. However, in the spleen, all 12 genes were unchanged after microarray analysis but were downregulated based on qRT-PCR, with the exception of MRPL28, while in the WBCs, all 12 transcripts showed no significant changes in expression after microarray analysis, but after qRT-PCR, at least four transcripts were upregulated by ⩾2-fold (MRPL28, MCAM, LTBP4 and CYP4A22). Similar to the microarray findings, after qRT-PCR analysis, the liver exhibited the highest fold change differences in gene expression in melanoma compared with normal samples, followed by the inguinal lymph nodes, lungs, spleen and then WBCs. Higher differential gene expression ratios were observed between melanoma and normal samples after qRT-PCR, compared with microarray analysis, a finding consistent with earlier observations that qRT-PCR has greater detection sensitivity than microarray technology (Yuen et al., Reference Yuen, Wurmbach, Pfeffer, Ebersole and Sealfon2002).
Gene expression during tumor progression and regression
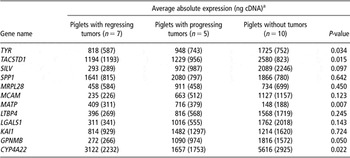
The results of the ANOVA test contrasting absolute RNA expression for 12 genes for piglets with regressing, progressing or without tumors are shown in Table 8. The results of the ANOVA test were significant for TYR, TACSTD1, MATP, GPNMB and CYP4A22, with P-values of 0.034, 0.015, 0.007, 0.050 and 0.022, respectively. With the exception of MATP, the other genes (TYR, TACSTD1, GPNMB and CYP4A22) were downregulated, suggesting that gene expression is under-regulated when comparing piglets with regressing v. progressing tumors. This finding is contrary to our earlier observation using animals with metastatic melanoma v. those that were disease free during the first 6 weeks of life, where TYR, TACSTD1, MATP, GPNMB and CYP4A22 were all upregulated in liver samples of animals with melanoma compared with those without the disease (Table 6). These results illustrate that changes in gene expression may occur in varying patterns during progression and regression of malignant melanoma.
Discussion
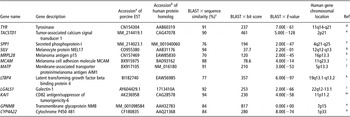
Our study identified genes from diverse functional classes that were differentially expressed in melanoma compared with normal tissue samples, suggesting that numerous cellular processes were transcriptionally modulated during the progression of melanoma in Sinclair swine (Table 5). Among tissues that were tested, the inguinal lymph node and liver had the highest number of genes (6266 and 5917, respectively) that were differentially expressed between melanoma and normal cells (Table 4), suggesting that these tissues are favored as predilection sites by metastatic melanocytes. The genes that were differentially expressed in this study showed ⩾80% sequence similar to genes modulated in human melanomas (Table 7). These molecular similarities are significant as some of the genes that were either induced or repressed in this study are used as biomarkers in human malignant melanoma. The TYR gene associated with melanoma pathogenesis and significantly upregulated in this study is expressed at various levels in human melanoma cells and is considered an important biochemical marker of melanocytes (Kawakami et al., Reference Kawakami, Robbins, Wang, Parkhurst, Kang and Rosenberg1998; Parkhurst et al., Reference Parkhurst, Fitzgerald, Southwood, Sette, Rosenberg and Kawakami1998; Overwijk et al., Reference Overwijk, Lee, Surman, Irvine, Touloukian, Chan, Carroll, Moss, Rosenberg and Restifo1999), while the RAB28 gene, also over-expressed in this study, is expressed in melanocytes and is involved in melanosomal transport and docking (Jager et al., Reference Jager, Stockert, Jager, Gure, Scanlan, Knuth, Old and Chen2000) as well as in the proper sorting of tyrosinase-related protein 1 (TYRP1). The increased transcription of anti-apoptotic genes in this study, including BCL-2 that is elevated in a range of human cancers including melanomas, prostate carcinoma and gliomas (LaCasse et al., Reference LaCasse, Baird, Korneluk and MacKenzie1998; Altieri, Reference Altieri2003; Chawla-Sarkar et al., Reference Chawla-Sarkar, Bae, Reu, Jacobs, Lindner and Borden2004), demonstrates further the similarity in the modulation of gene expression in Sinclair swine and human cancers.
Sequence similarities between pig ESTs spotted on microarrays and human protein homologs of selected genes analyzed by microarrays and quantitative real-time RT-PCR

EST = expressed sequence tags; BLAST = Basic Local Alignment Search Tool; NCBI = National Center for Biotechnology Information.
aFrom GenBank database.
bFrom NCBI protein database.
cSequence similarity between pig ESTs spotted on microarrays and human proteins; performed by BLAST × analysis (Altschul et al., Reference Altschul, Madden, Schäffer, Zhang, Zhang, Miller and Lipman1997) against a non-redundant peptide sequence database collected from the NCBI.
dPerez et al. (Reference Perez, Zhang, Bosserhoff, Buettner and Abu-Hadid2000), Kwon (Reference Kwon1993), Battyani et al. (Reference Battyani, Xerri, Hassoun, Bonerandi and Grob1993), Tripathi et al. (Reference Tripathi, Hearing, Urabe, Aroca and Spritz1992), Overwijk et al. (Reference Overwijk, Lee, Surman, Irvine, Touloukian, Chan, Carroll, Moss, Rosenberg and Restifo1999), Parkhurst et al. (Reference Parkhurst, Fitzgerald, Southwood, Sette, Rosenberg and Kawakami1998) and Kawakami et al. (Reference Kawakami, Robbins, Wang, Parkhurst, Kang and Rosenberg1998).
eWallace et al. (Reference Wallace, Block, Gillanders, Ravenel, Hoffman, Reed, Fraig, Cole and Mitas2005) and Mitas et al. (Reference Mitas, Cole, Hoover, Fraig, Mikhitarian, Block, Hoffman, Hawes, Gillanders and Wallace2003).
fTalantov et al. (Reference Talantov, Mazumder, Yu, Briggs, Jiang, Backus, Atkins and Wang2005), Haqq et al. (Reference Haqq, Nosrati, Sudilovsky, Crothers, Khodabakhsh, Pulliam, Federman, Miller, Allen and Singer2005) and Zhou et al. (Reference Zhou, Dai, Martinka, Su, Zhang, Campos, Dorocicz, Tang, Huntsman, Nelson, Ho and Li2005).
gNordlund et al. (Reference Nordlund, Boissy, Hearing, King and Ortonne1998) and Solano et al. (Reference Solano, Martínez-Esparza, Jiménez-Cervantes, Hill, Lozano and García-Borrón2000).
hRobbins et al. (Reference Robbins, El-Gamil, Li, Topalian, Rivoltini, Sakaguchi, Appella, Kawakami and Rosenberg1995).
iLeslie et al. (Reference Leslie, Zhao, Lachman, Hwu and Bar-Eli2007) and Watson-Hurst et al. (Reference Watson-Hurst and Becker2006).
jLewis et al. (Reference Lewis, Robison, Bastien, Milash, Boucher, Samlowski, Leachman, Dirk Noyes, Wittwer, Perreard and Bernard2005).
kGiltay et al. (Reference Giltay, Kostka and Timpl1997).
lvan den Brûle (Reference van den Brûle, Buicu, Baldet, Sobel, Cooper, Marschal and Castronovo1995).
mTakaoka et al. (Reference Takaoka, Hinoda, Sato, Itoh, Adachi, Hareyama and Imai1998).
nWeterman et al. (Reference Weterman, Ajubi, van Dinter, Degen, van Muijen, Ruiter and Bloemers1995).
oSavas et al. (Reference Savas, Hsu and Johnson2003).
Least square values of average absolute expression (ng cDNA) with standard error (in brackets), and corresponding P-value for contrasting expression of 12 genes for piglets with regressing, progressing and without tumors

aTo analyze gene expression during tumor regression, frozen liver samples from 22 pigs obtained from the historical Sinclair herd (Texas A & M University) were used in quantitative real-time RT-PCR analysis of 12 genes that were upregulated during tumor metastasis.
The contrasting results observed in the expression of genes tested by microarrays and qRT-PCR in liver samples obtained from 6-week-old piglets, compared with gene expression tested by qRT-PCR in the frozen liver samples collected at an older age, suggests a better developed and more mature immune system in the older piglets. The downregulation of TYR, TACSTD1, GPNMB and CYP4A22 during regression and progression of the disease at a later age may be the result of a cell-mediated response that attacks metastatic melanocytes as the animals become older (Greene et al., Reference Greene, Morgan, Rao, Amoss and Arguello1997), and is consistent with the observation that animals with melanoma develop vitiligo with age (Misfeldt and Grimm, Reference Misfeldt and Grimm1994).
The findings in this study may facilitate further discovery of candidate genes and molecular markers that can provide a better understanding of the pathogenesis of metastatic melanoma in Sinclair swine.
Acknowledgments
The authors thank the Nevada Genomics Center for microarray and qRT-PCR assistance. The authors also acknowledge the Nevada Animal Disease and Food Safety Laboratory for their assistance with tissue sample collection and processing. The authors are very grateful to Prof. Craig W. Beattie for providing samples of Sinclair swine.