INTRODUCTION
Many of the fish communities of the Southern California Bight have been well studied. This is particularly true of shallow rocky reefs and sediment sea floors (Horn, Reference Horn1980; Allen, Reference Allen1985). However, with the exception of some plant beds (such as that of giant kelp Macrocystis pyrifera) the fish assemblages of biogenic structures are poorly known.
Sand-dwelling polychaete worms of the genus Chaetopterus produce calcareous tubes that are a conspicuous feature of shallow water southern California sand flats. Densities of worms on these biogenic reefs can reach several hundred individuals per m2 (Zühlke, Reference Zühlke2001; Shucksmith et al., Reference Shucksmith, Hinz, Bergmann and Kaiser2006). It is known that sediments around animal tubes can have greater abundances of bacteria (Eckman, Reference Eckman1985), diatoms (Sanders, Reference Sanders1962), meiofauna (Eckman, Reference Eckman1983) and macrofauna (Woodin, Reference Woodin1978) than surrounding sediments lacking structures. Since the biota associated with tubes can alter sediment stability, the effects include both the direct hydrodynamic consequences of flow alterations and the indirect effects of biogenic changes (Luckenbach, Reference Luckenbach1986). Research in other parts of the world (Van Dolah et al., Reference Van Dolah, Wendt and Nicholson1987; Zühlke, Reference Zühlke2001; Thrush et al., Reference Thrush, Schultz, Hewitt and Talley2002) indicates that these biogenic structures represent ecological islands hosting a different and often more diverse and abundant community than surrounding sandflats and hence contribute to a patchy distribution pattern of the benthic community. Understanding the role of habitat structure for fish on the continental shelf is important because the physical structures created by sessile invertebrates and sediment surface features can be impacted by fishing gear and other human activities (Collie et al., Reference Collie, Escanero and Valentine1997; Freese et al., Reference Freese, Auster, Heifetz and Wing1999; Kaiser et al., Reference Kaiser, Cheney, Spence, Edwards and Radford1999; McConnaughey & Smith, Reference McConnaughey and Smith2000; Stoner & Tigten, Reference Stoner and Titgen2003). However, despite their potential importance to some fish species, no research off the Pacific coast has been done on the fish assemblages of the worm tube structure.
Casual observations made while SCUBA diving around Anacapa Island, located in the north-western part of the Southern California Bight, demonstrated that the island's shallow sandy fringe is surrounded by kelp beds, sandy habitat and a biogenic structure ecosystem of extensive worm tubes (Chaetopterus sp.) harbouring different fish species. These fish rest near or hide inside these biological structures and are well camouflaged; when disturbed, they retreat into local hiding places. Structurally complex benthic habitats have been demonstrated to alleviate predation risk for a wide variety of organisms in diverse systems, providing shelter and also abundant food resources for small fish (Ryer, Reference Ryer1988; Stoner & Titgen, Reference Stoner and Titgen2003; Ryer et al., Reference Ryer, Stoner and Titgen2004). Chaetopterus qualifies as an ‘ecosystem engineer’ in that it changes and/or creates a habitat, which affects other organisms (Jones et al., Reference Jones, Lawton and Shackak1997). It is not clear if some of these species depend on this ecosystem (e.g. food, shelter and/or nursery grounds), and how related they are to the patchiness of this enriching biogenic feature. In many cases, the survivorship of juvenile fish is higher in structurally complex habitats, although results vary with different habitats levels of complexity, and behavioural interactions between species (Bradshaw et al., Reference Bradshaw, Collins and Brand2003).
This study represents the first attempt to determine the: (1) numerical abundance; (2) species composition; (3) body size; and (4) seasonality of the ichthyofauna associated with Chaetopterus worm beds of the north-east Pacific, and their relation with the worm patch size. In this study we tested the prediction that across Chaetopterus beds there would be a positive relationship between habitat structure and fish abundance, and that this relationship resulted from different aspects of the habitat structure.
MATERIALS AND METHODS
Study area
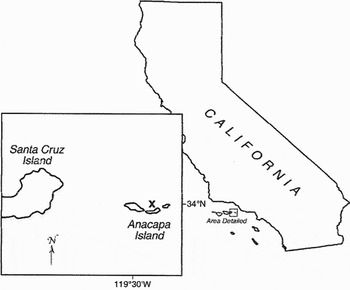
Anacapa is the eastern-most island of the northern Channel Islands and is located at approximately 34o00′N and 119o25′W, 19 km from the southern California mainland in the Southern California Bight (SCB). Anacapa Island is about 8 km long and is formed of three small islets (Figure 1). Waters in the SCB originate both from the California Current and northwards-flowing currents of subtropical origin. Seasonal warming of water in the Bight is from atmospheric heating (Brink & Muench, Reference Brink and Muench1986; Hickey, Reference Hickey1992). Circulation within the Santa Barbara Channel (SBC) is highly variable in time and space and is determined by the relative strengths of wind stress and a deep-water pressure gradient through the channel (Harms & Winant, Reference Harms and Winant1998; Washburn et al., Reference Washburn, Emery, Paduan, Browne, Mitchell and Chaney1999). Generally, warm water from the Southern California Bight enters the SBC's east entrance and flows westward along the channel's northern boundary, and cool water flows through the southern portion of the west entrance then eastward along the islands. Compared to the three islands to the west, waters around Anacapa are relatively warm and less saline, particularly during summer months (Nishimoto, Reference Nishimoto, Browne, Mitchell and Chaney2000; Blanchette et al., Reference Blanchette, Broitman and Gaines2006).
Map of Channel Islands (Santa Barbara Channel) showing Anacapa Island and the study site.

The survey was conducted on the north side of east Anacapa Island on a biogenic structure ecosystem of worm tubes (Chaetopterus sp.) scattered in 12–15 m of water on a sand bottom. The surveys lay within the Anacapa Island State Marine Conservation Area, where fishing (except for pelagic fish and lobsters) is prohibited.
Field Sampling
Fish surveys were conducted at approximately two-month (bimonthly) intervals from September 2007 to July 2008 by two of us (I.R.Z. and M.M.).
Upon arrival at the survey site, an anchor was dropped and the divers swam down the anchor line. The first transect was conducted (beginning about 1 m from the anchor) in a northerly direction that went into deeper waters. In the first of two surveys, a diver (about 1 m above the sea floor) swam along a 30-m transect (laying out a measuring tape as he swam). All of the fish seen within 1 m on either side of the diver were identified, and thus the transect area was 60 m2. We estimated the length of each fish and noted what type of habitat it occupied. We delineated three habitat types: (1) worm tubes; (2) sand; and (3) tube edge. Tube edge was defined as a worm tube within 20 cm of sand. A second diver followed the first and conducted a quadrat-based survey. In this survey, a 1m2 PVC quadrat was placed every 4 m along the tape laid out by the first diver, and thus the quadrat sampled area was 7 m2. The second diver then waited a few minutes and returned to the first deployed quadrat and identified and estimated the length of each fish observed. This diver also estimated what fraction of the quadrat was occupied by worm tubes (WT) on a scale of 0%, 25%, 50%, 75% and 100% WT, which corresponded to the worm tube patch size-class. This dual approach ensured that species more likely to swim away due to an observer were the first ones to be counted and allowed for more precise density estimations of all species (Aburto-Oropeza & Balart, Reference Arbuto-Oropeza and Balart2001; Floeter et al., Reference Floeter, Krohling, Gasparini, Ferreira and Zalmon2007). This process was then repeated in both a westerly direction (along the depth contour) and a southerly direction.
Data analyses
We normalized for the area counted so as not to be misleading between the methods. We used a fixed-factor one-way analysis of variance (ANOVA) and tested for: (1) among-month differences; (2) among-WT patch size differences by quadrat sampling technique; and (3) among-habitat type by swimming sampling technique in mean density and size structure of the most abundant fish species sampled during the one-year study. The fish density of variable length-class across WT patch sizes, habitat type and between months was examined for each species with a 2-factor ANOVA. The transformed fish density was the dependent variable, with month, WT patch size and habitat type as independent variables. Significant effects (P < 0.05) were examined using Tukey's HSD post hoc multiple-comparison test. Whether WT patch size correlated with fish density and fish length, and with the fish density of each length was tested with Pearson's product-moment correlation coefficient. When necessary, density data were transformed (log x + 1) to stabilize variances and meet normality and heterogeneity assumptions (Underwood, Reference Underwood1997; Zar, Reference Zar1999).
ANOVA and product-moment correlation tests were performed with GraphPad Instat3.
RESULTS
A total number of 7 species and 290.11 fish/m2 were sampled at Anacapa Island from August 2007 to July 2008 (N = 8 sample dates) through swimming and quadrat sampling techniques, 41.26 and 248.85 fish/m2, respectively (Table 1). The quadrat technique sampled a higher number of individuals including the dominant species Rhinogobiops nicholsii (blackeye goby) and Chaenopsis alepidota (orangethroat pikeblenny), which lives inside the worm tube patches.
Sampled species, density, size-range, habitat related to the worm tube patch (E, edge; M, middle; S, sand) and occurrence months through each sampling technique.

Quadrat sampling technique
Four species were sampled by the quadrat technique: Rhinogobiops nicholsii, Chaenopsis alepidota, Citharichthys stigmaeus (speckled sanddab) and Heterodontus francisci (horn shark) (Table 1). The two most abundant species R. nicholsii and C. alepidota, were analysed for among-WT patch size and among-month differences in mean density/m2 and size structure during the one-year period study.
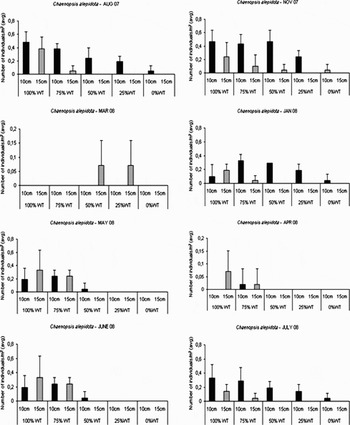
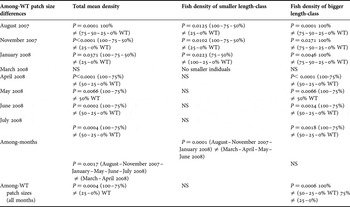
Chaenopsis alepidota showed a significantly higher number of individuals (>60%) on larger patch size on all studied months (Figure 2; Table 2). Throughout the study, all sizes of C. alepidota were observed preferentially on larger patches with significantly higher numbers of the larger ones on 100% and 75% WT. Smaller individuals were significantly more abundant on >50% WT in August 2007, November 2007 and January 2008 (Table 2). In March 2008 all the patch sizes were smaller than 50% WT and the sampled individuals were the larger fish (Figure 2). In August 2007, November 2007, January 2008 and July 2008, the number of smaller individuals was higher than the larger ones, while in March, April, May and June 2008 the number of the larger individuals was higher (Figure 2).
Average number of individuals/m2 and standard deviation of Chaenopsis alepidota of each size-class and worm tube patch size sampled by the quadrat technique on every studied month (N = 6 transects/month).

ANOVA and Tukey's HSD post hoc multiple-comparison results among-worm tube (WT) patch size differences in total mean density and size structure of Chaenopsis alepidota (smaller and bigger length-class) on each studied month, among-month differences and with all studied months by quadrat sampling technique.

Significant temporal differences among months occurred on total mean density and on smaller length-class density of Chaenopsis alepidota with the lowest values in March 2008 and April 2008 (Table 2). The highest mean densities occurred in August 2007 and November 2007 and then decreased in January 2008 followed by March and April 2008 with less than 0.86 inds/m2 (Table 2). From May 2008 on, the densities of C. alepidota increased again with higher values, mainly on 100% and 75% WT. The smaller patch sizes (<50% WT) showed a lower temporal variation. Considering all studied months, fish density differences among-WT patch sizes revealed significant higher numbers on 100% and 75% WT for total mean density and for bigger length-class individuals (Table 2).
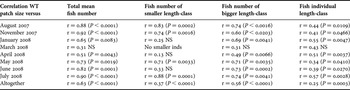
The WT patch size showed a very significant and positive correlation with the total mean fish density, with the fish density of each length-class, and with the fish length of each individual on almost all studied months except March 2008, and also with all months together (N = 31.14 inds/m2) (Table 3). All sizes of Chaenopsis alepidota individuals preferred larger worm tube patches.
Pearson's product-moment correlation coefficient between worm tube (WT) patch size with Chaenopsis alepidota total average density and with the density of each length-class, and with individual length-class by quadrat sampling technique on each studied month and altogether. Density data were log x +1 transformed.

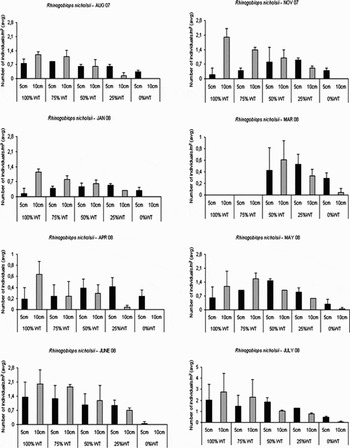
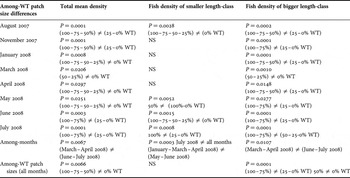
Throughout the study, densities of Rhinogobiops nicholsii were highest on larger WT patch sizes (Figure 3), with significantly lower densities mainly on 0% and 25% WT (Table 4). In March 2008, the patch sizes were all smaller than 50% WT and there were higher densities of larger individuals on 50% WT and of smaller ones on 25% WT (Figure 3). Larger individuals were present in significantly higher numbers primarily on 100–75% WT, while smaller fish were equally present on both the largest and intermediate sized patches (Table 4).
Average number of individuals/m2 and standard deviation of Rhinogobiops nicholsii of each size-class and worm tube patch size sampled by the quadrat technique on every studied month (N = 6 transects/month).

ANOVA and Tukey's HSD post hoc multiple-comparison results among-worm tube (WT) patch size differences in total mean density and size structure of Rhinogobiops nicholsii (large versus small size-class) in each month, among-month differences, and with all studied months by quadrat sampling technique.

Considering all studied months, fish density differences among-WT patch sizes revealed significantly higher numbers on 100%, 75% and 50% WT for total mean density and for larger length-class individual number, while the smaller ones did not differ among worm tube patch sizes (Table 4).
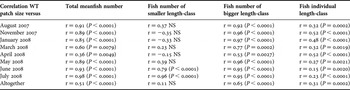
Total mean density of R. nicholsii was positively correlated to WT patch size (Table 5). Larger individuals preferred larger patches. The negative and the non-significant correlation values of the WT patch sizes with the smaller individuals showed their preference for 50% and 25% WT patch sizes (Table 5).
Pearson's product-moment correlation coefficient between worm tube (WT) patch size with Rhinogobiops nicholsii total average density and with the density of each length-class, and with individual length-class by quadrat sampling technique on each studied month and altogether. Density data were log x +1 transformed.

Swimming Sampling Technique
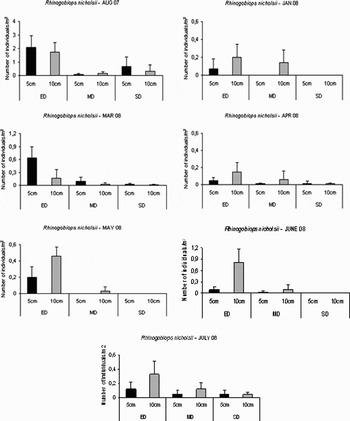
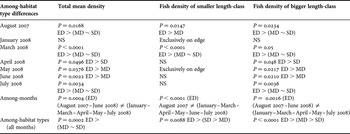
Seven species were observed in the swimming technique survey (Table 1). The dominant species, R. nicholsii, demonstrated a significantly higher number of individuals (60–95%) on the edge habitat than on the middle of the worm tube patches or on the nearby sand (Figure 4; Table 6). All sizes of individuals preferred the edge habitat, but larger fish showed consistently significant higher differences between the habitats (Table 6). In most months, larger fish tended to inhabit patch edge and middle, and smaller fish were found on the surrounding sand (Figure 4). Considering all studied months, fish density differences among-habitat type revealed significant higher numbers on the edge for total mean density and both length-class individual numbers (Table 6).
Average number of individuals/m2 and standard deviation of Rhinogobiops nicholsii of each size-class and habitat type (ED, edge; MD. middle; SD, sand) related to the worm tube patches sampled by the swimming technique on every studied month (N = 6 transects/month).

ANOVA and Tukey's HSD post hoc multiple-comparison results among-habitat type differences in total mean density and size structure of Rhinogobiops nicholsii (smaller and bigger length-class) on each studied month, among-month differences and with all studied months by swimming sampling technique (ED, edge; MD, middle, SD, sand).

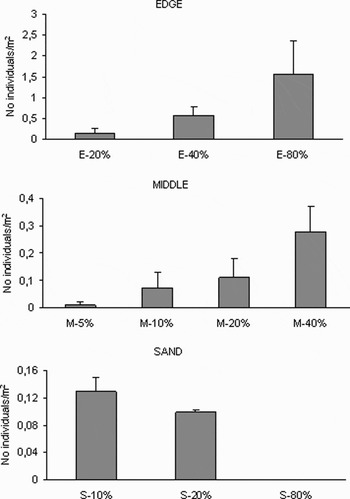
The edge and middle habitats showed a positive and significant (P < 0.05) correlation with the total mean fish density (r = 0.52, r = 0.54, respectively), while the sand habitat fraction was negatively correlated (r = –0.32) (Figure 5). Relatively few R. nicholsii were present more than 20 cm away from worm tubes and none were seen beyond 6 m (Figure 5).
Average individual number/m2 and standard deviation of Rhinogobiops nicholsii on the sampled transect fraction of each habitat type related to the worm tube patches by swimming sampling technique on all studied months (N = 6 transects/month).

DISCUSSION
In this study we tested the prediction that fish median density and size varied with the worm tube (WT) patch size and were different between WT patch habitat, edge habitat and sand habitat. In general, larger worm mats harboured higher densities of fish, although there were some intraspecific differences. For example, while larger Chaenopsis were almost absent from small mats, smaller individuals could still be found. The occurrence of smaller size fish on habitat of lower prey resource value might be related to intraspecific competition with the larger individuals occupying prime feeding or sheltering habitats.
The abundance of R. nicholsii was also significantly higher with high coverage of habitat (defined as WT patch size) but only for larger individuals. According to Steele (Reference Steele1997) and Andrews & Anderson (Reference Andrews and Anderson2004), recruitment of the blackeye goby increases with the amount of habitat in the form of rocky substratum at a small scale and our results generally do not support these previous works, considering the Chaetopterus beds as small units of complex reefs. It was observed that the blackeye goby had similarly higher densities of smaller individuals in habitat with both intermediate and high coverage of Chaetopterus tube habitat. This may indicate that there is no further advantage conveyed by greater amounts of habitat, but might depend on the magnitude of recruitment.
Rhinogobiops nicholsii is a small (<100 mm standard length (SL)) reef fish that is common along the Pacific coast of North America (Miller & Lea, Reference Miller and Lea1972). The species is territorial, but territories overlap, the greatest overlap occurring between individuals that differ considerably in size (Cole, Reference Cole1984). The fish population density of R. nicholsii differed significantly between worm tube patch, edge and sand habitat. Although all size-classes preferred the edge habitat on the Chaetopterus bed, in general, larger individuals occupied this habitat. According to Cole (Reference Cole1982) and Breitburg (Reference Breitburg1987), social organization and territory size is based upon dominance relationships that are determined largely by body size. Population density varied between the ‘inside’ and ‘edge’ of Chaetopterus beds, where the smaller (<5 cm SL) and younger individuals were hindered in reaching the middle of the patch by larger, older individuals that maintained the territories.
The distribution and abundance of organisms depends to some extent on spatial variation in the physical structure of the available habitat (Bell et al., Reference Bell, McCoy and Mushinsky1991; Rotenberry & Wiens, 1998). Habitat structure is important in predicting the abundance and distribution of many taxa. Such relationships are particularly evident in the early life stage of reef fish in that recently settled individuals often appear to select complex habitats (Roberts & Ormond, Reference Roberts and Ormond1987; Tupper & Boutilier, Reference Tupper and Boutilier1997). At Anacapa Island the prevalence of positive and significant correlations between the abundance of smaller individuals of the dominant species R. nicholsii and specific habitat features (e.g. edge) suggests that the abundance and distribution of juveniles might be habitat-dependent (Carr, Reference Carr1991, Reference Carr1994; Levin, Reference Levin1991; Tolimieri, Reference Tolimieri1995; Steele, Reference Steele1999; Holbrook et al., Reference Holbrook, Forrester and Schmitt2000). Sources of variation in recruitment can be modified by particular habitat features. It is largely unknown whether recruitment of reef fish differs substantially between the edge and the inside of reefs; however, juvenile señorita Oxyjulis californica have been found at higher densities on the ecotone of artificial reefs (Anderson et al., Reference Anderson, DeMartini and Roberts1989) and the recruitment of some rockfish occur at the edges of rocky reefs (Carr, Reference Carr1991). At the scale of individual reefs, the ‘edge’ and the ‘inside’ of a reef may affect the abundance of reef fish populations differently, analogous to the effect of the habitat fragmentation in many terrestrial populations (Temple, Reference Temple, Verner, Morisson and Ralph1986; Paton, Reference Paton1994; Tewksbury et al., Reference Tewksbury, Heil and Martin1998). The effects of ecotone are topical because of increased interest in habitat fragmentation and in how variability in the perimeter-to-area ratio may affect the demography of populations (Temple, Reference Temple, Verner, Morisson and Ralph1986; Paton, Reference Paton1994; Tewksbury et al., Reference Tewksbury, Heil and Martin1998; Hovel & Lipcius, Reference Hovel and Lipcius2001). The distribution of newly settled fish among different types of habitats within a reef may result from food availability (Levin et al., Reference Levin, Petrik and Malone1997) and the distribution of predators (Hixon, Reference Hixon and Sale1991). It is important to add intraspecific competition between older and younger individuals of R. nicholsii, as observed here.
Affinity for structured habitat in the field could be also related to availability of foods. Chaenopsis and Rhinogobiops consume primarily motile crustaceans such as mysids, amphipods, cumaceans and small shrimps (Kotrschal & Thomson, Reference Kotrschal and Thomson1986). Small crustaceans such as these are often most abundant in structurally complex habitats (Orth et al., Reference Orth, Heck and Van Montfrans1984; Bostroem & Mattila, Reference Bostroem and Mattila1999). While there were no food cues in our study, fish may choose habitats that typically carry large numbers of appropriate prey.
Describing fish–habitat relationships and understanding the underlying mechanisms is complicated by ontogenetic changes in habitat requirements and the spatial scales over which mobile individuals integrate habitats (Thrush et al., Reference Thrush, Schultz, Hewitt and Talley2002). As a first step to identifying the relationship between benthic habitat and fish, we aim to determine the importance of habitat structure in influencing the fish abundance. By determining the relationship between the fish abundance and the small-scale elements of habitat structure, we can identify the need for future work to elucidate mechanisms as well as providing information to resource managers on the importance of habitat diversity for different life stages of exploited and non-exploited populations.
Emergent structures may play an important role in the ecology of some juvenile flatfish and it is suggested that the removal of these biological structures by towed fishing gear and other anthropogenic and/or natural disturbance may influence their distribution patterns as fish redistribute to less preferred habitat (Stoner & Tigten, Reference Stoner and Titgen2003; Ryer et al., Reference Ryer, Stoner and Titgen2004). Biogenic structures contribute to marine habitat complexity by increasing the three-dimensional relief of seabed topography (Peatlle & Hoare, 1981). Dredging and other types of bottom fishing reduces habitat complexity by impacting sessile epifauna species, and by extension their associated organisms (Auster, Reference Auster1998; Jennings & Kaiser, Reference Jennings and Kaiser1998; Kaiser et al., Reference Kaiser, Collie, Hall and Poiner2002; Bradshaw et al., Reference Bradshaw, Collins and Brand2003). The implications of this disturbance could be a decrease of biodiversity and/or species abundance (including commercial species) by removing upright epifauna (Bradshaw et al., Reference Bradshaw, Collins and Brand2003). Our results revealed that complex habitat structure had a positive influence on the abundance of juvenile and adult C. alepidota and R. nicholsii, and suggest that these structured areas are preferentially utilized. This finding highlights the potential for disturbance of such structures (by, for example, trawling or dredging) to affect the abundance of those fish. Small changes in habitat complexity can have significant effects on survivorship.
Rhinogobiops nicholsii seldom ventured more than about 0.5 m away from rocky substrate because they use associated crevices and excavated burrows to hide from predators. At Anacapa Island, there was a sharp drop in density of R. nicholsii at greater than 20 cm away from worm tubes, and no R. nicholsii beyond 6 m away from structure. Chaenopsis alepidota, that inhabits Chaetopterus tubes in quiet sand flats (Stephens et al., Reference Stephens, Singer and Targgart1989), was not recorded at Anacapa Island when the patch size was less than 50% tube coverage.
The tubiculous, suspension feeding polychaete, Chaetopterus cf. variopedatus of southern Chesapeake Bay, Virginia recruits in the summer and grows rapidly (Thompson & Schaffner, Reference Thompson and Schaeffner2001), while Florida populations of reef-building tube worms may spawn semi-continuously, without a seasonal trend, throughout most of the year (Zale & Merrifield, Reference Zale and Merrifield1989). At Anacapa Island, we anchored in nearly the same spot each sampling time and there was a clear seasonal trend in tube coverage, with more worm tubes in summer/autumn than winter/spring. Chaenopsis alepidota and R. nicholsii density followed this temporal trend with higher values during summer and lowest ones in winter and this pattern remained consistent among different tube coverage. The results further demonstrate that temporal variation in population dynamics might lead to significant temporal variability in the relative importance of benthic suspension feeder effects for ecosystem function (Thompson & Schaffner, Reference Thompson and Schaeffner2001).
This study demonstrates a high degree of association between two reef fish and Chaetopterus beds. At the small scales studied (i.e. centimetres to metres) positive associations were more common than negative ones. These biogenic habitat structures represent ecological islands hosting a different and often more diverse and abundant community than surrounding sandflats. Reef fish richness and abundance of the two most abundant species C. alepidota and R. nicholsii were higher among tube aggregations with more than 25% of WT patch coverage. All sizes of C. alepidota and the largest R. nicholsii individuals preferred heavier WT patch sizes (>75% WT), while the smaller R. nicholsii preferred smaller patches (<50% WT). Hence, it is concluded that Chaetopterus tubes act as a habitat engineer that alters the composition and abundance of some reef fish species and contributes to its patchy distribution pattern. The study supports an accumulating body of evidence that emergent structure, in otherwise low-relief benthic habitats, may play an important role in the ecology of some reef fish species.
We suggest that Chaetopterus beds can be thought of as a keystone species (sensu Dame, 1996 in Thompson & Schaffner, Reference Thompson and Schaeffner2001) and should be included in future studies or models of the Channel Islands. The importance of benthic habitats is now being taken in account in recent conservation and fisheries legislation in the United States, where areas of ‘essential fish habitats’ must now be identified and protected (Bradshaw et al., Reference Bradshaw, Collins and Brand2003).
Links between habitat structure and growth, survivorship and recruitment of fish to fisheries need to be explored. However, our study on habitat preference makes it clear that the presence of biological structures in low-relief sedimentary habitats can have critical functional significance even for reef fish. These important habitat features may need to be identified and protected.
ACKNOWLEDGEMENT
Thanks to the Brazilian agency CAPES for the post-doctoral financial support to I.R.Z. (grant number CAPES 0732/07-9).