Introduction
The analysis of the long-term climate records is strengthening the evidence that warming of the climate system is unequivocal. Observations of increases in global average air and ocean temperatures, widespread melting of snow and ice and rising global average sea level confirm the current understanding of an ongoing planetary process.
The Fourth Assessment Report (AR4) finds that it is ‘very likely’ that emissions of heat-trapping gases from human activities have caused ‘most of the observed increase in globally averaged temperatures since the mid-20th century.’ Evidence that human activities are the major cause for recent climate change is even stronger than in the previous Intergovernmental Panel on Climate Change (IPCC) Third Assessment Report published in 2001.
The current influence of climate changes on the environment and on human activities is still not well understood because of the insufficient availability of long-term observational data of natural and human ecosystems.
Global climate temperature changes for the end of the 21st century are expected to increase significantly, with geographical patterns similar to those observed over the past several decades.
Future climate change impacts are expected to affect freshwater resources, land and marine ecosystems, food production and human health.
The uncertainty in long-term global climate change projections is reflected in the projection at the regional and subregional scales, where the assessment of the impacts is a major issue for policy makers, civil society and stakeholders of specific sectors.
The extent and severity of the possible future impacts are critically dependent on the mitigation and adaptation measures that will be decided and implemented at the international and national levels to prevent and adapt to the risk of climate change. There is a significant risk that natural hazards like droughts, floods, wildfires may increase their occurrence in future and that food security and water availability will be negatively affected by climate changes.
In 1992, the United Nations Framework Convention on Climate Change (UNFCCC) was adopted as the basis for a global response to the problem, with the ultimate objective to stabilize greenhouse gas (GHG) concentrations in the atmosphere at a level that will prevent dangerous human interference with the climate system.
The climate system
The climate system is a complex, interactive system consisting of the atmosphere, land surface, snow and ice, water bodies and living things. Under the effects of solar radiation and the radiative properties of the Earth's surface, the climate is determined by interactions between the components of the climate system. The interaction of the atmosphere with the other components plays a dominant role in forming the climate, and, consequently, climate is usually described by indicators such as the mean and the variability of the atmospheric temperature, precipitation and other variables over a period of time. According to the World Meteorological Organization (1989), the reference base to be used to assess climate changes is computed as averages of climatological data for consecutive periods of 30 years.
The climate system evolves in time under the influence of forcing factors that affect climate and determines its own dynamics. Forcing includes natural phenomena such as solar activity variations, volcanic eruptions and human-induced changes in atmospheric composition and land cover. Three fundamental ways may change the radiation balance that determines the Earth climate:
1. the incoming solar radiation (e.g. by changing the Earth's orbit or the Sun's radiation itself);
2. the fraction of solar radiation that is reflected (called ‘albedo’; e.g. by changing cloud cover, atmospheric particles or vegetation); and
3. the longwave radiation emitted from the Earth back toward space (e.g. by changing GHG concentrations).
Natural changes of climate
The changes in the Earth's orbital parameters are the main causes for the variations in the incoming solar radiation and in the long-term glacial–interglacial cycles observed by different paleoclimate records.
Periodic changes in parameters of the Earth's orbit around the Sun modify the seasonal and latitudinal distribution of the incoming solar radiation at the top of the atmosphere with quasi-periodic cycles:
1. the obliquity (tilt) of the Earth's axis with periodicity of 41 kyr;
2. the eccentricity of the Earth's orbit with periodicity of 400 and approximately 100 kyr; and
3. the general precession of the equinoxes and the longitude of perihelion of about 19 and about 23 kyr.
The most remarkable paleoclimate records cover the last 740 kyr in ice cores (European Project for Ice Coring in Antartica (EPICA) community members, 2004; Figure 1). The last 430 kyr, which are the best documented, are characterized by 100 kyr glacial–interglacial cycles of very large amplitude, as well as large climate changes corresponding to other orbital periods.
Variations of deuterium (δD; black), a proxy for local temperature, and the atmospheric concentrations of the greenhouse gases, carbondioxide (CO2; red), methane (CH4; blue) and nitrous oxide (N2O; green), derived from air trapped within ice cores from Antarctica and from recent atmospheric measurements (Source: IPCC, 2007a, Chapter 6).

The widely accepted orbital theory by Milankovitch suggests that glacial–interglacial cycles in the last million years occurred in response to orbital forcing (Berger, Reference Berger1988). The Milankovitch theory proposes that ice ages are triggered by minima in summer insulation near 65°N, enabling winter snowfall to persist all year, and therefore accumulate to build Nothern Hemisphere (NH) glacial ice sheets. For example, the onset of the last ice age corresponds to a 65°N mid-June insulation approximately 40 W/m2 lower than today.
The large response of the Earth's climate system to the relatively small solar perturbation implies a strong positive amplification of this forcing. This amplification has very likely been influenced mainly by changes in GHG concentrations and ice-sheet growth and decay, but also by ocean circulation and sea ice changes, biophysical feedbacks and aerosol (dust) loading.
The EPICA Earth's paleoclimate record also shows high-frequency variability and short-term abrupt changes that cannot be explained by orbital changes. Natural climate variability during the last 1 kyr, in response to solar activity cycles, is determined by many processes and feedbacks involving dynamic interactions among the climate components. The direct influence of solar irradiance variability is considered negligible, but there is also empirical evidence that centennial and decadal solar irradiance changes are associated with climatic changes through mechanisms involving cosmic rays’ influence on radiative forcing. The solar activity cycles are considered among the main causes of the climate anomalies that occurred in the NH during the middle age (warm anomaly) and between 1600 and 1800 (cold anomaly; IPCC, 2007a, Chapters 6, 9). Notwithstanding the recent progress made, the level of scientific understanding of the indirect influence of the solar irradiance variability on global climate is considered still low (IPCC, 2007a, Paragraph 2.7.1.3).
The paleoclimate ice core record also provides information about the past atmospheric concentration of GHGs, indicating that the rate of increase over the past century of the GHGs such as carbon dioxide (CO2), methane (CH4) and nitrous oxide (N2O) is very likely unprecedented in at least the past 16 kyr. Pre-industrial variations of atmospheric GHG concentrations observed during the last 10 kyr were small compared with the industrial era GHG increases, and were likely mostly because of natural processes. It is very likely that the current atmospheric concentrations of CO2 (389 ppm) and CH4 (1774 ppb) exceed by far the natural range of the last 650 kyr. Ice core data indicate that CO2 varied within a range of 180 to 300 ppm and CH4 within 320 to 790 ppb over this period.
Anthropogenic cause of climate change
The global Earth climate is determined by the balance between the incoming shortwave solar radiation and the outgoing longwave earth radiation. The emission of longwave radiation emitted from the Earth back toward space is determined by two processes that can and have been affected by the interference of the human activities:
1. land-use change and deforestation leading to surface albedo changes,
2. fossil fuel combustion and other gases emissions leading to their atmospheric concentration increase.
Human activities since the industrial era have altered the nature of land cover over the globe, principally through changes in croplands, pastures and forests. They have also modified the reflective properties of ice and snow through the deposition of airborne particles. Overall, it is likely that more solar radiation is now being reflected from the Earth's surface as a result of cover changes, resulting in a negative forcing with a small cooling effect on the global climate (IPCC, 2007a, Paragraph 2.2, 2.5).
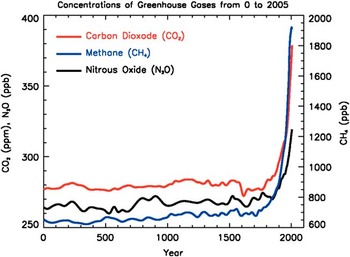
The GHGs atmospheric concentration increase (Figure 2) is because of fossil fuel use in transportation, building, heating and cooling and the manufacture of cement and other goods. In addition, deforestation releases CO2 and reduces its uptake by plants. The atmospheric concentration increase of CH4 is due to human activities related to agriculture, natural gas distribution and landfills. CH4 is also released from natural processes that occur, for example, in wetlands. CH4 concentrations are not currently increasing in the atmosphere, because growth rates decreased over the last two decades. N2O is also emitted by human activities such as fertilizer use and fossil fuel burning. Natural processes in soils and the oceans also release N2O.
Atmospheric concentrations of important long-lived greenhouse gases over the last 2000 years. Increases since about 1750 are attributed to human activities in the industrial era. Concentration units are parts per million (ppm) or parts per billion (ppb) (Source: IPCC, 2007a, Chapter 2).

The atmospheric GHGs concentration increase is the result of the altered balance between natural sources and sinks. The high concentration will persist in the atmosphere for centuries, and therefore their warming effect will last for a long time after emissions are reduced.
In the last few decades, global GHG's emissions because of human activities have grown with an increase of 70% between 1970 and 2004 (Figure 3).
(a) Global annual emissions of anthropogenic green house gases (GHGs) from 1970 to 2004.5, (b) share of different anthropogenic GHGs in total emissions in 2004 in terms of CO2-eq and (c) 100 shares of different sectors in total anthropogenic GHG emissions in 2004 in terms of CO2-eq (forestry includes deforestation) (Source: IPCC, 2007a, Synthesis report).

CO2 is the most important anthropogenic GHG. Its annual emissions have grown by approximately 80% between 1970 and 2004 – from 21 to 38 gigatons (Gt) – and represented 77% of total anthropogenic GHG emissions in 2004 (Figure 3). The different GHGs can be grouped within a single indicator taking in account the different warming potentials as CO2 equivalent concentration (CO2-eq) that would cause the same level of radiative forcing as the given mixture of GHG concentrations. The rate of growth of CO2-eq emissions was much higher during the recent 10-year period of 1995 to 2004 (0.92 Gt CO2-eq per year) than during the previous period of 1970 to 1994 (0.43 Gt CO2-eq per year).
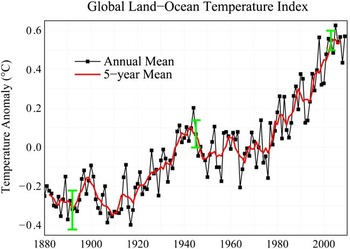
The warming effect of the increase of GHGs atmospheric concentration is estimated equivalent to a radiative forcing of +2.63 W/m2. This warming is partly counterbalanced by other cooling process caused by anthropogenic activities, including land cover change, leading to a net radiative forcing of +1.6 W/m2. The radiative forcing is considered the main cause of the observed global mean surface temperatures rise of 0.74°C ± 0.18°C over the time period 1906 to 2005, when estimated by a linear trend. The rate of warming over the last 50 years is almost double than that over the last 100 years The observed warming trend is not linear and the warmest years in the instrumental record of global surface temperatures are 1998 and 2005, with 1998 ranking first and second; 2002, 2003 and 2004 are the third, fourth and fifth warmest years in the series, respectively. The years between1995 and 2006 – the exception being 1996 – rank among the 12 warmest years on record since 1880 (IPCC, 2007a, Paragraph 3.2).
The warming of the atmosphere (Figure 4) is unequivocal and ‘most of the observed increase in global average temperatures since the mid-20th century is most likely due to the observed increase in anthropogenic greenhouse gas concentrations. It is likely that there has been significant anthropogenic warming over the past 50 years averaged over each continent (except Antarctica)’ (IPCC, 2007a, Paragraph 9.4).
Line plot of global mean land–ocean temperature index, from 1880 to present, with the base period 1951 to 1980. The dotted black line is the annual mean and the solid red line is the 5-year mean. The green bars show uncertainty estimates (this is an update of Fig. 1A in Hansen et al., Reference Hansen, Sato, Ruedy, Lo, Lea and Medina-Elizade2006).

On current trends of GHGs concentration increase, average global temperatures will rise by 0.1°C per decade over the next two decades, but twice as much warming (0.2°C per decade) would be expected if GHGs emissions will not be substantially reduced soon. The Earth will be committed to several degrees more warming if GHGs emissions continue to grow, reaching global CO2-eq stabilization level of 450 ppm or higher (IPCC, WG 1 AR4, Technical summary).
Observed climate change impacts
Climate is a key factor in determining different characteristics and distributions of natural and managed systems. Many aspects of climate influence various characteristics and distributions of physical and biological systems, including temperature and precipitation, and their variability. Physical and biological responses to changing temperatures are studied more and are often better understood than responses to other climate parameters. Precipitation has much larger spatial and temporal variability than temperature, and it is therefore more difficult to identify the impact it has on changes in many systems. Mean temperature (including daily maximum and minimum temperature) and the seasonal cycle in temperature over relatively large spatial areas show the clearest signals of change in the observed climate (IPCC, 2007a, Paragraph 3.2.2.7).
The relationship between climate changes and the physical, biological and human environments, is usually referred to as impacts. The impacts described by an increasing body of observations give a collective picture of a warming world (IPCC, 2007b, Paragraph 1.3).
Impacts in physical systems:
1. Cold regions are experiencing snow cover decrease, mass loss of glaciers and ice caps, river and lakes ice cover decrease and seasonal and permanent frozen ground decrease permafrost in response to warming.
2. River discharge, as well as drought and heavy rains, indicate that hydrological conditions have become more intense causing increased runoff and streamflow, particularly in river basins fed by glaciers and snow melt.
3. In many coastal regions, sea level rise, wave heights and increase intensity of storms are increasing coastal erosion and losses of wetlands.
4. Documented trends in floods show no evidence for a globally widespread change.
5. Globally, very dry areas have more than doubled since the 1970s because of a combination of ENSOFootnote 1 events and surface warming, whereas very wet areas declined by approximately 5%.
Impacts in biological systems:
1. In marine ecosystems, many observed changes in phenology and distribution have been associated with rising water temperatures, changes in salinity, oxygen levels and circulation. Although there is increasing evidence for climate change impacts on coral reefs, separating the impacts of climate-related stresses from other stresses (e.g. overfishing and pollution) is difficult.
2. Freshwater ecosystems are showing changes in organism abundance and productivity, range expansions and phenological shifts (including earlier fish migrations) that are linked to rising temperatures.
3. Terrestrial biological systems revealed notable impacts of global warming over the last three to five decades, such as earlier spring and summer phenology, longer growing seasons in mid- and higher-latitudes, production range expansions at higher elevations and latitudes.
Preliminary evidence for impacts in human systems:
1. In temperate regions, agriculture experienced a reduced risk of frost, longer growing season duration, increased biomass, higher quality (for grapevines, a climate-sensitive crop) and insect expansion. Increased forest fire occurrences are in agreement with regional warming. The present impacts on agriculture and forestry are of limited economic consequence and appear to lie within the ability of the sectors to adapt.
2. In the Sahelian region of Africa, because of warmer and drier conditions, agriculture experienced a reduced length of growing season with detrimental effects on crops.
3. Health-impact studies show good evidence of changes in the northward range of some disease vectors and changes in the seasonal pattern of allergenic pollen. There is not yet any clear evidence that climate change is affecting the incidence of human vector-borne diseases, in part because of the complexity of these disease systems. High temperature has been associated with excess mortality during the 2003 heat wave in Europe. Declines in winter mortality are apparent in many temperate countries, primarily because of increased adaptation to cold.
4. Global losses reveal rapidly rising costs because of extreme weather-related events since the 1970s. For specific regions, there is evidence for an increase in the occurrence of the most extreme floods in some of the largest rivers.
The IPCC policy summary regarding the observed impacts of climate change states that ‘Observational evidence from all continents and most oceans shows that many natural systems are being affected by regional climate changes, particularly temperature increase.’
Current knowledge about future climate change impacts on agriculture and animal production
In recent years, many simulations of the global climate response to the SRES (Special Report on Emission Scenarios) emission scenarios have been completed with Atmospheric Ocean General Circulation Models (AOGCMs). The resulting climate scenarios together with atmospheric composition, sea level, socioeconomic changes, land-use changes scenarios have been used to assess possible future changes in natural and managed systems. The IPCC AR4 assessed the impacts on different systems and regions in the absence of any climate mitigation action. Focusing on agriculture and animal production, the following conclusion summarize the current scientific understanding:
1. The impacts of climate change on agriculture and animal production is strictly linked to evolution of freshwater systems and their management. Fresh water impacts are mainly because of the observed and projected increases in temperature, evaporation, sea level and precipitation variability. More than one-sixth of the world's population live in glacier- or snowmelt-fed river basins and will be affected by a decrease in water volume stored in glaciers and snowpack, an increase in the ratio of winter to annual flows, and possibly a reduction in low flows caused by decreased glacier extent or melt-season snow water storage (IPCC, 2007b, Paragraph 3.4.1, 3.4.3). The number of people living in severely stressed river basins is projected to increase significantly and semi-arid and arid areas are particularly exposed to the impacts of climate change on freshwater.
2. Agriculture production in humid climates’ crop yields may increase for moderate temperature rises (2°C to 3°C), but then decline with greater amounts of warming. At 4°C and above, global food production is likely to be seriously affected.
3. Animal production will be negatively affected by the projected changes in the frequency and severity of extreme climate events. Subsistence farmers, pastoralists will suffer complex, localized impacts of climate change.
4. Natural ecosystems and their services will be affected by an unprecedented combination of change in climate, associated disturbances (e.g. flooding, drought, wildfire, insects, ocean acidification) and other global change drivers (e.g. land-use change, pollution, over-exploitation of resources).
5. The projected increased extension of drylands will enhance the risk of desertification, the dryland being the most vulnerable to degradation processes. As consequence of climate change and desertification, declining crop yields, especially in Africa, could leave hundreds of millions without the ability to produce or purchase sufficient food.
The most severe impacts on the agriculture and animal production sectors are expected to come from the changes in the frequency and severity of extreme climate events that will have more serious consequences than will changes in the mean values of temperature and precipitation.
The IPCC AR4 was created with large number of contributors, both scientists and governmental representatives. Nevertheless, a number of scientists, as legitimate scientific debate, have made statements through the media, Internet (http://climatechangeskeptic.blogspot.com/) and book publication that conflict with the conclusions of climate change assessment as summarized by IPCC and especially with the attribution of the cause and assessment of climate change to human actions. Skeptic objections, although not based on peer review works, have been discussed in many occasions and should deserve more attention by climate scientists to avoid the impression that the opinions of the minority are obscured because they were not in line with the majority. International scientific consensus is continuing to support the IPCC conclusions but many unanswered questions remain to be addressed, especially in relation to the understanding of future climate change impacts and of their economic implications.
Conclusions
It is no longer possible, according to current scientific understanding, to prevent the climate change that will take place over the next two to three decades because of the increased concentration of GHGs. The main concern, now, is to avoid that global warming will exceed a rise of 2°C that is considered the safety limit to prevent very dangerous impacts for ecosystems and production activities.
It is necessary to protect our societies and economies from climate change impacts by identifying mitigation (GHG emission reduction) and adaptation (information, improved planning, more climate-resilient crops and infrastructure) strategies.
If no action is taken to reduce GHGs emissions as soon as possible, the future concentration of GHGs in the atmosphere could overcome the double pre-industrial level as early as 2035, virtually committing us to a global average temperature rise of over 2°C. The impacts of the rise of temperature above the known natural variability are unpredictable but will certainly be very dangerous with serious impacts on economy, environment and human life.
All countries will be affected. The most vulnerable developing countries will suffer earliest and the most, even though they are least responsible of climate change. The costs of extreme weather, including floods, droughts and storms, are already rising, including for rich countries.
The UNFCCC Kyoto protocol identified different mechanism for climate change mitigation, but its implementation objectives are still very far to achieve the stabilization of GHGs below the threshold level of the doubled pre-industrial level. The risks of the worst impacts of climate change can be substantially reduced if GHG levels in the atmosphere can be stabilized between 450 and 550 ppm CO2-eq. This target has not been politically agreed by country parties of UNFCCC who decided to not proceed along the track of the Kyoto protocol of legally binding agreement.
Existing assessments stated that stabilization of GHGs is technically and economically difficult but manageable and that delay would be dangerous and much more costly (IPCC, 2007c). The European Union (EU) decided in 2008 to cut its GHG emissions; it showed its commitment to tackling the climate change threat and to lead the world in demonstrating how this could be done. The agreed cut of 20% from 1990 levels by 2020, together with a 20% renewable energy production target, was a crucial step for the EU's sustainable development and a clear signal to the rest of the world that the EU was ready to take the action required. The EU will meet its collective Kyoto Protocol target of cutting GHG emissions by 8% for the period 2008 to 2012.
However, it has always been clear that the Kyoto protocol and also that a 20% cut by the EU is not enough to deliver the goal of keeping global temperature increase below the 2°C threshold compared with pre-industrial levels. All countries will need to make an additional effort, including cuts of 80% to 95% by 2050 by developed countries. An EU target of 20% by 2020 is just a first step to put emissions onto this path.
The EU policy today has matched its 20% unilateral commitment with a commitment to move to 30%, as part of a genuine global effort (Directive 2009/29/EC).
The UNFCCC at the COP16 in Cancun, held in December 2010, agreed the creation of new mechanism of cooperation between developed and developing countries. The Cancun Agreements established a long-term cooperative action on adaptation mitigation, finance, technology and capacity building for the full implementation of the convention objectives beyond 2012.
The Cancun Agreement positive outcomes include the establishment of the Green Climate Fund, the Technology Mechanism and the Cancun Adaptation Framework. Although a second commitment period under the Kyoto Protocol with legally binding targets was not established, the Cancun Agreements bring industrialized countries’ and developing countries’ GHGs reduction targets action formally under the multilateral UNFCCC process. Although this Agreement is very important after the failure experienced at the COP15 in Copenhagen, it represents only small steps in reducing global emissions that contribute to serious climate change. Financial commitments for the implementation of the Agreement to support developing countries are considerable; a fast-start finance fund of USD 30 billion, to be delivered between 2010 and 2012 and a long-term finance program, which will raise at least USD 100 billion a year by 2020. Although the solution of the climate change problem is still not at hand, the increasing awareness generated by the progress in scientific understanding and the financial commitments agreed may create new condition for future decisions that today seem still very far.
Acknowledgements
The author is grateful to P. Ruti and V. Ferrara for encouragements and useful comments.