


1. Introduction
In recent decades, international trade has expanded rapidly, reshaping the global economy and increasing interdependence among countries. Based on national accounts data from the World Bank and OECD, the share of exports in global GDP rose steadily from the mid-1980s, peaking at 31% in 2008. Even after the financial crisis, trade remains a significant driver of global production, accounting for about 29% of world output in 2021 (World Bank, 2022a), and fostering global economic growth, resilience, innovation, market integration, and sustainable development.
While this integration led to efficiency gains, recent crises have revealed new vulnerabilities. For example, the global economic shock driven by the COVID-19 pandemic sharply reduced trade, foreign direct investment, production, and employment (UNCTAD, 2021; Veeramani and Anam, Reference Veeramani and Anam2021; Verschuur et al., Reference Verschuur, Koks and Hall2021). The disruption of the global supply chain became evident in 2020, triggering widespread trade and production slowdowns, particularly for essential goods. Lin and Zhang (Reference Lin and Zhang2020) found that, while Chinese agricultural exports generally declined, there was an increase in demand for cereals and oils, as well as exports of medicinal herbs. Conversely, exports of goods such as edible fungi and horticultural products decreased.
In 2021, European dependence on COVID-19 vaccines produced by foreign pharmaceutical firms slowed its recovery process, a situation further aggravated in 2022 by the outbreak of the Russia–Ukraine war. Given the interconnectedness of the agricultural markets, such disruptions increased food price volatility and undermined food security (Carriquiry et al., Reference Carriquiry, Dumortier and Elobeid2022; Ruta, Reference Ruta2022). The war also reduced exports, increased prices, and drove up energy costs. Responding to these challenges calls for effective agricultural trade negotiations and continuous assessment of market dynamics.
Traditional resources such as the UN Comtrade Database, Footnote 1 the United Nations’ official repository for international trade statistics, and the World Integrated Trade Solution (WITS), Footnote 2 developed by the World Bank and UNCTAD, provide trade and tariff data with analytical features and offer comprehensive coverage. However, they are not designed for high-frequency tracking or interactive scenario analysis.
Although gross trade statistics cannot fully describe global value chains, they still capture structural interdependencies and help identify potential weaknesses in international exchange. Recent research has shown that the decision-making process can be enhanced through Big Data; however, its strategic application to achieve competitive advantage remains underdeveloped (Wu and Xu, Reference Wu and Xu2012). These gaps highlight the need for advanced policy tools that combine high-quality official trade data with methods for dynamic analysis of structural interdependencies, to support both systematic scenario analysis and the design of stable and efficient trade policies. By leveraging high-frequency data, detailed product–partner breakdowns, and clear, interpretable outputs to enable prompt decision-making, such tools should rely on robust data infrastructures and analytical frameworks that ensure accessibility, interpretability, and timely generation of evidence through effective visualization and well-defined summary indicators.
In this context, this article presents the methodological foundations of TERRA (imporT ExpoRt netwoRk Analysis), focusing on its construction as a framework that integrates high-frequency trade data, network-based representations, and time series indicators for the systematic analysis of international trade networks, before illustrating its analytical applications.
Over the past few decades, the Italian National Institute of Statistics (Istat) has broadened its research agenda by adopting innovative data sources and advanced analytical methods to modernize statistical production and enhance its ability to analyse complex socio-economic phenomena in depth. This includes a wide range of projects in Big Data and Machine Learning addressing various domains and methodological challenges within official statistics (Bruno et al., Reference Bruno, Catanese and Cerasti2025). Within this context, TERRA, based on European trade statistics (namely the COMEXT datasets), provides an integrated platform that combines multiple analytical functionalities to support the interpretation of complex trade interdependencies. By representing international trade as a system of interconnected relationships, TERRA employs graph analysis to explore the structure and evolution of trade interactions.
Rather than relying on a fully specified equilibrium or optimization model, TERRA focuses on the systematic assessment of structural vulnerabilities, emerging concentrations, and exposure to external shocks. It enables users to explore alternative trade configurations through simplified counterfactual exercises, supporting screening and early warning activities relevant to trade governance.
In addition to the web dashboard, TERRA provides two additional tools: (i) a set of APIs that allow users to access network indicators programmatically and carry out customized, reproducible longitudinal analyses that exceed the capabilities of the interactive interface (see Appendix A); (ii) a modular offline analytical package designed to include alternative trade datasets (e.g. UN Comtrade) and to support advanced analyses, such as flexible time series and counterfactual analyses. These analyses are performed more efficiently in dedicated environments, such as local or cloud-based setups, which are better suited for computationally intensive tasks (see Appendix B). Together, these components strengthen TERRA’s analytical functionality while ensuring alignment with the core analytical and diagnostic framework of the main dashboard.
This paper shows the methodological foundations of TERRA and demonstrates its analytical capabilities through two empirical applications: electricity trade during the COVID-19 pandemic and the arms trade during the Russia–Ukraine conflict. These case studies demonstrate how network-based monitoring tools can support the interpretation of evolving international trade interdependencies.
The paper is structured as follows: Section 2 defines the research problem and outlines the conceptual background; Section 3 reviews the related literature and existing tools for international trade analysis; Section 4 describes the methodological approach; Section 5 presents two case studies, while Section 6 concludes with final remarks. The data processing workflow feeding the TERRA platform is described in Appendix C.
2. Problem Definition
The transformation of global value chains (GVCs) over the past three decades, driven by advances in information, communication, and transport technologies, has reshaped international production and trade. Firms are increasingly locating their activities in multiple sites to boost efficiency and reduce costs. While governments recognize that GVCs can promote employment, skill development, and economic growth, the integration of such networks can yield efficiency gains and amplify systemic vulnerabilities, as shocks or policy measures in upstream sectors can propagate to downstream regions. This highlights the importance of coordinated international policy frameworks. Furthermore, given the close interdependence between supply and demand in markets, disruptions in one area can rapidly affect others, making GVCs particularly susceptible to global and regional shocks (Smith et al., Reference Smith, Gorgoni and Cronin2019).
The COVID-19 pandemic represents a prominent example of global shock, showing the fragility of supply chains. Restrictions and workplace closures significantly reduced production capacity on the supply side, while buyers cancelled orders or postponed payment. On the demand side, shifting consumer behaviour forced firms to restructure their distribution networks.
Two notable examples of regional shocks are inflation driven by government price policies or major geopolitical events, such as the Russia–Ukraine war, and transportation disruptions, exemplified by the 2021 Suez Canal blockage, when the Ever Given remained grounded from 23 to 29 March 2021, causing shipment delays, port congestion, and interruptions in assembly lines. Recent literature shows that economic shocks affect low- and high-tech sectors differently. Indeed, while larger economies often play only a minor role in low-tech trade, they assume a central position in high-tech trade (Smith and Sarabi, Reference Smith and Sarabi2022). This contrast highlights the importance of resilient trade policies. Governments must diversify their economic activities, assess trade network configurations, and account for long-term implications for skills, income distribution, and employment (Elms and Low, Reference Elms and Low2013; Zhou et al., Reference Zhou, Wu and Xu2016).
To mitigate inflationary shocks, policies should improve preparedness for transport disruptions by developing alternative supply routes and strengthening participation in global value chains. In this context, analytical tools designed to capture the structure and dynamics of trade networks are crucial for informing decision makers. TERRA adopts a network-based representation of international trade to systematically examine country-sector linkages, thereby revealing structural trends that may amplify or dampen the transmission of shocks. Combined with high-frequency time series analysis, this framework enables the detection of anomalies in trade flows and prices and the assessment of specialization dynamics.
More specifically, TERRA complements traditional trade statistics by focusing on exposure, concentration, and potential vulnerabilities. It thus provides policymakers with an analytical tool to assess emerging risks and design strategies to improve the resilience of global value chains.
3. Related Work and Existing Tools
Over the years, several tools have been developed to support the analysis of international trade data. Most of these platforms rely on official statistics and provide broad coverage of global trade flows. However, they differ considerably in terms of scope, update frequency, and analytical functionality.
The UN Comtrade Database is the official trade database of the United Nations and represents one of the most comprehensive sources of international trade statistics. It offers global coverage across multiple product classifications and reports harmonized import and export data from over 170 countries (UN Comtrade, 2022). This database is updated yearly and, when available, also includes monthly statistics.
The World Integrated Trade Solution (WITS) platform provides access to several major datasets, including UN Comtrade, World Trade Organization (WTO), and UNCTAD. In addition to trade data, WITS includes tariff and non-tariff information and offers analytical tools for exploring trade flows and simulating tariff reductions and trade liberalization using partial equilibrium models (World Bank, 2022b). However, a key limitation is that some empirical analyses require user registration and the installation of additional software, which may restrict accessibility and replicability. Furthermore, although monthly series can be accessed in specific cases through UN Comtrade, the data are primarily available at an annual frequency.
Among other initiatives developed within academia and by international organizations is the Observatory of Economic Complexity (OEC). Created at MIT’s Media Lab, the OEC offers interactive visualizations of trade flows by country and product, focusing on patterns of specialization and diversification (Hausmann et al., Reference Hausmann, Hidalgo, Bustos, Coscia, Simoes and Yıldırım2014). Beyond its role as a visualization tool, the OEC framework has been widely used in empirical studies to examine the relationship between export diversification and economic growth (e.g., Tacchella et al., Reference Tacchella, Mazzilli and Pietronero2018; Mealy et al., Reference Mealy, Farmer and Teytelboym2019).
Similarly, Trade Map, developed by the International Trade Centre (ITC), provides detailed and timely trade data to support firms and policymakers in understanding international market dynamics. Its tools are designed to enhance trade performance and facilitate access to global markets (ITC, 2022). For example, small and medium-sized enterprises in developed countries can use Trade Map to identify high-demand products abroad and develop more effective export strategies. Despite its user-friendly interface, some advanced functionalities require user registration, and data coverage may vary by country and product.
Another important resource is the BACI dataset, developed by CEPII, which harmonizes UN Comtrade data to guarantee cross-country comparability of trade flows. It is widely used by researchers and practitioners to analyse international trade networks, examine bilateral trade patterns, and assess how economic shocks originating in one country may propagate to others (see, among others, Gaulier and Zignago, Reference Gaulier and Zignago2010; Amador and Cabral, Reference Amador and Cabral2017). Unlike interactive online platforms, BACI is distributed as a downloadable dataset and provides annual data specifically designed for empirical analysis and econometric modelling.
Building on the data resources outlined above, TERRA integrates monthly Eurostat COMEXT statistics into a unified analytical environment for network-based monitoring of European trade flows. Its framework supports informed decision-making and enhances the longitudinal assessment of trade dynamics in an increasingly globalised environment.
Unlike traditional platforms, TERRA combines interactive monitoring with programmatic access to analytical outputs. A web dashboard facilitates exploratory and graphical analysis, while dedicated APIs allow users to retrieve network indicators and develop tailored, replicable long-term analyses that extend beyond the limitations of the graphical interface (see Appendix A).
In addition, TERRA is improved by a flexible offline package that further expands its analytical framework. This allows the application of the same logic to additional trade datasets beyond Eurostat COMEXT, including globally harmonized sources such as UN Comtrade (see Appendix B).
4. Methodological Framework
This section outlines the methodological framework underlying TERRA. It combines high-frequency official trade statistics with network-based representations and complementary analytical tools to monitor international trade dynamics.
Section 4.1 introduces the data sources and discusses the structural differences between the main COMEXT datasets used in TERRA. Section 4.2 presents the network-based analytical framework adopted to represent and characterize trade interdependencies. Section 4.3 focuses on the time series indicators used to track the temporal evolution of trade relationships. Lastly, Section 4.4 responds to the need for more formal counterfactual analysis by presenting a Constant Elasticity of Substitution (CES) model implemented as a methodological extension of the TERRA framework. This extension enables the simulation of trade reallocation under stylized supply shocks.
4.1 Data Sources and Scope
The analytical framework used in TERRA is based on official European Union statistics on international trade in goods, collected by Member States using standardized methods, and shared through the Eurostat COMEXT database.Footnote 3 These data provide a consistent, reliable basis for tracking trade dynamics across EU countries, ensuring comparability over time and between trading partners.
COMEXT provides highly disaggregated monthly data on international trade relationships. This includes information on trade values (in Euros), quantities (in kilograms), product classifications, partner countries and territories, trade flows (imports and exports), modes of transport, and types of transaction.
This detailed dataset is extremely valuable for analysing short-term disruptions and long-term structural changes in international trade.
Within TERRA, two main COMEXT datasets are employed:
• The PRODUCT dataset, providing monthly and annual records of trade flows between EU Member States and their international partners, reported in terms of value and quantity and based on internationally standardized product classifications, including the Combined Nomenclature (CN), the Standard International Trade Classification (SITC), and the Classification of Products by Activity (CPA).Footnote 4 This dataset covers both intra-EU and extra-EU trade, thereby allowing a comprehensive assessment of European trade relations.
• The TRANSPORT_NSTR dataset, providing detailed records of extra-EU trade flows disaggregated by mode of transport and classified according to the Standard Goods Classification for Transport Statistics (NSTR). Its hierarchical structure supports multilevel analysis, ranging from broad product aggregates to highly granular categories. This dataset currently refers only to extra-EU trade, as the reporting of transport mode for intra-EU flows is optional and therefore not systematically collected.
The features and coverage of the PRODUCT and TRANSPORT_NSTR datasets shape the analyses and visualizations that can be performed in TERRA. These two datasets differ in coverage and classification. The PRODUCT dataset details trade values and quantities for both intra-EU (EU–EU) and extra-EU (EU–extra-EU) flows, using CPA-based product categories. Conversely, the TRANSPORT_NSTR dataset relies on the NSTR classification and focuses primarily on extra-EU trade with a detailed breakdown by mode of transport. Reporting intra-EU trade by mode of transport in TRANSPORT_NSTR is optional, leading to inconsistencies.
These structural differences affect network representation and analysis. PRODUCT data provide a comprehensive overview of EU trade relationships, whereas TRANSPORT_NSTR offers a more granular perspective on logistics patterns, albeit with limited intra-EU coverage. Accordingly, TERRA treats the two datasets as complementary rather than interchangeable.
To understand how TERRA’s network-based representation is built, it is first necessary to clarify the underlying structures of the two datasets. Their core schema includes a declarant country, a partner country, an indication of the trade flow (import or export), the traded product, and the quantity exchanged, with additional attributes such as trade value, month, mode of transport, and others.
To translate this tabular structure into a network representation, an explicit modelling assumption is adopted: the relationship between two trading countries is assumed to follow the direction of the traded good. This choice guarantees an unambiguous interpretation of edge direction within the network. As shown in Figure 1a, which provides a simplified example involving only two countries, the direction of the edge is from the declarant country to the partner country for exports and from the partner country to the declarant country for imports. This convention directly reflects the principle that relationships are driven by the physical movement of goods.
Simplified example of the network representation adopted in TERRA.

Figure 1a Long description
Three tables and corresponding network diagrams illustrating import, export and average data between IT and DE. The first table, labeled ′Import (Comext data)′, lists ′Declarant′, ′Part ner′, ′Flow′ and ′Qty′. IT declares to DE with a flow of ′I′ and a quantity of 100. DE declares to IT with a flow of ′I′ and a quantity of 80. The network diagram shows IT and DE with arrows indicating flows of 100 and 80. The second table, labeled ′Export (Comext data)′, shows IT declaring to DE with a flow of ′E′ and a quantity of 50 and DE declaring to IT with a flow of ′E′ and a quantity of 30. The corresponding network diagram illustrates these flows. The third table, labeled ′Average (calculated data)′, shows IT to DE with a flow of ′I/E′ and a calculated quantity of 65 and DE to IT with a flow of ′I/E′ and a calculated quantity of 60. The network diagram reflects these average flows with calculated values shown as (50 plus 80) divided by 2 equals 65 and (30 plus 100) divided by 2 equals 60.
Graphical representation of TRANSPORT_NSTR and PRODUCT data flows.

Figure 1b Long description
Two column headings appear at the top, ′PRODUCT′ on the left and ′TRANSPORT NSTR′ on the right. Under ′PRODUCT′ the subtitle reads ′CPA 2.1 classification without transport info′ and under ′TRANSPORT NSTR′ the subtitle reads ′NSTR classification with transport info′. Along the far left side, three row labels read ′Import′, ′Export′ and ′Average′. In the first row, the Product diagram shows two dashed ovals, each surrounding a small set of circular nodes, with the text ′EU′ near the left cluster and ′Extra EU′ near the right cluster; several solid lines connect nodes within each dashed oval and at least one line runs between the two dashed ovals. In the same row, the Transport Hubs diagram repeats the same visible text labels ′EU′ and ′Extra EU′ with two dashed ovals around node clusters and solid lines connecting nodes within clusters and between the two clusters. In the second row labeled ′Expport′, the Product diagram again contains the labels ′EU′ and ′Extra EU′ beside two dashed ovals enclosing node clusters, with solid lines linking multiple nodes inside each oval and at least one line linking across the gap between the two ovals; the Transport NSTR diagram in this row repeats the same two dashed ovals and the same labels ′EU′ and ′Extra EU′, with a similar pattern of solid connecting lines among the nodes. In the third row labeled ′Average′, the Product diagram shows the same two dashed ovals and the same labels ′EU′ and ′Extra EU′, with a denser set of solid lines among the nodes and multiple lines spanning between the two dashed ovals; the Transport NSTR diagram in this row also shows ′EU′ and ′Extra EU′ with two dashed ovals around node clusters and several solid lines connecting nodes within and between the clusters. No axis line, tick marks, numeric values, or units are visible anywhere in the figure.
Furthermore, since countries prepare trade declarations independently, discrepancies might arise in reported flows. Specifically, an export declaration from one country may not match the corresponding import declaration from its trading partner due to differences in valuation methods, timing, coverage, or reporting practices. To address these discrepancies, TERRA defines an additional derived trade flow, called average, which is created by combining available import and export declarations. Instead of selecting one declaration over the other, the network representation includes both flows and assigns each directed edge a weight equal to the average of the import and export-based measurements.
In this approach, import and export remain the original reported flows, while average shows a reconciled bilateral estimate of trade intensity between two countries and serves as the reference flow for network-based analysis in TERRA. This modelling choice provides a more comprehensive and stable view of trade relationships while preserving the directionality of goods’ physical movement.
Figure 1b provides a schematic overview of the network representations built in TERRA using the PRODUCT and TRANSPORT_NSTR datasets. In both cases, countries are modelled as nodes, and trade relationships are represented as directed edges with edge weights indicating the exchange strength based on the selected flow type (import, export, or average).
The left panel displays the network based on PRODUCT data, including both intra-EU and extra-EU trade, and is organized by product classifications. This representation offers a comprehensive overview of European trade relationships, including exchanges within the EU single market.
The right panel shows the network built from TRANSPORT_NSTR data, which focuses on extra-EU trade and provides detailed information by distinguishing flows according to mode of transport. Since transport reporting for intra-EU trade is optional, this representation is limited to EU–extra-EU exchanges.
By comparing the two panels, Figure 1b shows how PRODUCT and TRANSPORT_NSTR offer different but related analytical views within TERRA: the former focusing on trade structure across products and partners, and the latter illustrating the logistical aspect of extra-EU trade flows.
4.2 Network Indicators
Building on the data structures described above, TERRA represents international trade as a weighted directed network, where nodes correspond to countries and directed edges indicate trade flows between them. Edge weights show the strength of exchange, measured in monetary terms (Euros) and based on COMEXT data. This modelling approach enables the analysis of trade relationships using standard tools from social network analysis (Wasserman and Faust, Reference Wasserman and Faust1994). The same analytical framework is applied to PRODUCT and TRANSPORT_NSTR data. In all cases, networks are built for a specific time and product category. Figure 2 illustrates an example of a trade network generated with TERRA for textile exports in January 2024, based on TRANSPORT_NSTR data.
Trade network graph of textile product exports in January 2024.

For clarity, the visualization uses a percentile-based filter to display only the most relevant connections. This filtering does not affect the computation of network indicators. Each intra-EU exchange is documented as both an export and an import, enabling TERRA to analyse trade flows by direction or through an average measure. For visualization, the relative positions of countries within the network are computed using a force-directed layout based on the Spring Layout algorithm (Fruchterman and Reingold, Reference Fruchterman and Reingold1991). Although the absolute spatial placement of nodes has no intrinsic analytical meaning, this representation helps identify countries that occupy central positions or serve as bridges within the network. Edge thickness and colour are used to encode trade intensity when the network is sufficiently sparse, based on a quantile-based classification of edge weights; in denser configurations, a uniform styling is adopted to preserve readability.
Alongside the visualization, TERRA computes a set of network indicators to characterize both the overall structure of trade networks and the role of individual countries within them. Network density shows how connected the system is. It compares the number of trade links that actually exist with the number that could exist, providing a synthetic indication of overall interconnectedness. Density is defined as follows
 \begin{equation}D = \frac{L}{{N\left( {N - 1} \right)}}\end{equation}
where  $L$ is the number of observed edges,
 $N$ is the number of nodes in the network, and
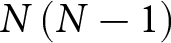 $N\left( {N - 1} \right)$ is the maximum number of possible directed edges. The indicator ranges from 0 (no trade links) to 1 (a fully connected network). In Figure 2, its value is 0.05, indicating a sparse network in which only a small fraction of potential bilateral trade links is present.
At the node level, TERRA calculates a set of centrality measures, namely in-degree, out-degree, closeness, betweenness, and distinctiveness (Fronzetti Colladon and Naldi, Reference Fronzetti Colladon and Naldi2020; Wasserman and Faust, Reference Wasserman and Faust1994). To reflect the economic importance of trade relationships, these metrics are also calculated in weighted form, using trade values in Euros as weights for the connections.
In-degree centrality measures the number of a country’s import partners, capturing the node’s level of connectivity while ignoring the strength or intensity of those connections (2a). Its weighted version (2b) quantifies the total value of imports for a given good and time period. Formally, for a given country  $i$, the weighted in-degree is given by
 \begin{equation}{C_{in}}\left( i \right) = \sum\nolimits_j {{a_{ji}}} \end{equation}
 \begin{equation}{C^w}_{in}\left( i \right) = \sum\nolimits_j {{w_{ji}}} \end{equation}
where  $a_{ji}$ is 1 if there is a directed edge from node j to node i, and
 $w_{ji}$ is the weight of the edge connecting country
 $j$ to
 $i$.
Similarly, out-degree centrality (3a) measures the number of export partners, and its weighted version (3b) captures the total value of exports for a given good and time period
 \begin{equation}{C_{out}}\left( i \right) = \mathop \sum \limits_j {a_{ij}}\end{equation}
 \begin{equation}{C^w}_{out}\left( i \right) = {\sum\nolimits_j w _{ij}}\end{equation}
In our context, low in-degree centrality suggests that a country relies on a small number of suppliers, making it more exposed to supply disruptions, price shocks, or geopolitical tensions affecting those specific partners.
In the context of international trade networks, closeness centrality captures how easily a country can reach all other trading partners, either directly or through a small number of intermediaries. It is defined as
 \begin{equation}{C_{clo}}\left( i \right) = \frac{1}{{\sum\nolimits_{j \ne i} {d\left( {i,j} \right)} }}\end{equation}
where  $d\left( {i,j} \right)$ denotes the length of the shortest trade path between country
 $i$ and country
 $j$ (Wasserman and Faust, Reference Wasserman and Faust1994). Higher closeness centrality indicates that a country is, on average, only a few trade steps away from all others. In import–export terms, this reflects a more central position in the global trading system, allowing the country to access markets and suppliers more efficiently and to adjust more rapidly to changes in trade patterns. Countries with hub-like roles typically exhibit higher closeness values, as they are embedded in dense trade corridors that shorten distances to the rest of the network (De Benedictis et al., Reference De Benedictis, Nenci, Santoni, Tajoli and Vicarelli2014).
Betweenness centrality measures the extent to which a country acts as an intermediary in trade relationships, capturing its brokerage power within the network. It is defined as
 \begin{equation}{C_{bet}}\left( i \right) = \sum\nolimits_{j \ne i \ne k} {\frac{{{\sigma _{jk}}\left( i \right)}}{{{\sigma _{jk}}}}} \end{equation}
where  ${\sigma _{jk}}$ is the total number of shortest paths between countries
 $j$ and
 $k,$ while
 ${\sigma _{jk}}\left( i \right)$ is the number of those paths that pass through
 $i$. In a trade context, this metric highlights countries that play a pivotal role in connecting otherwise weakly linked regions or markets. High betweenness centrality indicates a strong intermediary position, implying greater capacity to facilitate, influence, or potentially disrupt trade flows. Such countries may serve as key transit hubs or strategic connectors, thereby exerting structural leverage over the circulation of goods across the network.
Traditional centrality measures, such as degree, assess the importance of nodes based on the number or magnitude of their direct connections, typically favouring highly connected hubs. Distinctiveness centrality captures a different dimension of importance by highlighting nodes that maintain ties with weakly connected and peripheral partners. In doing so, it emphasizes their role in linking marginal areas of the trade network and enhancing overall network cohesion. Among the five metrics proposed by Fronzetti Colladon and Naldi (Reference Fronzetti Colladon and Naldi2020), we chose weighted distinctiveness centrality
 \begin{equation}{C_{dis}}(i) = {\sum\nolimits_{j \ne i} w _{ij}}{\log}\frac{{n - 1}}{{k_j^\alpha }}\end{equation}
where  ${k_j}$ is the degree of node
 $j$,
 ${w_{ij}}$ is the weight of the edge connecting nodes
 $i$ and
 $j$ (measured in trade value, euros), n is the total number of nodes in the network and
 $\alpha $ is a parameter typically set to one. Connections to highly connected nodes are penalized, while links to peripheral nodes are given greater weight. In the context of trade networks, this metric may help identify countries of strategic importance that act as intermediaries between the core and the periphery, a role that can become especially critical during periods of disruption or crisis.
A structural limitation of COMEXT data is the absence of information on trade flows between non-European countries (extra-EU to extra-EU), as the dataset is compiled from the perspective of European reporting nations. Consequently, the resulting trade network offers only a partial view of the global system, which may affect the interpretation and calculation of specific metrics, particularly those based on shortest paths or global connectivity, such as closeness, betweenness, and network density. To mitigate this limitation, TERRA allows extra-EU countries to be aggregated into a single node. This reduces potential distortions in the network structure, albeit at the cost of reduced geographical detail.
4.3 Time Series Analysis
While network analysis captures trade relations between countries at a specific point in time, TERRA highlights how these connections evolve. This longitudinal approach allows tracking changes in trade patterns, identifying shocks and subsequent adjustments, and assessing the persistence of bilateral relationships. To this end, TERRA manages a large set of time series detailing import and export flows between European countries and their trading partners, in monetary values (Euros) and physical quantities (kilograms). These series are available in absolute terms and as annual variations, allowing users to analyse both short-term fluctuations and long-term dynamics.
Within the dashboard, time series data are primarily used for exploratory and monitoring purposes. Interactive visualizations enable users to examine trends, level shifts, seasonal patterns, and other critical aspects of trade dynamics, alongside basic descriptive statistics to facilitate initial interpretation. This design emphasizes TERRA’s role as a monitoring tool rather than as a comprehensive econometric platform.
More advanced longitudinal analyses, particularly those focusing on the temporal evolution of network metrics, are supported through TERRA’s APIs and offline components. The APIs exposed by the framework allow researchers to retrieve time-indexed network indicators and to conduct customized analyses in external analytical environments. These include, for example, rotating leadership analysis (Fronzetti Colladon and Vestrelli, Reference Fronzetti Colladon and Vestrelli2025), which examines oscillations in countries’ centrality measures over time to capture shifts in trade roles and influence within the network.
These analytical capabilities are directly illustrated in the empirical applications presented in this paper. In the case studies on electricity trade during the COVID-19 pandemic and on weapons and ammunition trade during the Russia–Ukraine conflict, time series of network metrics such as degree and betweenness centrality are used to analyse how countries’ positions within trade networks evolve in response to major external shocks.
4.4 Constant Elasticity of Substitution Model
This subsection describes the structure of the Constant Elasticity of Substitution (CES) model, a standard framework in international economics widely used to analyse trade reallocation across alternative suppliers under counterfactual scenarios (Redding and Weinstein, Reference Redding and Weinstein2023). Within TERRA, this CES model is implemented exclusively in the offline analytical environmentFootnote 5 to perform stylized supply shock analyses and trade reallocation exercises that cannot be explored through the web-based dashboard alone (see Appendix B).
In line with the Armington (Reference Armington1969) assumption, the total imports of a given country are modelled as a CES aggregate of goods supplied by different countries, treated as imperfectly substitutable varieties differentiated by country of origin. Each supplier is associated with a distribution parameter  ${\alpha _i}$, capturing its relative importance in the importing country’s market. These
 $\alpha $ parameter values are calibrated using baseline export volumes, so that the model reproduces observed trade patterns under normal, undisturbed conditions and accurately reflects the underlying structure of international trade.
The elasticity of substitution  $\varepsilon $ plays a crucial role in the model, as it governs the degree to which imports from one supplier can be replaced by imports from another. Higher values of the
 $\varepsilon $ elasticity imply greater substitutability across suppliers; while lower values indicate more rigid trade relationships and limited scope for adjustment following a shock
 \begin{equation}Q=\left(\sum\nolimits_i\alpha_iq_i^{\left(\frac{\varepsilon-1}\varepsilon\right)}\right)^{\left(\frac\varepsilon{\varepsilon-1}\right)}\end{equation}
where  ${q_i}$ denotes the quantity imported from supplier
 $i$;
 ${\alpha _i}$ is the distribution parameter calibrated on baseline quantities;
 $\varepsilon $ is the elasticity of substitution between suppliers, and
 $Q$ represents the aggregate import quantity. To simulate a stylized supply shock, a given supplier
 $k$ is removed from the choice set, defined as the set of exporting countries that are available to the importing country as potential sources of supply. Operationally, this is implemented by setting
 ${q_k} = 0$, thereby excluding supplier
 $k$ from the CES aggregation. The CES system is revaluated, and residual demand is reallocated among remaining suppliers according to their baseline market shares, relative prices, and the elasticity of substitution. This mechanism ensures a coherent and internally consistent reallocation of trade flows following a simulated shock, providing an illustrative representation of how import patterns may adjust when a supplier becomes unavailable.
5. Case Studies and Advanced Scenario Analysis
This section illustrates the analytical potential of the TERRA framework through two case studies based on major global systemic shocks affecting international trade. The selected events are the COVID-19 pandemic and the Russia–Ukraine conflict, which represent distinct but complementary sources of stress, affecting essential energy markets and strategically sensitive defence supply chains, respectively.
We illustrate how network-based monitoring and counterfactual tools can be used to interpret complex trade dynamics under stress.Footnote 6 Both case studies use high-frequency European trade data and follow a common analytical structure. First, cross-sectional representations of the trade network are applied to identify key connections and dominant trade countries at a specific point in time. Then, time series dynamics of network centrality indicators are analysed to capture changes in countries’ roles throughout the shock period. Finally, if relevant, counterfactual analyses are employed to explore structural resilience and trade reallocation among countries following hypothetical supply disruptions.
Overall, the two applications demonstrate how network analysis, longitudinal monitoring, and simplified modelling can be integrated within the TERRA framework. This combination supports an evidence-based assessment of vulnerabilities, adaptive responses, and emerging concentrations in European trade networks.
5.1 Analysis of Electricity Supply Dynamics during the COVID-19 Pandemic
The COVID-19 pandemic represents a paradigmatic example of a global systemic shock, with documented effects on production, mobility, financial markets, and international trade (Baker et al., Reference Baker, Bloom, Davis and Terry2020; Guardabascio et al., Reference Guardabascio, Brogi and Benassi2023; Verschuur et al., Reference Verschuur, Koks and Hall2021). Beyond its direct health impact, the pandemic introduced unprecedented uncertainty into commodity markets, amplified volatility, and altered investment and trading behaviour, partly through mobility restrictions and government containment measures (Etienne et al., Reference Etienne, Irwin and Garcia2015; Lawson et al., Reference Lawson, Alam and Etienne2021).
Electricity constitutes a critical and time-sensitive commodity whose trade networks require continuous balancing between supply and demand, making them particularly suitable for analysing structural resilience under stress. Previous studies have shown that, despite sharp contractions in traded volumes, core trade networks may preserve their overall connectivity during crises, while undergoing significant reallocations of central roles among countries (Kiyota, Reference Kiyota2022; Vidya et al., Reference Vidya, Mummidi and Adarsh2023).
In line with the cited literature, this case study uses TERRA to examine the impact of the COVID-19 pandemic on the European electricity trade network. More specifically, the analysis investigates whether the pandemic altered the network structure or triggered a reconfiguration of countries’ positions within it.
To obtain an initial overview of how the shock was distributed spatially and temporally, we use the interactive map, which visualizes monthly year-on-year variations in trade flows through customizable heatmaps.Footnote 7
Figure 3 compares April 2019 (left panel) and April 2020 (right panel), showing export changes ranging from –60% to +60%. The shift from light colours in 2019 to mostly red and orange in 2020 clearly highlights the sharp contraction in trade volumes caused by the COVID-19 pandemic.
Interactive map panel of EU exports: comparison between April 2019 and April 2020.

Figure 3 Long description
Two thematic maps of Europe display monthly year-on-year export changes for April 2019 and April 2020. The legend shows a gradient from green (positive change) to red (negative change), with values ranging from 20 percent to minus 40 percent. In April 2019, most areas, including northern regions like Sweden and Finland, show minimal change near 0 percent. By April 2020, southern countries such as Italy, Spain and France exhibit significant declines, with changes between minus 10 percent and minus 40 percent. Northern Europe shows less negative impact. The maps are oriented with north at the top, illustrating a shift towards more negative export changes in 2020 compared to 2019.
At the same time, the interactive map highlights heterogeneity across countries: while most EU members suffered sharp declines in exports (notably Spain, France, Italy, Romania, and Greece) in April 2020, some countries, such as Sweden, Finland, and Denmark, experienced comparatively milder contractions. This reflects differences in industrial structure and trade composition, consistent with recent studies documenting that economies less dependent on manufacturing exports were relatively more resilient during the first wave of COVID-19 (Verschuur et al., Reference Verschuur, Koks and Hall2021; Vidya et al., Reference Vidya, Mummidi and Adarsh2023), and underscores one of TERRA’s strengths in making such cross-country differences immediately visible.
To determine whether this decline also affected the structure of trade relations, we examine the product category Electricity, transmission, and distribution services. Figure 4 illustrates the trade networks after merging extra-EU partners and averaging flows. The results indicate that network density decreased only slightly from 0.20 in April 2019 to 0.19 in April 2020 (–5%), suggesting that most trade links persisted despite a significant drop in volumes. Although the overall topology stayed stable, country-specific indicators reveal notable shifts. For instance, Italy’s betweenness centrality decreased from 0.21 to 0.12, and its normalized degree dropped from 0.11 to 0.06, indicating a relative decline in its importance within the network.
Graph EU–World: prevalent trade network (60%) on ‘Electricity, transmission and distribution services’.

Figure 4 Long description
Two network diagrams and a table. The first diagram, labeled April 2019, shows connections between European countries with arrows indicating direction. The second diagram, labeled April 2020, displays similar connections with some changes in direction and density. The table on the right lists metrics for Italy in 2019 and 2020. Columns are Metric, 2019 and 2020. Row 1: Density 0.20, 0.19. Row 2: W. Degree 0.11, 0.06. Row 3: inDegree 9, 9. Row 4: W. inDegree 0.09, 0.04. Row 5: Out Degree 8, 8. Row 6: W. Out Degree 0.02, 0.02. Row 7: Closeness 0.00, 0.00. Row 8: Betweenness 0.21, 0.12. Row 9: Distinctiveness 0.02, 0.01.
This suggests that, despite stable overall connectivity, dominant countries adjusted their strategies, leading to a reallocation of central positions.
To better capture how these shifts evolved, we move from the static comparison in Figure 4 to a dynamic perspective, examining the monthly time series of betweenness centrality for each EU country, employing the same network construction parameters as outlined before (extra-EU data collapsed, flows averaged, and metrics derived from the complete graph). Figure 5 reports the monthly evolution of betweenness centrality for the main European countries, ranked in descending order according to this metric. Together, these countries account for approximately 70% of the total betweenness centrality of the monthly electricity trade network (including the aggregated extra-EU node). Despite moderate fluctuations in network density between 0.19 and 0.20, France, Italy, and Slovakia experienced a decline in centrality during the peak of the pandemic. By contrast, Poland’s centrality remained broadly stable, while Hungary temporarily gained prominence between June and September 2020. Germany consistently retained high centrality, confirming its key role in the network. The distinct yet stable centrality profiles of Germany and France further illustrate differentiated functional roles within the European electricity trade network.
Monthly betweenness centrality for electricity, transmission and distribution services of major EU countries.

Figure 5 Long description
A multi-line graph plots seven series across a timeline from 2019.08 to 2020.12 on the x-axis. The left y-axis ranges from 0 to 0.6 and corresponds to the betweenness metric series for DE, FR, HU, SK, PL and IT. The right y-axis ranges from 0.18 to 0.21 and corresponds to the density series. Density fluctuates across the period, starting near 0.19 in August 2019, rising over 0.20 around February 2020 and recovering toward 0.20 by December 2020. Regarding the betweenness centrality DE rises to a peak of approximately 0.5 around February 2020 and then declines toward 0.3 by December 2020. FR experienced a noticeable decline in centrality (peaking in November 2019 with 0.4 and staying below 0.3 in the following months), suggesting a temporary reduction in their position within the network. In contrast, Poland maintained a broadly stable level of centrality throughout this period, while Hungary experienced a temporary increase, gaining prominence between June and September 2020 before returning to its previous position.
Overall, Figure 5 indicates that, although the collapse in absolute trade volumes involved only marginal changes in network density, the distribution of bridging roles among countries shifted markedly under stress. This contrast between reduced trade volumes and stable connectivity aligns with recent findings indicating that major trade networks maintained their structural integrity throughout the pandemic (Kiyota, Reference Kiyota2022; Vidya et al., Reference Vidya, Mummidi and Adarsh2023). These results indicate that, despite severe global disruptions, the electricity trade network preserved its overall connectivity, while the relative positions of key countries were substantially reshaped.
To demonstrate the scenario analysis feature, we simulate the failure of some connections to visualize network dynamics both graphically and through quantitative metrics. The tool supports removing connections to evaluate the impact of market shocks. Figure 6 shows a network-based exploratory scenario for electricity trade in April 2020 during the COVID-19 pandemic. The left panel reproduces the observed trade network discussed in Figure 4, while the right panel illustrates an edge-removal exercise representing a hypothetical trade disruption involving Slovakia, chosen because of its high betweenness centrality.
Graph EU–World: edge-removal scenario showing the dominant graph at 60%.

Figure 6 Long description
Two network diagrams and a table. The first diagram, labeled April 2020 Real situation, shows trade connections among EU countries with flags representing each country. The second diagram, labeled April 2020 Simulation, displays a similar network with adjusted connections. Both diagrams include countries like DE, FR, IT and others, connected by lines indicating trade relationships. The table on the right compares Real and Scenario values for trade prevalence among various entities: Extra EU, DE, SK, FR, PL, HU and IT. Values are given as decimals, such as Extra EU with 0.64 for Real and 0.70 for Scenario, DE with 0.52 for Real and 0.53 for Scenario and others. SK has a value of 0.18 for Real and NA for Scenario. The table visually represents these values with shaded bars next to each numeric value.
Comparing the two graphs, it shows that, despite the removal of the connections involving Slovakia, the overall network structure remains relatively stable: Germany, France, and the aggregated extra-EU node exhibit high and broadly stable centrality, with only marginal variations, while significant rearrangements occur among intermediary nodes, with Poland and Italy gaining centrality and Hungary losing relevance. Furthermore, the graph highlights Belgium’s growing prominence, as evidenced by the addition of two new export edges in the dominant graph (towards the Netherlands and extra-EU). This exploratory scenario illustrates the usefulness of network-based scenario analysis tools for assessing potential ripple effects of supply disruptions.
5.2 Weapons and Ammunition during the Russia–Ukraine Conflict
The Russia–Ukraine war represents a major geopolitical shock with profound implications for global trade, particularly in strategically sensitive sectors related to security and defence. Beyond its humanitarian and political consequences, the conflict triggered abrupt disruptions in arms production, logistics, and international supply routes, while accelerating rearmament policies and reshaping defence procurement strategies across Europe (Zhuravka et al., Reference Zhuravka, Botvinov, Parshyna, Makarenko and Nebaba2021; Wang et al., Reference Wang, Chen and Song2023).
Weapons and ammunition constitute a highly concentrated and regulated trade segment, characterized by limited substitutability, strong geopolitical constraints, and pronounced network hierarchies. These features make arms trade networks particularly suitable for analysing whether geopolitical shocks undermine network cohesion or instead induce a reallocation and concentration of strategic brokerage roles under heightened political risk.
Building on this literature, this case study applies the TERRA framework to examine how the European weapons and ammunition trade network responded to the Russia–Ukraine conflict. The analysis investigates whether the shock preserved overall network connectivity while simultaneously triggering a reconfiguration and concentration of countries’ brokerage positions and substitution patterns within European arms supply chains.
The analysis is organized as follows. Subsection 5.2.1 presents evidence from the dashboard, illustrating changes in trade flows and network positions during the conflict using network and time series indicators. Subsection 5.2.2 introduces the counterfactual supply shock scenario and uses the Constant Elasticity of Substitution (CES) framework described in Section 4.4 to model trade reallocation among suppliers. Subsection 5.2.3 discusses the results of the counterfactual analyses and their implications.
5.2.1 Stability and Reallocation of Brokerage Roles
This subsection examines the evolution of the European weapons and ammunition trade network before and after the outbreak of the Russia–Ukraine war. To this aim, Figure 7 presents a comparative analysis of the trade network across three key periods: October 2021 (pre-war), February 2022 (short-term post-war), and October 2022 (medium-term post-war). The focus is on the dominant trade exchanges, which account for 60% of total flows, excluding the aggregated extra-EU node.
EU–World network for the trade of weapons and ammunition at 60% prevalence (average flows), October 2021–February 2022–October 2022.

Figure 7 Long description
Three directed network diagrams display trade relationships among EU countries for weapons and ammunition across three time snapshots: October 2021, February 2022 and October 2022. Each node in the network is represented by a country flag and directed edges indicate trade flow from exporter to importer. No axis labels or units are present, as these are network graphs. A density value is shown above each diagram. In October 2021, the network density is 0.07. Multiple directed connections are visible among a large number of country nodes arranged in a circular layout. The United States flag node appears centrally connected with several outgoing and incoming edges. In February 2022, the network density remains at 0.07. The number of visible nodes appears reduced compared to October 2021 and directed edges are concentrated among a smaller set of country nodes. The United Kingdom flag node appears as a prominent hub with multiple connections. In October 2022, the network density decreases to 0.06. Fewer directed edges are visible overall and the network appears less dense than in the two earlier snapshots. Below the three diagrams, two tables present numeric values for seven countries: Poland (PL), Germany (DE), Italy (IT), Spain (ES), Czech Republic (CZ), France (FR) and the Netherlands (NL). The first table covers October 2021 and February 2022. For October 2021, the row labeled W. Degree shows values of 0.11 for Poland, 0.22 for Germany, 0.22 for Italy, 0.14 for Spain, 0.11 for Czech Republic, 0.06 for France and 0.06 for Netherlands. The row labeled W. Out Deg shows 0.02 for Poland, 0.15 for Germany, 0.18 for Italy, 0.11 for Spain, 0.08 for Czech Republic, 0.02 for France and 0.02 for Netherlands. For February 2022, W. Degree values are 0.11 for Poland, 0.21 for Germany, 0.19 for Italy, 0.16 for Spain, 0.08 for Czech Republic, 0.07 for France and 0.05 for Netherlands. W. Out Deg values for February 2022 are 0.01 for Poland, 0.14 for Germany, 0.16 for Italy, 0.13 for Spain, 0.06 for Czech Republic, 0.02 for France and 0.02 for Netherlands. The second table covers October 2022. W. Degree values are 0.38 for Poland, 0.15 for Germany, 0.14 for Italy, 0.08 for Spain, 0.06 for Czech Republic, 0.05 for France and 0.03 for Netherlands. W. Out Deg values are 0.20 for Poland, 0.08 for Germany, 0.12 for Italy, 0.05 for Spain, 0.05 for Czech Republic, 0.02 for France and 0.01 for Netherlands. W. Degree represents the weighted total of trade connections for each country and W. Out Deg represents the weighted outgoing connections, indicating export activity. In October 2022, Poland shows the highest W. Degree at 0.38 and the highest W. Out Deg at 0.20 among all listed countries.
Under geopolitical stress, the European arms trade network displays a stable topological structure while reallocating brokerage roles among a select group of countries. Network density remained constant at 0.07 in both October 2021 and February 2022 but decreased to 0.06 (a 14% decline) by October 2022, indicating a modest structural contraction. Despite this general stability, significant reallocations of brokerage roles are evident. Ukraine joined the dominant network at the beginning of the conflict and remained a part of it thereafter. Germany, Italy, and Spain were the most important exporters during the pre-war and short-term post-war periods. However, by October 2022, Poland had emerged as the leading exporter, despite its limited number of outgoing connections.
This suggests an increasing concentration of trade flows around a few strategic suppliers. Italy also maintained a central role, highlighting its ongoing significance in the European arms trade.
Overall, the evidence from Figure 7 indicates that, despite limited changes in aggregate connectivity, the arms trade network underwent a marked reallocation of central exporting roles following the outbreak of the war. The evidence points to a network that remains structurally connected while becoming increasingly concentrated around a small set of strategic suppliers. This pattern is consistent with theoretical contributions showing that networked economies may preserve aggregate connectivity while becoming increasingly sensitive to shocks affecting a small set of highly central nodes (Acemoglu et al., Reference Acemoglu, Carvalho, Ozdaglar and Tahbaz‐Salehi2012; Carvalho, Reference Carvalho2014).
Beyond the topological structure of the dominant network, Figure 7 provides an immediate visual encoding of trade intensities through edge thickness and colour. Darker and thicker edges identify the main export corridors that concentrate the largest volumes of arms and ammunition trade. In October 2021, the intensity of outgoing links from Germany, Italy, and Spain highlights their dominant supplier role within the network. In February 2022, shortly after the outbreak of the conflict, the visual pattern became more heterogeneous, indicating a partial redistribution of trade intensities across a broader set of exporters. By October 2022, the emergence of Poland as a leading supplier is clearly reflected not only in its network position but also in the strong darkened links directed towards Ukraine, signalling a marked concentration of trade volumes along a limited number of strategic corridors.
To complete the analysis, we examine the temporal evolution of countries’ roles using a time series of centrality metrics.Footnote 8 These dynamics illustrate how geopolitical stress translates into a reallocation of brokerage roles within an increasingly concentrated network structure. Figure 8 reports the degree centrality time series for the main EU countries. Together, the selected countries account for approximately 70–80% of total monthly degree, confirming their central role in the network. Temporal variations in degree centrality illustrate patterns of reallocation of brokerage roles over time.
Monthly degree centrality of major EU countries (excluding extra-EU) for weapons and ammunition trade, 2021–2022.

Figure 8 Long description
The line graph displays monthly degree centrality values of major EU countries for weapons and ammunition trade from 2021 to 2022. The horizontal axis represents time from January 2021 to December 2022, while the vertical axis shows betweenness centrality values ranging from 0 to 0.5. Multiple lines represent different countries, with Germany showing a significant increase in betweenness centrality, peaking around 0.5 in mid-2022. Italy and other countries have fluctuating values, with Italy reaching peaks between 0.15 and 0.3 in specific months. The legend at the bottom identifies each country′s line by color.
The results show shifting leadership dynamics. Consistent with Zhuravka et al. (Reference Zhuravka, Botvinov, Parshyna, Makarenko and Nebaba2021), Poland gains dominance in 2022, particularly in May and July. Slovakia rose sharply between March and April 2022, with its degree centrality increasing from below 0.05 to a peak of 0.20, before stabilizing at lower levels (between 0.05 and 0.10) in the post-war period. Similarly, Bulgaria exhibits a marked increase, peaking at 0.20 in May 2022. Germany and Italy remain key players throughout the period, with occasional monthly peaks, while Spain exhibits a declining trend, decreasing from pre-war levels around 0.20 to approximately 0.10 thereafter.
While degree centrality captures changes in direct trade connections, betweenness centrality allows us to identify the countries that act as strategic intermediaries within the reconfigured network. We therefore examine betweenness centrality to capture brokerage positions within the arms trade network. As shown in Figure 9, Germany emerges as the most dominant broker, with betweenness centrality values ranging from 0.20 to 0.40 before the conflict and from 0.10 to 0.30 in the post-conflict period. Italy ranks second in betweenness centrality, confirming its significant role in exchanges, with peaks between 0.15 and 0.30 in specific months, including October 2021, April 2022, July 2022, and September 2022. While these fluctuations coincide with the key phases of the conflict, further analysis would be required to disentangle war-related effects from other influencing factors.
Monthly betweenness centrality of major EU countries (excluding extra-EU) for weapons and ammunition trade, 2021–2022.

Figure 9 Long description
The multi-line graph compares trends from July 2021 to December 2022 across seven DE, IT, PL, CZ, NL, ES, FR, SK. The horizontal axis represents time in months and years, while the vertical axis shows values ranging from 0 to 0.6. Each line represents different countries, distinguished by color and style. Key observations include: DE shows a peak around October 2021 at approximately 0.4. IT is relatively stable during the first half of the period but experiences a marked increase in July 2022, reaching approximately 0.31, followed by another peak in September. PL remains relatively stable, generally fluctuating between 0.05 and 0.1. NL and ES display stronger short-term fluctuations, with ES reaching a notable peak in late 2021. Overall, the figure highlights substantial differences in both the level and dynamics of centrality across countries.
Other countries played episodic roles, including Spain in November 2021 and October 2022, the Czech Republic in October 2021, and the Netherlands in May 2022. By contrast, the remaining countries occupy marginal positions in terms of betweenness centrality.
This pattern is consistent with rotating leadership dynamics in trade networks, where brokerage roles shift over time rather than remaining fixed.
Overall, the evidence indicates that the arms trade network remained structurally resilient while experiencing increasing trade flow concentration and a reallocation of brokerage roles, with Poland emerging as a key exporter and Germany and Italy preserving their brokerage positions. This combination of structural resilience and national reconfiguration is consistent with findings from other trade networks exposed to major shocks (De Benedictis et al., Reference De Benedictis, Nenci, Santoni, Tajoli and Vicarelli2014; Wang et al., Reference Wang, Chen and Song2023).
5.2.2 Counterfactual Shock Analysis: Motivation and Framework
The network and time series evidence presented above describes how the arms trade system adapted to the shock triggered by the Russia–Ukraine conflict. We therefore turn to the CES-based counterfactual framework described above to evaluate how the system would respond to the removal of a key supplier and to alternative trade reallocation mechanisms.
To this end, we implement an advanced shock-simulation framework to explore counterfactual scenarios beyond the observed network dynamics. Specifically, we evaluate a counterfactual reallocation of European exports to Ukraine following an exogenous trade shock corresponding to the removal of one of the supplying countries from the market. This case study focuses on the product, exports of arms and ammunition, using data referring to November 2022, several months after the outbreak of the conflict. It is worth noting that the counterfactual analyses presented here are conducted outside the web-based dashboard, within the broader TERRA analytical framework. This separation reflects a deliberate design choice to ensure methodological transparency, analytical flexibility, and the ability to replicate or extend the simulations using alternative trade datasets.
In this simulated scenario, Poland (PL), traditionally one of Europe’s top exporters of the product under study to Ukraine, is removed as a supplier. The analysis assesses how other European trade partners compensate for the resulting supply gap, which countries show greater flexibility in adjusting trade flows, and how the reallocated quantities are distributed among alternative suppliers.
The simulation framework allows trade flows to be reallocated across competing partners subject to substitution constraints, going beyond simple link removal by explicitly modelling demand redistribution. Trade reallocation is modelled using a Constant Elasticity of Substitution (CES) framework that governs demand redistribution across alternative suppliers. The formal structure and calibration of the model are described in Section 4.4.
5.2.3 Functional Fragility under Counterfactual Supply Shocks
We now evaluate how the concentrated network structure, presented in Section 5.2.1, responds to the removal of a dominant supplier. These mechanisms are closely related to the propagation and amplification channels identified in production network models, where shocks to highly central suppliers generate disproportionately large reallocation effects (Baqaee and Farhi, Reference Baqaee and Farhi2020).
This subsection presents the results of the counterfactual analysis, illustrating how the removal of a key supplier reshapes trade flows in the weapons and ammunition market. We focus on the redistribution of quantities across alternative European exporters and assess substitution patterns implied by the CES framework.
We simulate the removal of Poland (PL), a significant and policy-relevant disruption, considering its pivotal role as a central logistical hub and a major contributor to European arms exports to Ukraine. This exclusion prompts a considerable reallocation of residual demand among alternative exporters, facilitating an empirical evaluation of supply elasticity, the marginal capacity of remaining suppliers, and the influence of relative prices in international competition. Furthermore, it exposes the vulnerability of a European supply chain that is excessively concentrated in a limited number of countries.
Table 1 summarizes the redistributionFootnote 9 patterns implied by the CES framework, highlighting a highly skewed substitution process dominated by a small set of alternative suppliers. More specifically, it shows the quantitative effects of the counterfactual removal of Poland (PL) from the group of exporters to Ukraine. As expected, the Polish share drops to zero ( $shar{e_{post}} = 0$), whereas in the pre-shock period it accounted for over 90% of total quantities (
 $shar{e_{base}} = 0.906$). This generates a substantial reallocation of trade flows, which the CES model distributes across alternative suppliers according to relative prices and baseline shares.
CES-based counterfactual analysis results

Table 1 Long description
Rows list suppliers and columns report Value, Quantity, Price, Baseline Quantity, Post shock Quantity, change in export quantities relative to baseline, Baseline Share, and Post shock Share. Poland has Value 257,659,829, Quantity 3,285,008, Price 78.435, Baseline Quantity 3,360,721.78, Post shock Quantity 0.00, change minus 3,360,721.78, Baseline Share 0.906, and Post shock Share 0.000. Slovakia has Value 20,062,559, Quantity 206,585, Price 97.115, Baseline Quantity 170,693.76, Post shock Quantity 3,279,421.37, change 3,108,727.61, Baseline Share 0.057, and Post shock Share 0.606. Lithuania has Value 1,976,576, Quantity 33,213, Price 59.512, Baseline Quantity 44,782.58, Post shock Quantity 860,376.77, change 815,594.19, Baseline Share 0.009, and Post shock Share 0.097. Spain has Value 472,471, Quantity 56,836, Price 8.313, Baseline Quantity 549,628.38, Post shock Quantity 10,540,418.02, change 9,991,789.64, Baseline Share 0.016, and Post shock Share 0.167. Latvia has Value 460,524, Quantity 23,565, Price 19.543, Baseline Quantity 96,758.48, Post shock Quantity 1,858,953.82, change 1,762,195.34, Baseline Share 0.006, and Post shock Share 0.069. Germany, Czechia, Estonia, Denmark, Netherlands, Italy, and Belgium each show small baseline shares at 0.002 or lower and post shock shares ranging from 0.000 to 0.024, with post shock quantities 214,539.90 for Germany, 11,343.76 for Czechia, 44,861.64 for Estonia, 6,519.26 for Denmark, 3,893,992.67 for Netherlands, 98.43 for Italy, and 6,328.03 for Belgium.
Notes: Baseline and post-shock export shares and quantities for EU suppliers after the removal of Poland from the market. Quantities are measured in physical units.  ${\Delta _q}$ denotes the change in export quantities relative to the baseline scenario and is computed as the difference between post-shock and baseline values.
The redistribution is highly skewed: Slovakia absorbs 61% of post-shock quantities ( $shar{e_{post}} \approx 0.606$), while Spain, Latvia, and Lithuania account for most of the remaining adjustment. In more detail, Spain increases its market share to around 17% (
 $shar{e_{post}} \approx 0.167$) despite having a limited presence prior to the shock. Latvia and Lithuania also experience substantial relative gains, together reaching approximately 16–17% of post-shock quantities. Meanwhile, the Netherlands expands significantly, reaching around 3.9 million units, driven by highly competitive pricing.
These results, shown in the following Figure 10, indicate that post-shock substitution is highly concentrated rather than diffused across the network, reinforcing the evidence of functional fragility identified in the network analysis.
Comparison of baseline and post-shock export quantities by EU supplier in the counterfactual analysis.

Figure 10 Long description
Horizontal bar chart comparing ‘Quantity’ and ‘New Quantity’ across 11 European countries, listed on the y-axis from ES, NL, SK, PL, LV, LT, DE, EE, CZ, DK, to IT. The x-axis shows values from 0 to 12,000,000. ES shows the largest New Quantity value, at roughly 10,500,000, followed by the NL at about 3,800,000 and SK at about 3,200,000. PL is the only country where the original Quantity bar (in blue) is dominant, at roughly 3,200,000, with little to no New Quantity value shown. LV and LT show moderate New Quantity values of about 1,800,000 and 900,000 respectively. DE shows a small New Quantity value, while EE, CZ, DK, and IT show minimal to negligible values for both metrics.
These results suggest that stable aggregate connectivity may coexist with growing functional fragility. System-wide adjustment increasingly depends on a limited number of highly central suppliers. In line with production network theory, these highly connected suppliers serve as critical bottlenecks for aggregate adjustment (Acemoglu et al., Reference Acemoglu, Carvalho, Ozdaglar and Tahbaz‐Salehi2012; Carvalho, Reference Carvalho2014; Baqaee and Farhi, Reference Baqaee and Farhi2020).
From a policy standpoint, these results highlight the importance of diversification strategies and coordinated capacity-building measures aimed at reducing excessive dependence on a small set of exporters. Enhancing production flexibility and expanding the set of suppliers would mitigate the amplification mechanisms identified above, thereby enhancing the resilience of European defence supply chains against geopolitical disruptions.
6. Conclusions
The changing structure of the global trading system has intensified policy debates over the benefits of international specialization within global value chains and the systemic risks posed by shock propagation across interconnected supply networks. In this context, timely and structured analytical tools are more necessary than ever to support evidence-based trade governance with transparent and high-quality data.
This paper introduced TERRA, an analytical framework developed at Istat that leverages high-frequency Eurostat COMEXT data to represent European trade as a system of weighted directed networks and complementary time series indicators. By combining interactive visual monitoring with reproducible programmatic access to network measures and providing an offline environment for advanced analyses and counterfactual analyses, TERRA enables systematic screening of trade interdependencies, identification of emerging concentrations, and evaluation of countries’ evolving roles within trade networks.
The two empirical applications demonstrate the value of this approach under major systemic shocks. In the electricity case study during the COVID-19 pandemic, large contractions in volumes coexist with limited changes in aggregate connectivity, while centrality profiles reveal non-trivial reallocations of bridging roles among key countries. In the weapons and ammunition case study of the Russia–Ukraine conflict, the network remains broadly connected but becomes increasingly concentrated around a restricted set of strategic actors; the counterfactual CES exercise further illustrates how stable connectivity can mask functional fragility, as adjustment mechanisms may be dominated by a small subset of suppliers. Taken together, the evidence supports a recurrent pattern: aggregate resilience may coexist with role concentration and latent vulnerabilities that are not easily detectable from traditional trade aggregates alone.
Overall, the empirical evidence highlights a recurrent pattern in European trade networks: stable aggregate connectivity coexists with an increasing concentration of functional roles among a limited number of countries, generating latent vulnerabilities under systemic shocks. These features make TERRA particularly well-suited to support early warning activities and policy-screening exercises in highly interconnected markets.
Several limitations are primarily driven by data coverage and reporting constraints. COMEXT provides a European perspective and does not observe extra-EU to extra-EU exchanges, which may affect the interpretation of global connectivity and shortest-path-based indicators; TERRA mitigates this issue by aggregating extra-EU nodes when appropriate. Moreover, asymmetries between import and export declarations are inherent to the source data, motivating the use of the Average flow as a reconciled reference for network construction.
Future developments will focus on extending data integration and harmonization procedures and on further enriching reproducible analytical workflows. Advanced longitudinal diagnostics for role dynamics, including rotating leadership-type analyses, are already supported through the TERRA APIs and will be progressively integrated into more automated analytical pipelines.
Data Availability Statement
The data that support the findings of this study are openly available in Harvard Dataverse at https://doi.org/10.7910/DVN/RBEKB8.
Appendix A. Advanced Longitudinal Analyses
This appendix illustrates how TERRA supports advanced longitudinal analyses of trade networks beyond the interactive dashboard environment. While the dashboard is designed for exploratory monitoring and early warning, the underlying analytical framework provides programmatic access to both node- and network-level indicators, enabling reproducible analyses of monthly and quarterly trade networks.
Through dedicated APIs, TERRA offers time-indexed network metrics that can be systematically organized into tabular time series formats. This approach enables cross-country comparisons, the identification of structural shifts, and the combined analysis of individual countries’ roles and global network features. All longitudinal indicators are calculated using the same network construction rules and methodological assumptions as those in the dashboard, ensuring complete analytical consistency across various environments.
To promote transparency and reproducibility, the longitudinal procedures underlying these analyses are available in a publicly accessible Jupyter notebook maintained within the main TERRA project repository (GitHub: https://github.com/istat-methodology/terra/tree/main/terra-analysis). The notebook details the full analytical workflow, including data retrieval via TERRA APIs, the creation of time-indexed network indicators, and the generation of illustrative visualizations. This setup enables analysts to replicate the results shown in this paper, extend them to different time periods, or apply the same methodology to other trade datasets.
The analyses in this appendix detail technical variations of the longitudinal network analyses presented in the case studies in the main text. Specifically, they include the same network indicators shown in the case studies but under different network configurations, such as adding the aggregated extra-EU node.
Figure A1 replicates the analysis shown in Figure 5 of the paper by including the aggregated extra-EU node in the network representation. The figure reports the same longitudinal indicators, betweenness centrality and network density, allowing the role of extra-EU trade to be considered alongside EU Member States.
Monthly betweenness centrality for electricity transmission and distribution services of major EU countries and the aggregated extra-EU node (lines, right axis), together with overall network density (histogram, left axis).

Figure A1 Long description
. The multi-line graph compares trends from July 2021 to December 2022 across seven EXTRAEU, DE, IT, PL, CZ, NL, ES, FR, SK. The horizontal axis represents time in months and years, while the vertical axis shows values ranging from 0 to 0.6. Each line represents different countries, distinguished by color and style. Key observations include: EXTRAEU fluctuates between the values0.5 and 0.7. DE shows a peak around October 2021 at approximately 0.4. IT is relatively stable during the first half of the period but experiences a marked increase in July 2022, reaching approximately 0.31, followed by another peak in September. PL remains relatively stable, generally fluctuating between 0.05 and 0.1. NL and ES display stronger short-term fluctuations, with ES reaching a notable peak in late 2021. Overall, the figure highlights substantial differences in both the level and dynamics of centrality across countries.
The following figures present longitudinal network indicators for the weapons and ammunition trade case study presented in the main text under an alternative network configuration that includes the aggregated extra-EU node. Figure A2 shows the time series of degree centrality for selected EU Member States and the aggregated extra-EU node, while Figure A3 reports the corresponding betweenness centrality measures over the same period. Together, these figures document the evolution of node-level connectivity and intermediary positions using the same indicators and time windows adopted in the case study analysis.
Monthly degree centrality of major EU countries and the aggregated extra-EU node for weapons and ammunition trade, 2021–2022.

Figure A2 Long description
The graph displays multiple lines plotted over time. The horizontal axis shows date intervals spanning from 2021 to 2022. The vertical axis ranges from 0.0 to 1.0 in increments of 0.1, with no unit label visible. A legend is present along the bottom of the graph, listing series labels that are partially readable due to image resolution. The readable legend entries include labels that appear to reference category or group identifiers, though the full text of each label is not clearly legible at this resolution. EXTRAEU runs consistently near the upper range of the vertical axis, staying close to values between 0.6 and 0.8 throughout the entire date range, with minor dips and recoveries. PL remains near the lower portion of the scale for most of the date range, then rises sharply around mid to late 2020, reaching a peak near 0.9 before stabilizing. Several other lines cluster in the lower range, between 0.0 and 0.3, crossing each other frequently and showing smaller fluctuations throughout the period. Some lines remain relatively flat across the full date range. Others show minor peaks and troughs at various intervals. The lines are visually distinguished from one another through varying line styles and differing patterns. The graph tracks changes across multiple series over the 2019 to 2020 period, with most series remaining in the lower range while one series shows a marked increase in the later portion of the date range.
Monthly betweenness centrality of major EU countries and the aggregated extra-EU node for weapons and ammunition trade, 2021–2022.

Figure A3 Long description
The multi-line graph compares different data series over time from July 2021 to December 2022. The horizontal axis represents time in months, while the vertical axis is unlabeled but ranges from 0.0 to 1. The legend identifies multiple series: EXTRAEU, DE, IT, PL, CZ, NL, ES, FR and SK. The EXTRAEU line remains stable around 0.9 throughout the period. The IT line shows fluctuations with peaks around 0.3 in mid 2022. The DE line has several spikes, notably reaching approximately 0.4 in late 2021. Other lines, such as PL, show minor variations below 0.2. Lines are visually distinguished by different styles and colors. The graph illustrates how EXTRAEU consistently remains higher than other series, which cluster lower with occasional spikes. This comparison highlights the stability of EXTRAEU against the variability of other data series.
Together, these longitudinal analyses show how external shocks reshape both the structure and the functional balance of European electricity trade networks, and how TERRA enables the identification of shifts in centrality and emerging interdependencies that remain hidden in static representations.
Appendix B. The TERRA Offline Analytical Package
This appendix describes the TERRA offline analytical package, designed to enhance the monitoring capabilities of the TERRA platform by providing advanced analyses not available in the web-based dashboard. The package provides a modular, reusable analytical environment for network analysis, longitudinal aggregation, and model-based scenario simulations of trade datasets.Footnote 10
At its core, the framework operates on trade datasets organized as directed weighted networks, where nodes represent countries and edges their trade flows observed over a specific period and product category. Input data are validated and standardized to ensure consistency in network representation, including how import and export declarations are handled and the creation of a single weighted network when bilateral flows are reported separately.
The offline package implements three modules: network analysis, basket-based time-series aggregation, and CES-based scenario simulation, fully consistent with the methodology described in Section 4 of this paper and optimized for flexible parameterization, reproducible workflows, and large-scale analyses. The CES-based simulation module provides a transparent representation of demand redistribution mechanisms following trade disruptions. By explicitly modelling substitution elasticities and preference weights, the package supports policy-relevant scenario analysis that complements the network-based monitoring tools available in the dashboard.
Overall, the TERRA offline analytical package extends the TERRA framework rather than functioning as a standalone system. It maintains full compatibility with the network representations and indicators used in the online environment, while providing the flexibility needed for advanced analyses, reproducible research workflows, and the application of TERRA methodologies to different trade datasets.
Appendix C. Workflow Underlying the TERRA Platform
The workflow underlying TERRA is designed to ensure the regular updating, consistency, and accessibility of high-frequency trade statistics used for monitoring and analysis. As illustrated in Figure C1, the process follows a structured sequence that spans data acquisition, updating, storage, processing, and visualization.
Workflow of the TERRA platform, from data acquisition to interactive visualization.

Figure C1 Long description
The figure illustrates the data workflow underlying the TERRA platform. On the left, Eurostat provides data from four main source categories: Product, Transport, Classifications, and Others. These data are periodically updated through a batch process and stored in dedicated folders and databases. The storage layer includes classification data, maps data, network analysis data, and time series data. The stored information is then processed by metadata, network, and time-series servers. Finally, the processed data are made available through the TERRA visualization platform, which provides an interactive map, EU–Extra-EU and EU–World trade graphs, time-series visualizations, and a basket of traded products. The figure therefore represents the complete pipeline from data acquisition to processing and user-facing visualization.
The process starts with the automated download of monthly COMEXT datasets from Eurostat. These include raw trade records and classification files that are standardized, harmonized, and aggregated to generate consistent ten-year time series and network-ready datasets. Batch updating procedures ensure alignment with official data releases.
The processed data are stored in separate folders and databases for classification files, time series, and network trades, enabling efficient access by the analytical and visualization modules. This setup helps to keep the large volume of data manageable and allows for quick access when needed. During processing, metadata, network indicators, and longitudinal series are generated to support the dashboard environment.
The final layer consists of the TERRA dashboard, which provides interactive maps, graphs, and network visualizations for real-time exploration of trade dynamics. This structured workflow ensures data consistency, timeliness, and accessibility while preserving full coherence between monitoring, analysis, and visualization components.
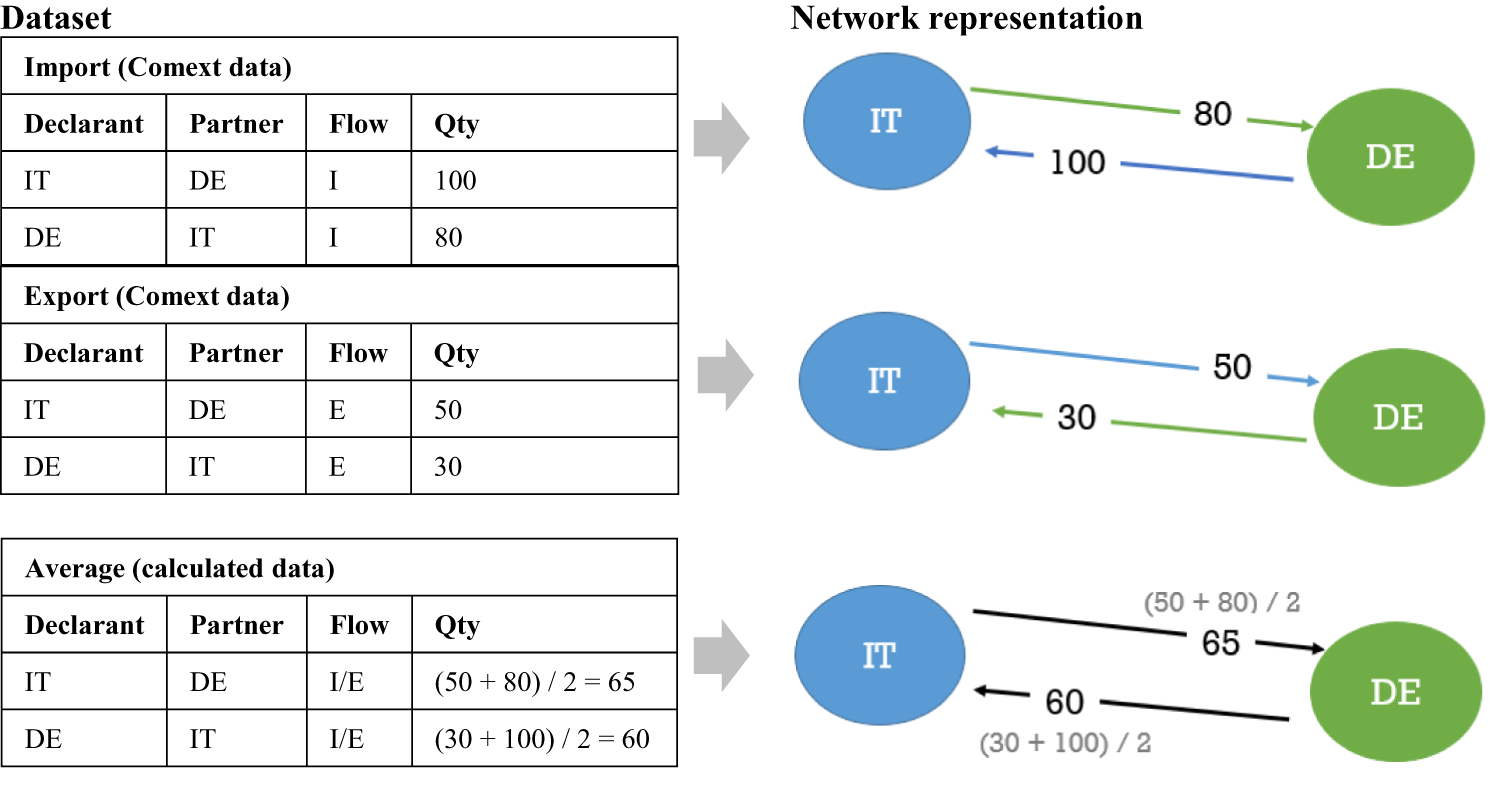
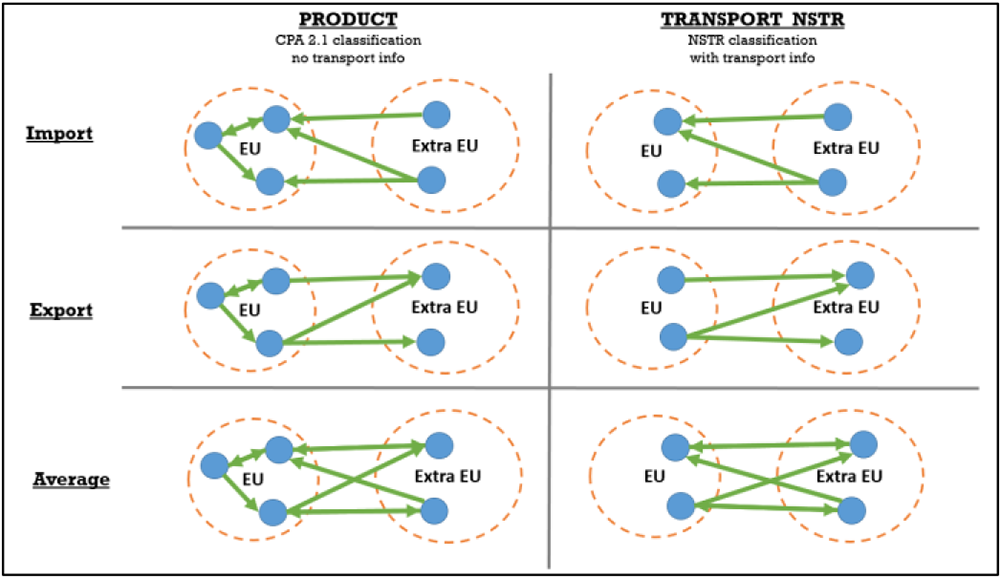
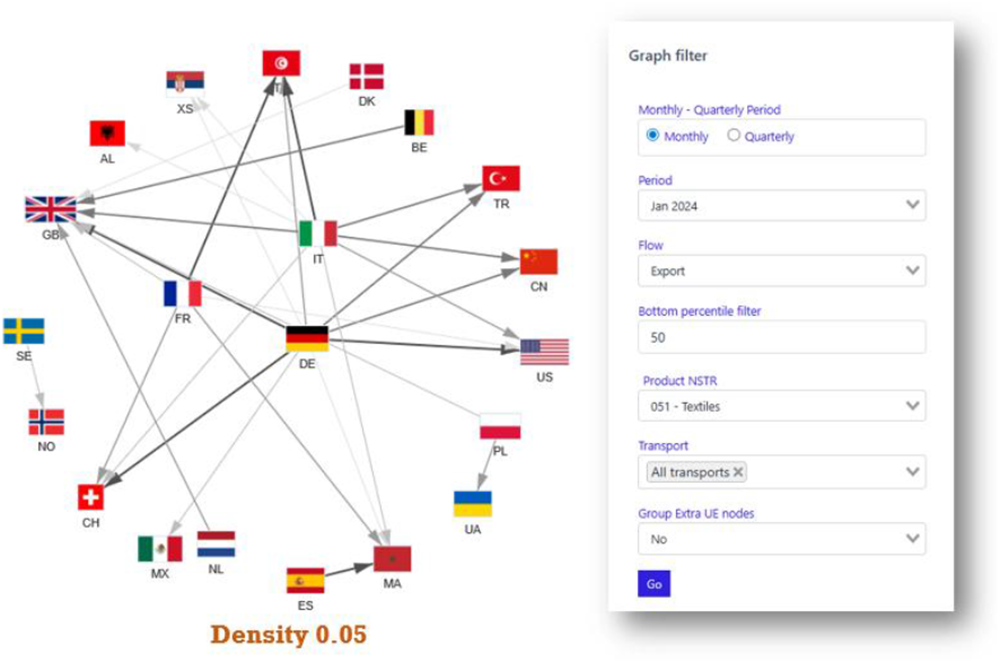
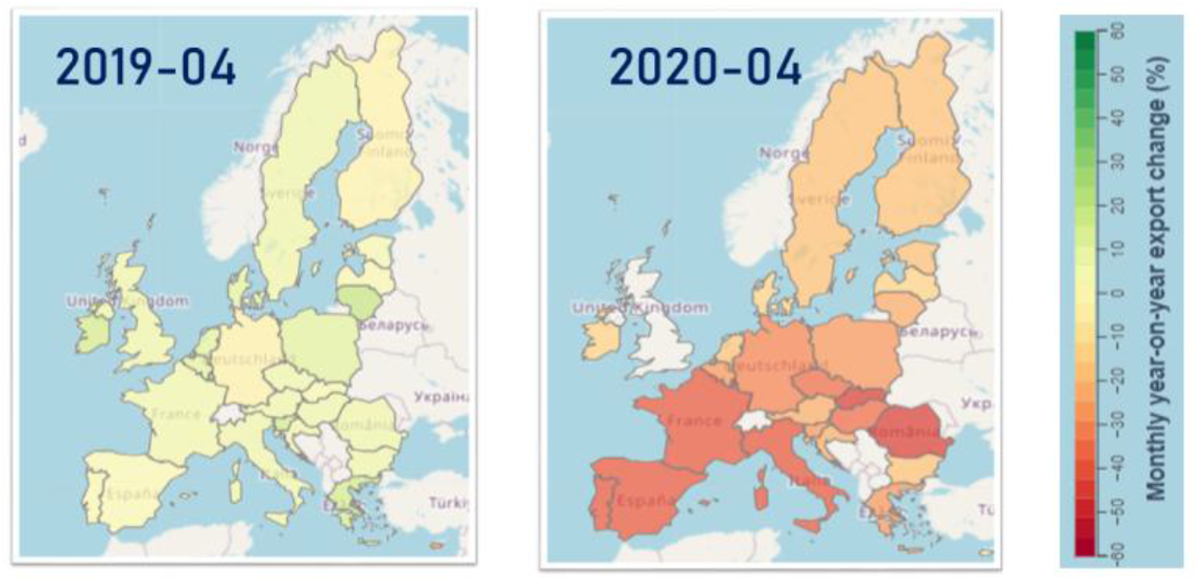
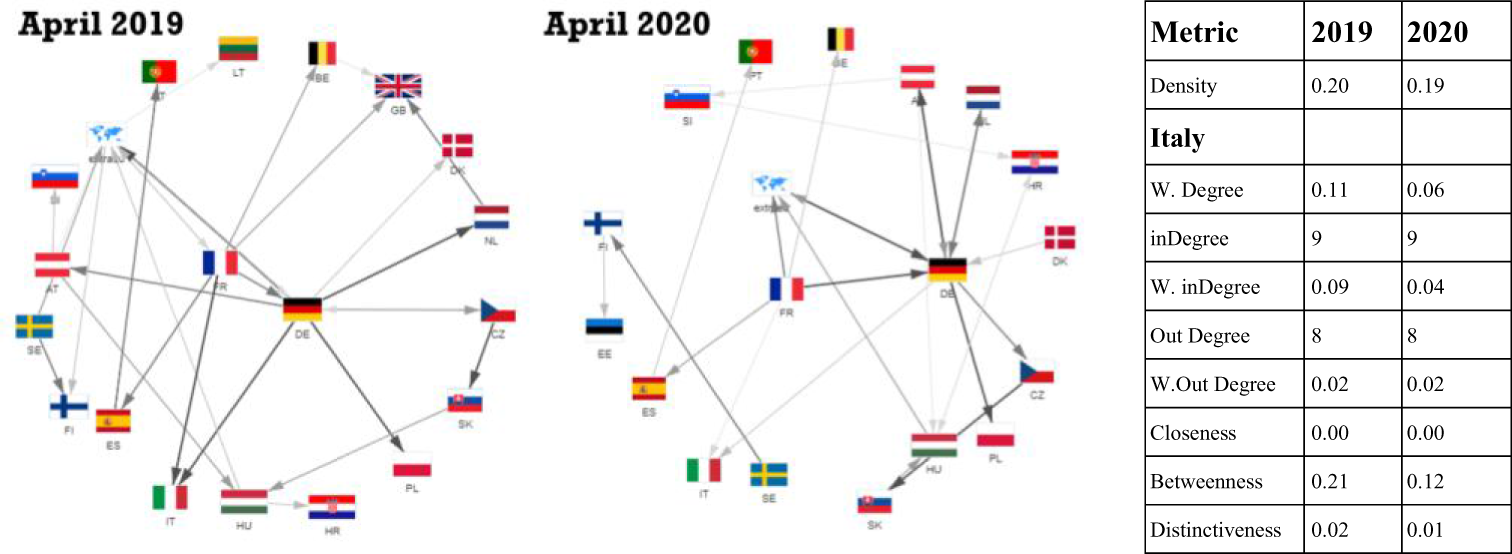
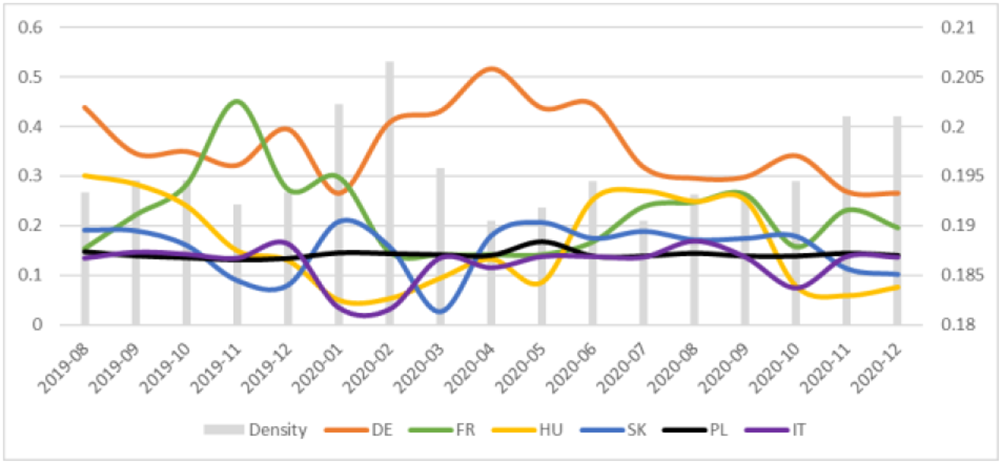
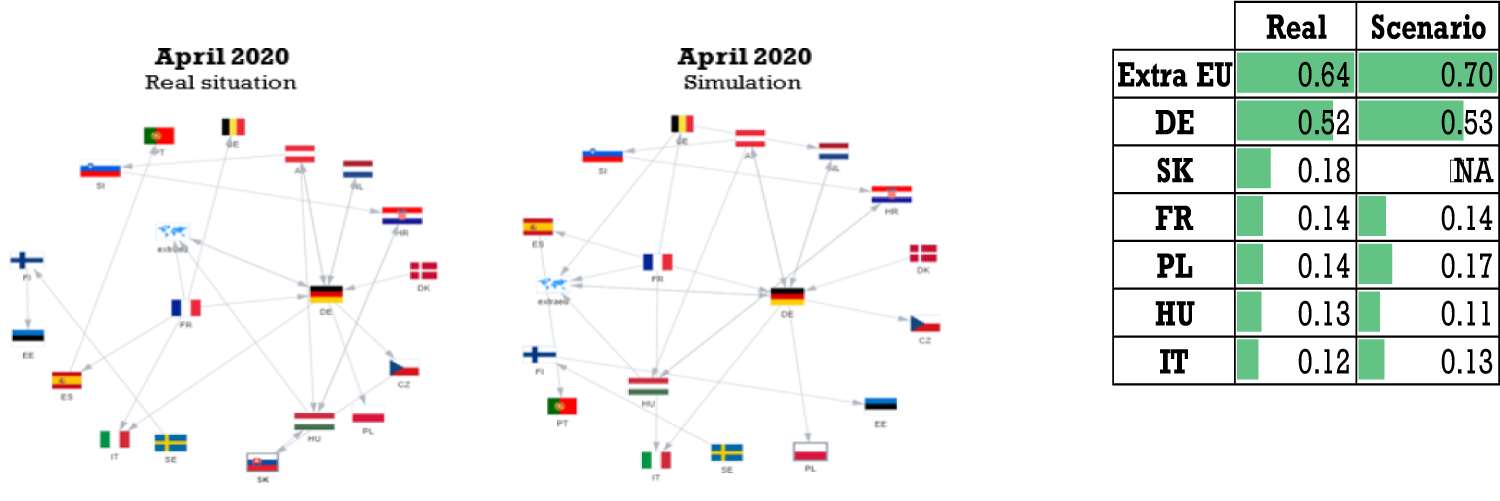
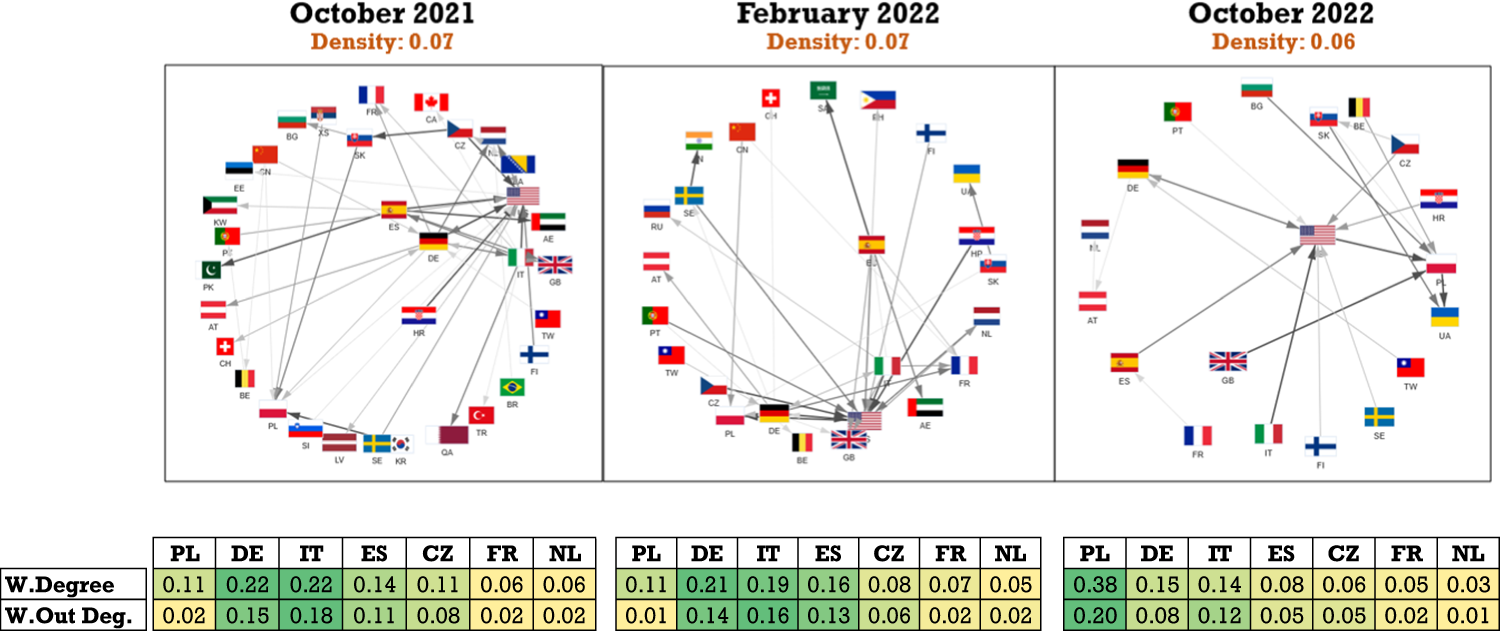
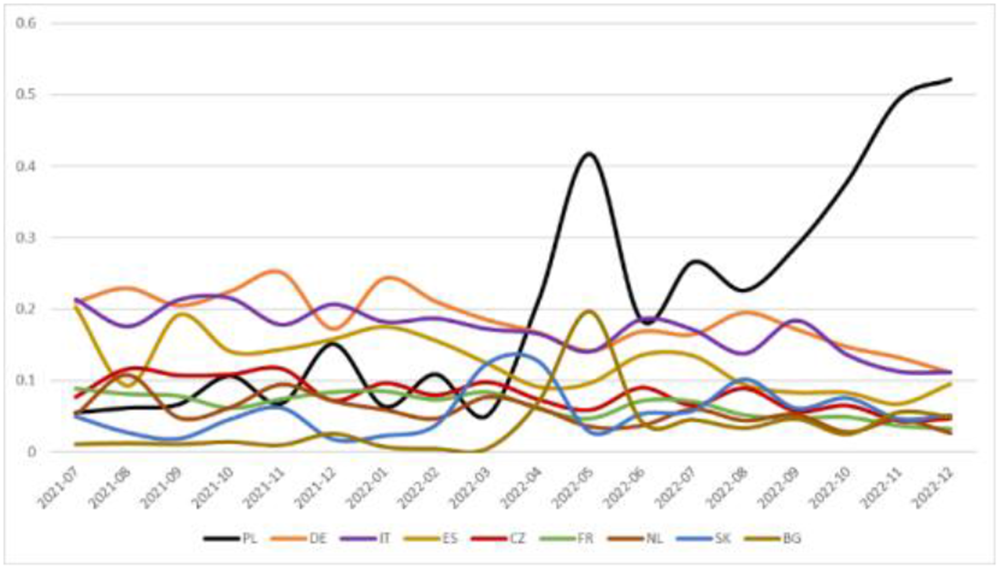
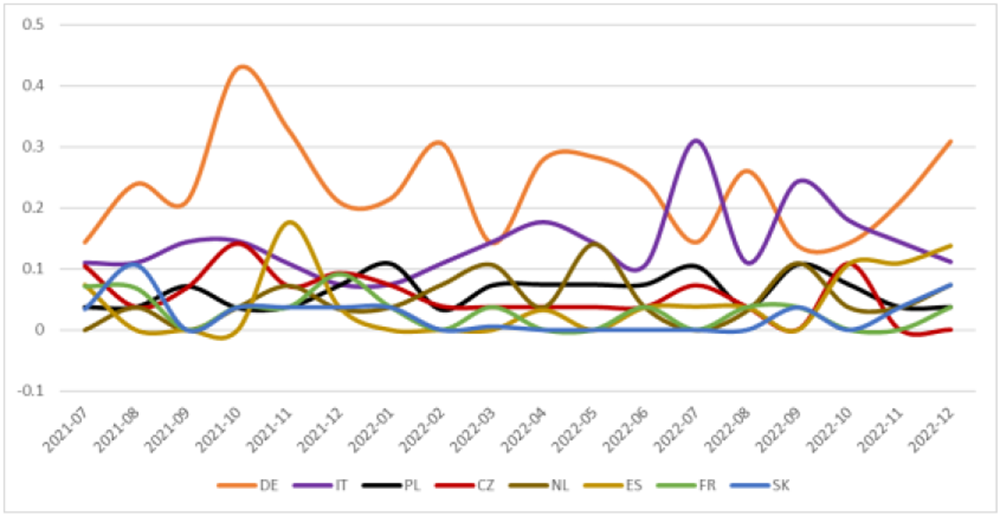
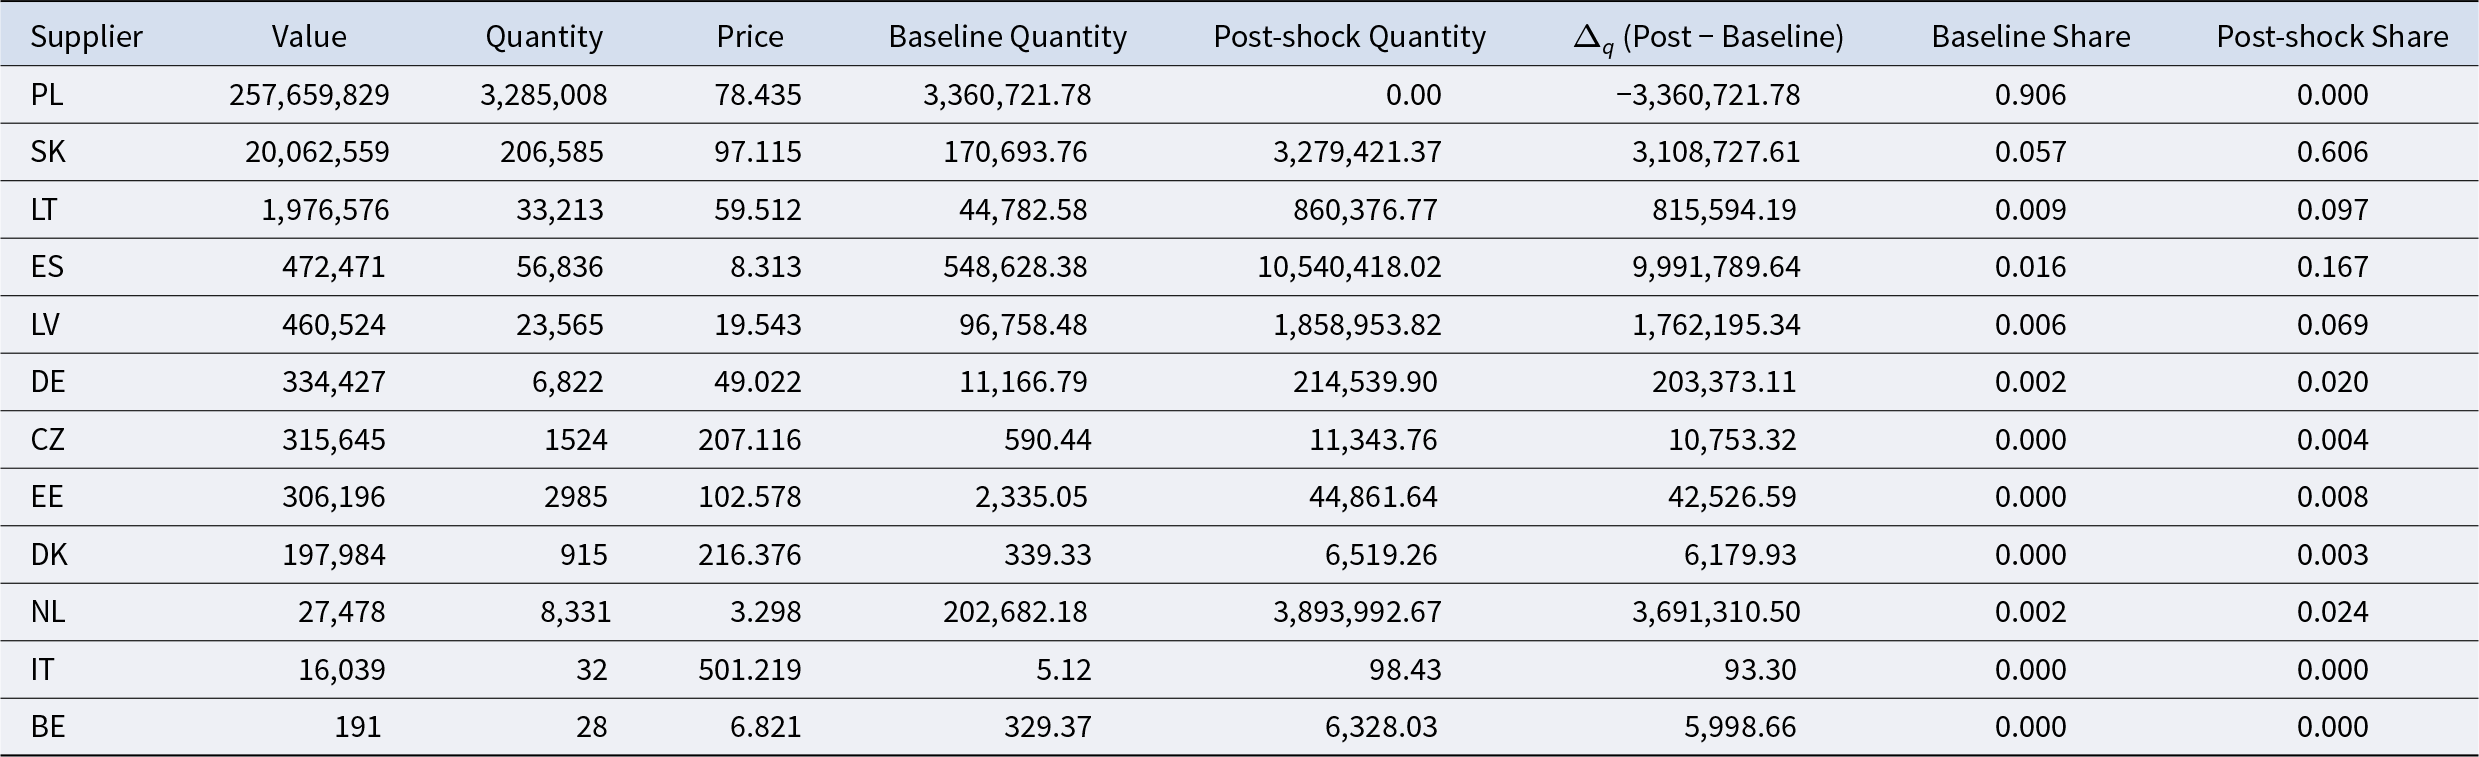
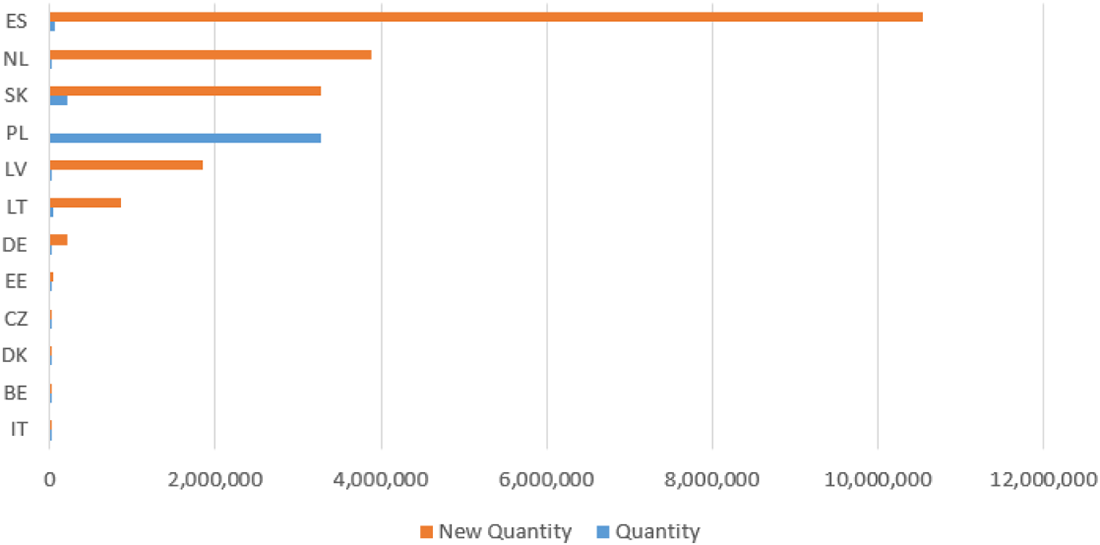
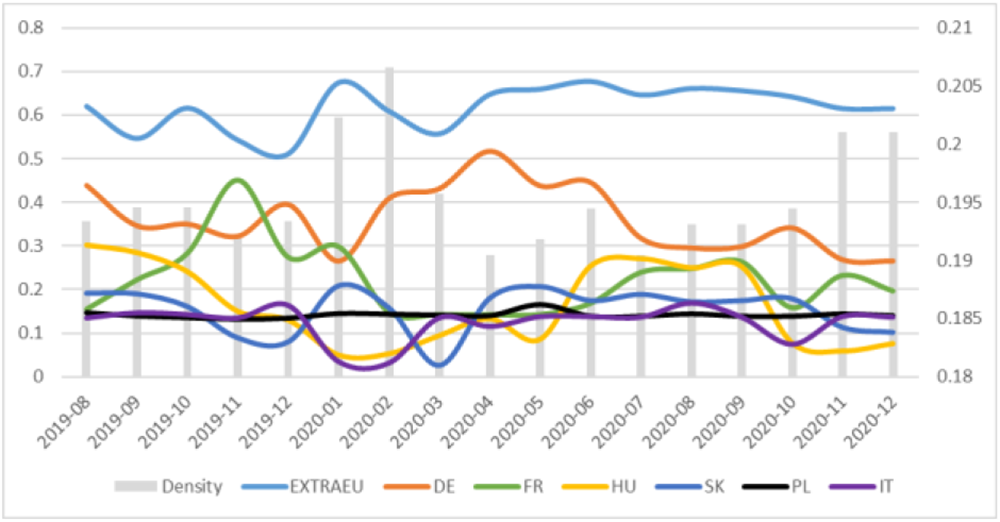
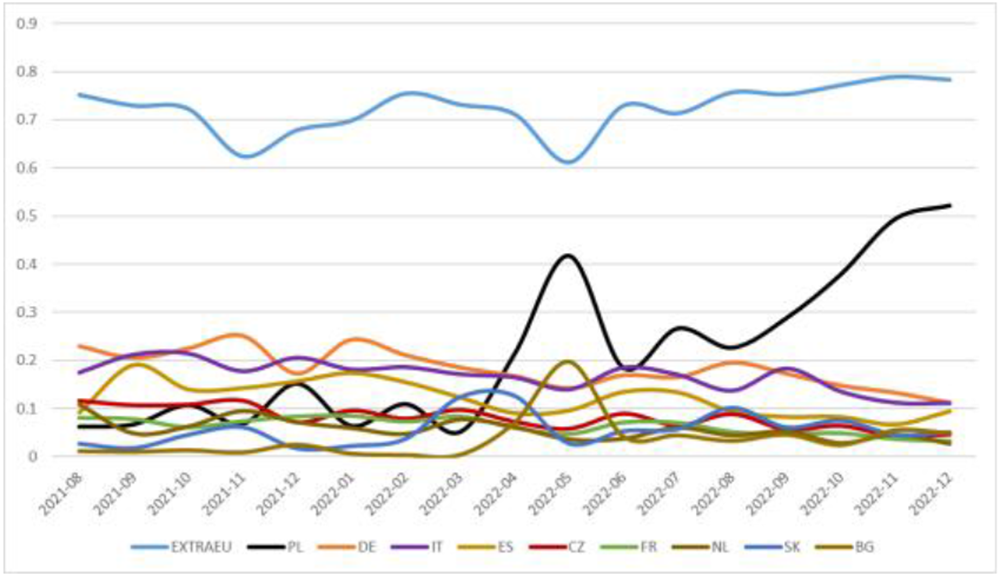
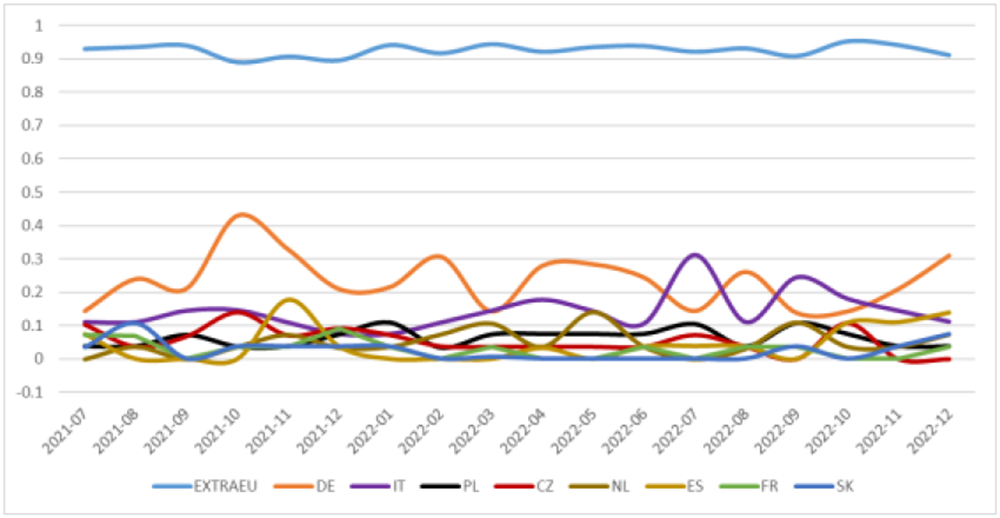
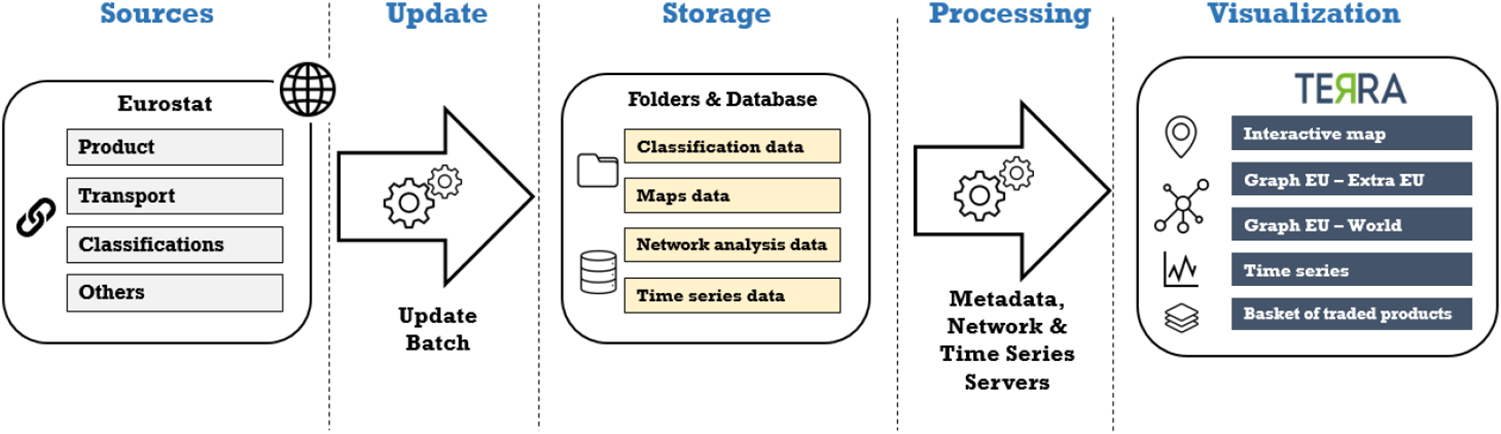

 Open access

