







1. Introduction
Over the last few decades, numerous studies of fluid flows over a compliant substrate or through compliant walls have been performed in exploring the drag-reducing capabilities of various compliant coatings since the experimental work of Kramer (Reference Kramer1957). In the case of a boundary-layer instability, the transition to turbulence can be impeded by a particular compliant surface, which keeps the flow in a laminar state for a longer period of time. As a consequence, the mass and momentum fluxes modify near the compliant surface and change the drag characteristics, the acoustic properties and the heat and mass transfer rates (Riley, el Hak & Metcalfe Reference Riley, el Hak and Metcalfe1988). Further, such problems are very relevant in aiding the development of the biomedical field. For example, investigation of flow–structure interactions in the cardiovascular system is of crucial biological importance in figuring out pulse propagation and transmural pressure variations in arteries (Halpern & Grotberg Reference Halpern and Grotberg1993; Grotberg & Jensen Reference Grotberg and Jensen2004).
In this context, the theoretical study of the hydrodynamic stability of a boundary-layer flow over a flexible substrate was initiated by Benjamin (Reference Benjamin1960) and Landhal (Reference Landhal1962). As discussed by them, internal damping has a destabilizing effect on the Tollmien–Schlichting mode. Later, Gyorqyfalvy (Reference Gyorqyfalvy1967) performed an extensive analytical study on the boundary-layer stability and transition for an incompressible Blasius flow over a flexible surface based on the simple flexible skin model consisting of a spring-backed membrane with internal damping. His analysis predicted significant transition delay of the Tollmien–Schlichting instability through a reduction in amplification rate rather than increase in critical Reynolds number. A detailed investigation of the hydrodynamic stability of flows over Kramer-type compliant surfaces was carried out by Carpenter & Garrad (Reference Carpenter and Garrad1985, Reference Carpenter and Garrad1986). Two different types of instabilities, namely the flow-induced surface instability (FISI) and the Tollmien–Schlichting instability (TSI), were recognized in numerical simulation under the framework of an Orr–Sommerfeld-type equation. It was reported that viscoelastic damping stabilizes the FISI but destabilizes the TSI. Further, the modal coalescence between FISI and TSI was identified. Later, the same physical phenomenon was disclosed by Sen & Arora (Reference Sen and Arora1988) as the transitional mode. Carpenter & Gajjar (Reference Carpenter and Gajjar1990) developed an asymptotic theory for two- and three-dimensional disturbances in two-dimensional boundary layers over isotropic and anisotropic compliant walls. Basically, their theoretical study was developed in exploring the travelling wave flutter instability pointed out by Carpenter & Garrad (Reference Carpenter and Garrad1985, Reference Carpenter and Garrad1986). Recently, the temporal modal and non-modal growth of three-dimensional disturbances in the boundary-layer flow over an infinite compliant flat wall was deciphered by Malik, Skote & Bouffanais (Reference Malik, Skote and Bouffanais2018) based on the normal velocity and normal vorticity formulations. As discussed by them, the maximum transient growth rate increases slowly with the Reynolds number in comparison with the rigid-wall case.
On the other hand, the study of the instability of a Poiseuille flow through a flexible channel was originated by Hains & Price (Reference Hains and Price1962), where the compliant walls were assumed to be stretched flexible membranes. However, the mass of the membrane and the effect of the elastic foundation were ignored in their study. Later, Tsvelodub (Reference Tsvelodub1977) analysed the instability of a Poiseuille flow in a elastic channel with flexible walls modelled as elastic plates. The finite-amplitude stability of a plane Poiseuille flow in a channel with compliant boundaries was examined by Rotenberry (Reference Rotenberry1992). As discussed by Rotenberry, the finite-amplitude travelling wave solution is destabilized for sufficiently compliant walls as soon as the amplitude of the disturbance increases. However, there was no significant qualitative difference between the process of transition in a channel with compliant boundaries and in a channel with rigid boundaries. The nonlinear stability of a channel flow with one compliant wall was studied by Ehrenstein & Rossi (Reference Ehrenstein and Rossi1993) based on the Ginzburg–Landau equation. The above flow model was further revisited by Gajjar & Sibanda (Reference Gajjar and Sibanda1996) to take into account the effect of various compliant wall parameters on the deviation of TSI from the results of a rigid-wall model. Furthermore, a nonlinear stability analysis is carried out. However, these authors were mainly concerned with deciphering Tollmien–Schlichting waves. On the contrary, investigation of flow-induced surface instabilities for a plane channel flow with compliant boundaries can be found in the work of Davies & Carpenter (Reference Davies and Carpenter1997). The physical mechanism of instability for a two-dimensional inviscid shear flow in a flexible channel was provided by Huang (Reference Huang1998). Recently, the non-modal energy amplification for a channel flow with compliant walls was explored by Hoepffner, Bottaro & Favier (Reference Hoepffner, Bottaro and Favier2010), where the compliant walls were modelled as spring-backed flexible plates. Their numerical analysis predicts that the fluid–structure system is unstable to flow-induced surface instabilities when the compliant wall stiffness is low.
Parallelly, there are extensive studies on the instability of falling liquid films over a rigid substrate since the experimental work of Kapitza (Reference Kapitza1948). In this case, the primary instability induced by the surface mode evolves downstream through a sequence of nonlinear events and finally leads to spatio-temporal chaos as soon as the Reynolds number surpasses its critical value. The details of falling film instability can be found in a number of important references (Alekseenko, Nakoryakov & Pokusaev Reference Alekseenko, Nakoryakov and Pokusaev1994; Oron, Davis & Bankoff Reference Oron, Davis and Bankoff1997; Chang & Demekhin Reference Chang and Demekhin2002; Craster & Matar Reference Craster and Matar2009; Kalliadasis et al. Reference Kalliadasis, Ruyer-Quil, Scheid and Velarde2012). Apart from the surface mode generally appearing at low Reynolds number, there exists another mode, referred to as the shear mode, which emerges in numerical simulation when the Reynolds number is very large and the inclination angle is small (Lin Reference Lin1967; Bruin Reference Bruin1974; Chin, Abernath & Bertschy Reference Chin, Abernath and Bertschy1986; Floryan, Davis & Kelly Reference Floryan, Davis and Kelly1987; Samanta Reference Samanta2013b). Recently, the study of the falling film model has been extended towards the direction of falling films over flexible substrates in deciphering the interactions between flowing fluid and a flexible structure because such settings have immense biological applications. In this context, Matar & Kumar (Reference Matar and Kumar2004) initiated the rupture phenomenon for a surfactant-covered thin liquid film on a flexible wall based on the evolution equations for the deflections of the air–liquid and wall–liquid interfaces. It was reported that increases in the level of damping, the longitudinal wall tension and the relative magnitudes of the Marangoni stresses have a stabilizing influence on the primary instability. Later, their further investigation (Matar & Kumar Reference Matar and Kumar2007) showed that wall flexibility destabilizes the flow through the increase in maximal temporal growth rate if the relative significance of wall damping or wall tension is decreased. The above study was further revisited by Matar, Craster & Kumar (Reference Matar, Craster and Kumar2007) to inspect the nonlinear stability of a fluid flowing down a flexible substrate. The Kuramoto–Sivashinsky equation was derived in the limits of large wall damping and large wall tension. Further, to take into account the effect of inertia, integral theory was proposed to formulate three strongly coupled nonlinear evolution equations for the film thickness, substrate deflection and volumetric flow rate. As discussed by them, decreasing wall damping or wall tension assists the development of chaos in the weakly nonlinear regime. The study developed by Matar et al. (Reference Matar, Craster and Kumar2007) was further expanded by Sisoev et al. (Reference Sisoev, Matar, Craster and Kumar2010) to analyse the nonlinear travelling wave solution under the framework of boundary-layer theory along with the von Kármán–Polhausen approximation proposed by Shkadov (Reference Shkadov1967). The effect of insoluble surfactant on the instability of a falling film down a flexible inclined plane was incorporated by Peng et al. (Reference Peng, Jiang, Zhuge and Zhang2016) and Yang et al. (Reference Yang, Jiang, Hu and Peng2018). More recently, a detailed study on the linear instability of a liquid film falling down an inclined flexible plane was accomplished by Alexander, Kirk & Papageorgiou (Reference Alexander, Kirk and Papageorgiou2020) based on the Orr–Sommerfeld-type boundary value problem. A general model of a flexible substrate was exploited in their study as suggested by Carpenter & Garrad (Reference Carpenter and Garrad1985, Reference Carpenter and Garrad1986). Two distinct temporal modes, namely the surface mode and the wall mode, were identified in the numerical simulation when the Reynolds number is low and the inclination angle is high. It was shown that there exists a critical value of wall stiffness below which the flow will be susceptible to instability by the surface mode even at zero Reynolds number. Further, decreasing wall stiffness has a destabilizing effect on the primary instability induced by the surface mode. In addition, their numerical solution showed the existence of a shear mode when the Reynolds number is high and the inclination angle is small.
In the present work, our aim is to explore the effect of insoluble surfactant and imposed shear stress on the primary instability of a falling film flowing down a flexible inclined plane. In other words, we extend the earlier work of Wei (Reference Wei2005) in the presence of a flexible substrate. However, some new results are also produced in the absence of insoluble surfactant and imposed shear stress because these results were not revealed in the work of Alexander et al. (Reference Alexander, Kirk and Papageorgiou2020). A detailed study of linear stability analysis is carried out in the arbitrary wavenumber regime. The motivation is to understand the dynamics of interfacial wave for a liquid lining flow in a pulmonary airway occlusion process where airflow moves back and forth during breathing and exerts a shear stress on the air–liquid interface (Halpern & Grotberg Reference Halpern and Grotberg1993; Wei Reference Wei2005; Samanta Reference Samanta2020b). In addition, the purpose is to investigate the interactions between flowing fluid and wall flexibility on the shear-induced Marangoni instability that generally occurs in pulmonary airways. We use the same flexible wall model as Carpenter & Garrad (Reference Carpenter and Garrad1985, Reference Carpenter and Garrad1986) and Alexander et al. (Reference Alexander, Kirk and Papageorgiou2020). In accordance with the work of Alexander et al. (Reference Alexander, Kirk and Papageorgiou2020), the viscous effect of the substrate fluid is neglected. The Orr–Sommerfeld-type boundary value problem is derived, which is solved analytically by using the long-wave analysis and also solved numerically by using the Chebyshev spectral collocation method for disturbances of arbitrary wavenumbers. Four dominant temporal modes, namely the surface mode, surfactant mode, wall mode and shear mode, are recognized. It is found that the surface mode can be stable in the presence of insoluble surfactant even when the spring stiffness  $C_K$ keeps a lower value than its critical value
 $C_K^{*}$. Furthermore, it is noticed that the imposed shear stress has a dual role in the primary instability generated by the surface mode. The numerical result in the arbitrary wavenumber regime displays the existence of subcritical instability induced by the surface mode, and the associated unstable region enhances with the decreasing value of spring stiffness
 $C_K$. Further, the temporal growth rate for the wall mode intensifies with an increasing value of Marangoni number but attenuates with an increasing value of imposed shear stress. Hence, the Marangoni number has a destabilizing effect, but the imposed shear stress has a stabilizing effect on the wall mode. As discussed by Carpenter & Garrad (Reference Carpenter and Garrad1985, Reference Carpenter and Garrad1986) for a boundary-layer instability over a compliant wall, the increasing values of spring stiffness
 $C_K$ and damping coefficient
 $C_D$ exhibit a stabilizing effect on the surface mode but exhibit a destabilizing effect on the shear mode for a free surface fluid flowing down a compliant wall. In addition, the effects of various wall parameters on individual modes are analysed in detail in the present study.
2. Mathematical formulation
Consider a two-dimensional gravity-driven incompressible Newtonian fluid of dynamic viscosity  $\mu$ and density
 $\rho$ flowing down a compliant impermeable substrate having slope angle
 $\theta$ with the horizontal, as sketched in figure 1. It is assumed that the fluid surface
 $h(x,t)$ is contaminated by an insoluble surfactant with concentration
 $\varGamma (x,t)$. Furthermore, it is assumed that a constant shear stress
 $\tau _s$ is exerted at the fluid surface in the streamwise direction. For the sake of simplicity, we shall restrict ourselves to the case where the imposed shear stress acts only in the co-flow direction, i.e.
 $\tau _s>0$. We choose the origin of the Cartesian coordinate system at the equilibrium position of the compliant substrate, and the axes
 $x$ and
 $y$ are labelled along the streamwise and cross-stream directions, respectively. The two-dimensional Navier–Stokes equations are employed to describe the gravity-driven shear-imposed viscous fluid flowing down a compliant substrate
 \begin{gather} \partial_xu+\partial_yv=0, \end{gather}
 \begin{gather} \rho\left(\partial_tu+u\partial_xu+v\partial_yu\right) ={-}\partial_xp+\mu\left(\partial_{xx}u+\partial_{yy}u\right)+\rho g \sin \theta, \end{gather}
 \begin{gather} \rho\left(\partial_tv+u\partial_xv+v\partial_yv\right) ={-}\partial_yp+\mu\left(\partial_{xx}v+\partial_{yy}v\right)-\rho g \cos \theta, \end{gather}
where  $u$,
 $v$ and
 $p$ are respectively the velocity components and pressure of the mainstream fluid flowing over a compliant substrate, and
 $g$ is the acceleration due to gravity. The above flow configuration is closed by the following boundary conditions. At the fluid surface,
 $y=h(x,t)$, transport of insoluble surfactant induces a Marangoni stress, which is balanced by the hydrodynamic stress of the mainstream fluid. This fact yields the following tangential and normal stresses dynamic boundary conditions for the shear-imposed surfactant-laden fluid flowing down a compliant inclined plane (Blyth & Pozrikidis Reference Blyth and Pozrikidis2004; Wei Reference Wei2005; Samanta Reference Samanta2014a, Reference Samantab; Bhat & Samanta Reference Bhat and Samanta2018, Reference Bhat and Samanta2019; Samanta Reference Samanta2021)
 $$\begin{gather} \left[4\mu\partial_yv\partial_xh+\mu(\partial_yu+\partial_xv)\{1-(\partial_xh)^2\}\right] =\left(\partial_x\sigma+\partial_xh\partial_y\sigma\right)\sqrt{[1+(\partial_xh)^2]}\nonumber\\ +\tau_s\sqrt{[1+(\partial_xh)^2]}, \end{gather}$$
 \begin{equation} p_a-p+ \frac{2\mu}{[1+(\partial_xh)^2]}[\partial_{y}v\{1-(\partial_xh)^2\}-(\partial_yu+\partial_{x}v)\partial_xh]=\frac{\sigma \partial_{xx}h}{[1+(\partial_xh)^2]^{3/2}}, \end{equation}
where  $p_a$ is the ambient pressure, and
 $\sigma (x,t)$ is the surface tension of the mainstream fluid, which alters linearly with the surfactant concentration
 $\varGamma (x,t)$ by the following relation:
 \begin{equation} \sigma(x,t)=\sigma_b-E_b[\varGamma(x,t) - \varGamma_b], \end{equation}
where  $\sigma _b$ is the constant base surface tension when surfactant concentration keeps its constant base value
 $\varGamma _b$. It should be useful to mention here that surface elasticity,
 $E_b= -\partial _{\varGamma }\sigma |_{\varGamma =\varGamma _b}$, is positive because the surface tension of the mainstream fluid reduces with an increasing value of surfactant concentration. Furthermore, the evolution of insoluble surfactant concentration
 $\varGamma (x,t)$ at the surface of the mainstream fluid is described by the convection–diffusion transport equation (Frenkel & Halpern Reference Frenkel and Halpern2002; Halpern & Frenkel Reference Halpern and Frenkel2003; Edmonstone & Matar Reference Edmonstone and Matar2004; Wei, Halpern & Grotberg Reference Wei, Halpern and Grotberg2005; Samanta Reference Samanta2013a)
 \begin{equation} \partial_t\left[\varGamma \sqrt{\{1+(\partial_xh)^2\}}\right]+\partial_x\left[\varGamma u \sqrt{\{1+(\partial_xh)^2\}}\right]= {D_s}\partial_x\left[\partial_x\varGamma/\sqrt{\{1+(\partial_xh)^2\}}\right], \end{equation}
where  $D_s$ is the surfactant diffusivity, which is usually small, and thereby, it will be neglected in the subsequent calculations. Finally, the evolution of the surface,
 $h(x,t)$, of the mainstream fluid is described by the kinematic boundary condition
 \begin{equation} \partial_{t}h+u\partial_{x}h =v. \end{equation}
Schematic diagram of a surfactant-laden shear-imposed fluid flowing down a compliant substrate.

2.1. Compliant wall model
In accordance with the work of Carpenter & Garrad (Reference Carpenter and Garrad1985) and Alexander et al. (Reference Alexander, Kirk and Papageorgiou2020), we prefer the same wall model to replicate the compliant substrate used by them, i.e. the compliant substrate consists of an isotropic impermeable elastic plate/tensorial membrane over a rigid substrate supported by an array of springs, as shown in figure 2. In fact, the array of springs is assembled in such a way that the wavelength of the surface instability is considerably larger in comparison with the distance between neighbouring springs. Furthermore, the cavity between the elastic plate and the rigid substrate is filled by a viscous fluid of different density and viscosity from the mainstream fluid flowing over the elastic plate, and it is referred to as the substrate fluid. It is assumed that deformations of the springs have negligible impact on the substrate fluid. As a consequence, the following linear equation is used to describe the deflection,  $\eta (x,t)$, of the compliant substrate from its equilibrium position (Carpenter & Garrad Reference Carpenter and Garrad1985; Alexander et al. Reference Alexander, Kirk and Papageorgiou2020)
 \begin{equation} \rho_wb\partial_{tt}\eta+D\partial_t\eta+B\partial_{xxxx}\eta-T\partial_{xx}\eta+K\eta=p_s-p+2\mu[\partial_yv-(\partial_yu+\partial_xv)\partial_x\eta], \end{equation}
where  $\rho _w$ is the density of the elastic material,
 $b$ is the thickness of the elastic plate,
 $D$ is the damping coefficient,
 $B$ is the flexural rigidity of the elastic plate,
 $T$ is the longitudinal tension,
 $K$ is the spring stiffness,
 $p_s$ is the pressure of the substrate fluid and
 $d_s$ is the equilibrium height of the substrate fluid. In fact, the flexural rigidity
 $B$ and the damping coefficient
 $D$ are not independent wall parameters. Instead, both can be measured from the material properties of the compliant substrate (Carpenter & Garrad Reference Carpenter and Garrad1985; Alexander et al. Reference Alexander, Kirk and Papageorgiou2020)
 \begin{equation} B=\frac{E_Yb^3}{12(1-\nu^2)},\quad D=2\zeta \sqrt{K \rho_w b}, \end{equation}
where  $E_Y$ is Young's modulus,
 $\nu$ is the Poisson ratio of the elastic material and
 $\zeta$ is the damping ratio. It should be useful to mention here that the viscous effect of the substrate fluid is neglected (Carpenter & Garrad Reference Carpenter and Garrad1985; Alexander et al. Reference Alexander, Kirk and Papageorgiou2020). However, the viscous effect pertaining to the mainstream fluid is included in (2.9) through the normal stress balance at the elastic plate,
 $y=\eta (x,t)$. For the sake of simplicity,
 $p_s$, the pressure of the substrate fluid with equilibrium height
 $d_s$, is assumed to be constant, although the elastic plate will undergo an infinitesimal deformation from its equilibrium position owing to the infinitesimal perturbation of the mainstream flow (Alexander et al. Reference Alexander, Kirk and Papageorgiou2020). In addition, velocity components of the mainstream fluid must satisfy no-slip and kinematic conditions at the compliant substrate,
 $y=\eta (x,t)$, (Matar et al. Reference Matar, Craster and Kumar2007; Peng et al. Reference Peng, Jiang, Zhuge and Zhang2016; Yang et al. Reference Yang, Jiang, Hu and Peng2018)
 \begin{equation} u=0,\quad v=\partial_t\eta. \end{equation}
Schematic diagram of a compliant substrate, where  $b$ is the thickness of the elastic plate which is supported by an array of springs.

2.2. Base flow solution
As we are interested in deciphering the primary instability of a uni-directional surfactant-laden shear-imposed parallel flow with constant layer thickness  $d$ of the mainstream fluid, constant surfactant concentration
 $\varGamma (x,t)=\varGamma _b$ and without compliant substrate deformation
 $\eta =0$, the governing equations (2.1)–(2.11a,b) are simplified according to the above assumptions and reduced to the following form:
 \begin{gather} \mu \partial_{yy}u+\rho g \sin \theta =0,\quad \partial_yp+\rho g \cos \theta=0, \end{gather}
 \begin{gather} \mu \partial_yu = \tau_s,\quad p=p_a,\quad \textrm{at}\ y=d, \end{gather}
 \begin{gather} u = 0,\quad p=p_s,\quad \textrm{at}\ y=0. \end{gather}
The analytical solution of the base flow (2.12a,b)–(2.14a,b) can be expressed in non-dimensional form as
 \begin{equation} \left. \begin{gathered} U(y)=(2y-y^2)+\tau y,\quad P(y)=P_a+2\cot\theta(1-y),\ V=0,\\ \varGamma_e=1,\ H=1, \quad \eta=0,\ P_s=P_a+2\cot\theta, \end{gathered} \right\} \end{equation}
where the velocity at the surface of the mainstream fluid,  $U_s=\rho g d^2\sin \theta /(2\mu )$, of the uni-directional parallel flow without shear is preferred as the characteristic velocity scale, the constant layer thickness
 $d$ of the mainstream fluid for the parallel flow is preferred as the characteristic length scale,
 $\mu U_s/d$ is preferred as the characteristic pressure scale,
 $d/U_s$ is preferred as the characteristic time scale, the base surfactant concentration
 $\varGamma _b$ is preferred as the characteristic scale for surfactant concentration and the base surface tension
 $\sigma _b$ is preferred as the characteristic scale for surface tension (Wei Reference Wei2005). Here,
 $\tau =\tau _sd/(\mu U_s)$ is the non-dimensional imposed shear stress,
 $P_a$ is the non-dimensional ambient pressure,
 $H$ is the non-dimensional mainstream fluid layer thickness of the unperturbed parallel flow and
 $\varGamma _e$ is the non-dimensional surfactant concentration in the case of unperturbed parallel flow. Note that the streamwise base velocity of the mainstream fluid is explicitly dependent on the imposed shear stress
 $\tau$. But, its maximum value no longer appears at the surface of the mainstream fluid owing to the presence of external shear stress.
3. Linear stability analysis in the long-wave regime
In order to study the linear stability analysis, we shall first derive the perturbation equations for the infinitesimal disturbance. As a consequence, we superimpose an infinitesimal disturbance on the uni-directional parallel flow solution with fluid layer thickness  $h=H$, called the base flow solution (2.15). This fact causes a small infinitesimal deformation to the compliant substrate from its equilibrium position
 $\eta =0$. Accordingly, each variable for the disturbed flow can be decomposed as
 \begin{equation} \left. \begin{gathered} u(x,y,t)=U(y)+u'(x,y,t),\quad v(x,y,t)=v'(x,y,t),\\ p(x,y,t)=P(y)+p'(x,y,t),\quad h(x,t)=H+h'(x,t),\\ \eta(x,t)=\eta'(x,t),\quad \varGamma(x,t)=\varGamma_e+\varGamma'(x,t), \end{gathered} \right\} \end{equation}
where the variables with prime notation specify the perturbation flow variables while the variables without prime notation specify the base flow variables. Substituting the variable decomposition (3.1) in the governing equations (2.1)–(2.11a,b) and linearizing with respect to the base flow solution, we obtain the following non-dimensional perturbation equations
 \begin{gather} \partial_xu'+\partial_yv'=0, \end{gather}
 \begin{gather} Re(\partial_tu' + U\partial_xu'+v'\partial_yU)+\partial_xp'-(\partial_{xx}u'+\partial_{yy}u')=0, \end{gather}
 \begin{gather} Re(\partial_tv'+U\partial_xv')+\partial_yp'-(\partial_{xx}v'+\partial_{yy}v')=0, \end{gather}
where  $Re=\rho U_s d/\mu$, the Reynolds number, compares the ratio of inertia and the viscous force. Similarly, the linearized versions of boundary conditions at the fluid surface,
 $y=1$, are simplified in the following form:
 \begin{gather} \partial_yu' + \partial_xv'+h'\partial_{yy}U +Ma \partial_x\varGamma'=0, \end{gather}
 \begin{gather} -p'+2 \cot \theta h'+ 2(\partial_yv'-\partial_yU\partial_xh')-(1/Ca) \partial_{xx}h'=0, \end{gather}
 \begin{gather} \partial_t\varGamma'+U\partial_x\varGamma'+\partial_xu'+\partial_yU\partial_xh'=0, \end{gather}
 \begin{gather} \partial_th'+U\partial_x h'-v'=0, \end{gather}
where  $Ma=E_b\varGamma _b/(\mu U_s)$, the Marangoni number, compares the Marangoni stress and the viscous stress, and
 $Ca=\mu U_s/\sigma _b$, the capillary number, compares the viscous stress and the capillary stress generated by the surface tension of the mainstream fluid (Wei Reference Wei2005). On the other hand, the linearized version of the boundary condition at the compliant substrate,
 $y=0$, simplifies to the following form:
 \begin{equation} C_{I}\partial_{tt}\eta'+C_D\partial_t\eta'+C_B\partial_{xxxx}\eta'\!-C_T\partial_{xx}\eta'+C_K\eta'\!+\!p'-2\cot \theta \eta'-2[\partial_yv'-\partial_yU\partial_x\eta']\!=\!0, \end{equation}
where the non-dimensional coefficients describing material properties of the compliant substrate are defined as:  $C_{I}=\rho _wbU_s/\mu$, representing the ratio of compliant substrate inertia and viscous stress,
 $C_{D}=Dd/\mu$, representing the ratio of compliant substrate damping and viscous stress,
 $C_B=B/(\mu d^2U_s)$, representing the ratio of flexural rigidity and viscous stress,
 $C_T=T/(\mu U_s)$, representing the ratio of longitudinal tension and viscous stress,
 $C_K=Kd^2/(\mu U_s)$, representing the ratio of spring stiffness and viscous stress. Finally, using Taylor's series expansion about the equilibrium position of the compliant substrate, the linearized versions of no-slip and kinematic boundary conditions at the compliant substrate,
 $y=0$, become
 \begin{equation} u'+\partial_yU\eta' =0,\quad v'-\partial_t\eta'=0. \end{equation}
Now we seek the solution of perturbation equations (3.2)–(3.10a,b) in the normal mode form (Kumar & Matar Reference Kumar and Matar2004; Samanta Reference Samanta2020a)
 \begin{equation} \left. \begin{gathered} u'(x,y,t)=\tilde{u}(y)\exp[\textrm{i}k(x-ct)]+\textrm{c.c.},\quad h'(x,t)=\tilde{h}\exp[\textrm{i}k(x-ct)]+\textrm{c.c.},\\ v'(x,y,t)=\tilde{v}(y)\exp[\textrm{i}k(x-ct)]+\textrm{c.c.},\quad \eta'(x,t)=\tilde{\eta}\exp[\textrm{i}k(x-ct)]+\textrm{c.c.},\\ p'(x,y,t)=\tilde{p}(y)\exp[\textrm{i}k(x-ct)]+\textrm{c.c.},\quad \varGamma'(x,t)=\tilde{\varGamma}\exp[\textrm{i}k(x-ct)]+\textrm{c.c.}, \end{gathered} \right\} \end{equation}
where  $\textrm {c.c.}$ represents the complex conjugate, and the variables with tilde notation represent the amplitudes of perturbation variables. Here,
 $k$ and
 $c$ are respectively the real wavenumber and complex wave speed of the infinitesimal perturbation. Since we are interested in the temporal stability analysis, the wavenumber
 $k$ is assumed to be a real quantity. Inserting the normal mode solution (3.11) in the perturbation equations (3.2)–(3.10a,b), one can obtain
 \begin{gather} \textrm{i}k\tilde{u}+\partial_y\tilde{v}=0,\quad 0\le y \le 1, \end{gather}
 \begin{gather} Re[\textrm{i}k(U-c)\tilde{u}+\tilde{v}\partial_yU]+\textrm{i}k\tilde{p} -(\partial_{yy}\tilde{u}-k^2\tilde{u})=0,\quad 0\le y \le 1, \end{gather}
 \begin{gather} Re\,\textrm{i}k(U-c)\tilde{v}+\partial_y\tilde{p}-(\partial_{yy}\tilde{v}-k^2\tilde{v})=0,\quad 0\le y \le 1, \end{gather}
 \begin{gather} \partial_y\tilde{u} +\textrm{i}k \tilde{v}+\tilde{h}\partial_{yy}U +Ma \textrm{i}k\tilde{\varGamma}=0,\quad \textrm{at}\ y=1, \end{gather}
 \begin{gather} -\tilde{p}+2 \cot \theta \tilde{h}+ 2\partial_y\tilde{v}-2\textrm{i}k\partial_yU\tilde{h}+(k^2/Ca)\tilde{h}=0,\quad \textrm{at}\ y=1, \end{gather}
 \begin{gather} \textrm{i}k(U-c)\tilde{\varGamma}+\textrm{i}k\tilde{u}+\textrm{i}k\partial_yU\tilde{h}=0,\quad \textrm{at}\ y=1, \end{gather}
 \begin{gather} \textrm{i}k(U-c)\tilde{h}-\tilde{v}=0,\quad \textrm{at}\ y=1, \end{gather}
 \begin{gather} -C_{I}k^2c^2\tilde{\eta}-C_D \textrm{i}kc \tilde{\eta}+C_Bk^4\tilde{\eta}+C_Tk^2\tilde{\eta}+C_K\tilde{\eta}+\tilde{p}-2\cot \theta \tilde{\eta}\nonumber\\ -2[\partial_y\tilde{v}-\textrm{i}k\partial_yU\tilde{\eta}]=0,\quad \textrm{at}\ y=0, \end{gather}
 \begin{gather} \tilde{u}+\partial_yU\tilde{\eta} =0,\quad \tilde{v}+ikc\tilde{\eta}=0,\quad \textrm{at}\ y=0. \end{gather}
3.1. Long-wave analysis
In order to investigate the primary instability governed by (3.12)–(3.20) in the long-wave regime ( $k \sim 1/\lambda \to 0$, where
 $\lambda$ is the wavelength of the infinitesimal disturbance), we propose the long-wave series expansion (Yih Reference Yih1963; Smith Reference Smith1990; Samanta Reference Samanta2019)
 \begin{equation} \left. \begin{aligned}
\tilde{u}(y) &
=\tilde{u}_0+k\tilde{u}_1+k^2\tilde{u}_2+\cdots,\quad\quad
\tilde{h}=\tilde{h}_0+k\tilde{h}_1+k^2\tilde{h}_2+\cdots,\\
\tilde{v}(y) &
=k\tilde{v}_1+k^2\tilde{v}_2+k^3\tilde{v}_3+\cdots,\quad
\tilde{\eta}=\tilde{\eta}_0+k\tilde{\eta}_1+k^2\tilde{\eta}_2+\cdots,\\
\tilde{p}(y) &
=\tilde{p}_0+k\tilde{p}_1+k^2\tilde{p}_2+\cdots,\quad\quad
\tilde{\varGamma}=\tilde{\varGamma}_0+k\tilde{\varGamma}_1+k^2\tilde{\varGamma}_2+\cdots,\\
c & =\tilde{c}_0+k\tilde{c}_1+k^2\tilde{c}_2+\cdots.
\end{aligned} \right\}
\end{equation}
It should be useful to mention here that the long-wave series expansion (3.21) is valid in the limit  $k \to 0$. Hence, only long-wave unstable modes can be captured very well by using the series expansion (3.21). In fact, in the limit
 $k \to 0$, the temporal growth rate
 $kc_i$ of the long-wave mode approaches zero. As soon as
 $k$ increases, the series expansion (3.21) is not valid due to the convergence issue, and thereby, the unstable modes raised in the finite wavenumber regime cannot be obtained by using the long-wave series expansion. However, the long-wave series expansion (3.21) is very pertinent to determine the critical Reynolds number analytically for the onset of primary instability induced by the long-wave mode. In order to find out the unstable modes in the arbitrary wavenumber regime, we will use the numerical method discussed in the next section.
3.2. Order- $O(k^0)$ analysis

Substituting (3.21) in the perturbation equations (3.12)–(3.20), we collect the leading-order equations, i.e. the equations of order  $O(k^0)$
 \begin{gather} \partial_{yy}\tilde{u}_0=0,\quad \partial_y\tilde{p}_0=0,\quad 0 \le y \le 1, \end{gather}
 \begin{gather} \partial_y\tilde{u}_0+\tilde{h}_0\partial_{yy}U=0,\quad \tilde{p}_0-2 \cot \theta \tilde{h}_0=0,\quad \textrm{at}\ y=1, \end{gather}
 \begin{gather} C_K\tilde{\eta}_0+\tilde{p}_0-2\cot \theta \tilde{\eta}_0=0,\quad \tilde{u}_0+\partial_yU\tilde{\eta}_0 =0,\quad \textrm{at}\ y=0. \end{gather}
It should be useful to mention here that the capillary number  $Ca$ is assumed to be of order one, i.e.
 $Ca \sim O(1)$. For this reason, the capillary number is not manifested in the leading-order normal stress boundary condition. After solving the leading-order equations (3.22)–(3.24), the solution can be expressed as
 \begin{gather} \tilde{u}_0(y)=\left[2\tilde{h}_0y-(2+\tau)\tilde{\eta}_0\right],\quad \tilde{p}_0(y)=2\cot\theta \tilde{h}_0, \end{gather}
 \begin{gather}\tilde{\eta}_0={-}\left[\frac{2\cot\theta}{(C_K - 2\cot\theta)}\right]\tilde{h}_0={-}\left[\frac{2\cot\theta/C_K}{(1 - 2\cot\theta/C_K)}\right]\tilde{h}_0, \end{gather}
provided  $C_k \neq 2\cot \theta =C_K^{*}$, the critical value of spring stiffness
 $C_K$. It should be noted that, for a given value of
 $\theta \neq 0$,
 $\tilde {\eta }_0 \rightarrow 0$ in the limit
 $C_K \to \infty$, or,
 $\theta \to {\rm \pi}/2$ when
 $\tilde {h}_0 \neq 0$. Therefore, the leading-order compliant substrate deformation is out of phase (in phase) with the leading-order fluid surface deformation if
 $C_K> C_K^{*}\ (< C_K^*)$ and
 $0 <\theta < {\rm \pi}/2$. Obviously, the streamwise velocity for the leading-order disturbed shear flow is linear in cross-stream coordinate
 $y$, and it explicitly depends on the external shear stress
 $\tau$ and spring stiffness
 $C_K$, the only wall parameter from the compliant substrate contributing to the leading-order disturbed shear flow. However, the streamwise velocity for the leading-order shear flow will increase (decrease) if the leading-order compliant substrate deformation is out of phase (in phase) with the leading-order fluid surface deformation (
 $\tilde {h}_0>0$) and when the imposed shear stress is exerted in the co-flow direction (
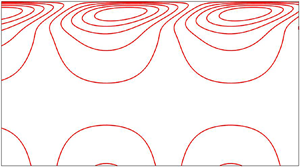
 $\tau >0$). This physical fact is demonstrated in figure 3. In particular, the leading-order disturbed shear flow procures energy from the base flow through the perturbation tangential stress balance equation, but it modifies significantly in the presence of compliant substrate and imposed shear stress.
(a) Here,  $\tilde {h}_0$ is in phase with
 $\tilde {\eta }_0$ but out of phase with
 $\tilde {\varGamma }_0$ when
 $C_K < 2\cot \theta =C_K^*$. (b) Here,
 $\tilde {h}_0$ is out of phase with
 $\tilde {\eta }_0$ but in phase with
 $\tilde {\varGamma }_0$ when
 $C_K > 2\cot \theta =C_K^*$ and when the imposed shear stress acts in the co-flow direction (
 $\tau >0$). Here,
 $\tilde {u}_0(y)$ is the leading-order streamwise velocity for the disturbed fluid flow.

3.3. Order-$O(k^1)$ analysis

Now we collect the first-order equations, i.e. the equations of order  $O(k^1)$
 \begin{gather} \textrm{i}\tilde{u}_0+\partial_y\tilde{v}_1=0,\quad 0 \le y \le 1, \end{gather}
 \begin{gather} Re[\textrm{i}(U-\tilde{c}_0)\tilde{u}_0+\partial_yU\tilde{v}_1]+\textrm{i}\tilde{p}_0-\partial_{yy}\tilde{u}_1=0,\quad 0 \le y \le 1, \end{gather}
 \begin{gather} \partial_y\tilde{p}_1-\partial_{yy}\tilde{v}_1=0,\quad 0 \le y \le 1, \end{gather}
 \begin{gather} \partial_y\tilde{u}_1+\tilde{h}_1\partial_{yy}U+\textrm{i}Ma\tilde{\varGamma}_0=0,\quad \textrm{at}\ y=1, \end{gather}
 \begin{gather} -\tilde{p}_1+2 \cot \theta \tilde{h}_1+2\partial_y\tilde{v}_1-2\textrm{i}\partial_yU\tilde{h}_0=0,\quad \textrm{at}\ y=1, \end{gather}
 \begin{gather} \textrm{i}(U-\tilde{c}_0)\tilde{\varGamma}_0+\textrm{i}\tilde{u}_0+\textrm{i}\partial_yU\tilde{h}_0=0,\quad \textrm{at}\ y=1, \end{gather}
 \begin{gather} \textrm{i}(U-\tilde{c}_0)\tilde{h}_0-\tilde{v}_1=0,\quad \textrm{at}\ y=1, \end{gather}
 \begin{gather} -\textrm{i}C_D\tilde{c}_0\tilde{\eta}_0+C_K\tilde{\eta}_1+\tilde{p}_1-2\cot \theta \tilde{\eta}_1-2[\partial_y\tilde{v}_1-\partial_yUi\tilde{\eta}_0]=0,\quad \textrm{at}\ y=0, \end{gather}
 \begin{gather} \tilde{u}_1+\partial_yU\tilde{\eta}_1 =0,\quad \textrm{at}\ y=0, \end{gather}
 \begin{gather} \tilde{v}_1+i\tilde{c}_0\tilde{\eta}_0=0,\quad \textrm{at}\ y=0. \end{gather}
After solving the first-order equations (3.27)–(3.36), one obtains the solution in the following form:
 \begin{gather} \widetilde{u_1}=\tilde{h}_0\left[\textrm{i}\,Re\left\{\tfrac{1}{12}(2+\tau) y^4-\tfrac{1}{3}\tilde{c}_0y^3-\tfrac{1}{3}(2+\tau)y+\tilde{c}_0y\right\}+\textrm{i}\,\cot\theta( y^2-2y)\right]+2\tilde{h}_{1}y\nonumber\\ -\textrm{i}\,May\tilde{\varGamma}_{0}-\textrm{i}\,Re\left\{\tfrac{1}{12}(2+\tau)y^4-\tfrac{1}{3}\tilde{c}_0y^3-\tfrac{1}{3}(2+\tau)y+\tilde{c}_0y\right\}\tilde{\eta}_0-(2+\tau)\tilde{\eta}_1, \end{gather}
 \begin{gather} \tilde{v}_1={-}\textrm{i}\tilde{h}_0y^2+(2+\tau)i\tilde{\eta}_0y-\textrm{i}\tilde{\eta}_0\tilde{c}_0, \end{gather}
 \begin{gather} \tilde{p}_1={-}2\textrm{i}\tilde{h}_0y-2\textrm{i}\tilde{h}_0(1+\tau)+2\cot\theta\tilde{h}_1+2(2+\tau)i\tilde{\eta}_0, \end{gather}
 \begin{gather} \tilde{\eta}_1=\frac{-2\cot\theta \tilde{h}_1+\textrm{i}[2(1+\tau)\tilde{h}_0-2(2+\tau)\tilde{\eta}_0+C_D\tilde{c}_0\tilde{\eta}_0]}{(C_K-2\cot\theta)}. \end{gather}
The analytical calculation unveils the existence of two dominant temporal modes, the so-called surface mode and surfactant mode (Wei Reference Wei2005; Bhat & Samanta Reference Bhat and Samanta2018). As a consequence, the notations  $c_s$ and
 $c_m$ will be used in the subsequent calculations for the complex wave speeds of the surface mode and surfactant mode, respectively. If the leading-order amplitude of fluid surface deformation is non-zero (
 $\tilde {h}_0 \neq 0$), the long-wave mode induced by deflection of the fluid surface is referred to as the surface mode. In this case, the phase speed of the surface mode can be obtained from the kinematic equation (3.33) and is given by
 \begin{equation} \tilde{c}_0=\tilde{c}_{0s}=2+\tau, \end{equation}
where the subscript notation ‘ $s$’ is used for the surface mode. Obviously, at leading order, the surface mode travels with a speed that is explicitly dependent on the imposed shear stress
 $\tau$. In this case, the leading-order amplitude
 $\tilde {\varGamma }_0$ of perturbation surfactant concentration can be obtained from the surfactant transport equation (3.32) and is given by
 \begin{equation} \tilde{\varGamma}_0=(2+\tau)[\tilde{h}_0-\tilde{\eta}_0]=\left[\frac{(2+\tau)C_K}{(C_K-2\cot\theta)}\right]\tilde{h}_0 =\left[\frac{(2+\tau)}{(1-2\cot\theta/C_K)}\right]\tilde{h}_0. \end{equation}
Therefore,  $\tilde {\varGamma }_0 \to (2+\tau )\tilde {h}_0$ in the limit
 $C_K \to \infty$ when
 $\tilde {h}_0 \neq 0$. If the imposed shear stress acts in the co-flow direction (
 $\tau >0$), the leading-order perturbation surfactant concentration will be in phase (out of phase) with the leading-order fluid surface deformation if
 $C_K>C_K^*\ (< C_K^*)$. This physical fact is fully opposite to the leading-order compliant substrate deformation (see figure 3). It is evident that the leading-order amplitude of perturbation surfactant concentration decreases (increases) on account of the deformation of compliant substrate when
 $\tilde {\eta }_0$ is in phase (out of phase) with
 $\tilde {h}_0 (>0)$. By contrast, if
 $\tilde {h}_0 = 0$ and
 $\tilde {\varGamma }_0 \neq 0$, a different long-wave mode from the surface mode appears due to the deflection of surfactant concentration, and it is referred to as the surfactant mode/Marangoni mode. In this case, the phase speed of the surfactant mode can be obtained from the surfactant transport equation (3.32) and is given by
 \begin{equation} \tilde{c}_{0m}=1+\tau, \end{equation}
where the subscript notation ‘ $m$’ is used for the surfactant mode/Marangoni mode. It should be noted that the leading-order phase speed for the surface mode is greater than the leading-order phase speed for the surfactant mode. In other words, to leading order, the surfactant mode travels slower than the surface mode. Furthermore, the compliant substrate has no influence on the leading-order phase speeds for the surface mode and surfactant mode respectively.
3.4. Order-$O(k^2)$ analysis

Now we collect the second-order equations, i.e. the equations of order  $O(k^2)$
 \begin{gather} \textrm{i}\,\tilde{u}_1+\partial_y\tilde{v}_2=0,\quad 0 \le y \le 1, \end{gather}
 \begin{gather} Re[\textrm{i}(U-\tilde{c}_0)\tilde{u}_1-\textrm{i}\tilde{c}_1\tilde{u}_0 +\partial_yU\tilde{v}_2]+\textrm{i}\tilde{p}_1-(\partial_{yy}\tilde{u}_2-\tilde{u}_0)=0,\quad 0 \le y \le 1, \end{gather}
 \begin{gather} Re\,\textrm{i}(U-\tilde{c}_0)\tilde{v}_1+\partial_y\tilde{p}_2-\partial_{yy}\tilde{v}_2=0,\quad 0 \le y \le 1, \end{gather}
 \begin{gather} \partial_y\tilde{u}_2+\textrm{i}\tilde{v}_1+\tilde{h}_2\partial_{yy}U+\textrm{i}\,Ma\tilde{\varGamma}_1=0,\quad \textrm{at}\ y=1, \end{gather}
 \begin{gather} -\tilde{p}_2+2 \cot \theta \tilde{h}_2+2\partial_y\tilde{v}_2-2\textrm{i}\partial_yU\tilde{h}_1+(1/Ca)\tilde{h}_0=0,\quad \textrm{at}\ y=1, \end{gather}
 \begin{gather} \textrm{i}(U-\tilde{c}_0)\tilde{\varGamma}_1-\textrm{i}\tilde{c}_1\tilde{\varGamma}_0 +\textrm{i}\tilde{u}_1+\textrm{i}\partial_yU\tilde{h}_1=0,\quad \textrm{at}\ y=1, \end{gather}
 \begin{gather} \textrm{i}(U-\tilde{c}_0)\tilde{h}_1-\textrm{i}\tilde{c}_1\tilde{h}_0-\tilde{v}_2=0,\quad \textrm{at}\ y=1, \end{gather}
 \begin{gather} -C_I\tilde{c}_0^2\tilde{\eta}_0-\textrm{i}C_D(\tilde{c}_0\tilde{\eta}_1+\tilde{c}_1\tilde{\eta}_0) +C_T\tilde{\eta}_0+C_K\tilde{\eta}_2+\tilde{p}_2-2\cot \theta \tilde{\eta}_2\nonumber\\ -2[\partial_y\tilde{v}_2-\textrm{i}\partial_yU\tilde{\eta}_1]=0,\quad \textrm{at}\ y=0, \end{gather}
 \begin{gather} \tilde{u}_2+\partial_yU\tilde{\eta}_2 =0,\quad \textrm{at}\ y=0, \end{gather}
 \begin{gather} \tilde{v}_2+\textrm{i}(\tilde{c}_0\tilde{\eta}_1+\tilde{c}_1\tilde{\eta}_0)=0,\quad \textrm{at}\ y=0. \end{gather}
3.5. Surface mode
After solving the above second-order equations (3.44)–(3.53),  $\tilde {u}_2$,
 $\tilde {v}_2$ and
 $\tilde {p}_2$ are determined and then, inserting the expression of
 $\tilde {v}_2$ in the kinematic equation (3.50), the expression of
 $\tilde {c}_1$ for the surface mode can be obtained as
 \begin{equation} \tilde{c}_1=\tilde{c}_{1s}=\textrm{i}\left[\frac{4}{15}(2+\tau)Re-\frac{2}{3}\cot \theta -\frac{1}{2}(2+\tau)Ma+\frac{4}{3} \frac{\cot^2\theta}{C_K}\right], \end{equation}
where the first term shows the destabilizing effect of inertia, the second term shows the stabilizing effect of depthwise gravity, the third term shows the stabilizing effect of insoluble surfactant and the fourth term shows the destabilizing effect of compliant substrate. Using the criterion for neutral stability ( $c_i \approx kc_1=0$ as
 $k \to 0$), one can obtain the critical Reynolds number for the surface mode
 \begin{equation} Re_c=Re_{cs}=\frac{5}{2(2\!+\!\tau)}\cot \theta\!+\!\frac{15}{8}Ma-\frac{5}{(2\!+\!\tau)}\frac{\cot^2\theta}{C_K} =\frac{5\cot\theta}{2(2\!+\!\tau)}\left[1-\frac{2\cot\theta}{C_K}\right]+\frac{15}{8}Ma. \end{equation}
Obviously, the critical Reynolds number  $Re_{cs}$ for the surface mode is modified by the Marangoni number
 $Ma$, imposed shear stress
 $\tau$ and spring stiffness
 $C_K$. However, it recovers the result of Alexander et al. (Reference Alexander, Kirk and Papageorgiou2020) very well in the absence of surface surfactant and imposed shear stress (
 $Ma \to 0$ and
 $\tau \to 0$). Furthermore, it coincides with the result of Wei (Reference Wei2005) as soon as the effect of a compliant substrate is ignored, i.e. if the spring stiffness
 $C_K \to \infty$. In fact, in leading order, the compliant substrate behaves as a rigid wall in the limit
 $C_K \to \infty$ (Alexander et al. Reference Alexander, Kirk and Papageorgiou2020). In particular, the critical Reynolds number
 $Re_{cs}$ for the surface mode enhances with the increasing value of Marangoni number. Hence, the Marangoni number, or equivalently, the insoluble surfactant, has a stabilizing effect on the surface mode (Wei Reference Wei2005). Further, if the imposed shear stress
 $\tau$ acts in the co-flow direction, the critical Reynolds number for the surface mode reduces with the increasing value of
 $\tau$ when the effect of the compliant substrate is neglected. Hence, the imposed shear stress has a destabilizing effect on the surface mode (Smith Reference Smith1990; Samanta Reference Samanta2014a). If the effect of the compliant substrate is incorporated, the critical Reynolds number for the surface mode reduces. Although, this reduction process of critical Reynolds number, or equivalently, the destabilizing effect of compliant substrate on the surface mode, can be weakened by gradually increasing the value of spring stiffness
 $C_K$ from its critical value
 $C_K^*=2\cot \theta$ (
 $C_K \neq C_K^*$). As discussed by Alexander et al. (Reference Alexander, Kirk and Papageorgiou2020), the surface mode will be always unstable in the absence of insoluble surfactant when
 $C_K< C_K^*$, because the critical Reynolds number for the surface mode approaches zero in the limit
 $C_K \to C_K^*$ and it becomes negative when
 $C_K< C_K^*$. But in the presence of insoluble surfactant, it is feasible to have a positive value of critical Reynolds number for the surface mode if the following condition for the Marangoni number
 $Ma$ is satisfied:
 \begin{equation} Ma > \frac{4\cot\theta}{3(2+\tau)}\left[\frac{2\cot\theta}{C_K}-1\right]=Ma^*, \end{equation}
when  $C_K< C_K^*$ (
 $C_K \neq C_K^*$). Hence, for
 $Ma>Ma^*$, the critical value of the Marangoni number, there exists a stable range of Reynolds number where the primary instability induced by the surface mode can be made stable even though
 $C_K< C_K^*$. Otherwise, the infinitesimal disturbance will be unstable if
 $Ma < Ma^*$ when
 $C_K< C_K^*$. The above physical phenomenon is illustrated in figure 4. Indeed, the curve for
 $Re_{cs}$ approaches zero in the limits
 $C_K \to C_K^*=2$,
 $Ma \to 0$ and
 $\tau \to 0$, specified by a solid line. However,
 $Re_{cs}$ no longer becomes zero at
 $C_K=C_K^*$ as soon as the effect of Marangoni number (
 $Ma=1$) is included in the current flow model. Instead, the curve for
 $Re_{cs}$ intersects the
 $C_K$-axis at a lower value of
 $C_K$ than
 $C_K^*$, specified by a dashed line. Obviously, this new result is different from that of Alexander et al. (Reference Alexander, Kirk and Papageorgiou2020) where the insoluble surfactant is absent (
 $Ma=0$). Further, the interesting result is that the critical Reynolds number reduces (enhances) in the presence of imposed shear stress if
 $C_K > (< C_K^*)$, specified by dotted and dash-dotted lines, respectively. Hence, the imposed shear stress shows a dual role in the surface mode, i.e. a destabilizing effect when
 $C_K>C_K^*$ and a stabilizing effect when
 $C_K< C_K^*$.
Variation of critical Reynolds number  $Re_{cs}$ for the surface mode with the spring stiffness
 $C_K$ when
 $\theta =45^{\circ }$. Solid line represents the result when
 $Ma=0$ and
 $\tau =0$. Dashed line represents the result when
 $Ma=1$ and
 $\tau =0$. Dotted line represents the result when
 $Ma=1$ and
 $\tau =1$. Dash-dotted line represents the result when
 $Ma=1$ and
 $\tau =2$. Points are the results of Alexander et al. (Reference Alexander, Kirk and Papageorgiou2020).

3.6. Surfactant mode
After solving the above second-order equations (3.44)–(3.53) and inserting the expression of  $\tilde {u}_1$ in the surfactant transport equation (3.49), the expression of
 $\tilde {c}_1$ for the surfactant mode can be written as
 \begin{equation} \tilde{c}_1=\tilde{c}_{1m}=\textrm{i} \left[\frac{\tau Ma}{2}\right]. \end{equation}
As discussed by Wei (Reference Wei2005) and Bhat & Samanta (Reference Bhat and Samanta2018), there exists an unstable surfactant mode in the presence of imposed shear stress  $\tau$ for a surfactant-laden fluid flow, and it can be made stronger by increasing the values of imposed shear stress and Marangoni number. Further, from the second-order analytical calculation, one can report that the Reynolds number
 $Re$, or equivalently, the inertia, has no impact on the expression of the first-order temporal growth rate (
 $kc_i \propto c_1$ as
 $k \to 0$) for the surfactant mode. In addition, it is evident that the temporal growth rate for the surfactant mode is not influenced by the compliant substrate either.
3.7. Order-$O(k^3)$ analysis

Now we collect the third-order equations, i.e. the equations of order  $O(k^3)$
 \begin{gather} \textrm{i}\tilde{u}_2+\partial_y\tilde{v}_3=0,\quad 0 \le y \le 1, \end{gather}
 \begin{gather} Re[\textrm{i}(U-\tilde{c}_0)\tilde{u}_2-\textrm{i}\tilde{c}_1\tilde{u}_1-\textrm{i}\tilde{c}_2\tilde{u}_0+\partial_yU\tilde{v}_3]+\textrm{i}\tilde{p}_2-(\partial_{yy}\tilde{u}_3 -\tilde{u}_1)=0,\quad 0 \le y \le 1, \end{gather}
 \begin{gather} Re[\textrm{i}(U-\tilde{c}_0)\tilde{v}_2-\textrm{i}\tilde{c}_1\tilde{v}_1]+\partial_y\tilde{p}_3-(\partial_{yy}\tilde{v}_3-\tilde{v}_1)=0,\quad 0 \le y \le 1, \end{gather}
 \begin{gather} \partial_y\tilde{u}_3+\textrm{i}\tilde{v}_2+\tilde{h}_3\partial_{yy}U +\textrm{i}Ma\tilde{\varGamma}_2=0,\quad \textrm{at}\ y=1, \end{gather}
 \begin{gather} -\tilde{p}_3+2 \cot \theta \tilde{h}_3+2\partial_y\tilde{v}_3-2\textrm{i}\partial_yU\tilde{h}_2+(1/Ca)\tilde{h}_1=0,\quad \textrm{at}\ y=1, \end{gather}
 \begin{gather} \textrm{i}(U-\tilde{c}_0)\tilde{\varGamma}_2-\textrm{i}\tilde{c}_1\tilde{\varGamma}_1-\textrm{i}\tilde{c}_2\tilde{\varGamma}_0+\textrm{i}\tilde{u}_2+\textrm{i}\partial_yU\tilde{h}_2=0,\quad \textrm{at}\ y=1, \end{gather}
 \begin{gather} \textrm{i}(U-\tilde{c}_0)\tilde{h}_2-\textrm{i}\tilde{c}_1\tilde{h}_1-\textrm{i}\tilde{c}_2\tilde{h}_0 -\tilde{v}_3=0,\quad \textrm{at}\ y=1, \end{gather}
 \begin{gather} -C_I(\tilde{c}_0^2\tilde{\eta}_1+2\tilde{c}_0\tilde{c}_1\tilde{\eta}_0)-\textrm{i}C_D(\tilde{c}_0\tilde{\eta}_2+\tilde{c}_1\tilde{\eta}_1+\tilde{c}_2\tilde{\eta}_0)+C_T\tilde{\eta}_1+C_K\tilde{\eta}_3\nonumber\\ +\tilde{p}_3-2\cot \theta \tilde{\eta}_3-2[\partial_y\tilde{v}_3-\textrm{i}\partial_yU\tilde{\eta}_2]=0,\quad \textrm{at}\ y=0, \end{gather}
 \begin{gather} \tilde{u}_3+\partial_yU\tilde{\eta}_3 =0,\quad \textrm{at}\ y=0, \end{gather}
 \begin{gather} \tilde{v}_3+\textrm{i}(\tilde{c}_0\tilde{\eta}_2+\tilde{c}_1\tilde{\eta}_1 +\tilde{c}_2\tilde{\eta}_0)=0,\quad \textrm{at}\ y=0. \end{gather}
After solving the third-order equations (3.58)–(3.67),  $\tilde {u}_3$,
 $\tilde {v}_3$ and
 $\tilde {p}_3$ are determined and then, inserting the expressions of
 $\tilde {v}_3$ and
 $\tilde {u}_2$ in the kinematic equation (3.64) and surfactant transport equation (3.63), the expressions of
 $\tilde {c}_2$ for the surface mode and surfactant mode can be respectively obtained as
 \begin{gather} \tilde{c}_{2}=\tilde{c}_{2s}={-}2\left(1+\frac{\tau}{3}\right)+\left(\frac{40}{63}+\frac{7\tau}{36}\right) Re\cot\theta\left\{1-\frac{2\cot\theta}{C_K}\right\}\nonumber\\ \quad -\left(\frac{32}{63}+\frac{205\tau}{504} +\frac{11\tau^2}{144}\right)Re^2\nonumber\\ +\left(\frac{1}{6}+\frac{\tau}{3}\right)Ma\cot\theta\left \{1-\frac{2\cot\theta}{C_K}\right\}+\left(\frac{5}{6}+\frac{5\tau}{12}\right) Ma\,Re+\left(\frac{\tau}{2}+\frac{\tau^2}{4}\right)Ma^2\nonumber\\ + \left[\left(\frac{2}{3}+\frac{\tau}{3}\right)+\left\{\frac{2}{3}-\frac{(2+\tau)C_D}{3}\right\} \frac{2\cot\theta}{C_K}\right]\frac{2\cot\theta}{C_K}, \end{gather}
 \begin{gather} \tilde{c}_{2}=\tilde{c}_{2m}={-}\left(\frac{1}{6}+\frac{\tau}{3}\right)Ma\cot\theta \left\{1-\frac{2\cot\theta}{C_K}\right\}-\left(\frac{\tau}{2}+\frac{\tau^2}{4}\right)Ma^2. \end{gather}
It should be noted that the effect of the damping coefficient  $C_D$ is now introduced in the expression for
 $\tilde {c}_{2s}$ for the surface mode. On the other hand, the expression of
 $\tilde {c}_{2m}$ for the surfactant mode is modified by the spring stiffness
 $C_K$, the only contribution being from the compliant substrate. Furthermore, the above expressions for
 $\tilde {c}_{2s}$ and
 $\tilde {c}_{2m}$ coincide with the results of Bhat & Samanta (Reference Bhat and Samanta2019) when the influence of the compliant substrate is neglected. The little differences in non-dimensional parameters are the consequence of the choice of various dimensionless scales. Similarly, solving the fourth-order (
 $O(k^4)$) equations, we obtain the expressions of
 $\tilde {c}_{3s}$ and
 $\tilde {c}_{3m}$ for the surface mode and surfactant mode respectively (see Appendix A). Obviously, the expression of
 $\tilde {c}_{3m}$ for the surfactant mode is explicitly dependent on
 $Re$,
 $C_K$ and
 $C_D$. Using the various-order solutions, the expression of the complex wave speed
 $c$ for the surface mode and surfactant mode can be respectively written as
 \begin{gather} c=c_s=\tilde{c}_{0s}+k\tilde{c}_{1s}+k^2\tilde{c}_{2s}+k^3\tilde{c}_{3s}+O(k^4) =c_{r}+\textrm{i}c_{i}, \end{gather}
 \begin{gather}c=c_m=\tilde{c}_{0m}+k\tilde{c}_{1m}+k^2\tilde{c}_{2m}+k^3\tilde{c}_{3m}+O(k^4) =c_{r}+\textrm{i}c_{i}, \end{gather}
where  $c_{r}$ and
 $kc_{i}$ specify the phase speed and temporal growth rate of the infinitesimal disturbance, respectively. Therefore, based on the long-wave analysis, one can claim that the inertia, or equivalently the Reynolds number
 $Re$, has a weak effect on the temporal growth rate for the surfactant mode because the effect of
 $Re$ appears in the expression of order
 $O(k^3)$. Next, the long-wave results will be produced based on (3.70) and (3.71). In order to confirm the dual behaviour of the imposed shear stress on the surface mode in two distinct regimes of
 $C_K$ (
 $C_K< C_K^*$ &
 $C_K>C_K^*$), we compute the temporal growth rate for the surface mode when the imposed shear stress varies. Figure 5 demonstrates the variation of temporal growth rate
 $kc_i$ with wavenumber
 $k$ for the surface mode. It is observed that the temporal growth rate for the surface mode attenuates with the increasing value of
 $\tau$ when
 $C_K < C_K^*$, but it enhances with the increasing value of
 $\tau$ when
 $C_K>C_K^*$. These facts fully ensure the dual role of imposed shear stress in the surface mode and are consistent with the results reported in figure 4. Hence, the imposed shear stress has a stabilizing effect on the surface mode when
 $C_K< C_K^*$. However, it shows a destabilizing effect on the surface mode when
 $C_K>C_K^*$. Further, in order to confirm the stabilizing effect of the Marangoni number on the surface mode, we produce the temporal growth rate again for the surface mode when the Marangoni number varies rather than
 $\tau$. The result can be found in figure 6. In this case, the temporal growth rate for the surface mode attenuates in both regimes of
 $C_K$ (
 $C_K< C_K^*$ &
 $C_K>C_K^*$) as soon as the Marangoni number increases. The above results ensure the stabilizing effect of the Marangoni number on the surface mode. Hence, for a surfactant-laden fluid flowing down a compliant substrate, one can obtain a stable range of Reynolds number for the surface mode when
 $C_K < C_K^*$. Furthermore, in order to analyse the effects of wall parameters
 $C_K$ and
 $C_D$ on the surfactant mode, the temporal growth rate for the surfactant mode is plotted in figure 7. Note that the temporal growth rate for the surfactant mode enhances with increasing values of spring stiffness
 $C_K$ and damping coefficient
 $C_D$. Hence, both spring stiffness and damping coefficient exhibit a destabilizing effect on the surfactant mode. Apparently, it seems that the effect of
 $C_K$ is more discernible than that of
 $C_D$ on the surfactant mode. Basically, in the presence of flexible substrate, a non-zero first-order longitudinal fluid velocity component
 $\tilde {u}_1$ is generated in the case of the surfactant mode. This fact is different from the study of surfactant-laden shear-imposed flow over a rigid substrate (Wei Reference Wei2005; Bhat & Samanta Reference Bhat and Samanta2019), where first-order velocity components of the perturbation fluid are identically zero for the surfactant mode. As a result, in the present case, the additional longitudinal shear flow boosts the shear-induced Marangoni instability through the perturbation tangential stress balance equation and yields a destabilizing effect.
(a) Variation of temporal growth rate  $kc_i$ with wavenumber
 $k$ for the surface mode when
 $Re=1$ and
 $C_K=1< C_K^*$. Solid, dashed and dotted lines stand for
 $\tau =0.1$,
 $\tau =0.2$ and
 $\tau =0.3$ respectively. The arrow shows the direction of decreasing temporal growth rate with increasing
 $\tau$. (b) Variation of temporal growth rate
 $kc_i$ with wavenumber
 $k$ for the surface mode when
 $Re=2.5$ and
 $C_K=3>C_K^*$. Solid, dashed and dotted lines stand for
 $\tau =0.1$,
 $\tau =0.2$ and
 $\tau =0.3$, respectively. The arrow shows the direction of increasing temporal growth rate with increasing
 $\tau$. The other parameter values are
 $C_I=C_D=C_T=0$,
 $Ca=2$,
 $Ma=1$ and
 $\theta =45^{\circ }$. The results are plotted by solving (3.70).

(a) Variation of temporal growth rate  $kc_i$ with wavenumber
 $k$ for the surface mode when
 $Re=1$ and
 $C_K=1< C_K^*$. Solid, dashed and dotted lines stand for
 $Ma=0.8$,
 $Ma=0.9$ and
 $Ma=1.0$, respectively. The arrow shows the direction of decreasing temporal growth rate with increasing
 $Ma$. (b) Variation of temporal growth rate
 $kc_i$ with wavenumber
 $k$ for the surface mode when
 $Re=1$ and
 $C_K=3>C_K^*$. Solid, dashed and dotted lines stand for
 $Ma=0.1$,
 $Ma=0.2$ and
 $Ma=0.3$ respectively. The arrow shows the direction of decreasing temporal growth rate with increasing
 $Ma$. The other parameter values are
 $C_I=C_D=C_T=0$,
 $Ca=2$,
 $\tau =0.1$ and
 $\theta =45^{\circ }$. The results are plotted by solving (3.70).

(a) Variation of temporal growth rate  $kc_i$ with wavenumber
 $k$ for the surfactant mode when
 $C_D=1$. Solid, dashed and dotted lines stand for
 $C_K=0.5$,
 $C_K=0.6$ and
 $C_K=0.7$ respectively. The arrow shows the direction of increasing temporal growth rate with increasing
 $C_K$. (b) Variation of temporal growth rate
 $kc_i$ with wavenumber
 $k$ for the surfactant mode when
 $C_K=0.5$. Solid, dashed and dotted lines stand for
 $C_D=1$,
 $C_D=1.25$ and
 $C_D=1.5$ respectively. The arrow shows the direction of increasing temporal growth rate with increasing
 $C_D$. The other parameter values are
 $Re=0.1$,
 $Ca=2$,
 $Ma=0.1$,
 $\tau =0.1$ and
 $\theta =45^{\circ }$. The results are plotted by solving (3.71).

4. Linear stability analysis in the arbitrary wavenumber regime
In order to investigate the linear stability of an infinitesimal disturbance in the arbitrary wavenumber regime, we shall formulate the Orr–Sommerfeld-type boundary value problem for a shear-imposed surfactant-laden fluid flowing down a compliant substrate. To this end, the perturbation streamfunction  $\psi '$ is introduced from the perturbation continuity equation (3.2) by using the relations
 $u'=\partial _y\psi '$ and
 $v'=-\partial _x\psi '$. Then, the amplitude of streamfunction
 $\tilde {\psi }$ can be expressed in terms of the amplitudes of perturbation velocity components
 $\tilde {u}$ and
 $\tilde {v}$ as
 \begin{equation} \tilde{u}=\partial_y\tilde{\psi},\quad \tilde{v}={-}\textrm{i}k\tilde{\psi}. \end{equation}
Substituting (4.1a,b) in (3.12)–(3.20) and eliminating pressure terms from the perturbation momentum equations, we obtain the following Orr–Sommerfeld-type boundary value problem:
 \begin{gather} (\partial_{yyyy}\tilde{\psi}-2k^2\partial_{yy}\tilde{\psi}+k^4\tilde{\psi})-Re\textrm{i}k[(U-c)(\partial_{yy}\tilde{\psi}-k^2\tilde{\psi})-\partial_{yy}U\tilde{\psi}]=0,\quad 0 \le y \le 1, \end{gather}
 \begin{gather} \partial_{yy}\tilde{\psi}+k^2\tilde{\psi}+\tilde{h}\partial_{yy}U+\textrm{i}kMa\tilde{\varGamma}=0,\quad \textrm{at}\ y=1, \end{gather}
 \begin{gather} (\partial_{yyy}\tilde{\psi}-3k^2\partial_y\tilde{\psi}) -Re\textrm{i}\,k[(U-c)\partial_y\tilde{\psi}-\tilde{\psi}\partial_yU]\nonumber\\ -\textrm{i}\,k\tilde{h}[2\cot\theta-2\textrm{i}k\partial_yU+k^2/Ca]=0,\quad \textrm{at}\ y=1, \end{gather}
 \begin{gather} (U-c)\tilde{\varGamma}+\partial_y\tilde{\psi}+\partial_yU\tilde{h}=0,\quad \textrm{at}\ y=1, \end{gather}
 \begin{gather} (U-c)\tilde{h}+\tilde{\psi}=0,\quad \textrm{at}\ y=1, \end{gather}
 \begin{gather} -C_{I}\textrm{i}k^3c^2\tilde{\eta}+C_Dk^2c \tilde{\eta}+C_Bik^5\tilde{\eta}+C_T\,\textrm{i}k^3\tilde{\eta}+C_K\,\textrm{i}k\tilde{\eta}-2\textrm{i}k\cot \theta \tilde{\eta}\nonumber\\ +(\partial_{yyy}\tilde{\psi}-k^2\partial_y\tilde{\psi})=0,\quad \textrm{at}\ y=0, \end{gather}
 \begin{gather} \partial_y\tilde{\psi}+\partial_yU\tilde{\eta} =0,\quad \tilde{\psi}-c\tilde{\eta}=0,\quad \textrm{at}\ y=0. \end{gather}
The above fourth-order boundary value problem (4.2)–(4.8) is solved numerically based on the Chebyshev spectral collocation method (Schmid & Henningson Reference Schmid and Henningson2001; Samanta Reference Samanta2020a). As a consequence, the amplitude of the perturbation streamfunction  $\tilde {\psi }(y)$ is expanded in truncated series of Chebyshev polynomials
 \begin{equation} \tilde{\psi}(y) = \sum_{i=0}^{N}\tilde{\psi}_iT_i(y), \end{equation}
where  $T_i(y)$ are Chebyshev polynomials of the first kind,
 $N$ is a positive integer and
 $\tilde {\psi }_i$ are constant coefficients to be determined. Since the Chebyshev polynomials are defined over the domain
 $-1 \le y \le 1$, the domain of mainstream fluid layer is shifted from
 $0 \le y \le 1$ to
 $-1 \le x \le 1$ by using the transformation
 $x=(2y-1)$. Accordingly, the partial derivatives are also transferred as
 $\partial /\partial y \to 2\partial /\partial x$,
 $\partial ^2/\partial y^2 \to 4\partial ^2/\partial x^2$, and so on. Inserting the series expansion (4.9) in the Orr–Sommerfeld-type boundary value problem (4.2)–(4.8), the Chebyshev functions are computed at the Gauss–Lobatto collocation points
 $x_j = \cos ({\rm \pi} j/N)$, which are extrema of the Chebyshev polynomials, where
 $j = 0, \ldots , N$. Finally, the fourth-order boundary value problem is recast into a polynomial eigenvalue problem
 \begin{equation} [c^2\mathcal{A}_2+c\mathcal{A}_1+\mathcal{A}_0]\mathcal{X}=0, \end{equation}
where  $c$ is the eigenvalue,
 $\mathcal {A}_2$,
 $\mathcal {A}_1$ and
 $\mathcal {A}_0$ are square matrices of order
 $(N+1)\times (N+1)$ and
 $\mathcal {X}=[\tilde {\psi }_0,\tilde {\psi }_1,\ldots ,\tilde {\psi }_N]^\textrm {T}$ is a column matrix. It should be useful to mention here that the eigenvalues are computed numerically by using the MATLAB routine polyeig. The most unstable temporal modes will be identified and presented when the flow parameters vary.
4.1. Validation of the numerical code
Before producing the current results, the numerical code is validated with the available results of the literature. Consequently, we choose the parameter values as given in Alexander et al. (Reference Alexander, Kirk and Papageorgiou2020)  $C_I=1$,
 $C_D=1$,
 $C_B=1$,
 $C_T=1$,
 $Ca=1$,
 $Ma=0$,
 $\tau =0$ and
 $\theta =45^{\circ }$. Figure 8 exhibits the neutral curve and temporal growth rate for the surface mode when the wall parameter
 $C_K$ alters. It should be noted that the current results capture the results of Alexander et al. (Reference Alexander, Kirk and Papageorgiou2020) very well in appropriate limits, i.e. when the flow parameter values are the same as specified in Alexander et al. (Reference Alexander, Kirk and Papageorgiou2020). Apparently, it seems that there occurs subcritical instability in the finite wavenumber regime with a decreasing value of spring stiffness
 $C_K$, i.e. the finite wavelength instability induced by the surface mode may occur before criticality obtained from the long-wave analysis (see figure 8a). In particular, the primary instability for the given parameter values begins at
 $C_K=5$ when the Reynolds number exceeds its critical value. As soon as
 $C_K$ decreases, the finite wavelength subcritical instability generated by the surface mode occurs at a lower Reynolds number than the critical Reynolds number. If
 $C_K$ is further reduced (
 $C_K=2.6$), the finite wavelength instability even takes place at zero Reynolds number. In this case, we have found an unstable range of finite wavenumber where instability occurs despite the value of zero Reynolds number, which indicates the existence of inertialess instability induced by the surface mode in the finite wavenumber regime (the discussion of inertialess instability analysis can be found in Appendix B). The associated unstable region magnifies with the decreasing value of
 $C_K$. The above results are also confirmed through the plot of temporal growth rate demonstrated in figure 8(b). Obviously, there exists an unstable range of finite wavenumber at
 $C_K=2.6$, where the temporal growth rate is positive, as expected. Moreover, the temporal growth rate intensifies with the decreasing value of
 $C_K$ and supports the result reported in figure 8(a). Hence, the increasing value of
 $C_K$ has a stabilizing effect on the surface mode. In order to compare with the results acquired from the long-wave analysis, the critical Reynolds number for the surface mode is computed numerically and verified with that obtained from the long-wave analysis. Table 1 shows an excellent agreement between them. Moreover, it is observed that the critical Reynolds number for the surface mode enhances with the increasing value of
 $C_K$, which is fully consistent with the stabilizing effect of
 $C_K$ on the surface mode.
(a) Variation of neutral curve for the surface mode in the ( $Re$,
 $k$) plane for different values of
 $C_K$. Solid, dashed, dotted and dash-dotted lines stand for
 $C_K=5$,
 $C_K=3$,
 $C_K=2.6$ and
 $C_K=2$ respectively. The arrow shows the direction of decreasing unstable region with increasing
 $C_K$. (b) Variation of temporal growth rate
 $kc_i$ with wavenumber
 $k$ for the surface mode when
 $Re=0.2$. Solid, dashed, dotted and dash-dotted lines stand for
 $C_K=2.6$,
 $C_K=2.4$,
 $C_K=2.2$ and
 $C_K=2$ respectively. The arrow shows the direction of decreasing temporal growth rate with increasing
 $C_K$. The other parameter values are
 $C_I=1$,
 $C_D=1$,
 $C_B=1$,
 $C_T=1$,
 $Ca=1$,
 $Ma=0$,
 $\tau =0$ and
 $\theta =45^{\circ }$. Here,
 $U$ and
 $S$ represent unstable and stable regions. Points are the results of Alexander et al. (Reference Alexander, Kirk and Papageorgiou2020). The results are plotted by solving the eigenvalue problem (4.10).

Analytical and numerical comparison of critical Reynolds number for the surface mode when  $C_K$ varies. The other parameter values are
 $C_I=1$,
 $C_D=1$,
 $C_B=1$,
 $C_T=1$,
 $Ca=1$,
 $Ma=0$,
 $\tau =0$ and
 $\theta =45^{\circ }$.

Following Alexander et al. (Reference Alexander, Kirk and Papageorgiou2020), if a particular set of wall parameters ( $C_I=1$,
 $C_B=1$,
 $C_T=1$,
 $C_K=5$,
 $C_D=0.32$) is preferred in the numerical simulation, a new temporal mode, the so-called wall mode, appears in the (
 $Re$,
 $k$) plane (see figure 9a). It should be noted that the primary instability induced by the wall mode emerges in the finite wavenumber regime instead of the long-wave regime, and the unstable domain responsible for the wall mode magnifies with the decreasing value of
 $C_D$. Hence, the increasing value of damping coefficient
 $C_D$ has a stabilizing effect on the wall mode. Moreover, the primary instability generated by the wall mode occurs even at zero Reynolds number when
 $C_D=0.3$, which indicates the existence of inertialess instability induced by the wall mode in the finite wavenumber regime. In order to strengthen the above result, the temporal growth rate for the wall mode is also computed numerically and illustrated in figure 9(b) when
 $C_D$ varies. Obviously, the temporal growth rate attenuates as soon as
 $C_D$ increases and ensures the stabilizing effect of
 $C_D$ on the wall mode. To take into account the effect of
 $C_K$ on the wall mode, the numerical simulation is again performed when the wall parameter
 $C_K$ varies while
 $C_D=0.32$ is fixed. The associated result is depicted in figure 10(a). Note that the unstable domain for the wall mode reduces with the increasing value of
 $C_K$, and this fact is followed by the successive increment of critical Reynolds number. Hence, increasing spring stiffness
 $C_K$ shows a stabilizing effect on the wall mode as predicted by the damping coefficient
 $C_D$ on the wall mode. Figure 10(b) displays the associated temporal growth rate for the wall mode when
 $C_K$ alters. Obviously, the maximum temporal growth rate attenuates with the increasing value of
 $C_K$, which is fully consistent with the result reported in figure 10(a). As discussed by Alexander et al. (Reference Alexander, Kirk and Papageorgiou2020), the compliant substrate behaves gradually as a rigid substrate with increasing values of the wall parameters
 $C_K$ and
 $C_D$, which precludes the wall mode evolving with time, and is probably the reason for the stabilizing effects of
 $C_K$ and
 $C_D$ on the wall mode.
(a) Variation of neutral curve for the wall mode in the ( $Re$,
 $k$) plane for different values of
 $C_D$. Solid, dashed and dotted lines stand for
 $C_D=0.3$,
 $C_D=0.32$ and
 $C_D=0.34$ respectively. The arrow shows the direction of decreasing unstable region with increasing
 $C_D$. (b) Variation of temporal growth rate
 $kc_i$ with wavenumber
 $k$ for the wall mode when
 $Re=2$. Solid, dashed and dotted lines stand for
 $C_D=0.3$,
 $C_D=0.32$ and
 $C_D=0.34$ respectively. The arrow shows the direction of decreasing temporal growth rate with increasing
 $C_D$. The other parameter values are
 $C_I=1$,
 $C_K=5$,
 $C_B=1$,
 $C_T=1$,
 $Ca=1$,
 $Ma=0$,
 $\tau =0$ and
 $\theta =45^{\circ }$. Here,
 $U$ and
 $S$ represent unstable and stable regions. Points are the results of Alexander et al. (Reference Alexander, Kirk and Papageorgiou2020). The results are plotted by solving the eigenvalue problem (4.10).

(a) Variation of neutral curve for the wall mode in the ( $Re$,
 $k$) plane for different values of
 $C_K$. Solid, dashed and dotted lines stand for
 $C_K=5$,
 $C_K=7.5$ and
 $C_K=10$ respectively. The arrow shows the direction of decreasing unstable region with increasing
 $C_K$. (b) Variation of temporal growth rate
 $kc_i$ with wavenumber
 $k$ for the wall mode when
 $Re=3$. Solid, dashed and dotted lines stand for
 $C_K=5$,
 $C_K=7.5$ and
 $C_K=10$ respectively. The arrow shows the direction of decreasing temporal growth rate with increasing
 $C_K$. The other parameter values are
 $C_I=1$,
 $C_D=0.32$,
 $C_B=1$,
 $C_T=1$,
 $Ca=1$,
 $Ma=0$,
 $\tau =0$ and
 $\theta =45^{\circ }$. Here,
 $U$ and
 $S$ represent unstable and stable regions. Points are the results of Alexander et al. (Reference Alexander, Kirk and Papageorgiou2020). The results are plotted by solving the eigenvalue problem (4.10).

4.2. Effect of inclination angle on the wall mode
As the critical Reynolds number for the surface mode is determined analytically, which decreases with the increasing value of  $\theta$, so the inclination angle has a destabilizing effect on the surface mode. On the other hand, the critical Reynolds number for the wall mode cannot be determined analytically based on the long-wave analysis because it appears in the finite wavenumber regime. Therefore, in order to examine the solo effect of inclination angle on the wall mode,
 $\theta$ is changed in the numerical simulation when other parameter values are fixed. Figure 11 illustrates the neutral curve and temporal growth rate for the wall mode when
 $\theta$ changes. It is observed that the unstable domain for the wall mode magnifies significantly with the increasing value of inclination angle, and this fact is followed by the successive reduction of the critical Reynolds number. Hence, the increasing value of inclination angle has a destabilizing effect on the wall mode, as speculated for the surface mode. In this case also, the primary instability induced by the wall mode occurs at zero Reynolds number when
 $\theta =50^{\circ }$. Hence, we can obtain an unstable range of finite wavenumber even at zero Reynolds number where the infinitesimal disturbance will be susceptible to instability by the wall mode. This result indicates the existence of inertialess instability generated by the wall mode in the finite wavenumber regime. Basically, the stabilizing influence of depthwise gravity on the primary instability weakens as soon as the inclination angle increases. This fact can be attributed to the cause for the destabilizing effect of inclination angle on the wall mode.
(a) Variation of neutral curve for the wall mode in the ( $Re$,
 $k$) plane for different values of
 $\theta$. Solid, dashed, dotted and dash-dotted lines stand for
 $\theta =35^{\circ }$,
 $\theta =40^{\circ }$,
 $\theta =45^{\circ }$ and
 $\theta =50^{\circ }$ respectively. The arrow shows the direction of the increasing unstable region with increasing
 $\theta$. (b) Variation of temporal growth rate
 $kc_i$ with wavenumber
 $k$ for the wall mode when
 $Re=3$. Solid, dashed, dotted and dash-dotted lines stand for
 $\theta =35^{\circ }$,
 $\theta =40^{\circ }$,
 $\theta =45^{\circ }$ and
 $\theta =50^{\circ }$ respectively. The arrow shows the direction of increasing temporal growth rate with increasing
 $\theta$. The other parameter values are
 $C_I=1$,
 $C_K=5$,
 $C_D=0.32$,
 $C_B=1$,
 $C_T=1$,
 $Ca=1$,
 $Ma=0$ and
 $\tau =0$. Here,
 $U$ and
 $S$ represent unstable and stable regions. The results are plotted by solving the eigenvalue problem (4.10).

4.3. Effect of Marangoni number on the surface mode and wall mode
In this subsection, we shall solely explore the effect of Marangoni number on the primary instabilities induced by the surface mode and wall mode. Consequently, we set  $\tau =0$. In accordance with the work of Alexander et al. (Reference Alexander, Kirk and Papageorgiou2020), the parameter values are selected as
 $C_I=1$,
 $C_D=0.32$,
 $C_K=5$,
 $C_T=1$ and
 $\theta =45^{\circ }$. As discussed by Alexander et al. (Reference Alexander, Kirk and Papageorgiou2020), we have numerically found two dominant temporal modes, the so-called surface mode and wall mode, when the Reynolds number is low and the inclination angle is high. The associated neutral curves for the surface mode and wall mode are displayed in figure 12(a) when the Marangoni number varies. It is observed that the unstable region for the wall mode is enhanced but the unstable region for the surface mode is reduced with an increasing value of the Marangoni number. Hence, the Marangoni number has a destabilizing effect on the wall mode but shows a stabilizing effect on the surface mode. The interesting fact is that the instability for the wall mode occurs even at zero Reynolds number with the increasing value of Marangoni number. Therefore, one can claim that there exists inertialess instability induced by the wall mode at higher values of the Marangoni number. Further, the critical Reynolds number for the wall mode is lower than that for the surface mode. Hence, the finite wavenumber primary instability induced by the wall mode commences before the primary instability generated by the surface mode. As soon as the Reynolds number increases, the surface mode dominates the primary instability in the long-wave regime instead of the wall mode. This result indicates the existence of a mode switching process in the finite wavenumber regime. On the contrary, if the value of wall damping coefficient
 $C_D$ is slightly increased and set to
 $C_D=0.38$, the opposite phenomenon occurs, i.e. the critical Reynolds number for the surface mode is no longer higher than that for the wall mode. Instead, it is lower than that for the wall mode at
 $Ma=0$, which can be found in figure 12(b). Therefore, the primary instability is initially dominated by the surface mode rather than the wall mode when
 $Ma=0$ and
 $C_D=0.38$. If the Marangoni number is increased in the numerical simulation, the result again reverses at
 $Ma=0.6$, i.e. the critical Reynolds number for the wall mode is lower than that for the surface mode. It seems that there exists a competition between the wall mode and surface mode with the variation of parameter values to trigger the primary instability initially. In order to confirm the above results, the temporal growth rates for the surface mode and wall mode are revealed in figures 12(c) and 12(d) where
 $Re=2$ and
 $Re=0.6$, respectively. Obviously, the temporal growth rate for the surface mode becomes weaker while the temporal growth rate for the wall mode becomes stronger as soon as the Marangoni number increases. These results are fully in favour of the results reported in figure 12(a).
(a) Variation of neutral curves for the surface mode and wall mode in the ( $Re$,
 $k$) plane for different values of
 $Ma$ when
 $C_D=0.32$. Solid, dashed, dotted and dash-dotted lines stand for
 $Ma=0$,
 $Ma=0.1$,
 $Ma=0.2$ and
 $Ma=0.3$ respectively. (b) Variation of neutral curves for the surface mode and wall mode in the (
 $Re$,
 $k$) plane for different values of
 $Ma$ when
 $C_D=0.38$. Solid, dashed and dotted lines stand for
 $Ma=0$,
 $Ma=0.3$ and
 $Ma=0.6$ respectively. (c) Variation of temporal growth rate
 $kc_i$ with wavenumber
 $k$ for the surface mode when
 $Re=2$ and
 $C_D=0.32$. Solid, dashed, dotted and dash-dotted lines stand for
 $Ma=0$,
 $Ma=0.1$,
 $Ma=0.2$ and
 $Ma=0.3$ respectively. The arrow shows the direction of decreasing temporal growth rate with increasing
 $Ma$. (d) Variation of temporal growth rate
 $kc_i$ with wavenumber
 $k$ for the wall mode when
 $Re=0.6$ and
 $C_D=0.32$. Solid, dashed, dotted and dash-dotted lines stand for
 $Ma=0$,
 $Ma=0.1$,
 $Ma=0.2$ and
 $Ma=0.3$ respectively. The arrow shows the direction of increasing temporal growth rate with increasing
 $Ma$. The other parameter values are
 $C_I=1$,
 $C_K=5$,
 $C_B=1$,
 $C_T=1$,
 $Ca=1$,
 $\tau =0$ and
 $\theta =45^{\circ }$. Here,
 $U$ and
 $S$ represent unstable and stable regions. The results are plotted by solving the eigenvalue problem (4.10).

4.4. Effect of imposed shear stress on the surface mode and wall mode
In order to investigate the solo effect of imposed shear stress on the primary instabilities induced by the surface mode and wall mode, we set  $Ma=0$,
 $C_K=5$ and
 $C_D=0.32$. Figure 13(a) displays the neutral curve in the (
 $Re$,
 $k$) plane when
 $\tau$ varies. It is observed that both the surface mode and wall mode appear in the neutral diagram as before. However, the unstable region for the surface mode is magnified while the unstable region for the wall mode decays with the increasing value of imposed shear stress. Hence, the imposed shear stress has a destabilizing effect on the surface mode but shows a stabilizing effect on the wall mode. This result is fully opposite to the effect of Marangoni number on the surface mode and wall mode. Furthermore, the critical Reynolds number for the surface mode is greater than that of the wall mode at
 $\tau =0$. Therefore, at the outset, the primary instability is dominated by the wall mode in the finite wavenumber regime. As soon as
 $\tau$ increases, the reverse phenomenon happens, i.e. the critical Reynolds number for the wall mode is greater than that of the surface mode at
 $\tau =0.2$. Hence, the primary instability is triggered by the surface mode at the outset instead of the wall mode when
 $\tau =0.2$. Again, the mode switching process takes place with the increasing value of imposed shear stress. If the wall damping coefficient
 $C_D$ is slightly shifted to a higher value
 $C_D=0.38$ as before, the primary instability is always dominated by the surface mode at the outset (see figure 13b). In this case, the wall mode has no chance to trigger the primary instability at the beginning, because the critical Reynolds number for the wall mode is always greater than that of the surface mode. Figures 13(c) and 13(d) demonstrate the associated temporal growth rates for the surface mode and wall mode, respectively. It should be noted that the temporal growth rate for the surface mode becomes stronger while the temporal growth rate for the wall mode becomes weaker in the presence of imposed shear stress. These results are fully consistent with the results reported in figure 13(a).
(a) Variation of neutral curves for the surface mode and wall mode in the ( $Re$,
 $k$) plane for different values of
 $\tau$ when
 $C_D=0.32$. Solid, dashed and dotted lines stand for
 $\tau =0$,
 $\tau =0.1$ and
 $\tau =0.2$ respectively. (b) Variation of neutral curves for the surface mode and wall mode in the (
 $Re$,
 $k$) plane for different values of
 $\tau$ when
 $C_D=0.38$. Solid, dashed and dotted lines stand for
 $\tau =0$,
 $\tau =0.1$, and
 $\tau =0.2$ respectively. (c) Variation of temporal growth rate
 $kc_i$ with wavenumber
 $k$ for the surface mode when
 $Re=1$ and
 $C_D=0.32$. Solid, dashed and dotted lines stand for
 $\tau =0$,
 $\tau =0.1$ and
 $\tau =0.2$ respectively. The arrow shows the direction of increasing temporal growth rate with increasing
 $\tau$. (d) Variation of temporal growth rate
 $kc_i$ with wavenumber
 $k$ for the wall mode when
 $Re=2$ and
 $C_D=0.32$. Solid, dashed and dotted lines stand for
 $\tau =0$,
 $\tau =0.1$ and
 $\tau =0.2$ respectively. The arrow shows the direction of decreasing temporal growth rate with increasing
 $\tau$. The other parameter values are
 $C_I=1$,
 $C_K=5$,
 $C_B=1$,
 $C_T=1$,
 $Ca=1$,
 $Ma=0$ and
 $\theta =45^{\circ }$. Here,
 $U$ and
 $S$ represent unstable and stable regions. The results are plotted by solving the eigenvalue problem (4.10).

4.5. Effect of wall parameters $C_I$, $C_T$ and $C_B$ on the surface mode and wall mode


In this subsection, we shall explore the effects of wall parameters  $C_I$,
 $C_T$ and
 $C_B$ on the surface mode and wall mode, respectively. First, we shall vary the compliant substrate inertia, or equivalently,
 $C_I$ when other wall parameters are fixed. The results are displayed in figure 14(a). It should be noted that the unstable domain associated with the surface mode magnifies significantly with the increasing value of
 $C_I$. However, the critical Reynolds number from which the neutral curves emanate is the same for all neutral curves because the critical Reynolds number for the surface mode acquired from the long-wave analysis does not depend on the wall parameter
 $C_I$ (see (3.55)). Moreover, we can perceive the existence of subcritical instability with the increasing value of
 $C_I$. In particular, the primary instability generated by the surface mode occurs at
 $C_I=1$ when the Reynolds number exceeds its critical value. As soon as the wall parameter
 $C_I$ increases, the neutral curve distorts from its initial shape and exhibits subcritical instability at
 $C_I=2.4$. In this case, the primary instability responsible for the surface mode happens in the finite wavenumber regime even when the Reynolds number is lower than the critical value. If
 $C_I$ is further increased, the primary instability even takes place in the finite wavenumber regime despite the value of zero Reynolds number when
 $C_I=2.45$. Therefore, there exists inertialess instability induced by the surface mode in the finite wavenumber regime with the increasing value of
 $C_I$. On the other hand, the slight variation of
 $C_I$ has a significant impact on the wall mode. The result can be found in figure 14(b). It should be noted that the unstable region corresponding to the wall mode also magnifies with the increasing value of
 $C_I$. This fact is followed by the successive reduction of critical Reynolds number for the wall mode. Furthermore, there is possible to have inertialess instability in the finite wavenumber regime induced by the wall mode as well with the increasing value of
 $C_I$. Hence, the wall parameter
 $C_I$ has a destabilizing effect on the surface mode and wall mode. Figure 15 reveals the variation of neutral curves for the surface mode and wall mode when the wall parameters
 $C_T$ and
 $C_B$ change but
 $C_I$ is fixed. In both cases, the unstable domains associated with the surface mode and wall mode attenuate with the increasing values of
 $C_T$ and
 $C_B$ respectively. Therefore, both wall parameters
 $C_T$ and
 $C_B$ have a stabilizing effect on the surface mode and wall mode, respectively. It should be noted that the critical Reynolds number for the surface mode does not alter with the variations of
 $C_T$ and
 $C_B$. This fact is fully consistent with the analytical expression of critical Reynolds number for the surface mode supplied in (3.55). As the critical Reynolds number for the surface mode is fixed with the variations of wall parameters
 $C_T$ and
 $C_B$, there is a prospect for the surface mode to dominate the primary instability at the beginning with the increasing values of wall parameters
 $C_T$ and
 $C_B$ because the critical Reynolds number for the wall mode reduces successively as long as
 $C_T$ and
 $C_B$ increase.
(a) Variation of neutral curve for the surface mode in the ( $Re$,
 $k$) plane for different values of
 $C_I$. Solid, dashed, dotted, dash-dotted and thick lines stand for
 $C_I=1$,
 $C_I=1.5$,
 $C_I=2$,
 $C_I=2.4$ and
 $C_I=2.45$, respectively. The arrow shows the direction of the increasing unstable region with increasing
 $C_I$. (b) Variation of neutral curve for the wall mode in the (
 $Re$,
 $k$) plane for different values of
 $C_I$. Solid, dashed and dotted lines stand for
 $C_I=1$,
 $C_I=1.05$ and
 $C_I=1.1$, respectively. The arrow shows the direction of the increasing unstable region with increasing
 $C_I$. The other parameter values are
 $C_K=5$,
 $C_T=1$,
 $C_B=1$,
 $C_D=0.32$,
 $Ca=1$,
 $Ma=0$,
 $\tau =0$ and
 $\theta =45^{\circ }$. Here,
 $U$ and
 $S$ represent unstable and stable regions. The results are plotted by solving the eigenvalue problem (4.10).

(a) Variation of neutral curves for the surface mode and wall mode in the ( $Re$,
 $k$) plane for different values of
 $C_T$ when
 $C_B=1$. Solid, dashed and dotted lines stand for
 $C_T=1$,
 $C_T=3$ and
 $C_T=5$, respectively. (b) Variation of neutral curves for the surface mode and wall mode in the (
 $Re$,
 $k$) plane for different values of
 $C_B$ when
 $C_T=1$. Solid, dashed and dotted lines stand for
 $C_B=1$,
 $C_B=5$ and
 $C_B=10$, respectively. The other parameter values are
 $C_I=1$,
 $C_K=5$,
 $C_D=0.32$,
 $Ca=1$,
 $Ma=0$,
 $\tau =0$ and
 $\theta =45^{\circ }$. Here,
 $U$ and
 $S$ represent unstable and stable regions. The results are plotted by solving the eigenvalue problem (4.10).

5. Linear stability analysis in the high Reynolds number regime
In this section, we shall explore the linear stability analysis of a surfactant-laden shear-imposed fluid flowing down a compliant substrate when the Reynolds number is high and the inclination angle is small. In fact, in this flow configuration, another temporal mode different from the wall mode appears in the finite wavenumber regime, which is referred to as the shear mode (Lin Reference Lin1967; Bruin Reference Bruin1974; Chin et al. Reference Chin, Abernath and Bertschy1986; Floryan et al. Reference Floryan, Davis and Kelly1987; Samanta Reference Samanta2013b). Essentially, these distinct dominant eigenmodes are distinguished by their different phase speeds. In order to retrieve these discrete modes, the eigenvalue problem (4.10) is solved numerically for the given set of parameter values  $C_I=1$,
 $C_K=10^5$,
 $C_D=10$,
 $C_B=1$,
 $C_T=1$,
 $Ca=1$,
 $Ma=0$,
 $\tau =0$ and
 $\theta =4^{\circ }$ (Alexander et al. Reference Alexander, Kirk and Papageorgiou2020). In fact, the large value of
 $C_K$ is considered to recover the result of a rigid wall. The results are demonstrated in figure 16 for two different values of wavenumber
 $k=0.5$ and
 $k=3$. It should be noted that the most unstable modes are the shear mode and the surface mode when
 $k=0.5$ and
 $Re=10^5$ (see figure 16a). These discrete unstable modes are recognizable because the phase speed of the shear mode is lower than that for the surface mode. In this case, the wall mode does not emerge in the spectrum because the wavenumber does not belong to the regime of appearance for the wall mode (Alexander et al. Reference Alexander, Kirk and Papageorgiou2020). As soon as the wavenumber is shifted to a higher value
 $k=3$, the wall mode emerges in the spectrum along with the surface mode because the wavenumber belongs to the regime of appearance for the wall mode (see figure 16b). In this case, the most unstable modes are the wall mode and the surface mode, where the phase speed of the wall mode is lower than that of the surface mode. However, the shear mode disappears from the spectrum because the wavenumber lies beyond the regime of appearance for the shear mode (Alexander et al. Reference Alexander, Kirk and Papageorgiou2020). In order to differentiate their characteristics, the eigenfunctions and the associated streamfunctions are computed numerically for the shear mode, wall mode and surface mode and displayed in figure 17. First we consider the case when
 $Re=10^5$ and
 $k=0.5$. In this case, the substantial change of eigenfunction for the unstable shear mode occurs close to the centre zone of the mainstream fluid. As a consequence, open vortices are generated in the centre zone of the mainstream fluid (see figure 17a,b). However, for the unstable surface mode, the substantial change of eigenfunction is noticed close to the fluid surface, which yields closed vortices in the vicinity of the fluid surface (see figure 17c,d). Obviously, the patterns of vortices corresponding to the shear mode and surface mode are fully different. In the second case, we choose
 $Re=10^5$ and
 $k=3$. In this case, the rapid change of eigenfunction for the unstable wall mode occurs in the vicinity of the compliant wall rather than the centre zone of the mainstream fluid. This fact causes open vortices that occupy the zone close to the compliant wall (see figure 17e,f). It should be noted that the pattern of vortices for the wall mode is reverse to that of the shear mode. On the other hand, for the unstable surface mode, the rapid change of eigenfunction occurs again close to the fluid surface, as expected. As a result, the vortices occupy the zone in the vicinity of the fluid surface (see figure 17g,h). Obviously, the pattern of vortices for the surface mode is similar to that obtained as before when
 $k=0.5$. However, the number of vortices increases when
 $k=3$. Here, we shall mainly focus on exploring the shear mode because this mode has not been discussed in the previous sections. In order to decipher the solo effect of imposed shear stress on the shear mode, we set the parameter values
 $C_I=1$,
 $C_K=10^4$,
 $C_D=10$,
 $C_B=1$,
 $C_T=1$,
 $Ca=1$,
 $Ma=0$ and
 $\theta =4^{\circ }$ as reported in the work of Alexander et al. (Reference Alexander, Kirk and Papageorgiou2020) when the imposed shear stress varies. The result is depicted in figure 18(a). It should be noted that the unstable domain generated by the shear mode magnifies significantly with the increasing value of imposed shear stress, and this fact is followed by the successive reduction of critical Reynolds number. Hence, the imposed shear stress shows a destabilizing effect on the shear mode. This result is further strengthened by exhibiting the result of temporal growth rate. Figure 18(b) displays that the maximum value of temporal growth rate corresponding to the shear mode also enhances with the increasing value of imposed stress. This fact ensures the destabilizing effect of imposed shear stress on the shear mode. There is evidence that the effect of Marangoni number on the shear mode is not notable when the inclination angle is
 $\theta =4^{\circ }$. However, if the inclination angle is reduced significantly and set to
 $\theta =1'=1^{\circ }/60$, a notable impact of Marangoni number on the shear mode can be found. The associated result is illustrated in figure 19(a) when the Marangoni number alters. In this case, the unstable domain responsible for the shear mode decays significantly with the increasing value of Marangoni number. This fact is fully in favour of the result of temporal growth rate shown in figure 19(b), where the temporal growth rate corresponding to the shear mode attenuates as soon as the Marangoni number increases. Hence, the Marangoni number has a stabilizing effect on the shear mode. It should be useful to mention here that the effect of Marangoni number on the shear mode is completely opposite to that of imposed shear stress on the shear mode. Furthermore, to take into account the effects of spring stiffness and damping coefficient on the shear mode, the numerical simulation is repeated again when the spring stiffness is varied while the damping coefficient is fixed to
 $C_D=10$. Figure 20(a) demonstrates the neutral curve for the shear mode. It is observed that the unstable domain induced by the shear mode is magnified rather than decaying with the increasing value of
 $C_K$, which is fully reverse to the effect of
 $C_K$ on the surface mode, where the increasing value of
 $C_K$ shows a stabilizing effect on the surface mode. Next, the effect of damping coefficient
 $C_D$ on the shear mode is demonstrated in figure 20(b). Obviously, the unstable domain generated by the shear mode magnifies as soon as
 $C_D$ increases. The similar result was earlier predicted by Carpenter & Garrad (Reference Carpenter and Garrad1985) for a boundary-layer instability over a compliant wall. Hence, the damping coefficient
 $C_D$ has a destabilizing effect on the shear mode as opposed to the stabilizing effect of
 $C_D$ on the surface mode. Finally, in order to examine the effects of Marangoni number and imposed shear stress on the wall mode in the high Reynolds number regime, the numerical simulation is repeated again when
 $C_K=10^5$,
 $C_D=10$,
 $C_I=1$,
 $C_B=1$,
 $C_T=1$,
 $Ca=1$ and
 $\theta =4^{\circ }$. First, the Marangoni number is varied while the imposed shear stress is fixed at
 $\tau =0$. Figure 21(a) demonstrates that the unstable region generated by the wall mode does not vary significantly with the Marangoni number. On the other hand, if the imposed shear stress is changed rather than the Marangoni number, the unstable region induced by the wall mode enhances with the increasing value of
 $\tau$, and this fact is followed by the successive reduction of critical Reynolds number for the wall mode (see figure 21b). Hence, the imposed shear stress has a destabilizing effect on the wall mode in the high Reynolds number regime as revealed for the shear mode. Further, the current result captures the result of Alexander et al. (Reference Alexander, Kirk and Papageorgiou2020) very well when
 $Ma=0$ and
 $\tau =0$.
Spectrum of the eigenvalue problem (4.10); (a)  $k=0.5$ and (b)
 $k=3$. The other parameter values are
 $Re=10^5$,
 $C_I=1$,
 $C_K=10^5$,
 $C_D=10$,
 $C_B=1$,
 $C_T=1$,
 $Ca=1$,
 $Ma=0$,
 $\tau =0$ and
 $\theta =4^{\circ }$. The inset shows a zoom of the surface mode.

(a) Variation of normalized eigenfunction with cross-stream coordinate  $y$ for the shear mode when
 $k=0.5$. (b) Contour plot of streamfunction in the (
 $x$,
 $y$) plane for the shear mode when
 $k=0.5$. (c) Variation of normalized eigenfunction with cross-stream coordinate
 $y$ for the surface mode when
 $k=0.5$. (d) Contour plot of streamfunction in the (
 $x$,
 $y$) plane for the surface mode when
 $k=0.5$. (e) Variation of normalized eigenfunction with cross-stream coordinate
 $y$ for the wall mode when
 $k=3$. (f) Contour plot of streamfunction in the (
 $x$,
 $y$) plane for the wall mode when
 $k=3$. (g) Variation of normalized eigenfunction with cross-stream coordinate
 $y$ for the surface mode when
 $k=3$. (h) Contour plot of streamfunction in the (
 $x$,
 $y$) plane for the surface mode when
 $k=3$. The other parameter values are
 $Re=10^5$,
 $C_I=1$,
 $C_K=10^5$,
 $C_D=10$,
 $C_B=1$,
 $C_T=1$,
 $Ca=1$,
 $Ma=0$,
 $\tau =0$ and
 $\theta =4^{\circ }$. Solid and dashed lines represent the real and imaginary parts of
 $\psi$, respectively. The results are plotted by solving the eigenvalue problem (4.10).

(a) Variation of neutral curve for the shear mode in the ( $Re$,
 $k$) plane for different values of
 $\tau$. Solid, dashed and dotted lines stand for
 $\tau =0$,
 $\tau =0.1$ and
 $\tau =0.2$ respectively. The arrow shows the direction of the increasing unstable region with increasing
 $\tau$. (b) Variation of temporal growth rate
 $kc_i$ for the shear mode with wavenumber
 $k$ for different values of
 $\tau$ when
 $Re=8000$. Solid, dashed and dotted lines stand for
 $\tau =0$,
 $\tau =0.1$ and
 $\tau =0.2$ respectively. The arrow shows the direction of increasing temporal growth rate with increasing
 $\tau$. The other parameter values are
 $C_I=1$,
 $C_K=10^4$,
 $C_D=10$,
 $C_B=1$,
 $C_T=1$,
 $Ca=1$,
 $Ma=0$ and
 $\theta =4^{\circ }$. Here,
 $U$ and
 $S$ represent unstable and stable regions. The results are plotted by solving the eigenvalue problem (4.10).

(a) Variation of neutral curve for the shear mode in the ( $Re$,
 $k$) plane for different values of
 $Ma$. Solid, dashed and dotted lines stand for
 $Ma=0$,
 $Ma=10$ and
 $Ma=20$, respectively. The arrow shows the direction of the decreasing unstable region with increasing
 $Ma$. (b) Variation of temporal growth rate
 $kc_i$ for the shear mode with wavenumber
 $k$ for different values of
 $Ma$ when
 $Re=9000$. Solid, dashed and dotted lines stand for
 $Ma=0$,
 $Ma=10$ and
 $Ma=20$, respectively. The arrow shows the direction of decreasing temporal growth rate with increasing
 $Ma$. The other parameter values are
 $C_I=1$,
 $C_K=10^4$,
 $C_D=10$,
 $C_B=1$,
 $C_T=1$,
 $Ca=1$,
 $\tau =0$ and
 $\theta =1^{'}=1^{\circ }/60$. Here,
 $U$ and
 $S$ represent unstable and stable regions. The results are plotted by solving the eigenvalue problem (4.10).

(a) Variation of neutral curve for the shear mode in the ( $Re$,
 $k$) plane for different values of
 $C_K$ when
 $C_D=10$. Solid, dashed and dotted lines stand for
 $C_K=10^4$,
 $C_K=2\times 10^4$ and
 $C_K=10^5$, respectively. The arrow shows the direction of the increasing unstable region with increasing
 $C_K$. (b) Variation of neutral curve for the shear mode in the (
 $Re$,
 $k$) plane for different values of
 $C_D$ when
 $C_K=10^4$. Solid, dashed and dotted lines stand for
 $C_D=10$,
 $C_D=10^2$ and
 $C_D=10^3$, respectively. The arrow shows the direction of increasing unstable region with increasing
 $C_D$. The other parameter values are
 $C_I=1$,
 $C_B=1$,
 $C_T=1$,
 $Ca=1$,
 $Ma=0$,
 $\tau =0$ and
 $\theta =1^{'}=1^{\circ }/60$. Here,
 $U$ and
 $S$ represent unstable and stable regions. The results are plotted by solving the eigenvalue problem (4.10).

(a) Variation of neutral curve for the wall mode in the ( $Re$,
 $k$) plane for different values of
 $Ma$ when
 $\tau =0$. Solid, dashed and dotted lines stand for
 $Ma=0$,
 $Ma=10$ and
 $Ma=20$, respectively. (b) Variation of neutral curve for the wall mode in the (
 $Re$,
 $k$) plane for different values of
 $\tau$ when
 $Ma=0$. Solid, dashed and dotted lines stand for
 $\tau =0$,
 $\tau =0.1$ and
 $\tau =0.2$, respectively. The arrow shows the direction of the increasing unstable region with increasing
 $\tau$. The other parameter values are
 $C_K=10^5$,
 $C_D=10$,
 $C_I=1$,
 $C_B=1$,
 $C_T=1$,
 $Ca=1$ and
 $\theta =4^{\circ }$. Here,
 $U$ and
 $S$ represent unstable and stable regions. Points are the results of Alexander et al. (Reference Alexander, Kirk and Papageorgiou2020). The results are plotted by solving the eigenvalue problem (4.10).

6. Discussion and Conclusions
The linear stability of a surfactant-laden shear-imposed fluid flowing down a compliant substrate is explored in detail under the framework of the Orr–Sommerfeld-type boundary value problem, which is solved analytically by using the long-wave series expansion and also solved numerically by using the Chebyshev spectral collocation method for disturbances of arbitrary wavenumbers. We have considered the same compliant wall model as proposed by Carpenter & Garrad (Reference Carpenter and Garrad1985) and Alexander et al. (Reference Alexander, Kirk and Papageorgiou2020) to describe the flexible property of the compliant substrate. The long-wave analysis identifies two temporal modes, the so-called surface mode and surfactant mode. Basically, the surface mode emerges due to the deformation of the fluid surface, while the surfactant mode emerges due to the perturbation of surfactant concentration. The long-wave analysis demonstrates that there exists a stable range of Reynolds number for the surface mode in the presence of insoluble surfactant even though the spring stiffness  $C_K$ retains a lower value than
 $C_K^*$ because the critical Reynolds number for the surface mode no longer approaches zero in the presence of Marangoni number when
 $C_K \to C_K^*$. Further, we have found the existence of two distinct regimes of spring stiffness
 $C_K$ in the presence of imposed shear stress where the surface mode becomes less unstable as long as
 $\tau$ increases when
 $C_K < C_K^*$. However, the surface mode becomes more unstable as long as
 $\tau$ increases when
 $C_K > C_K^*$. Hence, the imposed shear stress has a stabilizing effect on the surface mode when
 $C_K < C_K^*$, but it shows a destabilizing effect on the surface mode when
 $C_K > C_K^*$. In addition, the temporal growth rate for the surfactant mode intensifies in the presence of a compliant substrate, which indicates the destabilizing effect of compliant substrate on the surfactant mode.
On the other hand, the numerical result in the arbitrary wavenumber regime unveils the existence of a different temporal mode, the so-called wall mode, emerges in the finite wavenumber regime for a special set of wall parameter values, as reported by Alexander et al. (Reference Alexander, Kirk and Papageorgiou2020). The unstable domain for the wall mode enhances with the increasing value of Marangoni number. Hence, the Marangoni number has a destabilizing effect on the wall mode. However, the unstable domain for the wall mode decays with the increasing value of imposed shear stress. Hence, the imposed shear stress shows a stabilizing effect on the wall mode in contrast to the result of Marangoni number. Further, it is found that the primary instability induced by the wall mode becomes weaker as soon as spring stiffness  $C_K$ and damping coefficient
 $C_D$ increase. Hence, both
 $C_K$ and
 $C_D$ have a stabilizing effect on the wall mode. Furthermore, the critical Reynolds number for the wall mode reduces with the increasing value of inclination angle and ensures a destabilizing effect of inclination angle on the wall mode, as observed for the surface mode. Moreover, the unstable domain generated by the wall mode enhances with the increasing value of wall parameter
 $C_I$ but attenuates with the increasing values of wall parameters
 $C_T$ and
 $C_B$. In addition, the numerical result predicts the existence of inertialess instability in the finite wavenumber regime responsible for the wall mode.
In the case of the surface mode, the numerical result in the arbitrary wavenumber regime shows that the unstable domain reduces with an increasing value of Marangoni number, but the unstable domain magnifies in the presence of imposed shear stress. Hence, the Marangoni number has a stabilizing effect on the surface mode, but the imposed shear stress has a destabilizing effect on the surface mode. Further, we have found the existence of a subcritical instability generated by the surface mode in the finite wavenumber regime. The associated unstable region enhances with the decreasing value of spring stiffness  $C_K$. Hence, the spring stiffness shows a stabilizing effect on the surface mode. Moreover, the unstable domain induced by the surface mode enhances with the increasing value of wall parameter
 $C_I$ but attenuates with the increasing values of wall parameters
 $C_T$ and
 $C_B$. In addition, we have found that there exists a competition between wall mode and surface mode to dominate the primary instability initially with the variation of parameter values.
If the Reynolds number is high and the inclination angle is small, the shear mode appears in the finite wavenumber regime along with the surface mode and wall mode. The shear mode becomes more unstable with the increasing value of imposed shear stress when  $\theta =4^{\circ }$. However, the Marangoni number does not show significant impact on the shear mode unless the inclination angle is very small. It is observed that the shear mode becomes less unstable with the increasing value of Marangoni number when
 $\theta =1'=1^{\circ }/60$. Further, both spring stiffness
 $C_K$ and damping coefficient
 $C_D$ have a destabilizing effect on the shear mode as opposed to the result of surface mode. In addition, the imposed shear stress exhibits a destabilizing effect on the wall mode in the high Reynolds number regime.
The present work may have a range of biomedical applications, especially in liquid lining flow in the pulmonary airway occlusion process in figuring out the dynamics of the interfacial wave (Halpern & Grotberg Reference Halpern and Grotberg1993). As the present study deals with two-dimensional disturbance, the investigation of three-dimensional modal and non-modal stability analyses (Malik et al. Reference Malik, Skote and Bouffanais2018) as well as the investigation of nonlinear surface wave dynamics based on the depth averaged method (Ruyer-Quil & Manneville Reference Ruyer-Quil and Manneville2000) will be the possible extensions of the present work and are kept for future consideration.
Acknowledgements
I would like to thank the anonymous referees for their comments and constructive suggestions to improve the manuscript.
Declaration of interests
The author reports no conflict of interest.
Appendix A. Third-order long-wave solutions
 \begin{align}
c_{3s}&=\textrm{i}\left[\left(\frac{6}{5}\cot \theta-\frac{1}{3Ca}-\frac{157}{56}Re-\frac{8}{45}Re \cot^2\theta + \frac{138904}{155925}Re^2\cot\theta
-\frac{1213952}{2027025}Re^3 \right) \right.\nonumber\\
&\quad -Re\left(\frac{211}{126}\tau+\frac{7}{36}\tau^2\right) +Re^2\cot\theta\left(\frac{77173}{151200}\tau+\frac{127}{2268}\tau^2\right) \nonumber\\
&\quad \left. - Re^3 \left(\frac{10508741}{16216200}\tau+\frac{544441}{2494800}\tau^2+\frac{137}{6237}\tau^3\right) \right.\nonumber\\
&\quad \left. +Ma\left\{\left(\frac{5}{3}-\frac{1}{6}\tau-\frac{1}{3} \tau^2\right) + \cot^2\theta\left(\frac{1}{9}+\frac{2}{9}\tau \right) - Re \cot\theta \left(\frac{1039}{2520} -\frac{1}{84}
\tau-\frac{1}{120}\tau ^2\right) \right. \right.\nonumber\\
&\quad \left. \left. + Re^2 \left(\frac{2981}{2520}+\frac{4717}{5040}\tau+\frac{31}{180}\tau ^2\right)\right\}+Ma^2\left\{\cot \theta
\left(\frac{1}{6}+\frac{5}{6}\tau + \frac{1}{2}\tau^2\right) \right. \right.\nonumber\\
&\quad \left. \left. -Re\left(\frac{1}{3}+\frac{1}{60}\tau+\frac{7}{120}\tau^2+\frac{1}{15}\tau^3\right)\right\}+Ma^3\left(\frac{1}{2}\tau+\frac{3}{4}\tau^2+\frac{1}{4}\tau^3\right)+\frac{2}{3}\frac{\tau}{C_K}+\frac{2}{3}\frac{\tau^2}{C_K} \right.\nonumber\\
&\quad \left. +\frac{\cot\theta}{C_K}\left\{\left(\frac{4}{3Ca}-\frac{56}{15}\cot\theta\right)+Re\left(\frac{151}{84}+\frac{827}{630}\tau+\frac{1}{6}\tau^2\right)\right.\right.\nonumber\\
&\quad +MaRe\cot\theta\left(\frac{1039}{1260}-\frac{1}{42}\tau-\frac{1}{60} \tau^2\right) \nonumber\\
&\quad \left.\left. -Re^2\cot\theta \left(\frac{277808}{155925}+\frac{77173}{75600}\tau+\frac{127}{1134}\tau^2\right)\right.\right.\nonumber\\
&\quad \left.\left.-Ma\left(\frac{7}{3}+\frac{1}{3}\tau-\frac{1}{3}\tau^2\right)
-Ma\cot^2\theta\left(\frac{4}{9}+\frac{8}{9}\tau \right) \right.\right.\nonumber\\
&\quad \left. \left. -Ma^2\cot\theta\left(\frac{1}{3}+\frac{5}{3}\tau+\tau^2\right)+\frac{32}{45}Re\cot^2\theta
\right\}+\frac{\cot\theta}{C_K^2}\left\{ \left(\frac{8}{3} \cot^2\theta-\frac{4}{3}\frac{\cot\theta}{Ca}-\frac{8}{3}-\frac{4}{3}\tau
\right) \right. \right.\nonumber\\
&\quad \left. \left. + C_D\left(\frac{8}{3}+\frac{8}{3}\tau+\frac{2}{3}\tau^2+\frac{8}{9}\cot^2\theta\right)\right\}+\frac{\cot^2\theta}{C_K^2}\left\{C_I\left(\frac{16}{3}+\frac{16}{3}\tau+\frac{4}{3}\tau^2\right)+Ma\left(\frac{2}{3}+\frac{4}{3}\tau\right)\right. \right.\nonumber\\
&\quad \left. \left. +Re\left(\frac{176}{35}+\frac{25}{9}\tau+\frac{4}{9}\tau^2\right)-ReC_D\left(\frac{1024}{315}+\frac{757}{315}\tau+\frac{7}{18}\tau^2\right)+MaC_D\left(\frac{2}{3}-\tau -\frac{2}{3}\tau^2\right) \right. \right.\nonumber\\
&\quad \left. \left. +Ma\cot^2\theta\left(\frac{4}{9}+\frac{8}{9}\tau\right) -\frac{32}{45}Re\cot^2\theta-\frac{4}{3}C_T\right\}-\frac{\cot^2\theta}{C_K^3}\left\{\frac{16}{3}-C_D\left(\frac{32}{3}+\frac{16}{3}\tau\right) \right. \right.\nonumber\\
&\quad \left. \left. +C_D^2\left(\frac{16}{3}+\frac{16}{3}\tau+\frac{4}{3}\tau^2\right)+\frac{16}{9}C_D\cot^2\theta
\right\}\right],
\end{align}
 \begin{align} c_{3m}&=\textrm{i}\left[Ma\left(\frac{1}{6}\tau+\frac{1}{3}\tau^2\right)-Ma\cot^2\theta \left(\frac{1}{9}+\frac{2}{9}\tau\right)\right.\nonumber\\ &\quad \left. -MaRe\cot\theta\left(\frac{11}{2520}+\frac{1}{84}\tau+\frac{1}{120}\tau^2\right)\right.\nonumber\\ &\quad \left. + Ma^2Re\left(\frac{1}{60}\tau+\frac{7}{120}\tau^2+\frac{1}{15}\tau^3\right)\right.\nonumber\\ &\left. \quad -Ma^2\cot\theta\left(\frac{1}{6}+\frac{5}{6}\tau+\frac{1}{2}\tau^2\right)-Ma^3\left(\frac{1}{2}\tau+\frac{3}{4}\tau^2+\frac{1}{4}\tau^3\right) \right. \nonumber\\ &\quad \left. +\frac{\cot\theta}{C_K} \left\{Ma\left(\frac{1}{3}+\frac{1}{3}\tau-\frac{1}{3}\tau^2\right)+Ma\cot^2\theta\left(\frac{4}{9}+\frac{8}{9}\tau\right)\right.\right.\nonumber\\ &\quad \left. \left. +MaRe\cot\theta\left(\frac{11}{1260}+\frac{1}{42}\tau+\frac{1}{60}\tau^2\right) \right. \right. \nonumber\\ &\quad \left. \left. +Ma^2\cot\theta \left(\frac{1}{3}+\frac{5}{3}\tau+\tau^2\right)\right\}+\frac{\cot^2\theta}{C_K^2}\left\{MaC_D\left(\frac{1}{3}\!+\!\tau+\frac{2}{3}\tau^2\right)-Ma\left(\frac{2}{3}\!+\!\frac{4}{3}\tau\right) \right. \right. \nonumber\\ &\quad \left. \left. -Ma\cot^2\theta\left(\frac{4}{9}+\frac{8}{9}\tau\right)\right\}\right]. \end{align}
Appendix B. Inertialess stability analysis
Since the current result anticipates the existence of primary instability in the inertialess regime, the Stokes's flow instability analysis is further carried out under the framework of an Orr–Sommerfeld-type boundary value problem when  $Re \to 0$. In fact, under this limiting approximation, the Orr–Sommerfeld-type boundary value problem (4.2)–(4.8) is simplified in the following form:
 \begin{gather} (\partial_{yyyy}\tilde{\psi}-2k^2\partial_{yy}\tilde{\psi}+k^4\tilde{\psi})=0,\quad 0 \le y \le 1, \end{gather}
 \begin{gather} \partial_{yy}\tilde{\psi}+k^2\tilde{\psi}+\tilde{h}\partial_{yy}U+\textrm{i}\,kMa\tilde{\varGamma}=0,\quad \textrm{at}\ y=1, \end{gather}
 \begin{gather} (\partial_{yyy}\tilde{\psi}-3k^2\partial_y\tilde{\psi})-\textrm{i}k\tilde{h}[2\cot\theta-2\textrm{i}k\partial_yU+k^2/Ca]=0,\quad \textrm{at}\ y=1, \end{gather}
 \begin{gather} (U-c)\tilde{\varGamma}+\partial_y\tilde{\psi}+\partial_yU\tilde{h}=0,\quad \textrm{at}\ y=1, \end{gather}
 \begin{gather} (U-c)\tilde{h}+\tilde{\psi}=0,\quad \textrm{at}\ y=1, \end{gather}
 \begin{gather} -C_{I}\textrm{i}k^3c^2\tilde{\eta}+C_Dk^2c \tilde{\eta}+C_B\textrm{i}k^5\tilde{\eta}+C_T\textrm{i}k^3\tilde{\eta}+C_K\textrm{i}k\tilde{\eta}-2\textrm{i}k\cot \theta \tilde{\eta}\nonumber\\ +(\partial_{yyy}\tilde{\psi}-k^2\partial_y\tilde{\psi})=0,\quad \textrm{at}\ y=0, \end{gather}
 \begin{gather} \partial_y\tilde{\psi}+\partial_yU\tilde{\eta} =0,\quad \tilde{\psi}-c\tilde{\eta}=0,\quad \textrm{at}\ y=0. \end{gather}
Now the general solution of (B1) can be expressed as
 \begin{equation} \tilde{\psi}(y)=(F_1+F_2y)\textrm{e}^{ky}+(F_3+F_4y)\textrm{e}^{{-}ky}, \end{equation}
where  $F_1$,
 $F_2$,
 $F_3$ and
 $F_4$ are integration constants. Inserting the solution (B8) in the boundary conditions (B2)–(B7), we obtain a system of linear homogeneous algebraic equations, which is finally recast into a matrix equation form
 \begin{equation} \mathcal{F}\mathcal{X}=0, \end{equation}
where
 $$\begin{gather} \mathcal{F}=\left( \begin{array}{ccccc} 2k^2\textrm{e}^{k} & 2k^2\textrm{e}^{{-}k} & 2k(k+1)\textrm{e}^{k} & 2k(k-1)\textrm{e}^{{-}k} & -2 \\ -2k^3\textrm{e}^{k} & 2k^3\textrm{e}^{{-}k} & -2k^3\textrm{e}^{k} & 2k^3\textrm{e}^{{-}k} & -\textrm{i}k[2\cot\theta+(k^2/Ca)-2\textrm{i}k\tau] \\ k\textrm{e}^k & -k\textrm{e}^{{-}k} & (k+1)\textrm{e}^k & -(k-1)\textrm{e}^{{-}k} & \tau \\ \textrm{e}^k & \textrm{e}^{{-}k} & \textrm{e}^k & \textrm{e}^{{-}k} & (1-c+\tau)\\ 0 & 0 & 2k^2 & 2k^2 & 0 \\ k & -k & 1 & 1 & 0\\ 1 & 1 & 0 & 0 & 0 \end{array}\right. \nonumber\\ \left.\begin{array}{cc} \textrm{i}k(Ma/Ca) & 0\\ 0 & 0 \\ (1-c+\tau) & 0\\ 0 & 0\\ 0 & \textrm{i}k(C_k-\textrm{i}kcC_D-k^2c^2C_I+k^2C_T+k^4C_B-2\cot\theta)\\ 0 & (2+\tau)\\ 0 & -c \end{array}\right), \end{gather}$$
is a  $7 \times 7$ square matrix and
 $\mathcal {X}=(F_1,F_2,F_3,F_4,\tilde {h},\tilde {\varGamma },\tilde {\eta })^\textrm {T}$ is a column matrix.
Hence, for a non-trivial solution of  $\mathcal {X}$, we must have
 \begin{equation} Det[\mathcal{F}]=0, \end{equation}
which leads to the dispersion relation in terms of real wavenumber  $k$ and complex wave speed
 $c$ of the infinitesimal disturbance. Next, the dispersion relation is solved analytically for the complex wave speed
 $c$ by using MATHEMATICA. The results are produced for different values of the Marangoni number and imposed shear stress when
 $C_I=1$,
 $C_K=1$,
 $C_D=1$,
 $C_B=1$,
 $C_T=1$,
 $Ca=1$ and
 $\theta =45^{\circ }$ (Alexander et al. Reference Alexander, Kirk and Papageorgiou2020). Figure 22(a) displays the temporal growth rate generated by the surface mode when the Marangoni number varies. Obviously, the temporal growth rate becomes weaker as soon as the Marangoni number increases. In contrast, the temporal growth rate induced by the surface mode becomes stronger as soon as the imposed shear stress increases (see figure 22b). Hence, the Marangoni number has a stabilizing effect and the imposed shear stress has a destabilizing effect on the inertialess instability generated by the surface mode, as predicted for the flow configuration with inertia. Further, the current results recover the results of Alexander et al. (Reference Alexander, Kirk and Papageorgiou2020) very well when
 $Ma=0$ and
 $\tau =0$.
(a) Variation of temporal growth rate  $kc_i$ with wavenumber
 $k$ for the surface mode when
 $Re=0$ and
 $\tau =0$. Solid, dashed and dotted lines stand for
 $Ma=0$,
 $Ma=0.2$ and
 $Ma=0.4$, respectively. The arrow shows the direction of decreasing temporal growth rate with increasing
 $Ma$. (b) Variation of temporal growth rate
 $kc_i$ with wavenumber
 $k$ for the surface mode when
 $Re=0$ and
 $Ma=0$. Solid, dashed and dotted lines stand for
 $\tau =0$,
 $\tau =0.1$ and
 $\tau =0.2$, respectively. The arrow shows the direction of increasing temporal growth rate with increasing
 $\tau$. The other parameter values are
 $C_I=C_D=C_T=C_K=C_B=1$,
 $Ca=1$ and
 $\theta =45^{\circ }$. Points are the results of Alexander et al. (Reference Alexander, Kirk and Papageorgiou2020). The results are plotted by solving the dispersion relation (B11).


 Open access

