In today's developed world we take effective states—states capable of securing property rights, regulating markets, and resolving legal disputes—for granted. Yet the establishment of effective states—at least in Europe, where the process of modern economic growth first took off —is a recent historical phenomenon. Why were effective states so long in the making?
This review article highlights the role of political innovations. I identify two key political factors that condition the development of effective states. First, the national (i.e., sovereign) government must have the ability to implement a uniform tax system throughout its territory. Second, within the national government itself, there must be a veto player (i.e., parliament) with the ability to regularly monitor the state's budget. States that satisfy these two political conditions are “effective”: They have the extractive capacity to gather enough revenues, and the productive capacity to better channel public funds.Footnote 1 I interpret the evolution of state capacity in Europe from the height of the Old Regime (1650) to the eve of WWI (1913) in light of this conceptual framework. I relate the rise of effective states to long-run economic growth. Next, I argue that the creation of effective states was the institutional foundation upon which twentieth-century welfare states were built. I conclude by drawing historical lessons for political and economic development today. I base this account on my recent research (e.g., Dincecco Reference Dincecco2011).
As a central feature of this article, I review the recent literature on historical state capacity. It is my hope that this article will provide an overview—a selective overview, no doubt—of this literature.
POLITICAL FEATURES OF EFFECTIVE STATES
To understand the historical evolution of state capacity, it is useful to first think in conceptual terms about the basic political conditions that are necessary to establish state effectiveness. I focus on two complementary institutional conditions.
The first condition is that the national government must have the political authority to impose a standard tax system with uniform tax rates throughout its territory. This condition may seem obvious; modern economic theory assumes that governments “naturally” exercise this power. However, the reality is that fiscal fragmentation beguiled monarchs for hundreds of years. Old Regime nation-states were mosaic states erected upon a medley of entrenched local legal and political institutions (Strayer Reference Strayer1970). Stephan R. Epstein (Reference Epstein2000, p. 14) writes: “The strength of a monarch's theoretical claims to absolute rule was frequently inversely proportional to his de facto powers.”
A key feature of the Old Regime fiscal landscape was tax free-riding (Dincecco Reference Dincecco2009, Reference Dincecco2011). There was a close relationship between local control over taxation and political autonomy. Local elites had strong incentives to oppose tax reforms at the national level that would undermine their traditional fiscal and political rights. In this context, monarchs had to bargain place-by-place over individual tax rates. The result was a standard public goods problem in which each local authority wanted to free-ride on the tax contributions of other locales. Thus, national governments could only extract low per capita tax revenues from their populations.
Satisfying the first condition, however, is not enough to establish an effective state. Tax standardization is only one part of the solution. The second condition is that an institutional player within the national government itself must have the political authority to regularly monitor how the executive spends public funds. This condition may too seem obvious to today's political economist. Yet the historical record indicates that it took centuries to firmly establish.
Beyond local tax free-riding, another main feature of the Old Regime fiscal landscape was divided fiscal authority at the national level (Hoffman and Rosenthal Reference Hoffman, Rosenthal, Drobak and Nye1997). National representative bodies—culled from certain provinces and social groups, and called to order at the monarch's request—had control over tax policy, but monarchs had control over spending. Parliamentary elites did not trust monarchs to spend public funds in line with their preferences. They called for institutional reforms that would grant them budgetary oversight (North and Weingast Reference North and Weingast1989). To evade parliament, monarchs used fiscal predation including forced loans, the sale of state lands, monopolies, and offices, and the seizure of private goods.
The problem of royal moral hazard in warfare aggravated this fundamental tension between monarchs and parliaments (Cox Reference Cox2011). Monarchs saw definite upsides from military victory, such as personal glory, but few downsides from defeat (Hoffman Reference Hoffman2012). Loss in battle did not typically cause monarchs to lose their thrones before 1800, when Napoleon began to replace rulers that had been defeated. Parliamentary elites, by contrast, had to bear new tax burdens related to the monarch's military adventures. Thus, they were even less inclined to support executive tax requests. Royal moral hazard helps explain why monarchs were nearly always in battle; wars involving major powers were underway in 78 to 95 percent of all years between 1500 and 1800 (Tilly Reference Tilly1992).
Moving forward, I will focus on two “equilibria” that characterize the historical evolution of state capacity. The first, which I will call the “Old Regime” equilibrium, occurs when neither political condition is met. The institutional features that define this equilibrium are fiscal fragmentation and absolutist spending control. The second, which I will call the “effective state” equilibrium, occurs when both political conditions are met. In contrast to the “Old Regime” equilibrium, the institutional features that define this equilibrium are fiscal centralization and spending oversight by parliament.
THE RISE OF EFFECTIVE STATES
Fiscal strength forms the sinews of state power (Brewer Reference Brewer1989). Joseph Schumpeter (Reference Schumpeter, Peacock, Stopler, Turvey and Henderson1918, p. 6) writes: “The fiscal history of a people is above all an essential part of its general history.” My recent research (Dincecco Reference Dincecco2011; Dincecco, Federico, and Vindigni Reference Dincecco2011) gathers new data on per capita national government revenues for 11 historical polities: Austria, Belgium, Denmark, France, England, the Dutch Republic/Netherlands, Piedmont, Portugal, Prussia, Spain, and Sweden. This database integrates time series from a large number of sources, including Richard Bonney (Reference Bonney1995, Reference Bonney1999), Brian Mitchell (Reference Mitchell2003), and many others. To facilitate cross-polity comparisons, I convert all national currency units into gold grams. The result is an unbalanced panel of 1,773 annual revenue observations between 1650 and 1913.
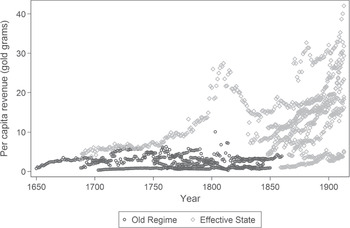
Figure 1 shows per capita revenues for each observation under two state capacity equilibria: the Old Regime, characterized by fiscal fragmentation and absolutist spending control, and the effective state, characterized by fiscal centralization and spending oversight by parliament. This figure provides a synopsis of the historical evolution of state capacity in Europe. There are two patterns that distinguish state capacity under the Old Regime versus effective states. First, the Old Regime equilibrium is more common before 1800 than after. This equilibrium disappears by the 1850s, when effective states become widespread throughout Europe. Second, per capita revenues are notably higher under the effective state equilibrium. They average 13.23 gold grams per capita under this equilibrium versus 2.43 gold grams per capita under the Old Regime equilibrium. Both patterns are consistent with my conceptual framework.
HISTORICAL EVOLUTION OF STATE CAPACITY IN EUROPE

For simplicity, I focus on the start and endpoints of this historical process. Yet most polities followed a particular sequence of political innovations consistent with my conceptual framework. The first political condition, fiscal centralization, was typically satisfied from the French Revolution (1789–1799) onward. French military conquests were an important catalyst for this institutional change (Acemoglu et al. Reference Acemoglu, Cantoni and Johnson2011; O'Brien Reference O'Brien2011). The second condition, fiscal supremacy by parliament, was typically satisfied over the nineteenth century, decades after fiscal centralization. The historical record indicates that the overall process of state development was long and arduous (O'Brien Reference O'Brien2011).
One exception to this timing is England, which was precocious (Brewer Reference Brewer1989; Epstein, Reference Epstein2000; O'Brien Reference O'Brien2011). By the start of the eighteenth century, England had established an effective state. The sole pre-1830 time series in grey diamonds in Figure 1 corresponds with the English case. Consistent with my conceptual framework, per capita revenues under the effective state in England are typically higher than under its Old Regime counterparts. Prior to 1800, English revenues average 7.92 gold grams per capita versus 2.55 gold grams per capita for the Old Regime states.
Alternative Views
The establishment of effective states was a centuries-long process. As K. Kivanc Karaman and Şevket Pamuk (Reference Karaman and Pamuk2013), Noel Johnson (Reference Johnson2006), and Johnson and Mark Koyama (Reference Johnson and Koyama2014) show, fiscal change did in fact occur under the Old Regime. Yet the magnitudes of early fiscal improvements are relatively small. For example, Finance Minister Jean-Baptiste Colbert made well-known reforms in 1660s France (Johnson Reference Johnson2006). French revenues grew from 1.37 gold grams per capita over 1650–1659 to 2.93 gold grams per capita over 1660–1699 (Dincecco Reference Dincecco2011). By comparison, French revenues average 11.14 gold grams per capita over 1815–1849 following the fiscal reforms of the French Revolution and Napoleon, for an increase of 380 percent relative to 1660–1699 (Dincecco Reference Dincecco2011). The establishment of effective states—a process not completed until the nineteenth century—was associated with a dramatic increase in the state's capacity to tax relative to any reforms undertaken during the Old Regime.
The Glorious Revolution of 1688 in England is the archetypal example of parliamentary reform. Douglass North and Barry Weingast (Reference North and Weingast1989) claim that the establishment of fiscal supremacy by parliament was the defining feature of this institutional change. There is debate about the relationship between parliamentary reform à la North and Weingast and fiscal development. One set of scholars argues that de jure parliamentary reform is not sufficient to generate fiscal improvements. David Stasavage (Reference Stasavage2003) highlights the importance of political coalitions with the ability—and will—to monitor executive policy. He shows that interest rates on post-Revolution sovereign debt only fell when the pro-creditor Whig party held the majority in parliament. Gary Cox (Reference Cox2011) emphasizes parliament's newfound capacity after 1688 to hold cabinet ministers accountable for executive decisions. He argues that this capacity resolved the problem of royal moral hazard in warfare by making the English monarchy bear the true costs of military outcomes. Steven Pincus and James Robinson (Reference Pincus and Robinson2010) focus on de facto rather than de jure institutional reforms. They claim that the post-Revolution political equilibrium empowered Whig politicians who favored a policy agenda conducive to manufacturing sector growth. Still, this set of scholars agrees that the Glorious Revolution was a significant historical event. By contrast, Patrick O'Brien (Reference O'Brien2011) argues that the true source of England's fiscal success was the political consensus struck by elites to promote order and stability during the 1640s. Karaman and Pamuk (Reference Karaman and Pamuk2013) claim that the relationship between parliamentary reform and fiscal strength depends on a pre-condition: elites must be willing to trade higher tax burdens for fiscal control in the first place. They find that parliamentary bargains were more likely in commercial-oriented urban societies (e.g., the Dutch Republic). Oscar Gelderblom and Joost Jonker (Reference Gelderblom and Jonker2011) make the point that, even if parliamentary reform enables the monarch to make a credible commitment to repay sovereign debts, financial growth will still not occur unless investors (1) have enough in savings and (2) an incentive to invest in government debt over private alternatives. They use the Dutch Republic to illustrate their case. Christiaan van Bochove (Reference van Bochove2014) argues that a sovereign government (in this case, eighteenth-century Denmark) may rely on non-institutional mechanisms including reputation to sustain international borrowing.
Another set of scholars claims that parliamentary reform does not necessarily improve financial outcomes. Stephen Quinn (Reference Quinn2001) argues that greater government borrowing in the aftermath of the Glorious Revolution discouraged private investment. He draws on evidence from the lending portfolio of a leading London banker. Nathan Sussman and Yishay Yafeh (Reference Sussman and Yafeh2006) show that British sovereign credit risk was high for several decades after the Glorious Revolution. They conclude that any relationship between parliamentary reform and financial development in Britain was at best a long-run phenomenon. Still, post-Revolution Britain was able to gather far more in revenues per capita and accumulate much greater sovereign debt than its rivals (O'Brien Reference O'Brien2011). Stasavage (Reference Stasavage2011) tests the relationship between polity type and long-term public debt in Europe from the mid-1200s to the late 1700s. He finds that city-states began to issue public debt (1) before territorial states and (2) at lower interest rates. Stasavage attributes this advantage to the ability of representative governments in city-states to monitor public finances, where the success of political representation itself was dependent on compact geography, which promoted the regular monitoring of representatives by constituents, and the merchant dominance of local assemblies, who bought public debt and wished to see it repaid.
A third group of scholars claims that the focus on institutional reforms overlooks other important features of state formation. Avner Greif and Murat Iyigun (Reference Greif and Iyigun2013) emphasize the role of local social safety nets, which can reduce violence and promote risk-taking. They show that English counties that provided more poor relief saw greater political stability and technological innovations from the late 1600s to the early 1800s. Gregory Clark (Reference Clark1996) argues that there were secure property rights in England by 1600. He finds no effect of the Glorious Revolution on rates of return on capital or land prices. However, Dan Bogart and Gary Richardson (Reference Bogart and Richardson2011) show a significant increase in parliamentary acts that established new property rights (e.g., to create turnpike trusts) during the eighteenth century, which they attribute to Revolution-era legislative improvements. Similarly, Bogart (Reference Bogart2011) argues that regulatory reforms following the Glorious Revolution had important consequences for transportation investments. He finds that mean annual investment in English roads and rivers from 1689 to 1749 was nearly four times the amount from 1660 to 1688.
Taken together, this evidence highlights the potential for interplay between the two political conditions that I focus on—namely, fiscal centralization and spending oversight by parliament—and other institutional and non-institutional factors in the process of state development in European history.
Economic Growth
The Industrial Revolution took place in England between 1750 and 1830 and throughout Europe from 1870 to 1913. It is possible that fiscal success was the result of economic development.
A comparison of fiscal and economic growth rates, however, raises doubt about this possibility. In England, real tax receipt receipts grew 15-fold between 1688 and 1815, but real gross domestic product (GDP) only grew three-fold (O'Brien Reference O'Brien2011). In France, England's great rival, per capita tax revenues increased 33 times between 1650–1699 and 1850–1899, but per capita GDP increased by just two times (Dincecco and Katz Reference Dincecco and Katz2015). State capacity improvements were not simply a by-product of economic growth.
On the contrary, the historical evidence indicates that state effectiveness—or lack thereof—had a major influence on long-run economic outcomes. O'Brien (Reference O'Brien2011) claims that England's early establishment of a state capable of providing domestic property rights protection and external security was an important reason why it became the first industrial nation. He argues that state strength promoted private investment and international trade. Over the long run, gains from trade drove up wages and created the demand for labor-saving technological change à la Robert Allen (Reference Allen2009). Mauricio Drelichman and Hans-Joachim Voth (Reference Gennaioli and Voth2014) describe the flip side of the coin. They claim that the inability of the Spanish monarchy to overcome domestic fragmentation was responsible for the decline of its empire over the 1600s. Drelichman and Voth argue that silver revenues from the Americas were largely to blame. This windfall reduced the Spanish monarchy's incentive to strike a Glorious Revolution-style political bargain that would exchange higher taxation for spending oversight by parliament. Regina Grafe (Reference Grafe2012) links institutional fragmentation in Spain with poor market integration over the eighteenth century. She argues that (1) local elites enacted trade barriers that, along with poor transport networks, reduced market competition and (2) the Spanish monarchy was still too weak to make institutional reforms that would overcome trade-related coordination failures. To test this argument, Grafe gathers city-level price data on bacalao, a historical staple of the Spanish diet.
Jan Luiten van Zanden and Arthur van Riel (Reference van Zanden and van Riel2004) claim that institutional fragmentation explains the fall of the Dutch Republic. They show that Holland—the Republic's most prominent province—took on ever-increasing military costs and public debts over the 1700s. Due to the problem of tax free-riding, there was resistance by elites in other provinces to shoulder more equal tax burdens. van Zanden and van Riel argue that this fiscal stalemate reduced the Republic's capacity for self-defense, culminating in French conquest in 1795. Jean-Laurent Rosenthal (Reference Rosenthal1992) claims that state-strengthening reforms (e.g., centralized authority over eminent domain) made during the French Revolution improved agricultural productivity in France. Even though the economic loss from fragmented institutions was well-known under the Old Regime, the costs of reform were too high for local elites and the monarchy. Rosenthal argues that the French Revolution gave the National Assembly a mandate to impose—for the first time in French history—a uniform legal regime throughout France. Daron Acemoglu, Davide Cantoni, Simon Johnson et al. (Reference Acemoglu, Cantoni and Johnson2011) relate revolutionary reforms (e.g., guild abolition) made by France in the parts of Germany that it invaded between 1792 and 1815 with economic growth. They use the length of French occupation to instrument for the economic effect of revolutionary reforms.
Acemoglu, Johnson, and Robinson (Reference Acemoglu2005) emphasize the interaction between state institutions and Atlantic trade after 1500. They argue that, in countries with “non-absolutist” initial political institutions (e.g., England), this trade strengthened merchant interests and fostered parliamentary reform that secured property rights and promoted investment. In countries with “absolutist” initial institutions (e.g., Spain), however, Atlantic trade reinforced the strength of the monarchy. Dincecco and Gabriel Katz (Reference Dincecco and Katz2015) document a positive relationship between state capacity improvements and economic growth in Europe from the mid-1600s to the early 1900s. They estimate that state capacity differences account for roughly one-half of the difference in annual per capita GDP growth rates between eighteenth-century England and France.
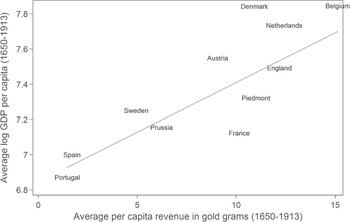
Figure 2 summarizes the relationship between state capacity and economic performance in European history. There is a strongly positive correlation between the state's ability to tax and GDP per capita.
STATE CAPACITY AND ECONOMIC PERFORMANCE IN EUROPEAN HISTORY

Beyond Europe
Recent research about state development in regions outside of Europe indicates both parallels and contrasts with the European experience (e.g., Yun-Casalilla, O'Brien, and Comín Comín Reference Yun-Casalilla, O'Brien and Comín-Comín2012). Karaman and Pamuk (Reference Karaman and Pamuk2010) show that, after two centuries of stagnation, Ottoman revenues grew more than 15 times from 1780 to 1913 as the state made centralizing reforms. Rosenthal and R. Bin Wong (Reference Rosenthal and Wong2011) argue that, unlike in Europe, the state in China was able to deliver political stability and public goods (e.g., grain storage). This political model was well-suited for trade-related pre-industrial economic activity. By contrast, Rosenthal and Wong claim that political fragmentation and warfare in Europe was destructive, but had positive long-run consequences for military, fiscal, and political innovations. Thus, Europe was better poised for industrialization after 1850. Debin Ma (Reference Ma2011) argues that incentive and information problems within the traditional Chinese state prevented greater fiscal development. Tuan-Hwee Sng and Chiaki Moriguchi (Reference Sng and Moriguchi2014) claim that China's large size made it difficult to manage its state bureaucracy. They estimate that the tax-to-GDP ratio in sprawling China was 2 percent between 1650 and 1850, while in compact Japan it was greater than 15 percent. Sng and Moriguchi relate the fiscal and economic success of Meiji Japan (1868–1912) to the state strength of its feudal predecessor, the Tokugawa shogunate (1600–1868). John Ferejohn and Frances Rosenbluth (Reference Ferejohn and Rosenbluth2010), meanwhile, study the relationship between warfare and state development in medieval Japan. They argue that vulnerable lowlands farmers were willing to pay taxes to local warlords in exchange for security. As fear of violence became widespread, this willingness grew, enabling successful warlords to afford larger armies. The final result of this process was state consolidation throughout Japan by 1600 (i.e., the Tokugawa shogunate). Philip Hoffman (Reference Hoffman2012) highlights the winner-take-all nature of military competition in Europe. He argues that there were two key features of this competition: (1) rulers enjoyed a great deal of the spoils from military victory, but avoided paying a full share of war costs, and (2) the goods that rulers valued—glory, reputation, and trade monopoly—could only be won through fighting. Hoffman claims that military competition promoted fiscal and technological developments (e.g., gunpowder weapons) which enabled European states to conquer large swaths of Eurasia over the eighteenth century.
Moving to the southern hemisphere, Luz Marina Arias (Reference Arias2013) argues that new external military threats gave elites in eighteenth-century Mexico the incentive to overcome local tax free-riding. She claims that, to increase state capacity, the Spanish monarchy made a fiscal deal with corporate elites (e.g., guild leaders, clergyman) who derived rents from the traditional economic system. Thus, in contrast to seventeenth-century England, a parliamentary bargain did not accompany fiscal development in Mexico. Miguel Centeno (Reference Centeno1997) argues that the logic of “war makes states” (Tilly, Reference Tilly1992) does not apply to nineteenth-century South America. To have war-related state development, pre-conditions—namely, the need to rely on internal taxation, a minimum amount of administrative infrastructure, and support from local elites—must be satisfied. Centeno claims that such conditions were unique to Europe. Jeffrey Herbst (Reference Herbst2000) argues that a dearth of military competition, along with low population density, explain why historical state development did not occur in Africa as in Europe. Study of the rise of state capacity in world regions beyond Europe remains an important area for future research (Hoffman Reference Hoffman2015).
THE FOUNDATIONS OF WELFARE STATES
The sequencing of political reforms in European history indicates that institutional centralization by national governments was an important precursor to the establishment of fiscal supremacy by parliaments within national governments themselves. Effective states—states with high extractive and productive powers—were established throughout Europe over the nineteenth century. I claim that effective states in turn created the institutional foundation upon which twentieth-century welfare states were erected. Samuel Huntington (Reference Huntington1968, p. 8) writes: “Authority has to exist before it can be limited.” Similarly, effective state infrastructure was a precursor to the new welfare roles that European states played after WWII.
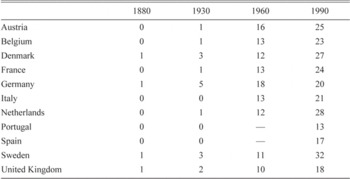
The historical evidence supports this view. Table 1 shows social transfers (welfare, unemployment, pension, health, housing) by national governments as a share of GDP for a set of European countries for four benchmark years from 1880 to 1990. Social transfers are very low or non-existent through 1930: they average less than 2 percent among sample countries. After WWII, social transfers skyrocket, averaging 13 percent in 1960. By 1990, social transfers average more than 22 percent. Peter Lindert (Reference Lindert2004) argues that the extension of political representation to ever-broader parts of society is the main explanation for the rise of twentieth-century welfare states.Footnote 2 This argument is consistent with my claim, because the origins of modern democracy lay in the establishment of nineteenth-century national parliaments (which, in turn, were built on the establishment of centralized state institutions).
SOCIAL TRANSFERS, 1880–1990 (PERCENT)

Note:
Social transfers (welfare, unemployment, pension, health, housing subsidy) by national government as share of GDP.
Source:
Lindert (Reference Lindert2004).
There are at least two possible challenges to my claim about the institutional roots of welfare states. The case studies in José Luís Cardoso and Pedro Lains (Reference Cardoso and Lains2010) show that national governments in Europe began to play greater social and economic roles over the nineteenth century. Still, liberal policies typically took shape only after effective states had first been established (or, at least after tax standardization had taken place, and the process of establishing a stable parliamentary regime was underway). Furthermore, social spending by nineteenth-century national governments was very low relative to the post-1945 era (Lindert Reference Lindert2004).
The focus on national governments also overlooks early public goods provision by local authorities. Timothy Guinnane and Jochen Streb (Reference Guinnane and Streb2011) highlight the role of the Knappschaften, the local organizations through which nineteenth-century miners in Germany could insure themselves against work- and age-related risks. They argue that the Knappschaft regime forms the basis of Germany's modern sickness and accident insurance system. Lionel Kesztenbaum and Rosenthal (Reference Kesztenbaum and Rosenthal2014) link improvements in water infrastructure with greater life expectancy in nineteenth-century Paris. They use mortality data for each of the city's 80 quartiers from 1880 to 1913. Jonathan Chapman (Reference Chapman2014) finds an inverted U-shaped relationship between franchise extension and sanitation infrastructure across municipal boroughs in nineteenth-century England. He argues that franchise extension to the poor actually reduced public goods provision, because the poor preferred to spend their incomes on better food and housing. Steven Nafziger (Reference Nafziger2011) shows that greater representation of the peasantry in the zemstvo, a local institution of self-government in nineteenth-century Russia, was linked to higher spending on primary education. The historical political economy of local public goods provision remains an exciting area for future work.
HISTORICAL LESSONS FOR DEVELOPMENT
Effective states cannot be taken for granted. The rise of effective states—and subsequently, welfare states—in Europe was the outcome of a long and difficult political process. Indeed, for many of today's developing nations, this process is not yet complete (e.g., Herbst Reference Herbst2000).
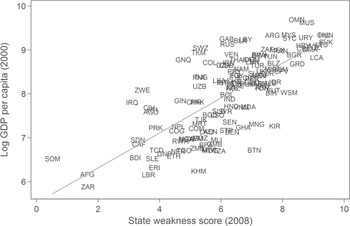
Figure 3 plots state weakness (on a 0–10 scale, where 10 represents the least weak) against log GDP per capita for a sample of the world's 137 weakest states today. There is a strongly positive correlation between state power and economic growth. Log GDP per capita for the most capable states in the sample, Hungary and the Slovak Republic, is 1.42 times greater than for the weakest state, Somalia. Strikingly, the relationship between taxation and development for today's emerging nations resembles the historical relationship for European nations that are now wealthy (Figure 2). Capable states appear to promote economic growth in the past and the present.
What lessons, then, does the European historical experience offer for economic development today?
First, the European experience highlights the importance of political reforms that promote both state strength and efficiency. The Guatemalan government collects revenues equivalent to less than 10 percent of GDP. Police, prosecutors, and court officials are under-funded; Guatemala has one of the world's highest murder rates (Economist 2006). National governments must have the political and administrative capacity to raise enough in revenues to provide basic public services for security and justice. At the same time, citizens must have a voice in the political process by which fiscal decisions are made. Timothy Besley and Torsten Persson (2013) show that, holding GDP per capita constant, states with strong executive constraints gather higher tax revenues than states with weak executive constraints. They argue that “taxation with representation” helps create the basis for a strong fiscal regime. This view calls to mind the parliamentary bargain that enabled historical polities in Europe to solve the problem of royal moral hazard in warfare.
STATE CAPACITY AND ECONOMIC PERFORMANCE IN THE DEVELOPING WORLD

Second, the European experience highlights the role of geopolitical competition and conquest. Political groups (e.g., local elites) will oppose institutional reforms—even ones that will improve social welfare—if they risk losing political and economic rents. Thus, incumbent elites must have—or be forced to have—incentives to support political reforms that may harm their interests. In European history, external (and internal) survival threats gave incumbents a reason to make political changes. Military conquests by the French Republic and Napoleon led to swift and radical institutional reforms throughout Europe. Dincecco, Giovanni Federico, and Andrea Vindigni (Reference Dincecco, Federico and Vindigni2011) argue that, to facilitate state expansion, King Vittorio Emanuele II of Piedmont upheld a parliamentary bargain in 1848 that gave political representation to merchants. They relate this political change to Piedmont's subsequent fiscal and military success in Italy. Nicola Gennaioli and Voth (Reference Gennaioli and Voth2014) find a positive relationship between the intensity of military conflict and state capacity in pre-industrial Europe. Fast-forwarding to the present, Robert Bates (Reference Bates2009) claims that a lack of external threats, along with generous foreign aid, has reduced the need for rulers in Africa to make political bargains with citizens and establish inclusive political institutions.
Finally, European history reveals the importance of chance and contingency in institutional change. It is true that certain institutional outcomes are more likely to obtain in certain political and economic environments rather than others. Yet structural change still requires the coming together of several contingent events. The Glorious Revolution of 1688 in England illustrates the role of chance and contingency. Previous attempts at revolution, including the rebellion of 1685 led by the Duke of Monmouth, failed. Lasting constitutional reform in England could have taken place on a number of occasions from 1640 to 1700, or not at all (Hoppit Reference Hoppit2000; Pincus Reference Pincus2009). Similar arguments for chance and contingency can be made for the French Revolution of 1789, the revolutionary wave of 1848, and other critical junctures in history (Acemoglu and Robinson Reference Acemoglu and Robinson2012). Agents of institutional change in today's developing nations must seek to act while the iron is hot.