INTRODUCTION
Salinity is a serious yield-limiting problem in arid and semi-arid regions (Arzani and Ashraf, Reference Arzani and Ashraf2016). For instance, Iran has an estimated salt affected land area of about 34 million ha that includes 4.1 million ha of irrigated land (FAO, 2000). Shortages of good quality water and population growth warrant provisions to extend agricultural production to marginal regions that contain saline water and soils (Arzani and Ashraf, Reference Arzani and Ashraf2016). Salinity causes a number of deleterious effects on plant growth and productivity such as water deficit due to low osmotic potential of soil solution and Na+ and Cl− specific ion toxicity, which disturbs metabolic function, cell membrane integrity and plant nutrition (Arzani, Reference Arzani2008; Arzani and Ashraf, Reference Arzani and Ashraf2016; Mansour, Reference Mansour2014; Negrao et al., Reference Negrao, Schmockel and Tester2017). A major target in most breeding projects is enhancing yield performance of crop plants grown in saline-affected areas (Arzani and Ashraf, Reference Arzani and Ashraf2016). Being a moderately salinity-tolerant crop species, melon (Cucumis melo L.) can be potentially cultivated in saline fields with variable yield penalties depending on genotype and severity of salinity stress (Botia et al., Reference Botia, Navarro, Cerda and Martinez2005; Huang et al., Reference Huang, Zong, Buonanno, Xue, Wang and Tedeschi2012; Tedeschi et al., Reference Tedeschi, Lavini, Riccardi, Pulvento and Andria2011).
A number of reasons have been claimed for fruit yield losses due to salinity stress in melon; these include, but are not restricted to, decreases in plant water status, leaf Na+ accumulation and dramatic reductions in K+/Na+ ratio (Tedeschi et al., Reference Tedeschi, Zong, Huang, Vitale, Volpe and Xue2017). There is genotypic variation in salt tolerance of melon and irrigation with saline water decreased significantly both number of fruits and marketable yield while improving fruit quality (Botia et al., Reference Botia, Navarro, Cerda and Martinez2005). Under field conditions, the number of fruit per plant and the fruit weight were found to be the major fruit yield components affected by salinity stress (Huang et al., Reference Huang, Zong, Buonanno, Xue, Wang and Tedeschi2012; Tedeschi et al., Reference Tedeschi, Lavini, Riccardi, Pulvento and Andria2011). In addition, the maintenance of K+ selectivity has been considered as a strategy for enhancing salinity tolerance and improving fruit quality in terms of total soluble solids (Tedeschi et al., Reference Tedeschi, Lavini, Riccardi, Pulvento and Andria2011).
The present knowledge on the responses of melon cultivars to salinity stress under field condition is scant. Most field studies have concentrated on limited melon genotypes (Botia et al., Reference Botia, Navarro, Cerda and Martinez2005; Del Amor et al., Reference Del Amor, Martinez and Cerda1999; Franco et al., Reference Franco, Esteban and Rodriguez1993; Huang et al., Reference Huang, Zong, Buonanno, Xue, Wang and Tedeschi2012; Tedeschi et al., Reference Tedeschi, Lavini, Riccardi, Pulvento and Andria2011, Reference Tedeschi, Zong, Huang, Vitale, Volpe and Xue2017; Zong et al., Reference Zong, Tedeschi, Xue, Wang, Menenti and Huang2011). Plant genetic resources, particularly in their center of genetic diversity, endow invaluable means for exploring the adaptive elements of abiotic stress tolerance (Arzani and Ashraf, Reference Arzani and Ashraf2016). However, a comprehensive research dealing with the responses of a diverse melon germplasm to salt stress and evaluating the effects of genotype (G), salinity (E) and G × E interaction is missing. Therefore, the objective of this study was to evaluate salt tolerance in melon cultivars, taking into account leaf ion contents, morpho-phenological characteristics and fruit yield and quality.
MATERIALS AND METHODS
Plant materials and growth conditions
Seventeen melon (Cucumis melo L.) cultivars were used in this study: ‘Rishbaba-1’; ‘Rishbaba-2’; ‘Shahabadi-1’; ‘Shahabadi-2’; ‘Magasi’; ‘Till-Toroq’; ‘Savehie’; ‘Sabouni’; ‘Samsouri’; ‘Lacki’; ‘Dastjerdi’; ‘Gargar-1’; ‘Gargar-2’; ‘Majidi-Abarkooh’; ‘Majidi’; ‘Garmak’; and ‘Galia’. They comprised one exotic (Galia) and 16 Iranian cultivars indigenous to seven provinces (Supplementary Table S1). ‘Galia’ was used as an international melon cultivar due to a number of studies regarding salinity stress (Botia et al., Reference Botia, Navarro, Cerda and Martinez2005; Mendlinger and Fossen, Reference Mendlinger and Fossen1993). One of the cultivars, locally named ‘Gargar’, had been previously considered as a drought- and heat-tolerant cultivar, with a long, thick root system that penetrates deep into the soil (Moradmand et al., Reference Moradmand, Arzani and Saeidi2011).
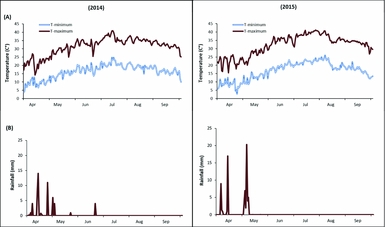
Field experiments were carried out in two growing seasons from 21 April to 2 August 2014 and from 1 May to 15 August 2015 at the Lavark Research Station, Isfahan, Iran (40 km southwest of Isfahan, 32°32′N, 51°23′E, 1630 m a.s.l.). Mean annual precipitation and mean annual temperature were 140 mm and 14.5 °C, respectively. Moreover, the minimum and maximum daily air temperatures and rainfall for each growing season 2014 and 2015 are given in Figure 1. The soil has a silty clay loam texture and is a typical Haplargids of the arid tropic with pH 7.3–7.8 and electrical conductivity of saturated-soil extracts (ECe) ranging between 1.2 and 1.4 dS m−1.
The minimum and maximum (T-minimum and T-maximum) of daliy air temperatures (A) and rainfall (B) during two consecutive growing season 2014 and 2015.

Each plot contained 6 m in length and 3 m in width and within-row and between-row plant spacings were 0.5 m and 1.5 m, respectively (24 plants per plot). The seeds were sown directly on the top of furrows (rills) and irrigated through a furrow irrigation system. In the saline conditions, fresh water was applied until 3 weeks after emergence and then plants were irrigated with saline water (ECw = 14 dS m−1) until harvest. Volumes of irrigation water used were monitored using flow meters. The same water quantity (each irrigation volume 230 m3 ha−1) was applied for each experiment (non-saline and saline). The saline condition received six irrigations, using dissolved sodium chloride (1 M NaCl) from NaCl supply tank (4000 L) that was flowed into the irrigation water to maintain the desired ECw (14 dS m−1) using calibrated flow meters. The soil ECe was measured in soil samples (one sample from each plot) at the planting, flowering and maturity dates and was 1.3 ± 0.1, 4.9 ± 0.1 and 8.6 ± 0.2 dS m−1 in 2014 and 1.4 ± 0.1, 5.3 ± 0.2 and 8.8 ± 0.2 dS m−1 in 2015 under saline conditions, respectively. A randomized complete block design with three replications was used for each of the experimental conditions (non-saline and saline) in each growing season.
Agro-phenological and fruit quality traits
Number of days to anthesis (DA) and number of days to maturity (DMA) were recorded as the days from planting to the 50% flowering and harvest, respectively. Primary lateral branches per plant (NPLB) were counted 35 days after planting, considering all branches with length below the fourth node higher than 12.5 cm. The average distance of fruit formation from the crown (FCL) was measured. Harvested melon fruits per plant (NF) were counted and average fruit weight (FWT) was calculated by dividing the total number of fruits per plant by the total fruit weight per plant. Finally, fruit yield (FY) of each cultivar was calculated in each experimental condition. Average fruit length (FLe) and width (FWi) were evaluated as well as fruit seed cavity length (SCL) and width (SCW). Moreover, average fruit pulp (PuT) and peel (PeT) thicknesses were determined through radial cross sections of fruits and total fruit soluble solid content (TSS) was measured with a portable refractometer (Model K-0032, Cosmo, Tokyo, Japan) and expressed as °Brix.
Leaf ion concentrations
Leaf samples (0.2 g) of melon cultivars, sampled at fruit development stage, were oven-dried at 550 °C for 3 h and inorganic ions were then extracted using 10 mL of hot HCl (2 N) and filtered before dilution to 100 mL with distilled water. Na+, K+ and Ca2+ concentrations were measured using flame photometry (PFP7, Jenway, Stone, UK) and calculated (mg g DW−1) using a standard curve.
Statistical analysis
The data were tested for normality of residual and homogeneity of variances using Kolmogorov–Smirnov and Bartlett's tests before being subjected to the analysis of variance (ANOVA). A combined ANOVA was used for analyzing the data collected from non-saline and saline conditions and two growing seasons using PROC GLM of Statistical Analysis System (SAS) version 9.3. Mean comparisons were carried out using Fisher's (protected) least significant difference (LSD0.05) test. In addition, variance components were estimated using the expected mean squares in the ANOVA Table and used to calculate phenotypic and genotypic coefficient of variation (PCV and GCV) and broad-sense heritability (H2) of traits (Johnson et al., Reference Johnson, Robinson and Comstock1955).
Principal component analysis (PCA) was performed using PROC FACTOR (method = prin) based on the Kaiser's criterion (Eigenvalue > 1.0), in SAS 9.3. The Stat Graphics software (Statpoint Technologies, Warrington VA, USA) was used to draw the biplot with the first two components (PC1 and PC2), in which cultivars are represented by points and traits by vectors from the origin. Linear regression analyses were carried out for studying the correlation between fruit yield under saline and non-saline conditions and fruit yield vs. leaf Na+. A stepwise multiple regression analysis was also conducted to determine the most important traits in explaining fruit yield and the best predictors of fruit yield of melon cultivars under saline conditions. All the regression analyses were carried out using PROC REG of SAS 9.3.
RESULTS
The results of combined ANOVA showed a highly significant effect (P < 0.01) of salinity stress (environment) on all the traits except for DA and PeT (Supplementary Table S2). The analyses also revealed that the melon cultivars were significantly (P < 0.01) different with respect to all studied traits. A significant salinity × genotype interaction was observed for all traits, with exception of SCL, PuT and PeT. However, the effects of year and interactions with year (i.e., environment × year, genotype × year and genotype × environment × year) were not statistically significant for most of the studied traits, with the exception of genotype × environment × year that was significant for leaf ion concentrations (Table S2). Therefore, the data averaged over two growing seasons were used for mean comparisons for the traits with non-significant interactions.
Phenotypic coefficient of variation (PCV) ranged from 6.4% for DMA to 35.4% for FWT at non-saline conditions and from 8.1% for DMA to 33.9% for K+/Na+ ratio under saline conditions. Genetic coefficient of variation (GCV) ranged from 6.3% for DMA to 34.1% for FWT at non-saline conditions and from 5.1% for NPLB to 32.6% for K+/Na+ ratio under saline conditions (Table 1). The broad-sense heritability estimates obtained in the current study ranged from 58% for NPLB to 98% for TSS under non-saline conditions and from 35% for NPLB to 99% TSS under saline conditions (Table 1). The estimates of heritability were highest for TSS (H2 > 98%), while they were lowest for FY (H2 = 78 and 74% under non-saline and saline conditions, respectively).
Average number of primary lateral branch (NPLB), days to anthesis (DA), days to maturity (DMA), fruit crown length (FCL, cm), fruit weight (FWT, kg), number of fruit per plant (NF), fruit yield (FY, Mg ha−1), fruit length (FLe, cm), fruit width (FWi, cm), seed cavity length (SCL, cm), seed cavity width (SCW, cm), pulp thickness (PuT, cm), peel thickness (PeT, mm), total soluble solids (TSS, °Brix), leaf Na+, K+ and Ca2+ concentrations (mg g DW−1), phenotypic coefficient of variation (PCV), genotypic coefficient of variation (GCV) and broad-sense heritability (H2) in melon species grown under non-saline and saline conditions for two seasons (2014 and 2015).

* Means followed by the same letters in each row are not significantly different using LSD0.05 test.
Agronomic and phenological traits
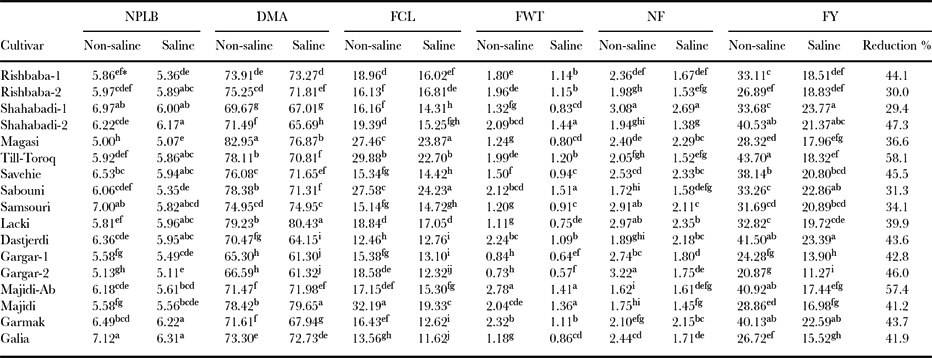
Plant architecture was altered due to saline conditions, with reduction of NPLB and FCL (Table 1). In this regard, ‘Galia’ and ‘Garmak’ were less affected by saline conditions when considering NPLB. Among the cultivars, ‘Galia’ and ‘Gargar-2’ under saline conditions and ‘Dastjerdi’ under non-saline conditions produced the fruits nearest to the crown (Table 2). Time to anthesis (given by DA) of melon cultivars was not affected by salinity (Table S2). However, salinity accelerated maturity (about 3 days, on average) when compared with non-saline conditions (Table 1). The cultivars ‘Lacki’ and ‘Majidi’ under saline conditions and ‘Magasi’ under non-saline conditions were the ones with latest maturity, while ‘Gargar-1’ and ‘Gargar-2’ were the earliest mature ones in both conditions (Table 2).
Number of primary lateral branch (NPLB), days to maturity (DMA), fruit crown length (FCL, cm), fruit weight (FWT, kg), number of fruit per plant (NF), fruit yield (FY, Mg ha−1) in 17 melon cultivars grown under non-saline and saline conditions. Data from two growing seasons were pooled and relative reduction in FY shown.

*Means followed by the same letters in each column are not significantly different using LSD0.05 test.
Days to anthesis (DA) was not significantly affected by salinity.
The overall FWT loss was 37.8% under salinity relative to that under non-saline conditions (Table 1). While ‘Majidi-Ab’ and ‘Sabouni’ exhibited the highest FWT values under non-saline and saline conditions, respectively, ‘Gargar-1’ and ‘Gargar-2’ recorded the lowest FWT values under both conditions (Table 2). Salinity also caused an overall reduction of 19% in NF (Table 1). ‘Gargar-2’ and ‘Shahabadi-1’ recorded the highest NF under non-saline conditions, while ‘Shahabadi-1’ and ‘Lacki’ did so under saline conditions. On the other hand, ‘Majidi-Ab’, ‘Sabouni’ and ‘Majidi’ had the lowest NF under non-saline conditions and ‘Majidi’ did so under saline conditions (Table 2). Salinity caused a remarkable reduction in FY in both seasons, with an overall yield loss of 42.7% (Table 1). Under non-saline conditions, ‘Till-Toroq’, ‘Dastjerdi’, ‘Majidi-Ab’, ‘Shahabadi-2’ and ‘Garmak’ produced the highest FY (over 40 Mg ha−1). Under saline conditions, ‘Shahabadi-1’, ‘Dastjerdi’, ‘Sabouni’, ‘Garmak’ and ‘Shahabadi-2’ showed the highest FY, with ‘Shahabadi-1’, ‘Rishbaba-2’ and ‘Sabouni’ showing the lowest yield losses due to salinity stress (around 30%; Table 2).
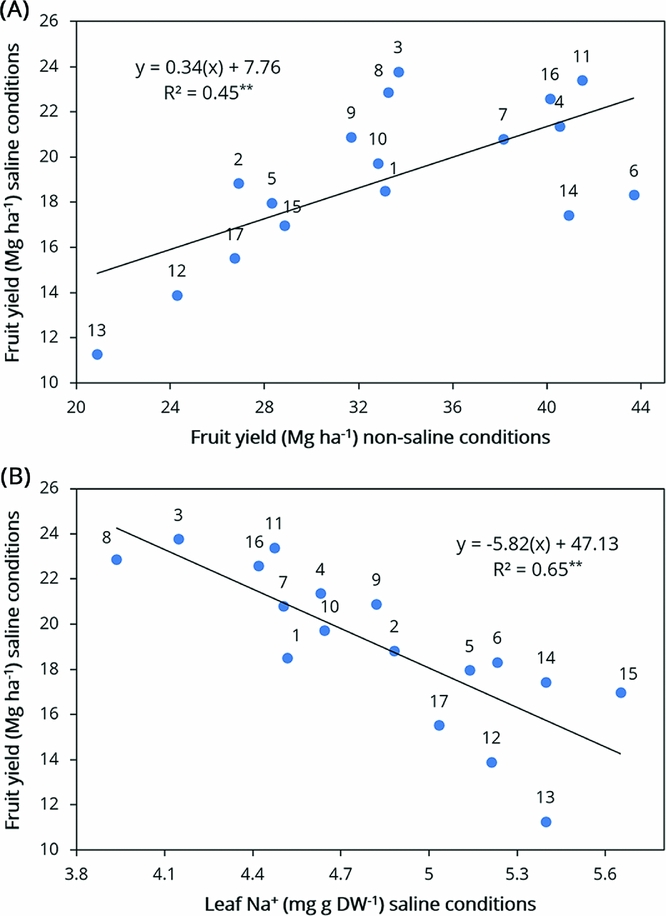
Because of the significant interaction salinity × genotype, linear regression analysis was used to determine yield plasticity among the 17 melon cultivars in both experimental conditions (Figure 2A). Fruit yields under non-saline and saline conditions were significantly correlated (r = 0.67), with ‘Dastjerdi’ (number 11), ‘Garmak’ (16) and ‘Shahabadi-2’ (4) showing superior performance in both environments (Figure 2A). Interestingly, ‘Shahabadi-1’ (3) and ‘Sabouni’ (8) cultivars were less affected by salinity and showed medium productivity under non-saline conditions (Table 2).
Relationship between fruit yield under non-saline and saline conditions (A) and relationship between fruit yield and leaf Na+ concentration under saline conditions (B) in melon cultivars. The numbers correspond to the cultivars including (1) ‘Rishbaba-1’; (2) ‘Rishbaba-2’; (3) ‘Shahabadi-1’; (4) ‘Shahabadi-2’; (5) ‘Magasi’; (6) ‘Till-Toroq’; (7) ‘Savehie’; (8) ‘Sabouni’; (9) ‘Samsouri’; (10) ‘Lacki’; (11) ‘Dastjerdi’; (12) ‘Gargar-1’; (13) ‘Gargar-2’; (14) ‘Majidi-Abarkooh’; (15) ‘Majidi’; (16) ‘Garmak’ and (17) ‘Galia’.

Fruit quality-related traits
The statistically significant interaction effects of salinity × genotype were explained for most cultivars in terms of markedly different genotypic responses to non-saline and saline field conditions (Table S2). FLe and FWi reduced by 15.4 and 14.8%, respectively, under salinity as compared with the non-saline conditions (Table 1). Following changes in fruit dimensions, SCL and SCW were also reduced due to salinity (Table 1), with ‘Lacki’ and ‘Dastjerdi showing the lowest SCL and ‘Majidi’ and ‘Galia’ the lowest SCW under both environmental conditions (Table 3). Salinity reduced PuT and had no effect on PeT (Table S2). On average, PuT of all the cultivars reduced by 14.2% under saline conditions (Table 1) and ‘Majidi’ and ‘Galia’ produced fruits with the thickest pulp in both conditions (Table 3). TSS increased under salinity (about 31%, on average, Table 1) and this response varied among melon cultivars (Table 3). Among the cultivars, ‘Majidi’ and ‘Galia’ yielded the sweetest melon fruits under both conditions (Table 3).
Fruit length (FLe, cm), fruit width (FWi, cm), seed cavity length (SCL, cm), seed cavity width (SCW, cm), pulp thickness (PuT, cm) and total soluble solids (TSS, °Brix) in 17 melon cultivars grown under non-saline and saline conditions. Data from two growing seasons were pooled.

* Means followed by the same letters in each column are not significantly different using LSD0.05 test.
Peel thickness (PeT) was not significantly affected by salinity.
Leaf ion concentrations
Leaf Na+, K+ and Ca+2 concentrations as well as K+/Na+ ratio were significantly affected by both genotype and salinity (Table S2). Moreover, significant interaction effects were observed on these traits. For example, salinity increased Na+ concentration up to 133 and 156% in ‘Garmak’ and 19 and 40% in ‘Sabouni’ in 2014 and 2015, respectively. Among the cultivars, ‘Garmak’ showed the lowest leaf Na+ concentrations in both years under non-saline conditions. In saline conditions, however, ‘Sabouni’ and ‘Shahabadi-1’ had the lowest leaf Na+ concentration among the cultivars in both seasons (Table 4). The exotic cultivar ‘Galia’ was one of the cultivars with the highest leaf Na+ concentration in both years and both conditions (Table 4). Simple linear regression showed a strong and negative relationship between FY and leaf Na+ concentration (r = −0.8), which was also confirmed by the biplot drawn (Figures 2B and 3). In general, salinity reduced leaf K+ concentration (Table 1) and the highest K+ concentrations under saline conditions were found in ‘Sabouni’ in both years (Table 4). K+/Na+ ratio was also reduced due to salinity, with ‘Sabouni’ and ‘Shahabadi-1’ showing the highest ratios under saline conditions (Table 4). Finally, salinity increased leaf Ca2+ concentration (Table 1) and ‘Gargar-1’, ‘Gargar-2’ and ‘Magasi’ showed the highest Ca2+ concentrations under stressful conditions (Table 4).
Leaf Na+, K+ and Ca2+ concentrations and K+/Na+ ratio in 17 melon cultivars grown under non-saline and saline conditions for two seasons (2014 and 2015).

*Means followed by the same letters in each column are not significantly different using LSD0.05 test.
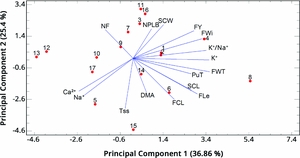
The biplot following PCA analysis of morpho-phenological and fruit-quality traits, and leaf ionic concentrations of melon cultivars under saline conditions (NPLB; number of primary lateral branches, DMA; days to maturity, FCL; fruit crown length, FWT; fruit weight, NF; number of fruit per plant, FY; fruit yield, FLe; fruit length, FWi; fruit width, SCL; seed cavity length, SCW; seed cavity width, PuT; fruit flesh thickness, TSS; total soluble solids, leaf Na+, K+, Ca2+ and K+/Na+ ratio). The numbers correspond to the cultivars including (1) ‘Rishbaba-1’; (2) ‘Rishbaba-2’; (3) ‘Shahabadi-1’; (4) ‘Shahabadi-2’; (5) ‘Magasi’; (6) ‘Till-Toroq’; (7) ‘Savehie’; (8) ‘Sabouni’; (9) ‘Samsouri’; (10) ‘Lacki’; (11) ‘Dastjerdi’; (12) ‘Gargar-1’; (13) ‘Gargar-2’; (14) ‘Majidi-Abarkooh’; (15) ‘Majidi’; (16) ‘Garmak’ and (17) ‘Galia’.

Relationships among traits
In order to identify the likely associations among the studied traits under saline conditions, PCA was applied to the whole data set (17 cultivars × 16 traits), excluding traits (DA and PeT) as they were not significantly affected by salinity. The first two principal components explained 36.9% (PC1) and 25.4% (PC2) of the variation under saline conditions. PC1 was found to be highly related to FWT, FLe, FWi, PuT, FY, leaf K+ concentration and K+/Na+ ratio, while PC2 was highly correlated with TSS, leaf Na+ concentration, DMA and FCL (data not shown). A genotype-by-trait biplot was employed both to illustrate the likely relationships among the cultivars and traits and to identify the superior cultivar for each trait or for each combination of relevant traits under saline conditions (Figure 3). Accordingly, the large and obtuse angle between the trait vectors delineating fruit yield and Na+ and Ca2+ concentrations shows that FY had a strong and negative correlation with these ions. On the other hand, FY was positively correlated with FWi, K+ concentrations, K+/Na+ ratio and FWT. The cultivars showed a wide distribution on the biplot with the highest PC1 value belonging to the ‘Sabouni’ (number 8), as the superior one. As ‘Gargar-1’ (12) and ‘Garga-2’ (13) were located distantly from the effective and positive vectors, they were identified as the inferior cultivars under saline conditions (Figure 3). The results of multiple regression analysis showed that FWT, NF and leaf Na+ concentrations were the strongest predictors of FY in melon cultivars subjected to salinity (Supplementary Table S3). These three traits explained 92% of the variability in FY within the regression models, while leaf Na+ concentration contributed the most to FY variation under saline conditions (R 2 = 0.65).
DISCUSSION
The responses of different melon cultivars to field salinity stress were investigated in terms of agro-phenological, quality-related traits and leaf ion concentrations. The values of phenotypic and genetic variation in non-saline conditions were higher than their estimations under saline conditions for most of the traits (Table 1), unveiling that salinity stress may decrease genetic variation and selection under non-saline conditions may be more effective. In fact, the variation in the genes governing a trait of interest mediates the response to selection (Kearsey and Pooni, Reference Kearsey and Pooni1996).
Plant architecture was altered due to salinity through reduction of NPLB and FCL (Table 1). This finding is inconsistent with that reported by Mendlinger and Fossen (Reference Mendlinger and Fossen1993), who observed a non-significant effect of salinity stress on the number of branches on the main stem in four melon cultivars (‘Galia’, ‘Topmark’, ‘No. 1’ and ‘BG’). This inconsistency might be attributed to genetic diversity and also to differences in the intensity of salinity between the two studies. It has been suggested that the highly branched and dwarf stature (fruits set close to the crown) of melon plants are associated with higher fruit yields (Nerson and Paris, Reference Nerson and Paris1987). Moreover, it has been claimed that selection for increased primary lateral branches will likely result in producing plants with higher fruit yields under non-saline conditions (Zalapa et al., Reference Zalapa, Staub and McCreight2008).
Management of water demand, regional land use and crop rotation schedules critically depend on phenological characteristics of plants. Given the reduced number of days to maturity in the melon cultivars due to salinity stress dictates the development of salinity-tolerant cultivars for saline-affected regions where early maturity is important for enhanced fruit production. On the other hand, ‘Gargar-1’ and ‘Gargar-2’ cultivars were found to be the earliest maturing cultivars (Table 2), which justify their planting immediately after wheat harvest in western parts of Iran where dryland farming is practiced. Thus, their early maturity is interesting for their adaptation to both short growing seasons and dry regions.
The reduction in FWT as a result of salinity stress (Table 1) is in agreement with those obtained at different levels of salinity stress in melon by other authors, including 20, 40 and 60 mM NaCl under greenhouse conditions (Del Amor et al., Reference Del Amor, Martinez and Cerda1999), 1, 2.66 and 7.03 dS m−1 in an open field trial (Huang et al., Reference Huang, Zong, Buonanno, Xue, Wang and Tedeschi2012), 10 and 80 mM NaCl in greenhouse conditions (Navarro et al., Reference Navarro, Botella and Martinez1999) and 8.7, 15.3 and 28.2 dS m−1 under field conditions (Tedeschi et al., Reference Tedeschi, Lavini, Riccardi, Pulvento and Andria2011). Fruit weight loss was also shown to be related, at least in part, to the net accumulation of solutes in fruit tissues, which reduced water content (data not shown) and osmotic potentials (Ψs) (Tedeschi et al., Reference Tedeschi, Zong, Huang, Vitale, Volpe and Xue2017). In addition, the decrease in number of fruits per plant due to salinity could be explained by the increased flower and fruit abortion as also suggested by other researchers (Botia et al., Reference Botia, Navarro, Cerda and Martinez2005; Del Amor et al., Reference Del Amor, Martinez and Cerda1999).
Based on the results, an inverse relationship was observed between FWT and NF under both non-saline and saline conditions (r = −0.89 and r = –0.57, respectively). This relationship was manifested in the heaviest fruit with the lowest NF under both non-saline and saline treatments produced by ‘Sabouni’, ‘Majidi-Ab’ and ‘Shahabadi-2’ (Table 2). The contrary was, however, true about ‘Shahabadi-1’, ‘Lacki’, ‘Samsouri’, ‘Gargar-1’ and ‘Gargar-2’, which presented higher number of fruits produced with lower weight (Table 2). Under salt stress, a number of researchers have suggested a negative relationship existing between FWT and NF, on the one hand, and FY loss, on the other (Colla et al., Reference Colla, Rouphael, Cardarelli, Massa, Salerno and Rea2006; Navarro et al., Reference Navarro, Botella and Martinez1999; Rouphael et al., Reference Rouphael, Cardarelli, Rea and Colla2012; Tedeschi et al., Reference Tedeschi, Lavini, Riccardi, Pulvento and Andria2011).
Yield appeared to be the most reliable parameter in screening for salinity tolerance in crop germplasm (Arzani and Ashraf, Reference Arzani and Ashraf2016). The genotypes of C. melo used in this study showed a wide range of variation in FY and yield loss due to salinity as evidenced by the different responses observed to salinity stress (Table 2). ‘Galia’, a moderately salinity-sensitive cultivar in our study, was reported as a salinity-sensitive among the four melon cultivars tested by Mendlinger and Fossen (Reference Mendlinger and Fossen1993) but as a salinity-tolerant one of the two melon cultivars (i.e., ‘Amarillo Oro’ and ‘Galia’) tested by Botia et al. (Reference Botia, Navarro, Cerda and Martinez2005). Nevertheless, the higher yield coupled with the lower yield loss due to salinity observed in some of the genotypes imply their usefulness for improving salinity-tolerant cultivars in melon.
Fruit quality (both physical and chemical) of melon cultivars was differently affected by salinity stress (Table 1). Not only FLe and FWi but also SCL and SCW decreased as a result of salinity stress. Franco et al. (Reference Franco, Esteban and Rodriguez1993) also found that fruit size decreased with increasing salinity and previous research indicated that fruit size was the most important reason for fruit yield loss under moderate salinity stress, while both fruit size and number of fruits per plant accounted for fruit yield loss under high salinity stress (Mavrogianopoulos et al., Reference Mavrogianopoulos, Spanakis and Tsikalas1999). Irrigation with saline water also reduced PuT and this is consistent with observations reported previously (Colla et al., Reference Colla, Rouphael, Cardarelli, Massa, Salerno and Rea2006; Del Amor et al., Reference Del Amor, Martinez and Cerda1999; Navarro et al., Reference Navarro, Botella and Martinez1999). In contrast, PeT was not affected by salinity (Table 1) and this finding agrees with Del Amor et al. (Reference Del Amor, Martinez and Cerda1999) and Tedeschi et al. (Reference Tedeschi, Lavini, Riccardi, Pulvento and Andria2011), who reported that fruit peel thickness was not influenced by different salinity levels or by different salinization periods.
Another quality factor of utmost importance is the soluble solid content (TSS), which has long been used as an indicator of melon sweetness, flavour, maturity and marketability (Rosa, Reference Rosa1928). Although salinity decreased yield, it has improved fruit quality through increasing TSS (Table 1). The sugar increment due to salinity stress could be explained by the following reasons: (1) a reduction in fruit size; and (2) an increase in transporting sugar through the phloem, as suggested by Navarro et al. (Reference Navarro, Botella and Martinez1999). In addition, the accumulation of sugar helps to reduce the osmotic potential of fruit, enabling water uptake under osmotic stress conditions (Slama et al., Reference Slama, Abdelly, Bouchereau, Flowers and Savouré2015). The passive or active nature of sugar accumulation should be further studied to address a possible role of osmotic adjustment in melon fruits under saline conditions.
Few, if any, studies have investigated the ionic mechanisms underlying the differential genotypic responses to salinity stress using a set of diverse melon germplasm under field conditions. Reportedly, leaf ionic concentrations in melon cultivars are adversely affected by salinity stress. In this experiment, Na+ concentration was observed to increase in all the studied cultivars albeit at different rates (Table 4). Similar results were previously reported in experiments with melon (Colla et al., Reference Colla, Rouphael, Cardarelli, Massa, Salerno and Rea2006; Rouphael et al., Reference Rouphael, Cardarelli, Rea and Colla2012; Tedeschi et al., Reference Tedeschi, Zong, Huang, Vitale, Volpe and Xue2017). Herein, ‘Sabouni’ and ‘Shahabadi-1’ were found to have the lowest leaf Na+ concentration among the tested cultivars under saline conditions and in both seasons (Table 4). Interestingly, these cultivars also presented almost the highest fruit yield and the lowest fruit yield loss under saline conditions (Table 2). The strong and inverse relationship between fruit yield and leaf Na+ concentration (Figure 2B) implies that higher fruit production take places under saline conditions provided that a lower leaf Na+ concentration is maintained. Rouphael et al. (Reference Rouphael, Cardarelli, Rea and Colla2012) found a significantly negative linear relationship between photosynthetic rate and Na+ concentration. Therefore, we would argue that the alleviation of leaf Na+ concentration could play a prominent role in the salinity tolerance response of C. melo species.
Enhanced cellular uptake of potassium is one of the most important factors involved in plant growth and survival when there is an abundance of Na+ ion in the root zone (Arzani and Ashraf, Reference Arzani and Ashraf2016). ‘Sabouni’, as one of the most salinity-tolerant cultivars identified here, showed the highest K+ content under salinity stress (Table 4). Tedeschi et al. (Reference Tedeschi, Lavini, Riccardi, Pulvento and Andria2011) concluded that TSS increased and melon fruit preservation was improved under high leaf K+ concentrations. The ability of plants to maintain high K+/Na+ ratios has been considered as a physiological criterion of salinity tolerance (Arzani, Reference Arzani2008). Paradoxically, the K+/Na+ ratio was found to be significantly correlated (r = 0.70) with FY in all the melon cultivars, even though the leaf K+/Na+ ratio was reduced due to salinity stress. This could be explained by the significant interactive effect of salinity × genotype × year on this trait, indicating that leaf K+ concentration in melon genotypes depends on the environment. Nonetheless, most of the salinity tolerant cultivars (that is, ‘Sabouni’ and ‘Shahabadi-1’) exhibited the highest K+/Na+ ratios under salinity stress (Table 4). Therefore, regulation of ionic fluxes and gene expression related to cellular K+/Na+ homeostasis can be important determinants of salinity tolerance in melon.
Based on our results, the most discriminating criteria for salinity tolerance are higher fruit yields, lower yield losses, reduced leaf Na+ but increased K+ concentrations and enhanced K+/Na+ ratios. Accordingly, ‘Sabouni’ and ‘Shahabadi-1’ are classified as the most salinity-tolerant cultivars. The biplot analysis was also employed to determine the likely relationships among the traits (represented as vectors) and to facilitate the discrimination of salinity-tolerant cultivars based on multiple traits. ‘Sabouni’ (8) was found to be superior, whereas ‘Gargar-1’ (12) and ‘Gargar-2’ (13) were identified as the inferior ones (Figure 3). Despite the fact that ‘Gargar’ is a cultivar with a deep root system and as a drought/heat tolerance potential (Moradmand et al., Reference Moradmand, Arzani and Saeidi2011), it was highly sensitive to salinity and this was likely due to ionic toxicity of Na+ and Cl− (Table 4).
Leaf Na+ concentration was found to be the most significant attributes in explaining the variability in fruit yield of melon cultivars subjected to salinity stress (Table S3), which further supports the aforementioned linear regression analysis (Figure 2B). Excessive leaf Na+ concentration has many adverse effects on key cellular and physiological processes such as cell division and expansion, metabolism and homeostasis, leading to premature leaf senescence and sharp decline in photosynthetic capacity and reducing ultimately yield. The ability of plants to decrease leaf Na+ content through exclusion or sequestration and preserve low cytosolic Na+ concentration is an important objective of crop salinity tolerance improvement programs (Arzani and Ashraf, Reference Arzani and Ashraf2016; Munns and Tester, Reference Munns and Tester2008).
CONCLUSION
This study found yield components and leaf Na+ concentration as the most important factors in detecting salinity tolerance in melon. Overall, salinity stress diminished the yield-related parameters, accelerated maturity and enhanced fruit sweetness in melon. Our results revealed that ‘Sabouni’ and ‘Shahabadi-1’, the most salinity-tolerant cultivars, can be employed in breeding programs toward improving salinity tolerance in melon.
Acknowledgements
The authors would like to thank Drs M. Poursiahbidi and M. Mirzaei-Heidari for their onsite assistance with seed collection of ‘Gargar-1’ and ‘Garga-2’ dryland cultivars. This work was partially supported by Grant no. 93-05-18/9327 from the Isfahan University of Technology.
SUPPLEMENTARY MATERIAL
To view supplementary material for this article, please visit https://doi.org/10.1017/S0014479718000303