Banking panics were a regular and recurrent feature of the nineteenth-century economic landscape in Britain. Michael Collins has noted that those of 1825/6, 1837, 1839, 1847, 1857, 1866 and 1878 were each characterised – to a greater or lesser extent – by rapid withdrawals of deposits that contributed to the economic downswings with which they were associated (Collins 1998, Reference Collins1991). Even as bank failures themselves became less common through the century, those crises had severe liquidity impacts on the economy, and were capable of generating a significant response from depositors, in the form of substantial short-term dissaving. Over the course of the nineteenth century, it has been suggested that bankers learned a series of harsh lessons that progressively led them towards a balance sheet dominated by liquid assets, rather than risky loans to industry (Collins Reference Collins1989; Baker and Collins Reference Baker and Collins1999; Kennedy Reference Kennedy1987; Best and Humphries Reference Best, Humphries, Elbaum and Lazonick1986). Amalgamation and centralisation – designed partly to reassure depositors that their money was safe and secure in the larger and geographically diversified banking institutions – should also be seen as one of the outcomes of this process (Capie and Rodrik-Bali Reference Capie and Rodrik-bali1982; Collins and Baker Reference Collins and Baker2001).
Commercial banks, however, paid little attention to the emergent working classes, who looked elsewhere for their developing financial needs. Savings banks emerged to encourage thrift and investment in the future by the newly created urban industrial working classes, and they spread quickly across the UK after 1810. In the prevailing environment of recurrent crises, this encouragement required a very clear and unequivocal promise of security and safety for the hard-earned money placed in these new institutions. By 1817 in England, and 1835 in Scotland, the fundamental principle had been established by legislation: the banks took in deposits and placed their funds with the Commissioners for the Reduction of the National Debt. They did not – unlike their counterparts in Europe and elsewhere – offer loans or engage in financial intermediation. This meant that the banks were unable to participate in the many opportunities being exploited by the new joint-stock and country banks being created in a period of early and rapid industrialisation but that – in the absence of default or theft on the part of bank officers – absolute, cast-iron security was provided to depositors. To make the deal even more attractive, the return offered was in excess of that available from commercial banks, particularly as interest rates fell in the years after the Napoleonic Wars (Moss and Slaven Reference Moss and Slaven1992, pp. 22-3; Horne Reference Horne1947, pp. 92-3).
Savings banks were not entirely immune from the impact of banking panics, however. Cormac Ó Gráda has shown how country-wide contagion spread among the savings banks in Ireland during the famine, as well as how the failure of a local joint-stock institution could result in significant pressure on a savings bank (Ó Gráda Reference ó gráda2009). Ó Gráda and White's analysis of the Emigrant Industrial Savings Bank in New York suggests that the financial panics of 1854 and 1857 can be understood in terms of the two typologies of random withdrawal risk of bank panic set out by Diamond and Dybvig (Ó Gráda and White Reference ó gráda and White2003; Kelly and Ó Gráda Reference Kelly and ó gráda2000; Diamond and Dybvig Reference Diamond and Dybvig1983). First, panic occurs when random events cause individual depositors to withdraw their funds. Other depositors, for fear of being last to safeguard their money, will follow suit and a run will quickly develop. Alternatively, a run may begin when some depositors discover adverse information about a bank or its assets, and withdraw their funds. Other depositors, unable to gauge the strength either of the individual bank or any other, will likewise move quickly to gain access to their cash. This article investigates the impact of the financial crises of 1847 and 1857 on the Savings Bank of Glasgow, one of the largest and most successful of these institutions. Glasgow, as one of the leading commercial and industrial cities of the day, was severely affected by these crises. In both years, the savings bank experienced considerable demands for withdrawal, but it is difficult to categorise these as bank runs of either sort. In 1857 the problems were greatly exacerbated by the suspension of payments and collapse of local joint-stock banks. The impact of 1847 was less severe in the short run but longer lasting. The key question in much of Ó Gráda's work has been whether those who panicked and closed their accounts were substantially different from those who did not, i.e. whether they had access to specific or private information. Analysis of the depositors in Glasgow suggests that the crisis of 1847 was characterised by the general stress on working-class incomes: those who panicked and closed their accounts at the savings bank were not substantially different from those who did not. In 1857, however, some significant and systematic differences are identified, suggesting that, in this case, there was some contagion from the difficulties in the commercial banking sector, and that this was felt most particularly among the smaller and least wealthy depositors. This latter panic may therefore have more in common with the kind of contagion outlined by Calomiris, in which ‘banks that are intrinsically solvent are subjected to large unwarranted withdrawals’ (Calomiris Reference Calomiris2007, p. 3; Calomiris and Gorton Reference Calomiris, Gorton and Hubbard1991). The article proceeds in the following way: Section I examines the emergence and growth of savings banks generally, and in particular notes their focus as providers of financial facilities to the working class. Section II considers the rise of the Savings Bank of Glasgow and Section III examines the impact of the commercial and financial crises of 1847 and 1857. Section IV offers insight into the behaviour of individual depositors in those crises, and Section V concludes.
I
At the end of the nineteenth century, a variety of institutions emerged whose primary role was to ease the transition from a society dominated by mutuality and community to one dominated by capitalist individualism. The New Political Economy of Malthus, Colquhoun, Townsend, Smith and Ricardo argued that this was as much a moral as an economic issue: individual choices about how to deal with the vagaries and uncertainties of urban industrial life revealed much about the character of people and whether, in times of difficulty, they could be identified as either ‘deserving’ or ‘undeserving’ of state-provided assistance (Kidd Reference Kidd1999; Hollen-Lees Reference Hollen-lees1998; Poynter Reference Poynter1969; Stedman-Jones Reference Stedman-jones2004; Ross Reference Ross2005). Savings banks were one of the key means by which individuals could engage in income smoothing – that is, manage their expenditure by saving for the future, and at the same time provide some evidence of their moral fitness in the new economic and social environment (Wysocki Reference Wysocki and Mura1996; Garon Reference Garon, Daunton and Trentmann2004). Laurence Américi has explicitly referred to the emergence and growth of savings banks as a process of ‘preparing the people for capitalism’ (Américi Reference Américi2002). Wysocki points out that in France and England savings banks were designed to imbue both a sense of patriotism, in that the savings thus accrued were used for the benefit of the State, and self-interest, since the savers – by offering up their hoarded wealth to the State – had a stake in the future of the society in which they were saving. The notion of saving for the future was to become a very powerful motif that challenged the stereotype of the live-for-the-moment, spend-as-get-it, type of attitude displayed by the poor and – crucially – the undeserving (Johnson Reference Johnson1985; Wysocki Reference Wysocki and Mura1996, introduction; Lemire Reference Lemire2005).
In England, early attempts to inculcate the values of disciplined daily habits, providence and individual saving to smooth income streams were all present in the first institutions. Jeremy Bentham's proposal that a national system of ‘Frugality Banks’ be created, and Patrick Colquhoun's for a National Deposit Bank never came to fruition, but Priscilla Wakefield's Tottenham Benefit Bank, the Sunday Banks of Joseph Smith and Thomas Lloyd, among others, and the various schemes of the Society for Bettering the Condition of the Poor all contained a rich mix of philanthropy, regularity and moral education (Horne Reference Horne1947). Henry Duncan (Reference Duncan1815, p. 5), the minister who established the first savings bank at Ruthwell in Dumfriesshire in 1810, was clear about what he was trying to achieve:
the only way … by which the higher ranks can give aid to the lower in their temporal concerns, without running the risk of aiding them to their ruin, is by affording every possible encouragement to industry and virtue … in order to induce the labouring classes to pursue a system of saving, it is only necessary to present them with facilities for depositing their surplus earnings, in a situation which combines security with profit.
Parish (or provident) savings banks spread quickly throughout Scotland – by 1818, 134 had been created (Moss and Slaven Reference Moss and Slaven1992, p. 11) and the Highland Society of Edinburgh praised their contribution to ‘economy, sobriety, industry and happiness’ (Highland Society of Scotland 1815, pp. 5-6). The other side of this moral education, however, was that the middle-class promoters of these institutions had to provide clear and unambiguous security (as well as returns) to the savers. The promise of safety and respectability offered by the presence of local gentry and wealthy individuals as trustees only went so far. In England, George Rosie's Savings Bank Act of 1817 established the link from savings banks, via the Bank of England, to the Commissioners for the Reduction of the National Debt so that the hard-earned savings of the poor could be considered completely safe. This arrangement paid interest in excess of 4 per cent and well above the 3.75 per cent currently available on consols. In contrast to the English case, the Scottish banks, due partly to the lobbying of Henry Duncan, were excluded from this legislation, and were left free, under the Savings Bank Act of 1819, to deposit their funds with the Scottish chartered banks. This situation was fine so long as the chartered banks were happy to pay 5 per cent and the savings banks passed on 4 per cent to their depositors. The decline in interest rates through the difficult economic period of the 1820s and 1830s, however, squeezed these margins relentlessly. English depositors continued to receive considerable subsidies from the government in the form of a guaranteed return, while the Scots laboured to establish both yield and security in the face of occasional malfeasance and falling incentives (Moss and Slaven Reference Moss and Slaven1992, pp.11-21). The Savings Bank Act of 1835 extended the provisions of the English system to Scotland and required all new savings banks to place their deposits with the National Debt Commissioners. Almost all currently existing independent savings banks chose to convert to the National Security Savings Bank system, which allowed them to access a guaranteed return free from the difficulties of local investment or the largesse of the chartered banks, while at the same time offering enhanced security to their depositors. Safety, security and a relatively trouble-free return were, on the whole, much more attractive to both depositors and savings bank promoters in Scotland in the years after 1835.
Depositors' losses in savings banks were few. A Select Committee was established in 1848 to examine three cases in Ireland and one very small default in Scotland. The report referred to ‘gross mismanagement’ and recommended ‘the institution of criminal proceedings’ against at least two of the individuals involved in the largest of these failures, the St Peter's Parish Savings Bank in Cuffe Street, Dublin (BPP, 1850, pp. iii, v).Footnote 1 The Rochdale fraud of 1847 in England encouraged the government to issue instructions strengthening the rules governing the management of savings banks. Legislation, though under active consideration, was rebuffed a number of times in the subsequent decade (Horne Reference Horne1947, pp. 116-40). Throughout this period, however, savings banks were quickly adopted. Horne records that, by 1829, 409,711 depositors had placed some £14.3m in 476 banks across Britain and Ireland. By 1850, the respective numbers were 1.112m, £28.9m and 573 banks. The peak was reached in 1861, when there were 1,609,852 depositors holding £41,546,475 in 645 banks, but Gladstone's creation of the Post Office Savings Bank in that year challenged the supremacy of the savings banks as the appropriate home for working-class thrift (Horne Reference Horne1947, appendix II; Daunton Reference Daunton1995, pp. 93-6).
II
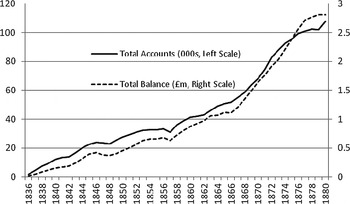
The National Security Savings Bank of Glasgow was constituted under the 1835 legislation and opened for business on 30 July 1836. The new institution had a 24-strong committee of management that represented the wide range of industrial and commercial enterprises in the city, and four of the trustees were connected to one or other of the city's many commercial banks (Campbell Reference Campbell1986, pp. 3-4). The bank grew slowly at first, but quickly became established and popular. Figure 1 shows the number of accounts open at the Savings Bank of Glasgow and the total amount held in those accounts, between 1836 and 1880. These two lines describe steady, at times rapid, growth, particularly – in sharp contrast to the experience in England – after the foundation of the Post Office Savings Banks in the 1860s.
Total accounts and deposits, Savings Bank of Glasgow, 1836–80

By 1870, the Glasgow bank was the largest in the UK (Payne Reference Payne and Payne1967, p. 154). William Meikle, the bank's actuary from 1849 until 1895, whom Horne described as ‘one of the outstanding figures of savings bank history in the nineteenth century’ (Horne Reference Horne1947, p. 144), offered four explanations for the bank's success: a focus on the needs of the bank's customers, a commitment to advertising and the maintenance of a high profile across the city and beyond, encouragement of penny banks to allow the very poorest to access and benefit from savings facilities, and the rapid spread of agencies and branches (Meikle Reference Meikle1875).
Meikle's first factor was the ‘care taken by the directors to adapt their arrangements to the wants of the people’; this included being open (by 1874) on five days from 10am until 3pm, as well as three evenings a week. On being appointed actuary in January 1849, one of Meikle's first suggestions was to simplify the bank's procedures for depositing and withdrawing funds.Footnote 2 He also abolished the need to give notice, and established the principle of repayment on demand. His views on notice were clear: ‘Although intended to prevent depositors spending their money foolishly, it actually tends to prevent depositing altogether.’ In 1858, giving evidence to Parliament, he was able to draw a contrast between the experiences of Glasgow and Manchester in support of this position (Campbell Reference Campbell1986, p. 7).
Meikle's second explanation for the success of the Glasgow Savings Bank was its commitment to ‘keeping the bank prominently before the public’. The bank advertised widely and often from its earliest days: in May of 1838, it was noted that the ‘circulation of small notices relative to the progress of the bank and the advantage such an institution was to depositors’ had substantially increased the number of domestic servants opening accounts, and another 5,000 copies were ordered.Footnote 3 Circulars were printed and delivered to ‘clergymen, teachers, managers of public works and other persons likely to be influential in promoting the objects of the institution’.Footnote 4 Advertisements were placed in a large number of newspapers circulating in Glasgow and its surroundings and, in 1839, the bank came to an agreement with the Religious Tract Society to distribute 25,000 copies of a handbill across a wide area of the west of Scotland.Footnote 5 The commitment to advertising was maintained in subsequent decades. In August 1851, 21,000 of the bank's handbills were printed and distributed throughout the city;Footnote 6 prize essays were frequently published, and placards and posters drawing attention to the Savings Bank were common throughout the city (Payne Reference Payne and Payne1967, p. 154). Annual and special meetings of the Savings Bank were large and important affairs, usually presided over by the Lord Provost and attracting an array of senior clergy and the industrial and commercial elite of the city. One meeting, held on 10 February 1852, managed to fill the City Halls with ‘a most respectable and intelligent assemblage, composed chiefly of the working classes’ to hear lengthy speeches on the benefits of saving (Payne Reference Payne and Payne1967, p. 154).Footnote 7
The ‘third cause of success’ was ‘the fostering and encouraging of penny banks’. In England and Wales – and even more so Ireland – contemporary criticism of the savings banks focused on the extent to which they offered relatively high interest savings vehicles for the already comfortably-off, and their consequent failure to engage effectively with those for whom they were primarily designed (Fishlow Reference Fishlow1961; Smelser Reference Smelser1959, p. 373; Clapham Reference Clapham1930, vol. 1, p. 592).Footnote 8 This criticism has survived, but it is now widely accepted that Scottish savings banks were more clearly focused on the working poor than those in other parts of the UK (Payne Reference Payne and Payne1967; Ó Gráda Reference ó gráda2003). Payne's conclusion left little room for ambiguity: ‘the Glasgow savings bank did attract and retain the support of the manual worker’ (Payne Reference Payne and Payne1967, p. 165). One of the ways in which this was done was the encouragement of penny banks, where the poorest savers could deposit as little as a penny a week (Ross Reference Ross2002). The first penny banks were opened in the city in 1850. The Committee of Management was ‘desirous to aid such efforts for bringing the correct classes within the influence of the savings bank system’ and took steps to support them.Footnote 9 In 1874, Meikle reported that there were 145 penny banks, with 47,000 depositors, allied to the Savings Bank of Glasgow – which supplied material in the form of a standard constitution, sets of rules, handbills, pass books and ledgers. The relationship between the savings and penny banks was captured thus: ‘These auxiliary banks will undoubtedly conduce in a very material degree to extend downwards in the scale of society a knowledge of the advantages of savings banks, and a disposition to embrace them. The committee will continue to give them every encouragement and support which their rules will allow.’Footnote 10 The maximum amount that could be held in these banks was usually set at £1, after which the balance was transferred to the Savings Bank. By encouraging the spread of these institutions the Savings Bank of Glasgow was able to take the savings message even to those who were least well off.
The fourth and last explanation offered by William Meikle for the success of the Glasgow bank was the rapid spread of branches and agencies throughout the city. Ó Gráda has noted that the system of paternalism embodied in these institutions ‘seemed to unite the interests of rich and poor’ (Ó Gráda Reference ó gráda2009, p. 22). This happy coincidence made participation in and encouragement of these banks fashionable: branches and receiving agencies of the Glasgow bank were quickly established in a number of surrounding villages and towns. Within two years of its establishment, the Committee of Management of the Savings Bank of Glasgow was expressing ‘gratification … to see appreciation of gentlemen so numerous and respectable formed for the encouragement and safety of depositors in their respective districts’.Footnote 11 By 1838, two full branches had been established – at Strathaven and Kirkintilloch – and they were soon joined by Lochgilphead and Hamilton. Payne notes that, by 1840, there were also 11 receiving agencies transmitting deposits directly to the head office, though he describes these as ‘always transitory’ (Payne Reference Payne and Payne1967, fn. 16). Nevertheless, the Management Committee expressed its ambition in 1842 that ‘The substantial good already realised by the well conducted agencies of Govan, Kingston, Partick, Dunoon, Shotts, Glasgow Gas Works, Dalquhurn, Milngavie, Hass Cooperage and several others must encourage the yet wider extension of such dependencies among our surrounding villages and public works.’Footnote 12 The location of savings bank agencies in workplaces as well as towns and villages was an integral component of the proselytising strategy.
By March 1855, however, the Committee of Management had become concerned about the agency costs involved in running the branches and ‘instructed the actuary to carry into effect the disjunction [closure] of the branches’.Footnote 13 This process was completed in the four original branches, all of which were located in towns outside the city, by the end of August, but there was at the same time a strategic shift towards replacing the transitory agencies with more permanent representation and consolidation within the city boundaries. In October of the same year, the Committee of Accounts took the view ‘that the existence of savings bank accommodation in Glasgow was not adequate to the wants of the vast population of the city … and that some extension of this Bank by means of branches was called for’.Footnote 14 At first, the rapidly growing neighbourhoods to the south of the River Clyde appeared to offer suitable opportunities for expansion, but ‘it was reported that … the south side of the river was likely to be fully accommodated by two of the ordinary banks (the Western and the City) … it had been thought inexpedient of the bank to extend its operations in that direction’.Footnote 15 The first of the new branches was opened in Anderston in 1856. It very quickly came under severe competitive pressure from commercial banks offering higher interest rates, and it closed in August 1857, transferring the £2,711 5s 11d held in 548 accounts to the head office.Footnote 16 1857 was an exceptional year, however, as will be discussed below, and the managers were not put off the principle of branch expansion. By 1914, there were 16 branches across the city, in addition to the head office.
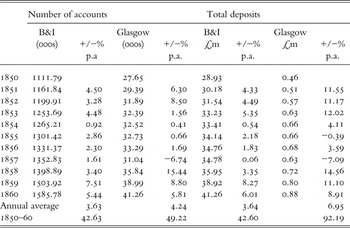
The Savings Bank of Glasgow was, by any measure, highly successful throughout the second half of the nineteenth century. Figure 1 showed the rise of both accounts and amount deposited over a long period. Table 1 shows a comparison between the Savings Bank of Glasgow and Britain and Ireland (including Glasgow) for the 1850s. Two things are clear from this table. First, that, in aggregate, Glasgow grew slightly faster than other savings banks in terms of number of accounts, but more than twice as much in terms of amount held. Second, it is clear that, while the period of difficulty in the middle of the decade, and especially in 1856-7, was more challenging for Glasgow than elsewhere, its resilience is revealed in that it bounced back more strongly than was the general case, in both accounts and deposits, towards the end of the period.
Accounts and deposits, Britain and Ireland and Glasgow, 1850–60

Source: HC, Return of Savings Banks in the United Kingdom, various years.
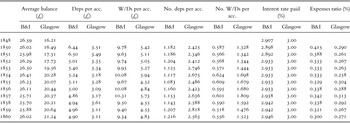
Table 2 offers a more detailed comparison of Glasgow and Britain and Ireland. What emerges from this analysis is that, in the 1850s, Glasgow savers made more frequent but smaller-value deposits than was the norm, and amassed smaller balances at the savings banks. At the same time, they made more, smaller value, withdrawals. Over the decade it is clear that the average balance in Britain and Ireland was falling slowly, while that in the Savings Bank of Glasgow was rising. In terms of management, Glasgow paid a higher (and stable) interest rate than the average, and its costs of operation remained lower than the average, though costs across Britain and Ireland were falling more rapidly. The interest rate, in particular, was valued by Meikle and the other managers of the bank as a means of attracting depositors.Footnote 17
Characteristics of Savings Bank of Glasgow and all Britain and Ireland savings banks, 1848–60

Source: HC, Return of Savings Banks in the United Kingdom, various years.
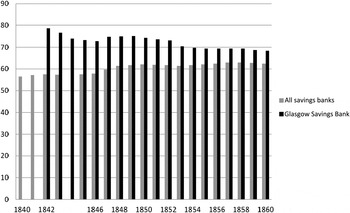
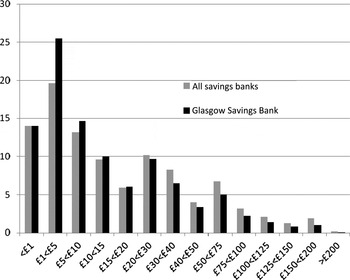
Figure 2 supports the view that the Savings Bank of Glasgow attracted a larger number of small depositors than was the case more generally, and also confirms the impression of greater similarity over time. A slightly more fine-grained picture emerges from Figure 3, which shows the mean across the 1850s of the annual proportions of account balances. Glasgow clearly shows a much higher proportion of small balances, and a smaller proportion of the higher balances than the norm. These results suggest that the Savings Bank of Glasgow in this period was better able to reach the ‘industrious poor’ and to encourage saving than was the case across Britain and Ireland.
Proportion of all account balances <£20, 1840–60

Mean annual proportions of all account balances, 1851–60

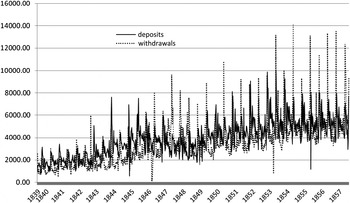
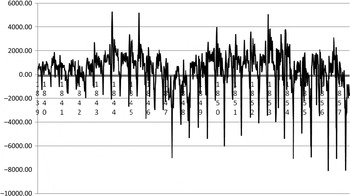
Figure 4 shows the weekly deposits and withdrawals at the Savings Bank of Glasgow for the period from August 1839 until August 1857. Figure 5 charts the weekly balance in the same period. The pattern revealed by these two charts is one of slow early growth, which is consolidated in the mid 1840s, but challenged around the period of the commercial and banking crisis of 1847 when, for the first time, withdrawals were consistently in excess of deposits. Recovery from 1849 is fairly steady, but there is increasing pressure on deposits from 1854 onwards (Horne (Reference Horne1947, p. 157) refers to the period after 1854 as ‘the four bad years’) and, although the data are not available after August 1857, it is clear that the pressure being felt in the commercial and industrial world from early in that year is having an impact on depositors' ability to save (and willingness to withdraw). It will be recalled, from Figure 1, that both total accounts and total balances described steady growth, with the exceptions of the crisis years of 1847 and 1857. Perhaps most obvious from these two charts, however, is the cyclical nature of withdrawals, in particular. There appear to be regular, bi-annual peaks. Figure 6 explores this further.
Weekly deposits and withdrawals, £, Savings Bank of Glasgow, August 1839 – August 1857

Weekly balance (deposits–withdrawals), £, 12 August 1839 – 7 August 1857

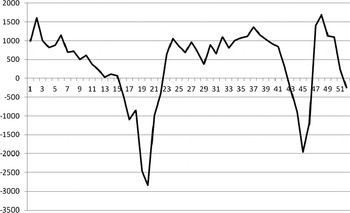
Annual weekly average balance, £, August 1839 – August 1857

Figure 6 shows very clearly the impact of the Scottish pattern of rent payments in the nineteenth century. Rent in this period was paid twice yearly, in May and November, and, as early as 1842 the trustees of the Govan Receiving Agency were able to record that ‘the operations of this bank, in common with many similar institutions, have most distinctly shown that persons who can barely make the two ends meet [emphasis original] find them highly advantageous in enabling them to provide, by weekly or fortnightly deposits, for rents and other occasional payments’.Footnote 18 They estimated that total payments in the ‘rent quarters’ – Whitsunday and Martinmas – exceeded those made in Lammas and Candlemas by approximately 45 per cent. This aligns Glasgow savers with those depositors in Philadelphia in the 1850s analysed by Alter, Goldin and Rotella (Reference Alter, Goldin and Rotella1994). They used the distinction between life-cycle (long-term), cyclical (regular, predictable events) and target (for large purchases or life-event) savings. Using a longitudinal approach, they found that most saving was for target or cyclical purposes but that female domestic servants, in particular, had a longer-term or life-cycle perspective. In addition, Paul Johnson has suggested that, in Britain, most working-class savings were short-term and either precautionary or related to events such as funerals or emigration (Johnson Reference Johnson1985, p. 104). The evidence presented here does not allow a definitive conclusion on the motivations of those who used the Savings Bank of Glasgow, but it is clear that the payment of rent – the most regular and predictable cyclical demand made on working-class savers – dominated these account-holders. There is also some evidence of target saving. The annual report for 1852 noted that the amount of withdrawals was particularly high in that year, ‘caused principally by withdrawals for the purposes of emigration. In the early part of the year, many hundreds of the most regular depositors closed their connection with the bank and left the country, taking with them considerable sums which had accumulated in the bank.’Footnote 19 In 1860, the same complaint was made, that the larger than usual amount of repayments was ‘partly accounted for by the withdrawal, in the early part of the year, of considerable sums for emigration’.Footnote 20
III
The commercial and financial crises of 1847 and 1857 – which both seem to have had an impact on savings behaviour – were similar in many ways: periods of industrial expansion and financial speculation led to a boom, but a rapid shift in economic conditions overseas resulted in a sharp tightening of credit. In 1847, the problem was mostly caused by domestic speculation in the railway boom, though the Scottish cotton and iron industries played their part (Saville Reference Saville1996, p. 493). A serious financial panic in April and May of that year appeared to have passed with few casualties but, in the late summer, a domestic harvest failure and a precipitous fall in the price of sugar meant that some merchants were unable to meet payments due on their bills. A number of discount houses and provincial banking companies failed throughout the UK, the demand for credit increased rapidly and the Bank of England came under severe pressure to relax the restrictions on money supply embodied in the 1844 Banking Act (Ross Reference Ross and Ross1998). One banker noted that this crisis was ‘the most difficult the commercial world has ever experienced’ (Munro Reference Munro1928, p. 229) and in Glasgow a meeting of around 40 merchants and manufacturers decided to apply to the government for ‘a temporary suspension of the clauses of the bank restriction act’.Footnote 21 Responding to very widespread public concern, on Saturday 23 October, the government authorised the Bank of England to issue notes without limit from the following Monday. By the end of the month, the position had stabilised. Dornbusch and Frenkel (Reference Dornbusch, Frenkel, Bordo and Schwartz1984, p. 256) see this crisis as essentially one of internal convertibility, in which ‘suspension of the act removed any conceivable basis for panic and therefore immediately restored a measure of financial stability’. By 25 October, the Glasgow Herald reported ‘some symptoms of improvement in the money market’, and, by the 29th, it recorded that ‘in all quarters, confidence has been greatly restored’.Footnote 22
The difficulties in 1857 followed a similar pattern. A period of expansion was followed by a tightening of monetary conditions. Depression in the USA quickly translated into failures of merchants and banking houses in Liverpool, Glasgow and London. This exacerbated the difficulties of accessing credit and by the beginning of November many bill brokers could only obtain cash from the Bank of England on very difficult terms. Once again, the government was forced to suspend the 1844 Bank Act, and, again, this quickly allowed confidence to return to the banking system.
In each of these cases, pressure on the banking system was severe and credit was in short supply. But this should have had little impact on savings banks, which did not offer credit and whose deposits were perfectly safe with the Commissioners for the Reduction of the National Debt. On the other hand, the security and liquidity which had been trumpeted as the key elements of savings bank deposits clearly meant that they were subject to rapid withdrawal. During the month of November 1847, the Savings Bank of Glasgow lost more than 3 per cent of its total deposits. Despite the rapid restoration of confidence in the money markets, the economic difficulties of the subsequent year meant that it was March 1850 before the total sums deposited in the bank regained the level of December 1846.
In 1857, the peak of the crisis came at the same time as the normal rent withdrawals from the savings bank accounts. But there were additional, local elements in Glasgow that exacerbated the problem in that year. As early as 1853, the Western Bank had considered ‘the propriety of granting to the working classes further facilities at the branch offices of that bank’.Footnote 23 The Western was something of an enfant terrible among the Glasgow commercial banks and was viewed with suspicion, particularly by the chartered banks in Edinburgh, who would never have entertained the notion of attracting small working-class savers into their establishments (Malcolm Reference Malcolm1950, p. 128; Campbell, Reference Campbell1955). As its balance sheet position deteriorated, the Western sought desperately to attract liquidity and did this by opening branches aimed at poorer depositors.Footnote 24 It was noted above that, in 1856, the Western and City Banks had thwarted the Savings Bank's desire to expand south of the River Clyde, and that the higher interest rates (4 per cent on all deposits of one shilling and upwards) which they offered on savings accounts led to the early demise of the Savings Bank of Glasgow branch that had been opened in Anderston.Footnote 25 Confusion was further spread by many of these commercial branches referring to and advertising themselves as ‘savings bank’ branches. An article in The Times on 29 October suggested that the Western was to be wound up, and this increased the drain on deposits in that bank. The Bank of England was prevailed upon to offer relief, but initially refused. The Western Bank eventually closed at 2pm on Monday 9 November 1857, and the run on commercial banks spread very quickly across the city, particularly to the savings bank branches of the City of Glasgow Bank, which were open in the evening.Footnote 26 One prominent banker in the city recorded in his diary ‘This day will long be remembered in Glasgow as one of the blackest in the annals of its commercial history … I tremble for tomorrow and Wednesday’ (Munn Reference Munn1988, p. 36). The Glasgow Herald reported that ‘on Monday afternoon a crowd of persons, small depositors, besieged the doors of the Trongate branch of the City of Glasgow Bank and so pressing did they become that a body of police were called out who succeeded in clearing the streets. Yesterday [Tuesday] the excitement still continued and at an early hour in the morning, a run commenced upon several banks in town.’Footnote 27 The notes of the Western Bank were refused throughout Tuesday 10th, largely on the insistence of the Edinburgh banks, and the clamour from depositors intensified.Footnote 28 The City of Glasgow Bank remained closed on the Wednesday, but during that day the Edinburgh banks agreed to begin accepting the notes of the Western Bank and the City of Glasgow Bank once more; the city magistrates in Glasgow declared them acceptable ‘in payment of police, water, poor and other rates and assessments’,Footnote 29 and a supply of gold for the commercial banks arrived by train from London, easing the liquidity position. The local panic was largely over by the afternoon of Wednesday 11th and the following day the government allowed monetary easing by relaxing the strictures of the Bank Act.Footnote 30
The impact of all this on the Savings Bank of Glasgow was serious, but not damaging. The directors, at their meeting on 20 November, recorded their thanks to the National Debt Office, ‘for the energy and promptitude with which … [it] supplied the urgent demands of the Bank during the recent monetary panic’. They also wished to
record their approval of the efficient manner in which Mr Meikle and the other officers and clerks discharged their duties to the bank and to the public on the occasion. – It is especially gratifying to the directors to know that the whole business details during the trying emergency were conducted with the greatest order and regularity – and that although the amounts received and paid exceeded £40,000, the requirements of every depositor were promptly met and the bank's cash was balanced each day with perfect accuracy – and all the proceedings of the bank were conducted in the usual correct routine.
The directors have also to express the obligations they are under to the Police force for their firmness yet considerateness, during a most eventful and trying occasion.Footnote 31
The daily and weekly data used to generate Figures 4 and 5 are not available for the period of the crisis, but the Committee of Management noted that the run occurred on 10, 11 and 12 November, and that there were 2,402 payments amounting to £28,088 12s 2d. These three days would, in any case, have been the busiest of the period, since rents were due on 11 November. The Committee calculated that, on the three corresponding days in 1856, the number of repayments was 1,725 and the amount repaid was £9,941 16s 4d. The crisis, therefore, brought an increase of 39 per cent in the number of payments and 182 per cent in the money withdrawn over the previous year.Footnote 32 This was a considerably sharper short-term impact than a decade earlier. The period of the crisis of 1847 (20, 22, 25 and 27 October) showed an increase in withdrawals over the corresponding dates (19, 21, 23, 26 October) in 1846 of only 3.52 per cent. But the longer-term impact was much more severe in the earlier crisis. Whereas the Savings Bank of Glasgow endured a period of steady decline in total deposits after the 1847 crisis, occasioned by continued industrial and commercial distress, the Annual Report for 1857 noted that the ‘drain was very temporary, and the money is now being rapidly restored’.Footnote 33 The following year, although there had been considerable unemployment, and ‘great depression in several important branches of trade and manufacture’, the total deposits rose by more than £9,000, for two main reasons: ‘the replacement of money withdrawn during the panic, and from the transfer of accounts from other banks that have ceased to transact Savings Bank business’.Footnote 34 Glasgow's experience was in line with that elsewhere. Horne (Reference Horne1947, pp. 156-7) noted that the latter crisis was ‘not nearly so damaging’ to savings banks as the former and that, even in Glasgow, buffeted as it was by the particular difficulties of the Western and City of Glasgow Banks, ‘the real effect of the crisis … was not really as severe as in 1847’.
The impact of the financial crises in Glasgow was significant – in 1847, the reduction in deposits was long-lasting, while in 1857, it was particularly sharp in the short term as a result of a number of specific and primarily local characteristics. It should also be noted that the Savings Bank of Glasgow, unlike the Western Bank and the City of Glasgow Bank, was never in any danger of running out of liquidity or of having to suspend payments. Even at the height of the crisis in 1857, when the pressure for withdrawals was most intense, the institution could easily access additional funds from the National Debt Office.Footnote 35 Nevertheless, the general conditions of panic and contagion, greatly exacerbated in 1857 by the confusion between the Savings Bank of Glasgow and the savings bank branches of the City of Glasgow and Western Banks, clearly intensified the demand for cash.
IV
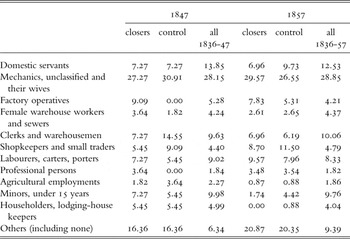
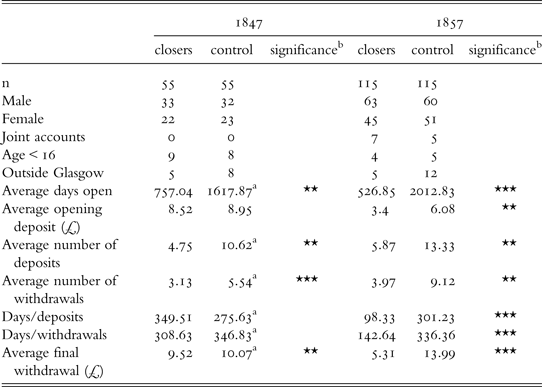
Cormac Ó Gráda (Reference ó gráda2003, Reference ó gráda2009; Ó Gráda and White Reference ó gráda and White2003) has asked, in a number of papers exploring the experiences of the Thurles Savings Bank in County Tipperary, Ireland, and the Emigrant Industrial Savings Bank, in New York, whether those who panicked and withdrew their funds during a financial crisis were systematically different from those who held their nerve. Tables 3 and 4 present some results of an analysis of savers in the Savings Bank of Glasgow in 1847 and 1857. Using the deposit ledgers, it was possible to identify those who closed their accounts during the periods of greatest exigency (20, 22, 23, 25 October 1847 and 9, 10, 11, 12 November 1857), and then trace the operations of those accounts back to the point at which they were opened. In this way, 55 closers (of the 23,983 open accounts on 4 October) were identified in 1847, and 115 (the latest figure available is 32,096 open accounts on 7 August) in the later year. To generate a control group, a random sample of accounts opened in the same period as that represented by the closers was created (i.e. accounts opened between 15 August 1842 and 18 October 1847, and between 5 January 1852 and 7 November 1857).
Proportions of 1847 and 1857 closers and control groups, and all accounts opened to 1847 and 1857, by occupational categories

Source: see text, and Glasgow University Archives, TSB63/1/4/1-2, Savings Bank of Glasgow, Annual Reports.
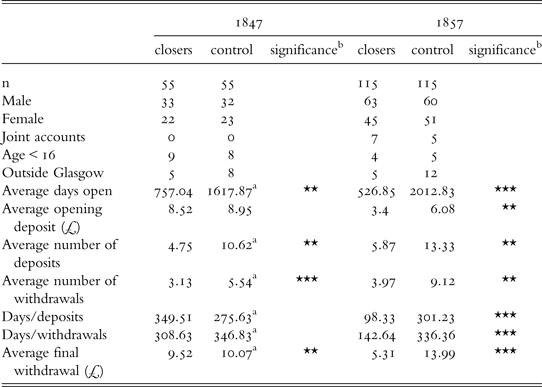
Comparisons of closed and control accounts in the 1847 and 1857 crises
a of 52
b in a two-tailed t-test, the difference between the closers and control group is statistically significant at *** = 99%; ** = 95% and * = 90% confidence levels.
Source: GUA TSB63/10/66/15/13-46, Savings Bank of Glasgow, depositors' ledgers, 1842–62.
A number of comments about these populations should be made. First, it is possible that they do not capture every closer in the periods of crisis. Care has been taken to identify every account, but it is impossible to be completely confident on this score. Further, it is clear that the number of accounts closing in these periods of panic is a very small proportion of the total numbers open, which suggests (given the overall decline in money held by the savings bank) that a much more common response to the crisis was withdrawal from an account that was then left open. Unfortunately, it is not possible to assess the characteristics of those who withdrew a large proportion of their savings, rather than close their account. Second, it may be that some of those who closed their accounts did so for reasons unconnected with the panics. There is no way to tell. Third, it should be noted that the control populations were selected entirely at random, by account number. They should represent the very wide range of account behaviour, including those open for long periods and short, those who made many deposits and very few, and those who closed their accounts before, during and after the crisis. In fact, there is no case in these populations of any of the ‘control’ accounts being closed during either crisis. Fourth, many of the accounts – particularly in the control groups – were open for a considerable period and therefore are recorded in more than one ledger book. Some ledger books have been lost or destroyed and it was not possible to trace fully three accounts from the 1847 control group. Most of the data reported in that column, therefore, refer to 52, rather than 55, accounts.
Table 3 presents these account holders by occupational category, using the categorisations presented in the annual reports. The occupational categorisations were made on the basis of the descriptions in the depositors' ledgers and declaration books – it is possible that some will have been placed in an inappropriate group. There does appear to be a consistent under-categorisation of domestic servants, and over-categorisation of ‘others’. Nevertheless, this table offers broad support, given the small numbers, particularly for the 1847 groups, for the view that the samples being analysed are approximately in line with the wider population of the bank's account holders.
Table 4 contains some interesting comparisons, both between the two groups in each period, and between the two periods themselves. First, the overall gender balance reported in these groups (59% male, 41% female in 1847; 54% male, 46% female in 1857) is generally in line with the breakdown noted in the 1852 Annual Report, that of the total of 79,137 accounts opened up to that date, 56.7% had been opened by men, and 43.3% by women.Footnote 36 The later period has a number of joint accounts, and fewer children. There are no obvious differences in the number of accounts being opened (or closed) by savers from beyond Glasgow, though it is perhaps worth noting that among those who closed their accounts in the 1857 crisis was one Donald McInnes, who gave his occupation as ‘steward’ and his address as New York. The 1857 control group included Janet Dunn, a servant whose address was 24 Oxford Street, London.
It is to be expected, of course, that those in the control group would have their accounts open for longer than those who closed, but the point should be made that this adds to the impression that closers panicked during the days of crisis, and removed their savings before they would have done in the ordinary course of events. This was true in both years, but particularly so in 1857. In addition to the means reported in Table 4, the median numbers of days for which the closer and control groups of accounts were open in 1847 were 733 and 1,214 respectively; in 1857 the median life spans were 191 and 704 days. This supports the view that the 1857 crisis had a much bigger short-term impact than that of a decade earlier. The longest-lived account of all the groups was opened by Agnes Stewart, a 20-year-old servant from Inverary, on 17 December 1846. Her account remained open and active for almost 50 years, until the 3 April 1895, when a balance of £172 13s 10d was withdrawn.Footnote 37 The longest surviving account from the 1857 group was opened by William Nicol, a labourer, on 5 November 1853, and closed on 3 December 1894. These examples of longevity were exceptional, however: an account life of somewhere between one and five years was much more common.
Table 4 also reveals a pattern of more systematic differences between the closers and the control group in 1857 than was the case in the earlier year. Again, the impact of the crisis is notable in that many depositors closed their accounts before they might ordinarily have done so, and this is reinforced by the significance of the differences in the days open per deposit and withdrawal values. Those who panicked in November 1857 used their accounts much more regularly than those in the control group. They also had significantly smaller opening and closing balances than the others – and, again, the differences in 1857 are greater than those found between the 1847 groups. Those who panicked in 1857 and closed their account with the Savings Bank of Glasgow were systematically different from those who did not. They represented the smaller, less wealthy savers who used their accounts more regularly, but saved less: they participated in the kind of careful husbanding of meagre resources that the savings banks were designed to encourage. This group had the lowest proportion of savers from outside the city, and they might therefore be thought of as more likely to have been infected by the rumours, gossip and panic that infected Glasgow in the heady days of November 1857.
In both years, 1847 and 1857, it would seem that the pressure on the savings bank was a result of general contagion from the difficulties being experienced in the industrial and commercial communities in the city. It is hard to see – particularly in the earlier crisis – how this could be classified as a run on the bank, the withdrawals simply being a result of the general economic difficulties of the period. There could be no asymmetric or private information about potential illiquidity or insolvency of the Savings Bank of Glasgow because such an outcome was entirely unlikely. In 1857, there were additional factors, specifically the failure of the Western Bank, the suspension of payments by the City of Glasgow Bank, and the fact that both of these institutions had established ‘savings bank branches’ that were not linked to the National Security system, which introduced some considerable confusion into the mix. Those who panicked and closed their accounts in this later crisis were systematically different from those who did not, which suggests that they were subject to a particular type of contagion characterised by a level and type of information diffusion that was incomplete, unsubstantiated and confused.
V
Savings banks were created for a complex mixture of reasons. Partly to reduce pressure on the Poor Laws, they sought to encourage the new urban industrial working classes to take responsibility for themselves and their families. They also provided an important avenue by which the middle classes could meet their own obligations to provide philanthropic and moral leadership and guidance. In Britain, the depositing of accumulated balances with the Commissioners for the Reduction of the National Debt provided safety and security to the savers, but also offered a nominal stake in the construction of the new forms of society. In Glasgow, which was in many ways the quintessential Victorian industrial city, the savings bank successfully ticked all of these boxes. Founded and led by the industrial and commercial elite of the city, it quickly became a symbol of civic pride and was adopted by large numbers of individual savers. The Savings Bank of Glasgow was more successful than most in reaching the industrious poor and its depositors reflected the wide and heterogeneous nature of the working-class population of the city. It was particularly fortunate in appointing William Meikle as a clear and strategic-thinking actuary and the Savings Bank of Glasgow was able to maintain steady growth even after Gladstone's creation of the Post Office Savings Bank in 1862. The financial and commercial crises of 1847 and 1857 had a significant impact on savings banks generally, and the Savings Bank of Glasgow in particular. The first of these two crises was reflected in a long-term reduction in both savings and accounts open at the bank; while the second, which was considerably worsened by the panic that brought down one of the city's commercial banks and temporary closure of another, was much more severe in the short term, but of little importance in the longer perspective. Both crises resulted in elevated withdrawals from the savings bank as a result of the commercial and industrial difficulties of the period. Detailed analysis of depositors' responses to the two crises suggests that, in 1847, those who closed their accounts were not substantially different from those who did not; they appear to have withdrawn funds simply to meet the needs of income smoothing in times of exigency. Those who panicked and closed their accounts in the 1857 crisis, however, were systematically and significantly different from those who remained with the savings bank, and appear to have acted as a result of contagion from the local commercial and banking difficulties.