


Introduction
Many countries have adopted political affirmative action with the express goal of raising the voice of marginalized communities in how governments function. This paper asks how improvements in descriptive representation might affect economic welfare. Studying this question is of particular import where poor populations rely on large-scale government welfare programs such as in the case of the Benazir Income Support Program in Pakistan that provides 5.4 million poor women income supplements as a safety net, the Supplemental Nutrition Assistance Program in the United States that helps 46 million low-income individuals purchase groceries every month, and the National Rural Employment Guarantee Scheme (NREGS) in India, the world’s largest employment program that we examine in this study.
Does descriptive representation achieved through affirmative action deliver improved welfare for marginalized communities, or does restricting representation prove self-defeating in that it damages the economic prospects of the populations it was designed to politically empower? We study electoral quotas, an affirmative action policy that directly yields descriptive representation and is implemented in over 100 countries,Footnote 1 and ask two related, yet underexplored questions: do electoral quotas improve or hinder development, and how are the benefits (and costs) of electoral quotas distributed in society?
Prior evidence is mixed and does not offer clear theoretical expectations. Focusing on minorities explicitly targeted under an electoral quota, some studies, which we review below, show strong positive welfare effects, while others report no improvements. We organize and extend hypotheses from previous work in a novel theoretical framework that enables an explicit accounting of how electoral quotas affect the extensive margin of program implementation (that is, the overall size of the pie) and the intensive margin (the distribution of the pie) for targeted disadvantaged groups, non-targeted disadvantaged groups, and for the comparatively privileged groups under the status quo. This exercise allows a fuller understanding of the trade-offs involved in the implementation of affirmative action policies. A solidarity hypothesis predicts that shared interests and experiences between minority groups should lead to positive program spillovers from quota-targeted to non-targeted minorities. A crowding-out hypothesis predicts that gains for a quota targeted minority will come at the cost of other groups, particularly non-targeted minorities. And, a performance hypothesis predicts better outcomes for targeted minorities and unchanged outcomes for others, or, at the very least, negative outcomes for others that do not outweigh gains for targeted minorities.
This paper presents the first systematic evidence on a large electoral quota in India that brought increased descriptive representation to well over 100 million citizens. Shortly after Independence from the British in 1947, the Indian parliament declared certain regions in the country as Scheduled Areas (SA), a designation linked to the protection of a historically disadvantaged category of minority groups, the Scheduled Tribes (ST). From 2000, under the Panchayat Extension to Scheduled Areas (PESA) Act, India’s national parliament implemented a dramatic electoral quota in Scheduled Areas, requiring that all chairperson positions in three tiers of local government councils, as well as at least half the seats on each of those councils, be reserved for individuals from the Scheduled Tribes.
Why does understanding the impact of this electoral quota matter? First, the quota has received no systematic quantitative analysis despite the fact that it is present in half of India’s states and covers nearly half of the territory within those states. Second, the quota targets ST, who are considered to be among the most economically vulnerable and politically excluded groups in India. Third, the permanence of the Scheduled Areas quota is qualitatively different from population-based quotas that rotate over time. Scholars have argued that rotation is an impediment to long-term quota success (Bhavnani Reference Bhavnani2009; Dunning and Nilekani Reference Dunning and Nilekani2013).
Isolating the causal effect of Scheduled Areas is not straightforward. Indeed, comparing SA to non-SA using data from the 2001 Indian Census shows that they differ on a number of dimensions. By employing a geographic regression discontinuity (RD) design similar to Dell (Reference Dell2010), we absorb variation that correlates with geographic space, allowing for a comparison of villages lying just on one or the other side of the border between non-Scheduled and Scheduled Areas.
We first examine the effects of Scheduled Areas using data from NREGS, a flagship federal program in India with an annual cost of approximately US$6 billion. Each year, the social protection scheme officially guarantees 100 days of minimum-wage employment for every rural household in India. We study program delivery to rural populations in 2013, up to 12 years after the first implementation of PESA. We do this by creating a new dataset with 217,144 villages that combines official NREGS implementation data with an original spatial dataset of Scheduled Area status. The scale and depth of these data, which permit us to evaluate both the extensive and intensive margins of program delivery, are a substantial advance on existing work on affirmative action and economic development.Footnote 2
Results show that NREGS delivery improves substantially for the targeted minorities (ST), who receive 24.2% more workdays in Scheduled Areas. Improvement appears to come primarily at the cost of work for non-minorities (non-SC/ST), who receive 11.5% fewer workdays. We find no evidence that the quota causes a change in employment for the non-targeted, historically disadvantaged minorities (SC). Our evidence thus offers support for the crowding out and performance hypotheses but not for the solidarity hypothesis. Overall, the results indicate that the delivery of government programs in Scheduled Areas is no worse than in non-Scheduled Areas. Contrary to concerns that quotas might overcompensate for historical inequalities, we find that the Scheduled Areas quota more closely aligns NREGS work, by identity category, to each group’s share of the local population.
Are these effects specific to NREGS? We evaluate broader impacts of Scheduled Areas by examining a second large-scale development scheme as well as outcomes from the 2011 Census. Data show improved provision of public goods that is likely to benefit disadvantaged communities. We also observe increased rural road connectivity from the Pradhan Mantri Gram Sadak Yojana (PMGSY) village roads program. These improvements are consistent with the results from NREGS, insofar as they reflect a higher responsiveness to the needs of marginalized communities.
To what extent are the results we observe the function of an electoral politics mechanism? We provide four pieces of evidence. First, qualitative evidence from Indian historical studies, as well as quantitative evidence from the PMGSY program and the Indian Census, show that villages on opposite sides of the Scheduled and non-Scheduled border were very similar, and followed parallel trends, prior to the implementation of PESA. Second, there is evidence from two programs that ST politicians strategically target benefits to ST communities. Third, the effects of the quota are reduced in areas of overlap with quotas for state-level ST legislators. Fourth, the influence of the quota is largest when it constitutes the greatest shock to political representation—that is, following the first election.
This paper makes theoretical, empirical, and policy contributions. The theoretical contribution is to explicitly lay out and combine into a unified framework hypotheses on the trade-offs of affirmative action on targeted and historically disadvantaged, non-targeted and disadvantaged, and non-targeted and non-disadvantaged identity-based groups. Empirically, our unique data allow us to test these hypotheses in the context of three critical, village-level data sources—the largest rural employment scheme in the world, a national rural roads development program, and public goods and economic measures from the census of the world’s largest democracy, India. From a policy perspective, all too often policy-makers and analysts treat parallel pro-poor economic and political efforts in isolation. By considering their interaction, we hope to advance our understanding of how politics can be made to work for inclusive development.
Theory and Hypotheses
In this section, we review conflicting findings and draw hypotheses from existing work on the effects of political affirmative action on government functioning.
Extensive Margin (Size of the Pie)
Given the same resources and institutional design, do electoral quotas positively or negatively affect the overall efficacy of government programs? Implementation of government programs would suffer if quota politicians are less competent than non-quota politicians (Jensenius Reference Jensenius2017). Jensenius (Reference Jensenius2015, 202) presents qualitative evidence that SC quota politicians are viewed as inexperienced and referred to as “weak,” “inefficient,” and “useless.” Deshpande and Weisskopf (Reference Deshpande2014) document how some oppose affirmative action policies due to a belief that they result in less qualified individuals and worse performance. Bertrand, Hanna, and Mullainathan (Reference Bertrand, Hanna and Mullainathan2010) find that students admitted under quotas see an increase in income, but these gains are more than offset by losses in earnings for individuals displaced by the quota.
Conversely, implementation could improve if quota politicians work harder for their constituents. Chin and Prakash (Reference Chin and Prakash2011) report that ST quotas, but not SC quotas, result in lower levels of overall poverty. Deshpande and Weisskopf (Reference Deshpande2014) find that a greater proportion of high-level SC/ST employees in the Indian Railways is correlated with both increased productivity and growth. Evidence also suggests that women exert more effort and outperform men when positions of political influence are available to them (Beaman et al. Reference Beaman, Duflo, Pande and Topalova2010). Das, Mukhopadhyay, and Saroy (Reference Das, Mukhopadhyay and Saroy2017) argue that in the presence of asymmetric group sizes, affirmative action can improve the efficiency of outcomes. Finally, government performance could remain unchanged if quota politicians perform no better or worse than do non-quota politicians, as Bhavnani and Lee (Reference Bhavnani and Lee2019) find for Indian bureaucrats.
Intensive Margin (Distribution of the Pie)
We now turn to the impact of affirmative action on targeted and non-targeted historically disadvantaged communities and more privileged communities. While theoretical examinations predict positive results for targeted minorities, existing research from India on electoral reservations has found mixed effects. Besley, Pande, and Rao (Reference Besley, Pande and Rao2007), Duflo and Chattopadhyay (Reference Duflo and Chattopadhyay2004), and Beaman et al. (Reference Beaman, Duflo, Pande and Topalova2010) show that reservations for SC/ST and women improve the welfare of direct beneficiaries. Other work, such as Dunning and Nilekani (Reference Dunning and Nilekani2013) and Jensenius (Reference Jensenius2015), find no overall effect of electoral quotas on targeted groups. Unlike our case, one explanation for weak effects in the literature is the rotating nature of quotas in these contexts, which limits politicians’ incentives to target benefits along ethnic lines.
We expect targeted minorities to benefit under affirmative action. Less clear is what we should expect for non-targeted groups. We draw three hypotheses from existing literature for why gains for targeted minorities may alternatively result in positive, negative, or no spillovers to other groups.
Solidarity Hypothesis:Non-targeted minorities may experience positive spillovers from quotas targeting other minorities. Studies have found that minority politicians may carry intrinsic motivations—absent electoral motivations—to help individuals with whom they identify (Adida, Davenport, and McClendon Reference Adida and McClendon2016; Broockman Reference Broockman2013; Singh Reference Singh2015). They may also share policy preferences with other minorities: Kaufmann (Reference Kaufmann2003, 199) writes that African Americans and Latinos in the United States “share objective circumstances [and] interests” and may have a “minority group consciousness.” Consistently, Adida, Davenport, and McClendon (Reference Adida and McClendon2016) show that African Americans respond positively not only to co-ethnic but also to co-minority (Latino) political cues.
Under this hypothesis, therefore, minority groups not targeted by the quota should also benefit from improved program implementation. Some evidence from India is consistent with this prediction: SC reserved councilors increase village expenditures in a manner that benefits both SC and ST in their village (Palaniswamy and Krishnan Reference Palaniswamy and Krishnan2012).
These theories are largely silent on the expected effects on non-minorities. While one can extrapolate that this group will not benefit under this hypothesis because of a lack of solidarity with targeted minorities, it is unclear whether they will be worse off or remain at the status quo. As a consequence, there are also no clear predictions on what happens to outcomes on the extensive margin.
Crowding Out Hypothesis: Gains in descriptive representation for one minority group may come at the expense of benefits for non-targeted minorities, especially where targeted and non-targeted minorities are in competition. Meier et al. (Reference Meier, McClain, Polinard and Wrinkle2004) examine changes in representation among African-Americans and Latinos and find that improvements in administrative and teaching positions for one group are associated with losses for the other. Expectations of intercaste competition and negative spillover effects are captured by Khosla (Reference Khosla2011), who argues that as “different castes vie to capture NREGS benefits, they limit the access of other caste groups” (65).
Under this hypothesis, quotas could leave outcomes for non-minorities unchanged, especially if targeted minorities still live under social pressure from non-minorities or where non-minorities are not in competition for the same goods. Alternatively, if competition for resources exists, and if non-minority groups do not retain full control over their distribution, in a weaker version of the hypothesis, non-minority groups could suffer losses.Footnote 3 Extant evidence is limited: Jenkins and Manor (Reference Jenkins and Manor2017, 168) note that there is no systematic evidence from India that asks whether participation of “non-poor” in NREGS crowds out the “genuinely poor.” Overall, critics of affirmative action cite concern that negative spillovers will outweigh any benefits to the targeted group.
Performance Hypothesis: Unlike the previous hypotheses that examined the relationship between various groups on the basis of solidarity or competition, the performance hypothesis simply states that improvements for a targeted minority may come without necessarily incurring costs on other groups, if, for instance, quota politicians exert more effort than non-quota politicians. Beaman et al. (Reference Beaman, Duflo, Pande and Topalova2010) consider the effects of a quota for women on a non-targeted minority group, Muslims, and find that improved outcomes for women do not appear to crowd out benefits for Muslims. Iyer and Mani (Reference Iyer and Mani2012) find that quotas for women increase reporting of crimes against women but do not appear to affect reporting for crimes against men. Since the spirit of this hypothesis is to make a claim about the net effects of the quota, a weaker version of the hypothesis would state that potentially positive effects on the targeted minority are greater than or equal to any negative spillovers to other groups. A confirmation of the weaker version still carries significant implications for arguments against affirmative action rooted in claims that quotas will result in a loss in overall efficiency.
Table 1 summarizes the conflicting predictions offered by each of the three hypotheses.
Summary of Predictions

Context: Identity, Quotas, and Development in India
The Indian government has instituted numerous forms of political quotas since Independence. In the political arena, the constitution provides dramatic guaranteed representation through quotas for individuals from the Scheduled Tribes (ST), Scheduled Castes (SC), Other Backward Classes (or Other Backward Castes, OBC), and/or women in the national parliament, state legislatures, and from 1993 in the country’s three-tier system of local government councils, called Panchayati Raj. Footnote 4
Scheduled Areas in India
We focus in this paper on India’s Scheduled Areas, a government institution targeting tribal populations that has not yet been subject to systematic quantitative analysis. Scheduled Areas cover over 100 million citizens across nine Indian states—Andhra Pradesh, Chhattisgarh, Gujarat, Himachal Pradesh, Maharashtra, Madhya Pradesh, Jharkhand, Odisha, and Rajasthan.
The demarcation of Scheduled Areas has changed little since the initial formulation during the pre-Independence period. British authorities first provided a list of “Aboriginal Tribes” and “Semi-Hinduised Aboriginal Tribes” in the Census of 1872 (Corbridge Reference Corbridge2002, 64) and implemented special institutions targeting these tribes under the Scheduled Districts Act of 1874. Following Independence in 1947, the new Indian state identified Scheduled Areas in the Fifth Schedule of the Constitution, with minor differences from the British Scheduled Districts Act. The government justified Scheduled Areas specifically as a means to improve representation and welfare for Scheduled Tribes (ST) through special programs and institutions such as the state-level Tribes Advisory Council.Footnote 5
The Constitution assigns responsibility for adding, subtracting, or modifying Scheduled Areas to the President in consultation with the relevant state’s Governor. In 1962, the Dhebar Commission proposed that an area should be eligible to become a Scheduled Area according to four, relatively vague, criteria: (i) preponderance of tribals in the population, (ii) compact and reasonable size, (iii) underdeveloped nature of the area, and (iv) marked disparity in economic standards of the people. In practice there has been no exact formula for updating or adjusting the previous notification or denotification of Scheduled Areas in India, and these Areas have remained remarkably stable since their initial formulation (see Appendix A).
Panchayat Extension to Scheduled Areas
Despite government commitments to promote ST interests in Scheduled Areas, villages on opposing sides of the Scheduled Areas border show few differences on observables or over-time trends prior to the implementation of the local-level political quotas that we study in this paper. Indeed, additional legislation instituting political quotas were designed in large measure to give Scheduled Areas teeth.
The Panchayats Extension to Scheduled Areas Act of 1996 (PESA) mandated that all chairperson positions at the three levels of local government, and at least 50% of all seats on these councils, be reserved for ST individuals. Hence, when local elections were next held—as early as 2000 for Rajasthan and as late as 2010 for Jharkhand—these reforms gave a tremendous positive shock to the local-level political representation of Scheduled Tribes in India. Unlike other quotas in India that rotate by constituency and over time, the quotas in Scheduled Areas introduced with PESA remain fixed.
To summarize, in the research design to follow, we will be comparing villages in (non-Scheduled) areas where local elections were introduced from 1992, due to the Panchayati Raj Act, with (Scheduled) villages where elections were only rolled out beginning in 1996, with PESA.
Quotas and Political Conflict: A Case Study of Jharkhand
By way of more detail, we provide a case analysis of the state of Jharkhand that has had arguably the most politically charged and turbulent path to local elections with quotas in Scheduled Areas. Even in this politically fraught case, the actual boundaries of the Scheduled Areas have remained relatively unchanged. While Jharkhand passed an amendment in 2001 to allow for PESA-compliant panchayat elections, a legal challenge postponed elections. Only after a decision by the Indian Supreme Court in 2010, upholding the constitutional status of identity-based quotas in India, were local elections held in Jharkhand in 2010.Footnote 6
Although the state of Jharkhand was created in part to better represent tribal populations in the state of Bihar, the actual Scheduled Areas within this region did not change. The Scheduled Areas assigned as part of the Indian Constitution’s Fifth Schedule remained almost entirely consistent through the Bihar Scheduled Areas Regulation of 1969 and renotification again in 1977 and 2007. The only changes were the addition to the Scheduled Areas of a single block—Bhandaria of the Garhwa district—in 1977 and the Scheduling of two village clusters, both within Satbarwa block, in 2007.Footnote 7
Comparisons across Indian Identity Categories
The ST are not the only historically disadvantaged minority category in India or the only category targeted via special legislation. Others include the Scheduled Castes, Other Backward Classes (OBC), and women. While OBC also receive mandated representation in local government outside of Scheduled Areas in India, on average, and in taking India as a whole, SC and ST communities in existing literature are considered the most stigmatized, economically vulnerable, and politically excluded communities.
The Indian government has acknowledged the vulnerable position of SC and ST communities and accordingly regularly groups SC and ST together for the purposes of special legislation.Footnote 8 Outside of Scheduled Areas that privilege ST, since 1992 all local government councils across the country restrict local council leadership positions for SC and ST, using identical quotas in proportion to their local population that rotate every election cycle (see Duflo and Chattopadhyay Reference Duflo and Chattopadhyay2004; Dunning and Nilekani Reference Dunning and Nilekani2013).
Both popular and academic writing often describe SC and ST in tandem as examples of minority groups that are the poorest and most vulnerable throughout the country. The Indian government even studies the development of individuals from both groups together via the elite, national government appointed, Planning Commission.Footnote 9 For these reasons, we consider outcomes for SC a useful comparison with ST outcomes—as both groups are similarly vulnerable, yet enjoy very different political opportunities in Scheduled Areas. Appendix A provides more details about political quotas in India and SC and ST identity categories.
Local Government and Development
Local government panchayat institutions in India are responsible for two key aspects of development: welfare schemes and infrastructure, each of which provide local public goods (see Besley, Pande, and Rao Reference Besley, Pande and Rao2007). Existing literature identifies roads, sanitation, electricity, water, telephones, school and health facilities, irrigation, and communication as important development sectors for measuring performance of panchayat institutions (Cassan and Vandewalle Reference Cassan and Vandewalle2017; Munshi and Rosenzweig Reference Munshi and Rosenzweig2015). Our empirical goal is to measure how political reservations affect the implementation of government programs.
The National Rural Employment Guarantee Scheme (NREGS)
As our key outcome, we chose NREGS, India’s largest development program and the largest employment program in the world. The NREGS and rights-based policies in India build on prior legislation on decentralization and devolution of power to local government agencies. Kapur and Nangia (Reference Kapur and Nangia2015, 76–77) classify this welfare scheme as part of the lowest tier of social protection in India that covers the vast majority of workers in the country (up to 94%). Together with other programs like the Public Distribution System and the National Social Assistant Program, NREGS is a risk-coping, instead of risk-mitigating, program that provides protection to those already at risk.
The scheme officially guarantees 100 days of minimum-wage employment to every rural household in the country, with no eligibility requirements. Though increases in welfare spending in general might come at the expense of other spending priorities, NREGS funding comes primarily from federal and state budgets. Accordingly, local politicians who do not take full advantage of the NREGS program are effectively “leaving money on the table.”Footnote 10 Jenkins and Manor (Reference Jenkins and Manor2017) document how NREGS has helped improve the lives of the poorest in India.
Work given out under the NREGS is a product of a large ecosystem that includes informal institutions, bureaucrats, and collective deliberation (Dutta et al. Reference Dutta, Murgai, Ravallion and van de Walle2014; Khosla Reference Khosla2011; Marcesse Reference Marcesse2018). However, recent research shows that village-level politics are likely to play an outsized role in the distribution of NREGS benefits (Marcesse Reference Marcesse2017) (see Appendix A). Local-level council chairpersons—whose seats are reserved for ST under the Scheduled Areas quota—have both the capacity and discretion to significantly alter the quality of NREGS implementation and the distribution of NREGS benefits (Besley, Pande, and Rao Reference Besley, Pande and Rao2007; Dasgupta and Kapur Reference Dasgupta and KapurForthcoming; Dunning and Nilekani Reference Dunning and Nilekani2013; Dutta et al. Reference Dutta, Murgai, Ravallion and van de Walle2014; Marcesse Reference Marcesse2018; Sukhtankar Reference Sukhtankar2017).
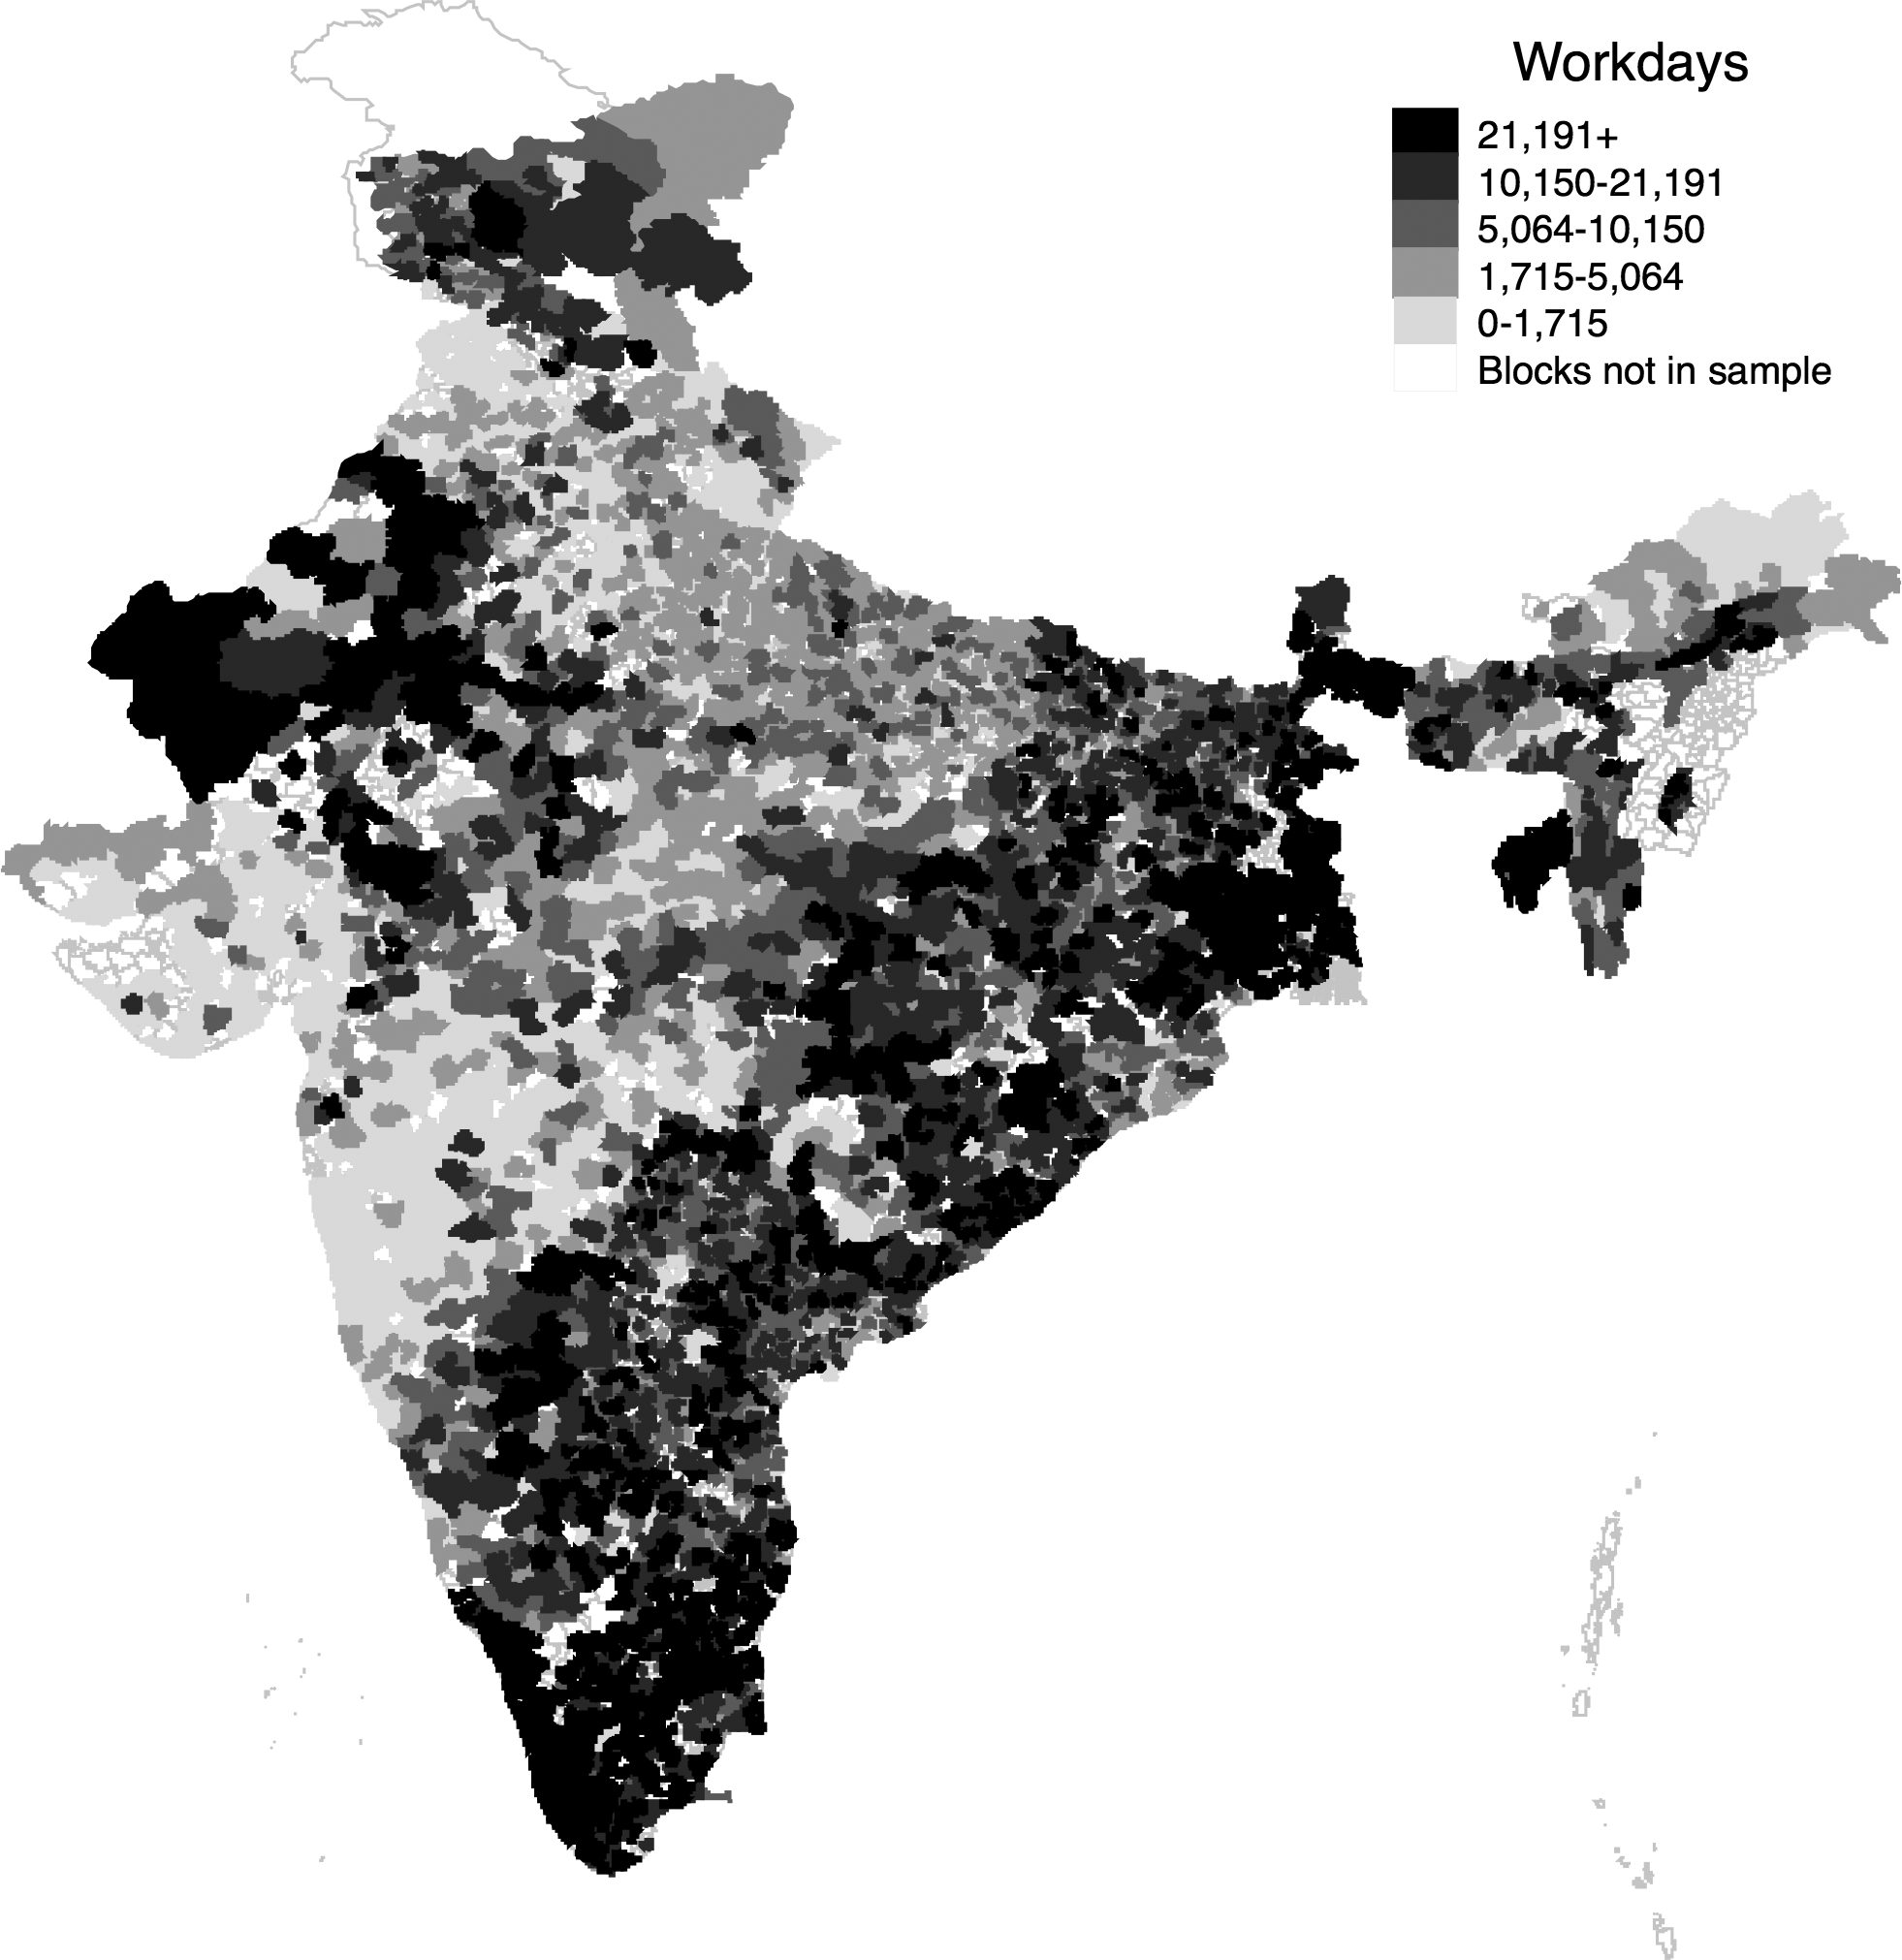
The NREGS has bolstered the legitimacy and efficacy of local governments by empowering local-level authorities. These authorities are responsible for selecting projects through collective deliberation in village assemblies, selecting program beneficiaries, implementing at least 50% of all works, maintaining and transmitting records to higher authorities to process payments, and responding to citizens’ appeals for work (Besley, Pande, and Rao Reference Besley, Pande and Rao2007; Dunning and Nilekani Reference Dunning and Nilekani2013; Jenkins and Manor Reference Jenkins and Manor2017; Marcesse Reference Marcesse2018; Munshi and Rosenzweig Reference Munshi and Rosenzweig2015; Sukhtankar Reference Sukhtankar2017). While NREGS implementation remains uneven (see Figure 1), the scheme’s implementation carries political rewards. Good NREGS performance can also be an election-winning device in local politics (Maiorano Reference Maiorano2014, 95).
Variation in 2013 NREGS Workdays Across India

Following changes in representation, and consistent with our theoretical conceptualization above, we can expect changes in both demand and supply to affect change in NREGS work outlay.
On the demand side, at least two stories of change emerge. On one hand, ST might feel more comfortable requesting work when an ST politician is elected (Gille Reference Gille2018). On the other hand, non-SC/ST may opt out of demanding work from ST politicians due to associated social stigma (Akerlof and Kranton Reference Akerlof2010; Gille Reference Gille2013; Moffitt Reference Moffitt1983). The latter possibility is unlikely because NREGS targets poor households and individuals in rural areas with work such as digging ditches and building wells. This is work that is “physically taxing, of uncertain duration, and provides no employment benefits” (Dutta et al. Reference Dutta, Murgai, Ravallion and van de Walle2014, 14). The NREGS was designed for those most in need of work, and as a last resort. Put differently, “By insisting that participants do physically demanding manual work at a low wage rate, workfare schemes such as MGNREGS aim to be self-targeted” (Dutta et al. Reference Dutta, Murgai, Ravallion and van de Walle2014, 40), as the “nonpoor will not want to do such work, and poor people will readily turn away from the scheme when better opportunities arrive” (Dutta et al. Reference Dutta, Murgai, Ravallion and van de Walle2014, 5).
More generally, we expect that changes in supply will have greater explanatory power than will changes in demand. Prior research indicates that the binding constraints on NREGS implementation are not demand-side but are driven almost entirely by supply-side factors (Khosla Reference Khosla2011). Dutta et al. (Reference Dutta, Murgai, Ravallion and van de Walle2014, xxv) write that “unmet demand for work is the single most important policy-relevant factor in accounting for this gap between actual performance and the scheme’s potential.” Jenkins and Manor (Reference Jenkins and Manor2017, 69) write that while NREGS promises jobs on demand, “many, if not most, poor rural people have little or no experience of making direct demands on authority figures.” Similarly, Marcesse (Reference Marcesse2018) argues that demand itself is affected by incentives of supply agents.
Beyond NREGS: Rural Roads and Other Public Goods
In addition to welfare schemes, we take two approaches to evaluate broader impacts on public goods. First, we examine the effects of Scheduled Areas on PMGSY, the Prime Minister’s Village Road Program. This program was established in 2000 to connect rural villages to the all-weather road network by focusing on constructing and upgrading feeder roads that either did not exist or were unpaved (Asher and Novosad Reference Asher and Novosad2020). As of 2001, only about half of the 600,000 villages in India were connected to such roads. Importantly, “100 percent funding for construction [under this program was provided] by the Central Government” (ILO 2015).
As with NREGS, local politicians are critical to PMGSY’s implementation, whereby a standardized planning process is in place that incorporates representatives from district, block, and village councils. In fact, the key role of local governments in helping carry out construction and maintenance of roads at the local level has been inspired by their success doing the same under NREGS (ILO 2015). Note, however, unlike NREGS, PMGSY is not a rights-based program. While individuals and households apply for job cards and work under NREGS, PMGSY necessitates more centralized planning. Local community inputs are filtered through the gram panchayats, which play a key role in planning for road upgrades and maintenance and whose elected representatives sit on important PMGSY committees (ILO 2015, 24). Coordination for road links across gram sabhas begins at the block level, where committees comprising key officials, including those of the gram sabha, decide on allocations that are finalized at the district level.
In addition to the PMGSY program, we also take a more systematic approach to studying effects on public goods outcomes by using data from the 2011 Indian Census—roughly 10 years following the implementation of PESA.
Data Construction
To systematically assess how the Scheduled Areas political quota affects development outcomes, we construct a village-level dataset for the nine states that have Scheduled Areas. We begin by using the Socioeconomic High-resolution Rural-Urban Geographic Dataset for India (SHRUG) (Asher and Novosad Reference Asher and Novosad2019). This dataset allows us to track the same villages over three different Census waves: 1991, 2001, and 2011. The SHRUG includes limited Census data from these waves and data on the PMGSY roads program.
While SHRUG provides information at the village level, NREGS outcomes are measured at the village-cluster (gram panchayat) level. We utilize a directory from the Indian Water Ministry as a matching directory for village and village-cluster data and then apply fuzzy matching methods to combine SHRUG and NREGS into a single dataset. We next add information on reservations: both on whether a village falls within or outside of the Scheduled Areas and whether a village falls within an Assembly Constituency that is reserved for ST, for SC, or not reserved. Our final step is to merge the combined dataset with spatial data, as well as with a more complete set of Census variables than was available from SHRUG, on villages from the 2001 and 2011 Indian Censuses. These additional Census data were procured from InfoMap India.
Outcome Variables
We use data on three central outcomes of interest from NREGS during 2012–2013: Jobcards are the total number of identification documents issued to prospective workers before they can request to be hired under the program, Worked are the number of households that received work under the program in the year, and Workdays measures the total number of days worked by individuals under the program. These measures were collected at the lowest level for which they are recorded, the village cluster, from the official NREGS portal.
Critically, NREGS data provides all three outcomes for ST, for SC, and for those who are neither SC nor ST, separately.Footnote 11Figure 1 shows that there is considerable variation in program implementation across India.
We supplement our main analysis by considering effects of the quota on road construction under the PMGSY program (from SHRUG) and on public goods provision (2011 Census, but only available for a subset of villages, called market villages; see Appendix D for details).
Scheduled Areas
Our key independent variable is an indicator for whether a village is or is not part of the Scheduled Areas. We obtained information on Scheduled Areas status from the Government of India’s Ministry of Tribal Affairs (see Appendix B for data sources). States release official documents either listing specific villages as Scheduled or, where all villages within a block or district are Scheduled, the names of those blocks and districts. While two states list individual village names (Andhra Pradesh and Rajasthan), the remaining states list block and district names.
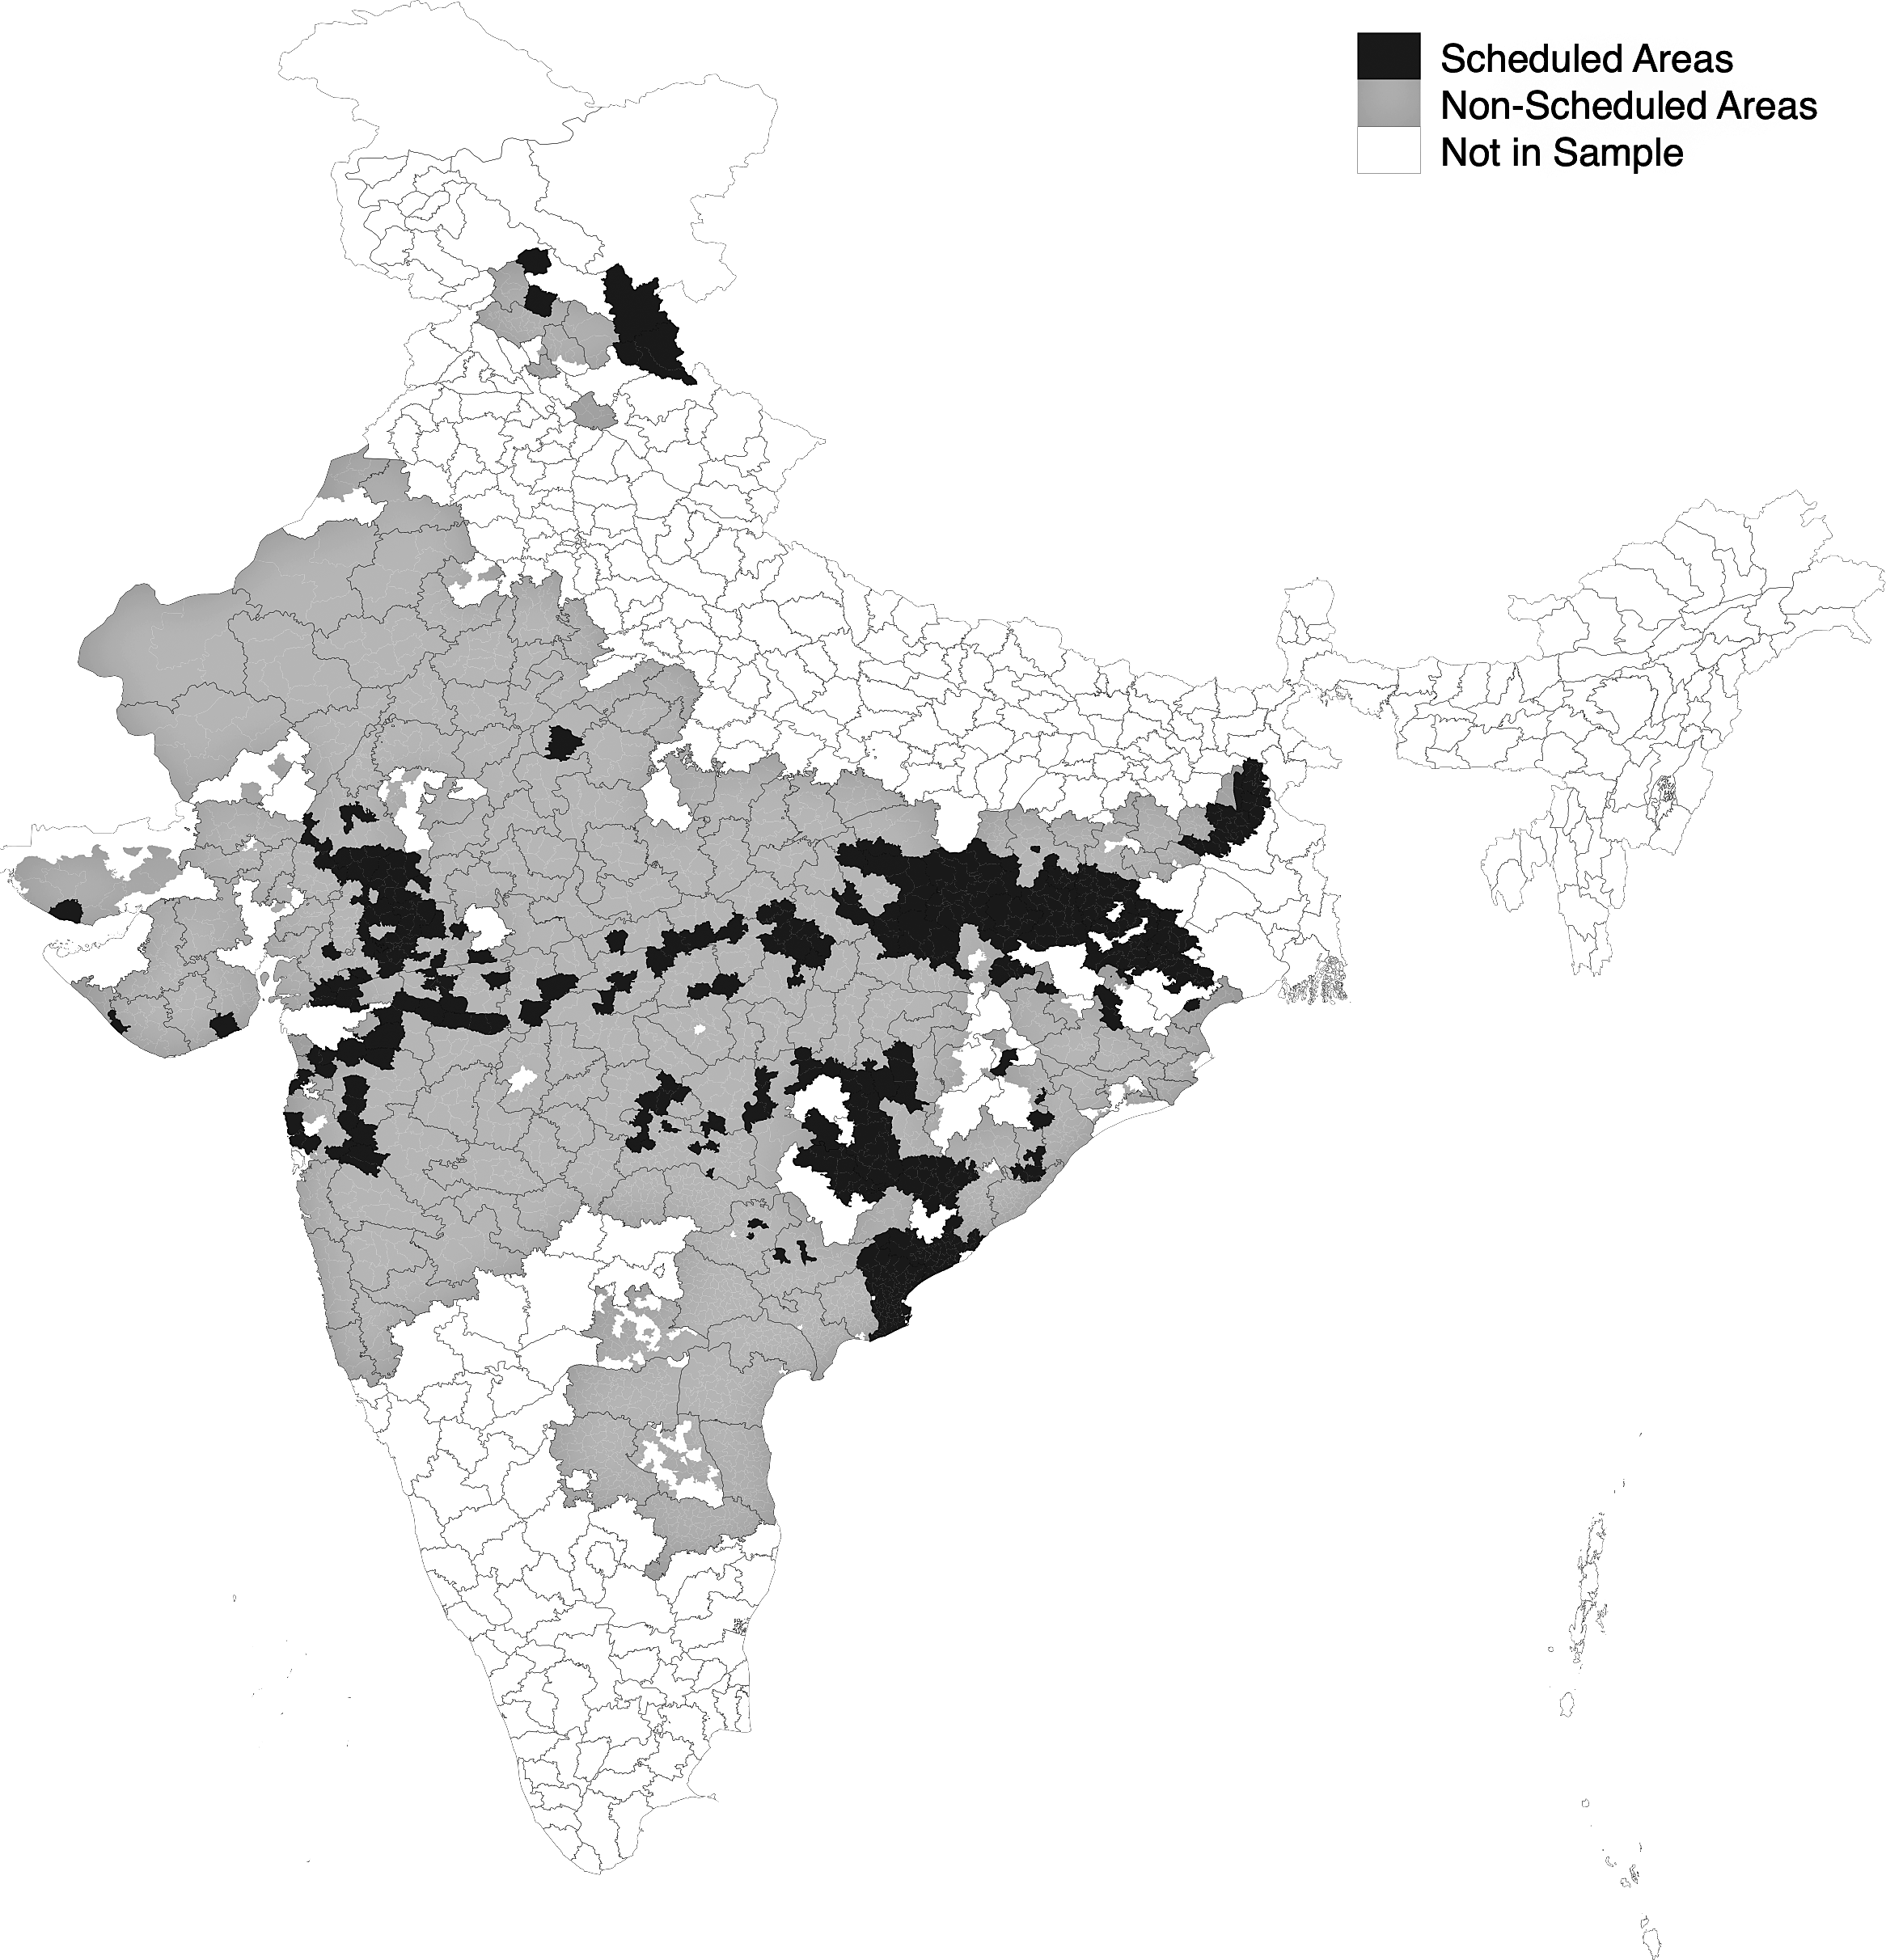
To remain consistent in our coding strategy across states, and to avoid human error that was more likely to occur had we manually coded each village as Scheduled or not in the two states that released information at this level, we elected to code an entire block as Scheduled if any village was designated as Scheduled within the block. Empirically, this approach is conservative because, while it accurately codes Scheduled Areas when all villages in a district and block are inside the treatment area, it codes some untreated villages within a block as treated—that is, the resulting bias will be in the direction of zero. Our coding is illustrated spatially in Figure 2 and we present a validation exercise in Appendix B.
Scheduled Areas in India

Control Variables
Our control variables, as well as the variables we use to evaluate sorting and over-time changes, are sourced from the Census (for 1991, from SHRUG, and for 2001, from the 2001 Census shape files).
Summary Statistics
We combine 1991, 2001, and 2011 census data with NREGS data, Scheduled Areas coding, and data on the PMGSY roads program. The dataset successfully matches approximately 217,000 of the 274,026 villages (79%) in the sample, and 19% of the villages in our data are coded as belonging to a Scheduled Area. The ST comprise about 28% of the population, while SC are only 13% of the population. Non-minorities form the remaining 59%. Appendix C presents summary statistics.
Empirical Strategy
Geographic Regression Discontinuity
Consider two proximate villages lying on opposite sides of the Scheduled/non-Scheduled boundary. If they are sufficiently similar on observable characteristics, we can say that the only difference between the two villages is that one village lies in a Scheduled Area while the other is in a non-Scheduled Area. We approximate this thought experiment with a geographic regression discontinuity design that restricts attention to villages geographically proximate to a boundary dividing Scheduled Areas and other areas within a state.Footnote 12 We use the following specification:
 $$ {y}_{vgs}\kern0.5em =\kern0.5em \upgamma ScheduledAre{a}_{vgs}+{a}_s+f\left({X}_{vgs},{Y}_{vgs}\right)+{Z}_{vgs}^{\prime}\phi +{\epsilon}_{vgs} $$
 $$ \forall v\;s.t.{X}_{vgs},{Y}_{vgs}\in \left(-h,h\right), $$
where  $$ {y}_{vgs} $$ refers to outcomes for village
 $$ v $$ in gram panchayat
 $$ g $$ and state
 $$ s $$. The official NREGS portal only releases data at the gram panchayat level. In the NREGS regressions, all villages in the same gram panchayat are assigned the same outcome value, whereas for Census 2011 and PMGSY,
 $$ y $$ varies at the village level. Although treatment is assigned at the village level, we cluster standard errors at the gram-panchayat level throughout the paper. This has the benefit of correcting for outcome interdependence within the gram panchayat in the NREGS analysis.
 $$ ScheduledAre{a}_{vgs} $$ is the treatment variable that equals 1 if a village is coded as being in a Scheduled Area, and 0 otherwise. Outcomes that are left-skewed are logged such that
 $$ \gamma $$ can be interpreted in percentage terms. State fixed effects
 $$ {a}_s $$ account for any state-level shocks, including the different timing of PESA implementation, and
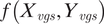 $$ f\left({X}_{vgs},{Y}_{vgs}\right) $$ is a flexible smooth function in two dimensions, latitudes (
 $$ X $$) and longitudes
 $$ (Y $$).Footnote 13 Adding these geographic controls helps the regression absorb spatial trends that might be superfluously driving results.
For each village, we calculate distance in kilometers  $$ h $$ to a Scheduled Areas border within the same state so that we may compare villages that provide the closest approximation to random assignment. Based on bandwidth-selection algorithms (see Appendix Table A3), we take a conservative bandwidth of 10 kilometers as our standard bandwidth (
 $$ h $$). Ten kilometers is about one-fifth the size of the median distance (54.4 kilometers), and about one-ninth the mean distance (91.3 kilometers), from the border in the data (see Appendix Figure A7). Last, we include a vector of all village-level Census 2001 indices as well as 1991 and 2001 SC and ST population shares,
 $$ {Z}_{vgs}^{\prime } $$.
Throughout the analysis, we conduct various robustness tests including varying bandwidths and functional forms and considering alternate transformations of outcomes. For our main NREGS outcomes, we also report Conley (Reference Conley1999) standard errors that account for spatial spillovers.
Analysis of Balance with Census Data
With pretreatment census data at the village level from 2001 and population data from 1991, we analyze balance by evaluating whether Scheduled Area predicts census variables. To manage the vast number of 2001 census variables, we collapse the 140 variables into 14 substantively meaningful indices by taking the simple mean of their standardized values (see Appendix H).
Overall, we find that the geographic RD model yields good balance between Scheduled and non-Scheduled Areas. While we are able to tell the two groups apart in some cases statistically because of the large sample size, the substantive differences across Scheduled and non-Scheduled Areas are small: only three indices, water, urbanization, and banking, exceed 0.1 standard deviations. Even in these cases, the differences stay below 0.22 and two of the three larger differences are positive, suggesting that development is higher in Scheduled Areas on these dimensions, which should bias any treatment effects towards zero. More substantively, the differences we do observe tend toward zero as the bandwidth of analysis shrinks. For all variables we can trace across the 1991 and 2001 census waves, there is little reason to believe that the baseline differences are trending differently over time in Scheduled versus non-Scheduled Areas, indicating that controlling for level differences between Scheduled and non-Scheduled Areas may be sufficient, and sensitivity analysis shows that the magnitude of correlations for confounders would need to be much larger than those observed for the three most imbalanced indices for omitted variables to be an important source of bias in treatment estimates. Nevertheless, in our analysis below we control for population shares and all fourteen 2001 indices, both imbalanced and balanced, and conduct additional robustness tests that further ameliorate concerns that imbalance might drive our observed treatment effects (see Appendices C and D for details).
The Impact of Scheduled Areas
Effects on the National Rural Employment Guarantee Scheme (NREGS)
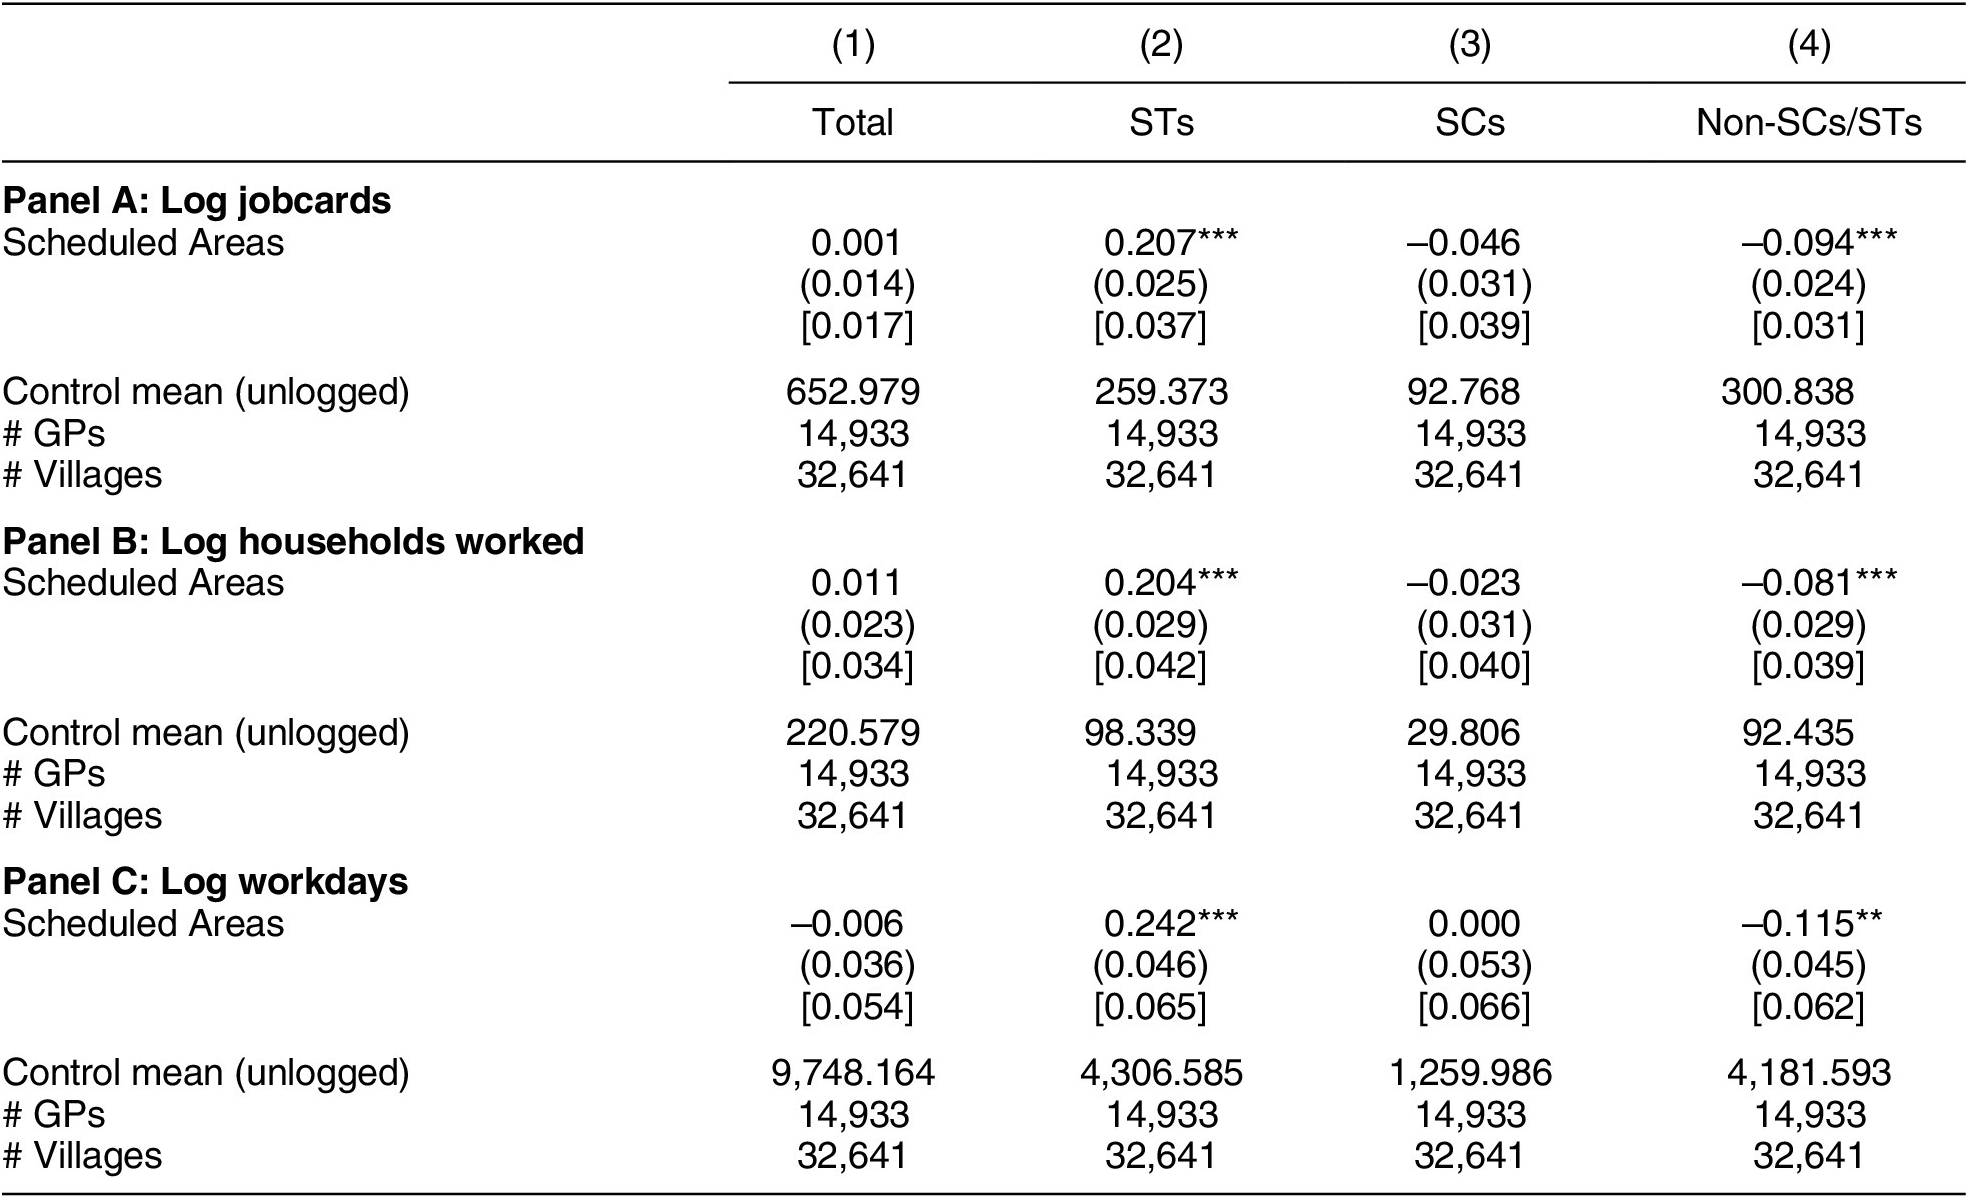
Table 2 presents the main results on NREGS outcomes. The first column shows treatments effects at the extensive margin, while the remaining three columns decompose this effect across ST, SC, and Non-SC/ST categories.
The Effect of Scheduled Areas on NREGS (10-kilometer RD)

Note: *p < 0.10, **p < 0.05, ***p < 0.01. Standards errors clustered by GP in parentheses. Conley (Reference Conley1999) standard errors in brackets.
Our first finding is that NREGS outcomes improve substantially for ST. As shown in column 2, 20.7%  $$ (p<0.01 $$) more job cards are issued to STs in Scheduled Areas. This result carries forward to the number of households that receive work during the year through NREGS—the coefficient reflects a 20.4%
 $$ (p<0.01 $$) increase. Overall, the number of workdays STs receive increases by 24.2%
 $$ (p<0.01 $$), a jump of about 1,040 more days of work.Footnote 14 Second, there is strong evidence that non-SC/STs are the main losers, as shown in column 4. Not only does this group receive 9.4%
 $$ (p<0.01 $$) fewer job cards in Scheduled Areas, they also suffer a reduction in the number of households employed (8.1%;
 $$ p<0.01 $$) as well as the total number of workdays (11.5%;
 $$ p<0.05 $$). Third, we find no evidence that SCs are worse off under Scheduled Areas: the point estimates on all variables are substantively small and are not statistically distinguishable from zero. Finally, putting these results together in column 1, there is no evidence that Scheduled Areas affect the extensive margin of program implementation—the total amount of work remains the same across Scheduled and non-Scheduled Areas, as the point estimates on outcomes are small, ranging from 1% on households worked to 0% on job cards.Footnote 15
Robustness
In Appendix D we show that our results are robust to a number of tests, including various functional forms, bandwidths, spatial-grid fixed effects, transformations of outcomes, restrictions to balanced subsamples, and controls for the number of matched villages. In addition, we take a few different approaches to allay concerns about omitted variables explaining results. First, standardized treatment effects are larger than, or at the very least equal to, the degree of standardized imbalance; further, we show that once population levels are controlled for, controlling for imbalanced 2001 Census indices barely affects point estimates, suggesting that Census indices explain minimal variation in the outcomes. Second, treatment effects are similar if we match villages on all census indices, population shares, a spatial function, and distance to the border.
Impacts on the Rural Roads Program (PMGSY)
Are there implications of instituting electoral quotas beyond the effects we observe on NREGS? Finding evidence of broader effects will improve our confidence that the institution of Scheduled Areas improved the lives of poor communities. It would also help allay the concern that changes in NREGS come at the cost of changes in other programs.Footnote 16
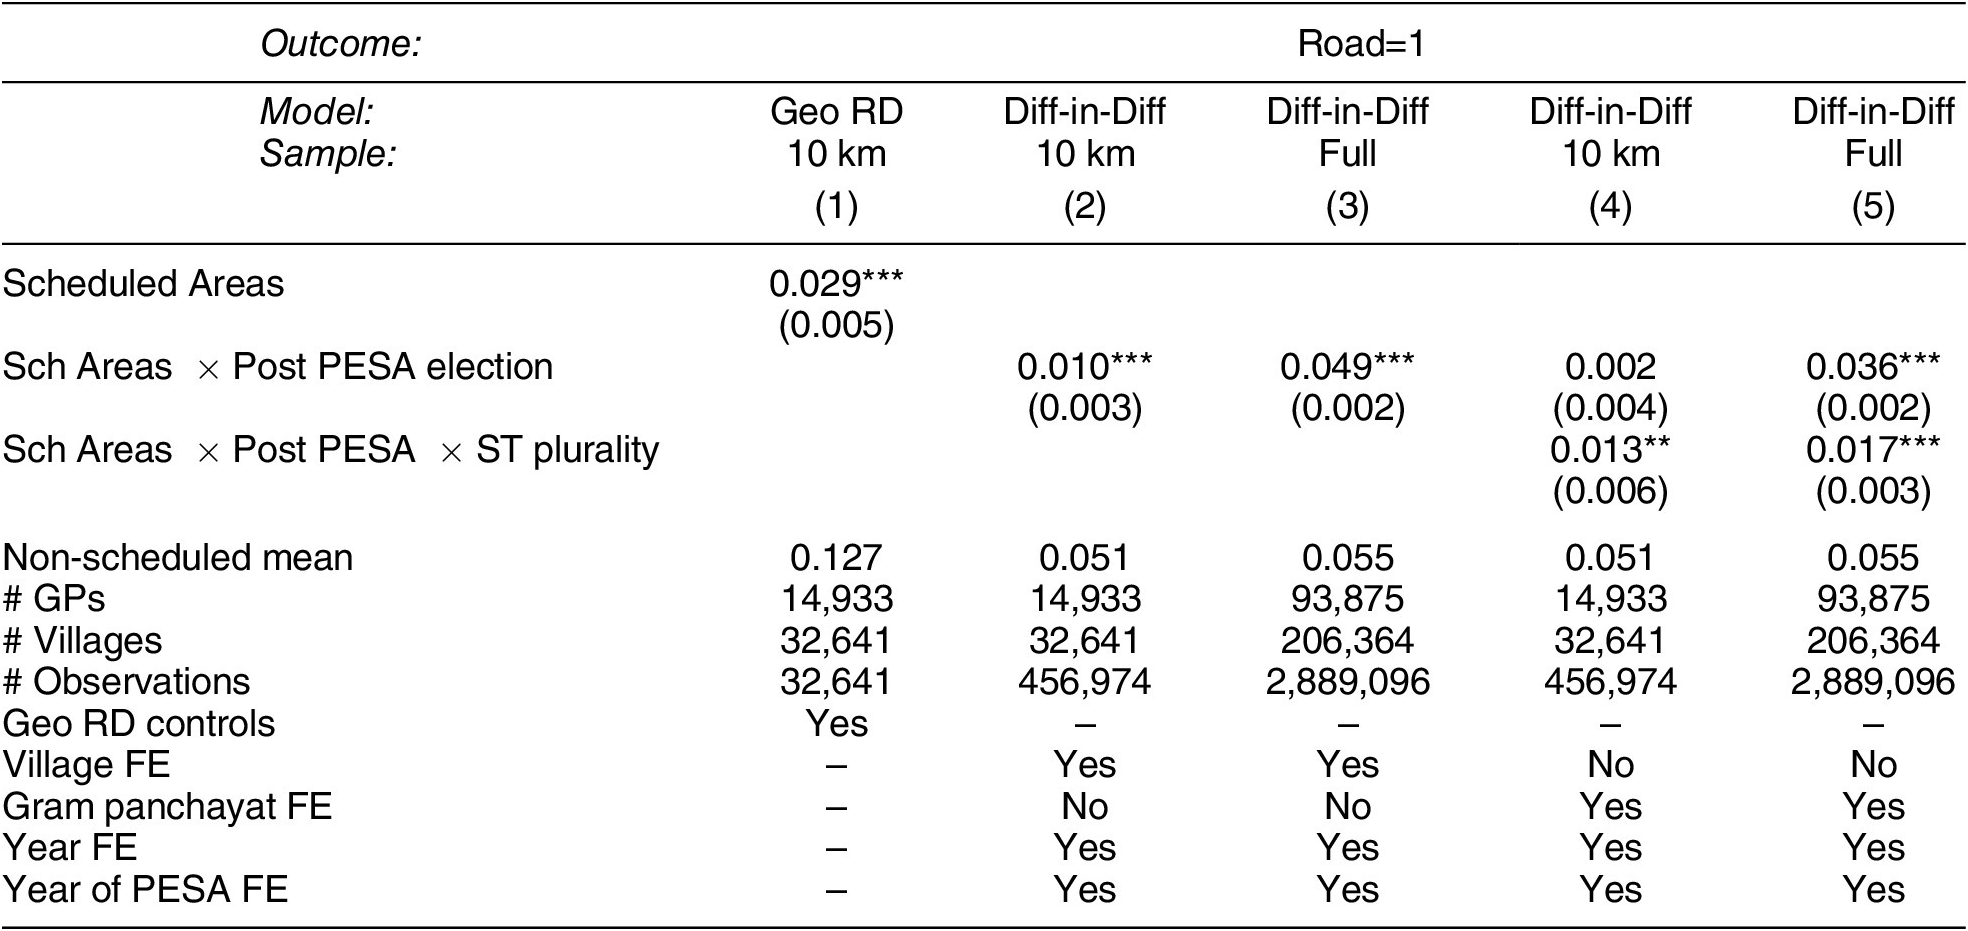
We first consider the effects on the PMGSY roads program. Column 1 of Table 3 shows that villages in Scheduled Areas are about 3 percentage points more likely to have completed roads through the program by using our geographic RD specification.
The Effect of Scheduled Areas on Rural Roads (PMGSY)

Note: *p < 0.10, **p < 0.05, ***p < 0.01. Standard errors clustered by GP. Models include all constituent terms of interactions.
An important feature of the PMGSY data is the time variation in road construction, which, along with state-by-state variation in the implementation of PESA elections, affords us the opportunity to study the effects of Scheduled Areas on roads before and after the introduction of electoral quotas. Using village, year, and fixed effects for years since PESA elections, a difference-in-differences strategy allows us to consider within-village changes in PMGSY implementation over time.
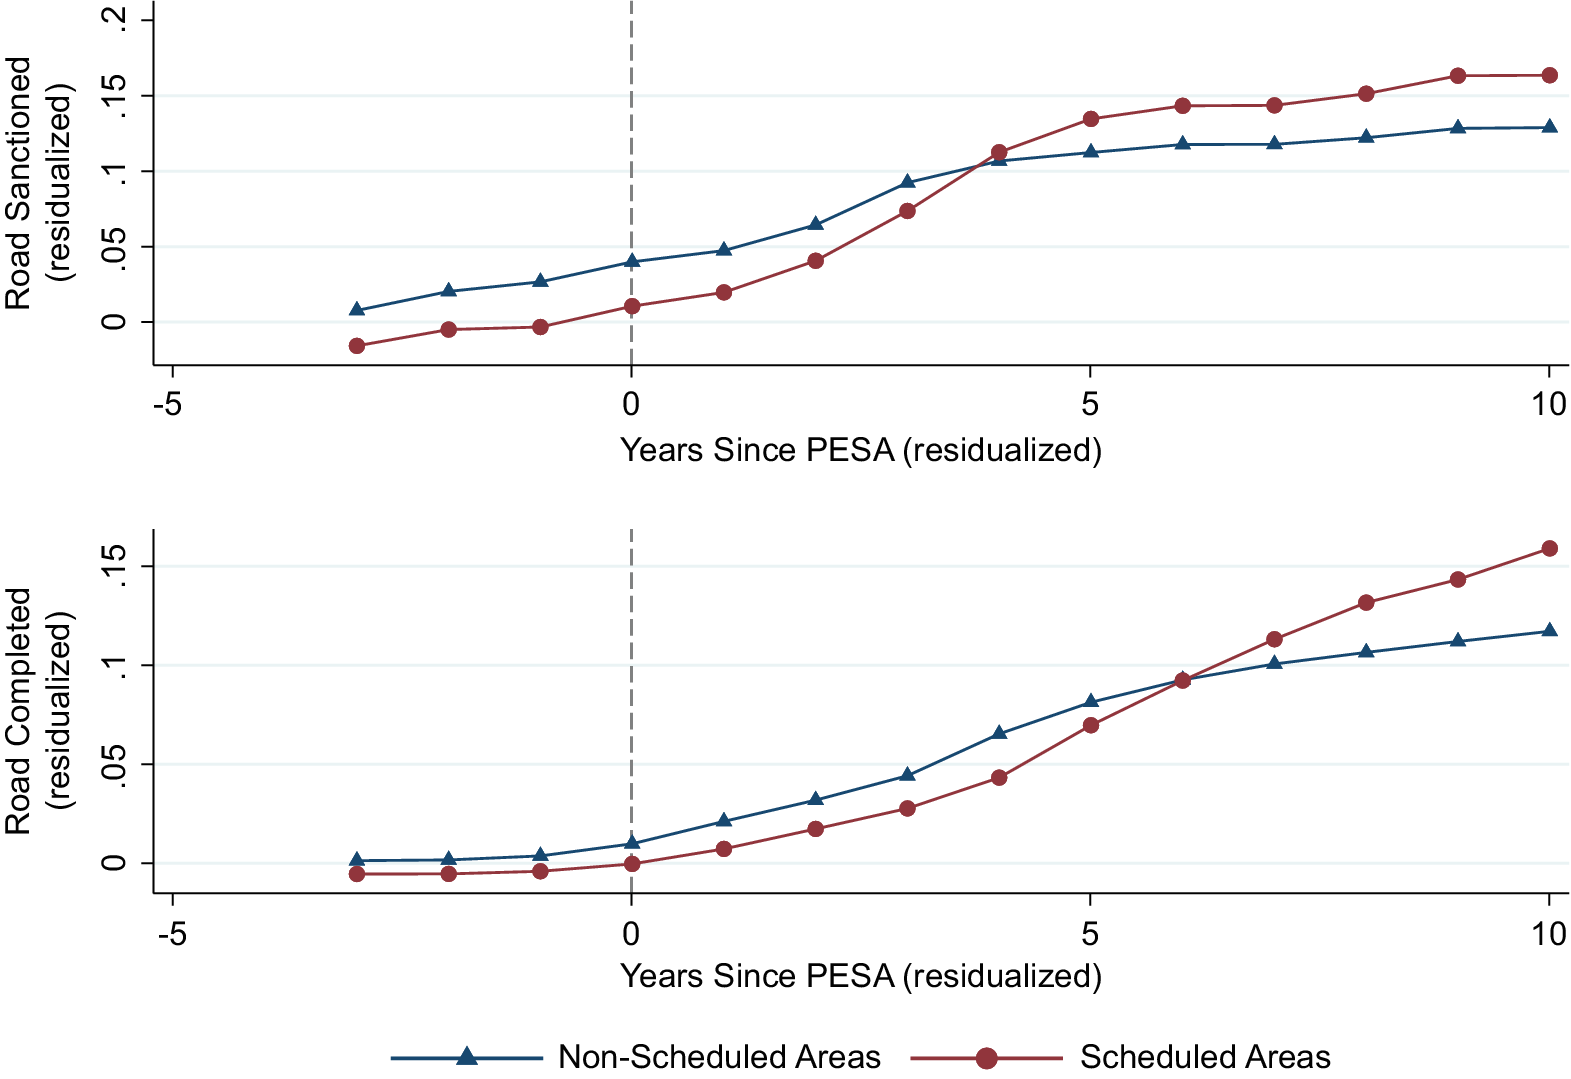
In column 2, where we continue looking only at the 10-kilometer geographic RD sample, we find that villages in Scheduled Areas are 1 percentage point more likely to have a PMGSY road after the introduction of PESA elections, an effect size of about 20% compared against the non-Scheduled Area mean of 0.05. This effect increases to nearly 5 percentage points (an increase of about 90%) using the full dataset of villages. Additionally, Figure 3 shows that road sanctioning increased in Scheduled Areas soon after the introduction of elections but not before. Effects on the completion of roads followed after a few years.
The Effect of the Introduction of PESA Election on PMGSY Roads

How are roads distributed across identity categories? Unlike NREGS, where distributional effects can cleanly be estimated as the data are disaggregated by identity category, roads are a nonexcludable good and therefore are harder to match to the identity of beneficiaries. However, as shown in columns 4 and 5 of Table 3, which considers within-gram-panchayat variation, while villages with an ST minority are more likely to receive a road in Scheduled Areas after PESA, ST plurality villages are even more likely to have a PMGSY road completed.Footnote 17 Though these are heterogeneous effects, they indicate that ST politicians treat roads similarly to NREGS, channeling resources to ST.
Impacts on Public Goods
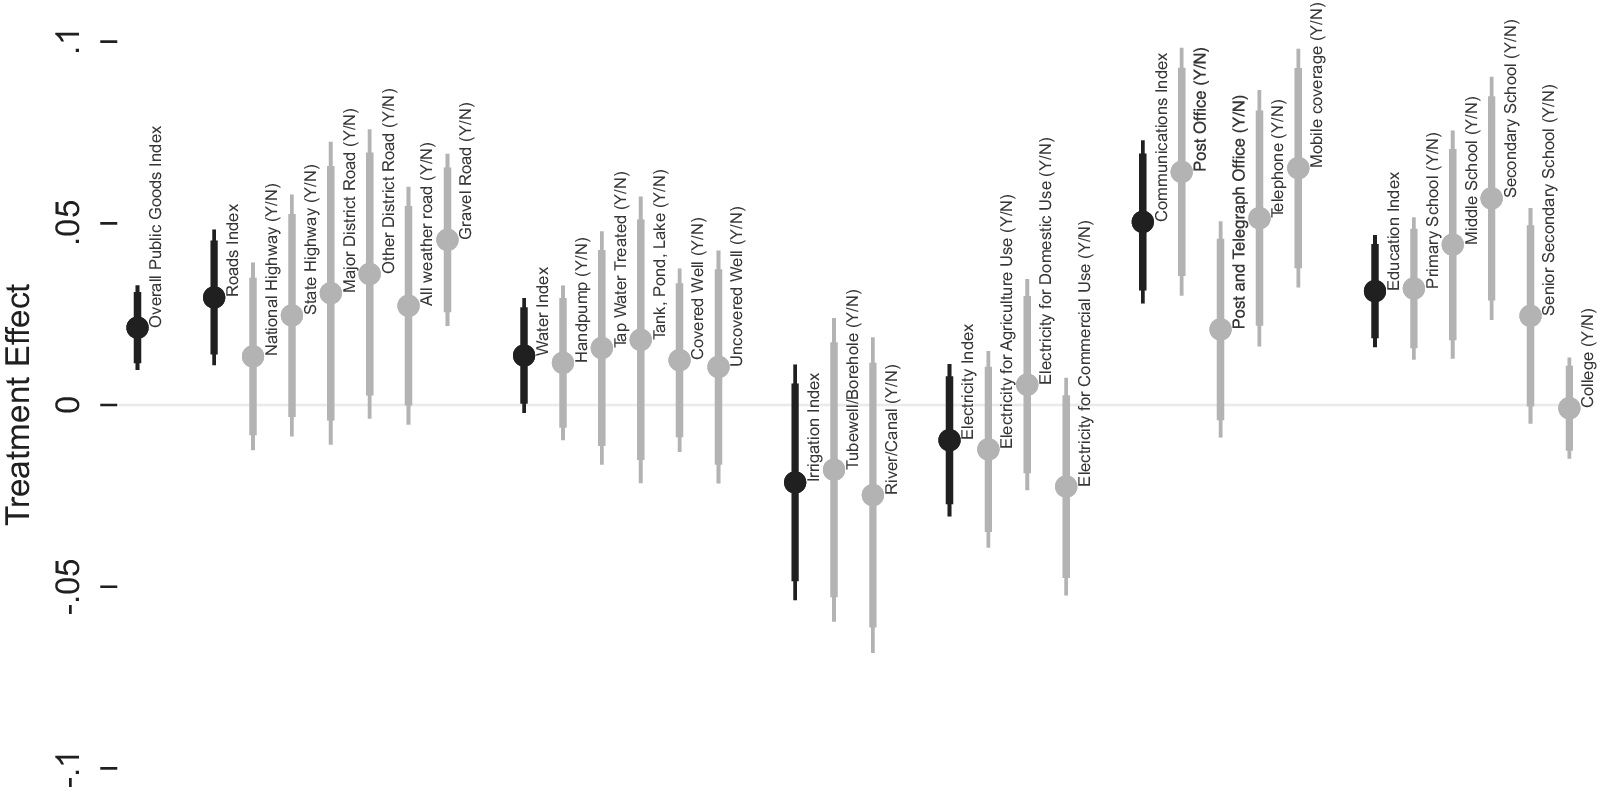
Guided by the literature on the responsibilities of local governments in India detailed in the Context section, we also evaluate the effect of Scheduled Areas more broadly on public goods using data from the 2011 Census. We construct six mean indices that take the average of binary indicators on the presence of particular public goods in a village, such as whether there is a gravel road. These indices measure the average provision of roads, water, irrigation, electricity, communication, and education. Similarly, an overall public goods index averages all individual public goods indicator variables.
Overall, the results presented in Figure 4 show that public goods provision in Scheduled Areas improved by 2011, particularly in terms of road, water, communication, and education access. The results on roads are consistent with our earlier results: we see positive treatment effects on the most local kinds of roads, gravel roads, projects that are targeted specifically by the NREGS program.Footnote 18
The Effect of Scheduled Areas on Public Goods (Census 2011)

Discussion: Bringing the Results Together
Evaluating Hypotheses
In light of these results, we return to the competing hypotheses suggested by the literature that we summarized in Table 1. First, we consider the NREGS results, which allow us to study the distribution of resources across identity categories. We do not find any evidence for the Solidarity Hypothesis: increased descriptive representation for one minority group, STs, does not appear to improve outcomes for a non-targeted minority group, SCs. We find support for the Crowding Out Hypothesis to the extent that there is negative substitution away from the residual non-SC/ST group, which is consistent with the aims of programs designed to redistribute economic and political power.Footnote 19 Importantly, there is no evidence for crowding out occurring through worsening outcomes for SCs.
Overall, we find no evidence of changes to NREGS implementation in Scheduled Areas at the extensive margin. However, evidence on PMGSY and public goods show improvements across the board. How might we square these contrasting results in light of the Performance Hypothesis? One interpretation consistent with results and the literature (e.g., Duflo and Chattopadhyay Reference Duflo and Chattopadhyay2004) is that marginalized politicians empowered under Scheduled Areas invest more in policies prioritized by their communities. While NREGS allows for efficient targeting to individuals as shown in improved ST outcomes in Table 2, delivering benefits to in-group members under less excludable roads and public goods programs might require more effort and thus gains at the extensive margin. In that sense, effects across the programs potentially reflect greater investment in the welfare of marginalized communities.
Policy Implications
Importantly, the results run contrary to the expectations of affirmative action skeptics: while we do not find that politicians from underrepresented groups outperform other politicians on NREGS, they certainly do not perform worse, and they perform better on a program (PMGSY) where explicit targeting of benefits to marginalized communities is less possible. In addition, gains for the targeted group under NREGS do not come at the expense of similarly marginalized populations.
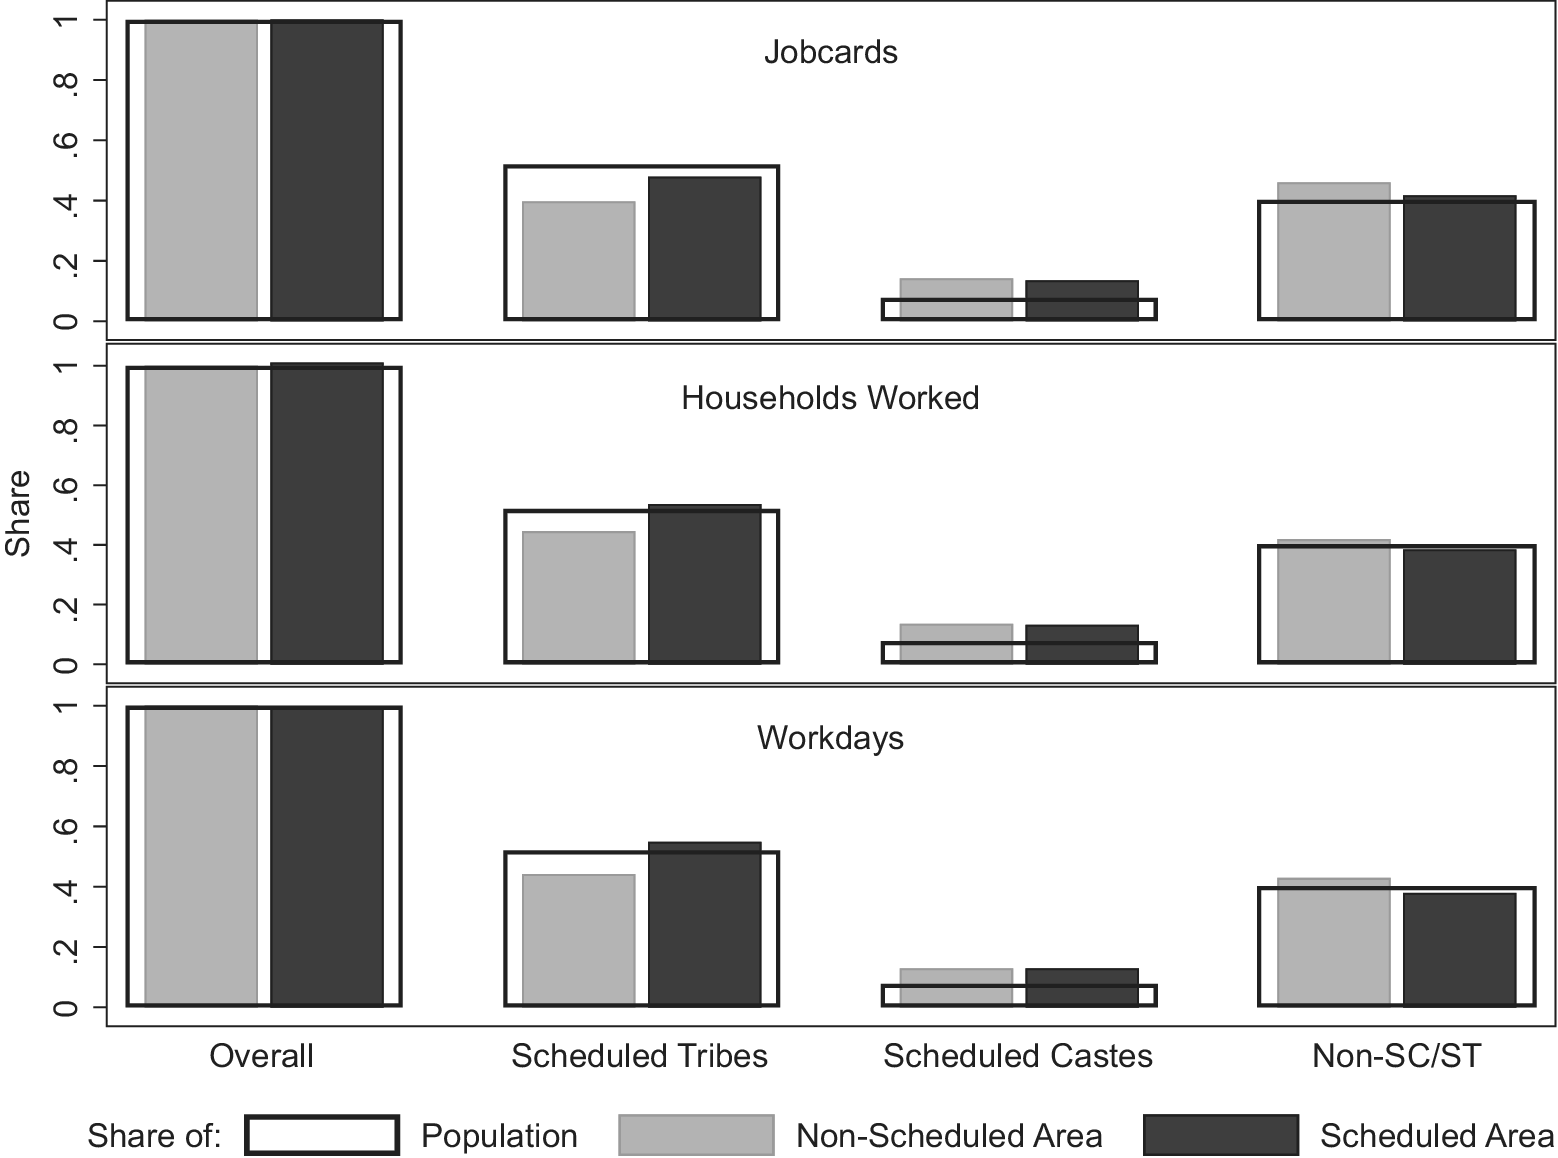
One might still be concerned that Scheduled Areas will tip the scales too far in favor of ST. To put the policy takeaway in perspective, we compare NREGS benefits relative to identity-group population shares in Figure 5 (Girard Reference Girard2018). First, we find that Scheduled Areas do not move outcomes much on the extensive margin, where non-Scheduled Area share is mechanically equal to 1. Second, despite being a large share of the population in our study area, ST receive far fewer benefits relative to their population share under the status quo. However, Scheduled Areas close this gap. Third, SC receive more benefits than their comparatively small population share. Fourth, while Scheduled Areas redistribute work away from non-SC/ST, this change results in an improved alignment of benefits with population share. Importantly, it is worth noting that population shares are conservative benchmarks in this analysis because the share of NREGS eligible population is likely much higher for SC and ST groups than for the non-SC/ST. In that sense, while Scheduled Areas appear to be closing the gap, more work might remain to align benefits with need.
The Effect of Scheduled Areas on NREGS Relative to Population Shares

Investigating the Electoral Mechanism
To what extent does an electoral mechanism explain how the Scheduled Areas have improved development outcomes for ST? We present four pieces of evidence in support of an electoral mechanism.
Scheduled Areas Prior to PESA
As discussed above, prior to the implementation of electoral quotas, Scheduled Areas and non-Scheduled Areas looked very similar in our geographic RD analysis of the 2001 Census. This analysis mirrors a critical 1995 report by the Indian Parliament appointed Bhuria Commission, which found little to no devolution of governance and authority to tribal bodies in Scheduled Areas and argued that tribal populations should enjoy greater self-governance and less governmental administrative interference.
[S]ince planned development has been an article of faith with us, it has to be ensured that implementation of the policies and programmes drawn up in tribal interest are implemented in tribal interest. Since, by and large, the politico-bureaucratic apparatus has failed in its endeavour, powers should be devolved on the people so that they can formulate programmes which suit them and implement them for their own benefits.
Policies following from these findings were made into law via PESA, passed in 1996 and going into effect with state panchayat elections from 2000. In this way, PESA gave the Scheduled Areas teeth that they had theretofore lacked.
Local Elections in Scheduled Areas
The PMGSY program, for which we have a village panel dataset, provides the most direct evidence consistent with an electoral mechanism and with the historical discussion above. Figure 3 shows that while Scheduled and non-Scheduled Areas followed parallel trends in PMGSY implementation before PESA elections were held, it was only after Scheduled Areas got “teeth” through the introduction of PESA elections that outcomes in Scheduled Areas differentially improved.
In contrast, because we only observe NREGS outcomes at a single point, we lack any within-state variation in PESA introduction when considering these outcomes. With this limitation in mind, in Appendix F we interact the Scheduled Areas indicator with the number of elections between 2000 and 2012 that have taken place in a state under PESA: one, two, or three. We find that the main results hold up but the magnitude decreases over time. This may be consistent with quotas having the greatest marginal impact for the targeted minority in the first election, where quotas constitute a shock to political representation. In subsequent elections, as members of the targeted minority “catch up” to other groups, and as quota politicians learn the intricacies of the position, quota politicians may distribute more benefits to other groups and deliver overall gains.
Targeted Minority Electoral Influence
Prior work suggests that quota effects are largest where the targeted minority group constitutes a large share of the population (Chin and Prakash Reference Chin and Prakash2011; Das, Mukhopadhyay, and Saroy Reference Das, Mukhopadhyay and Saroy2017; Jensenius Reference Jensenius2015; Pande Reference Pande2003). For instance, Jensenius (Reference Jensenius2015, 203) reports that some SC politicians want to divert funds to SC constituents but do not do so “because they are scared of being branded as ‘too SC”’ by the majority of voters who are non-SC and on whose votes they depend. We expect the method of targeting to differ depending on whether individuals can be excluded from program benefits. When a vote-maximizing politician cannot exclude individuals from receiving a good such as under the PMGSY program, they may want to target gains to areas where in-group members constitute a larger portion of the population and thus where more group members will receive the good. Indeed, evidence in columns 4 and 5 of Table 3 is consistent with this interpretation.
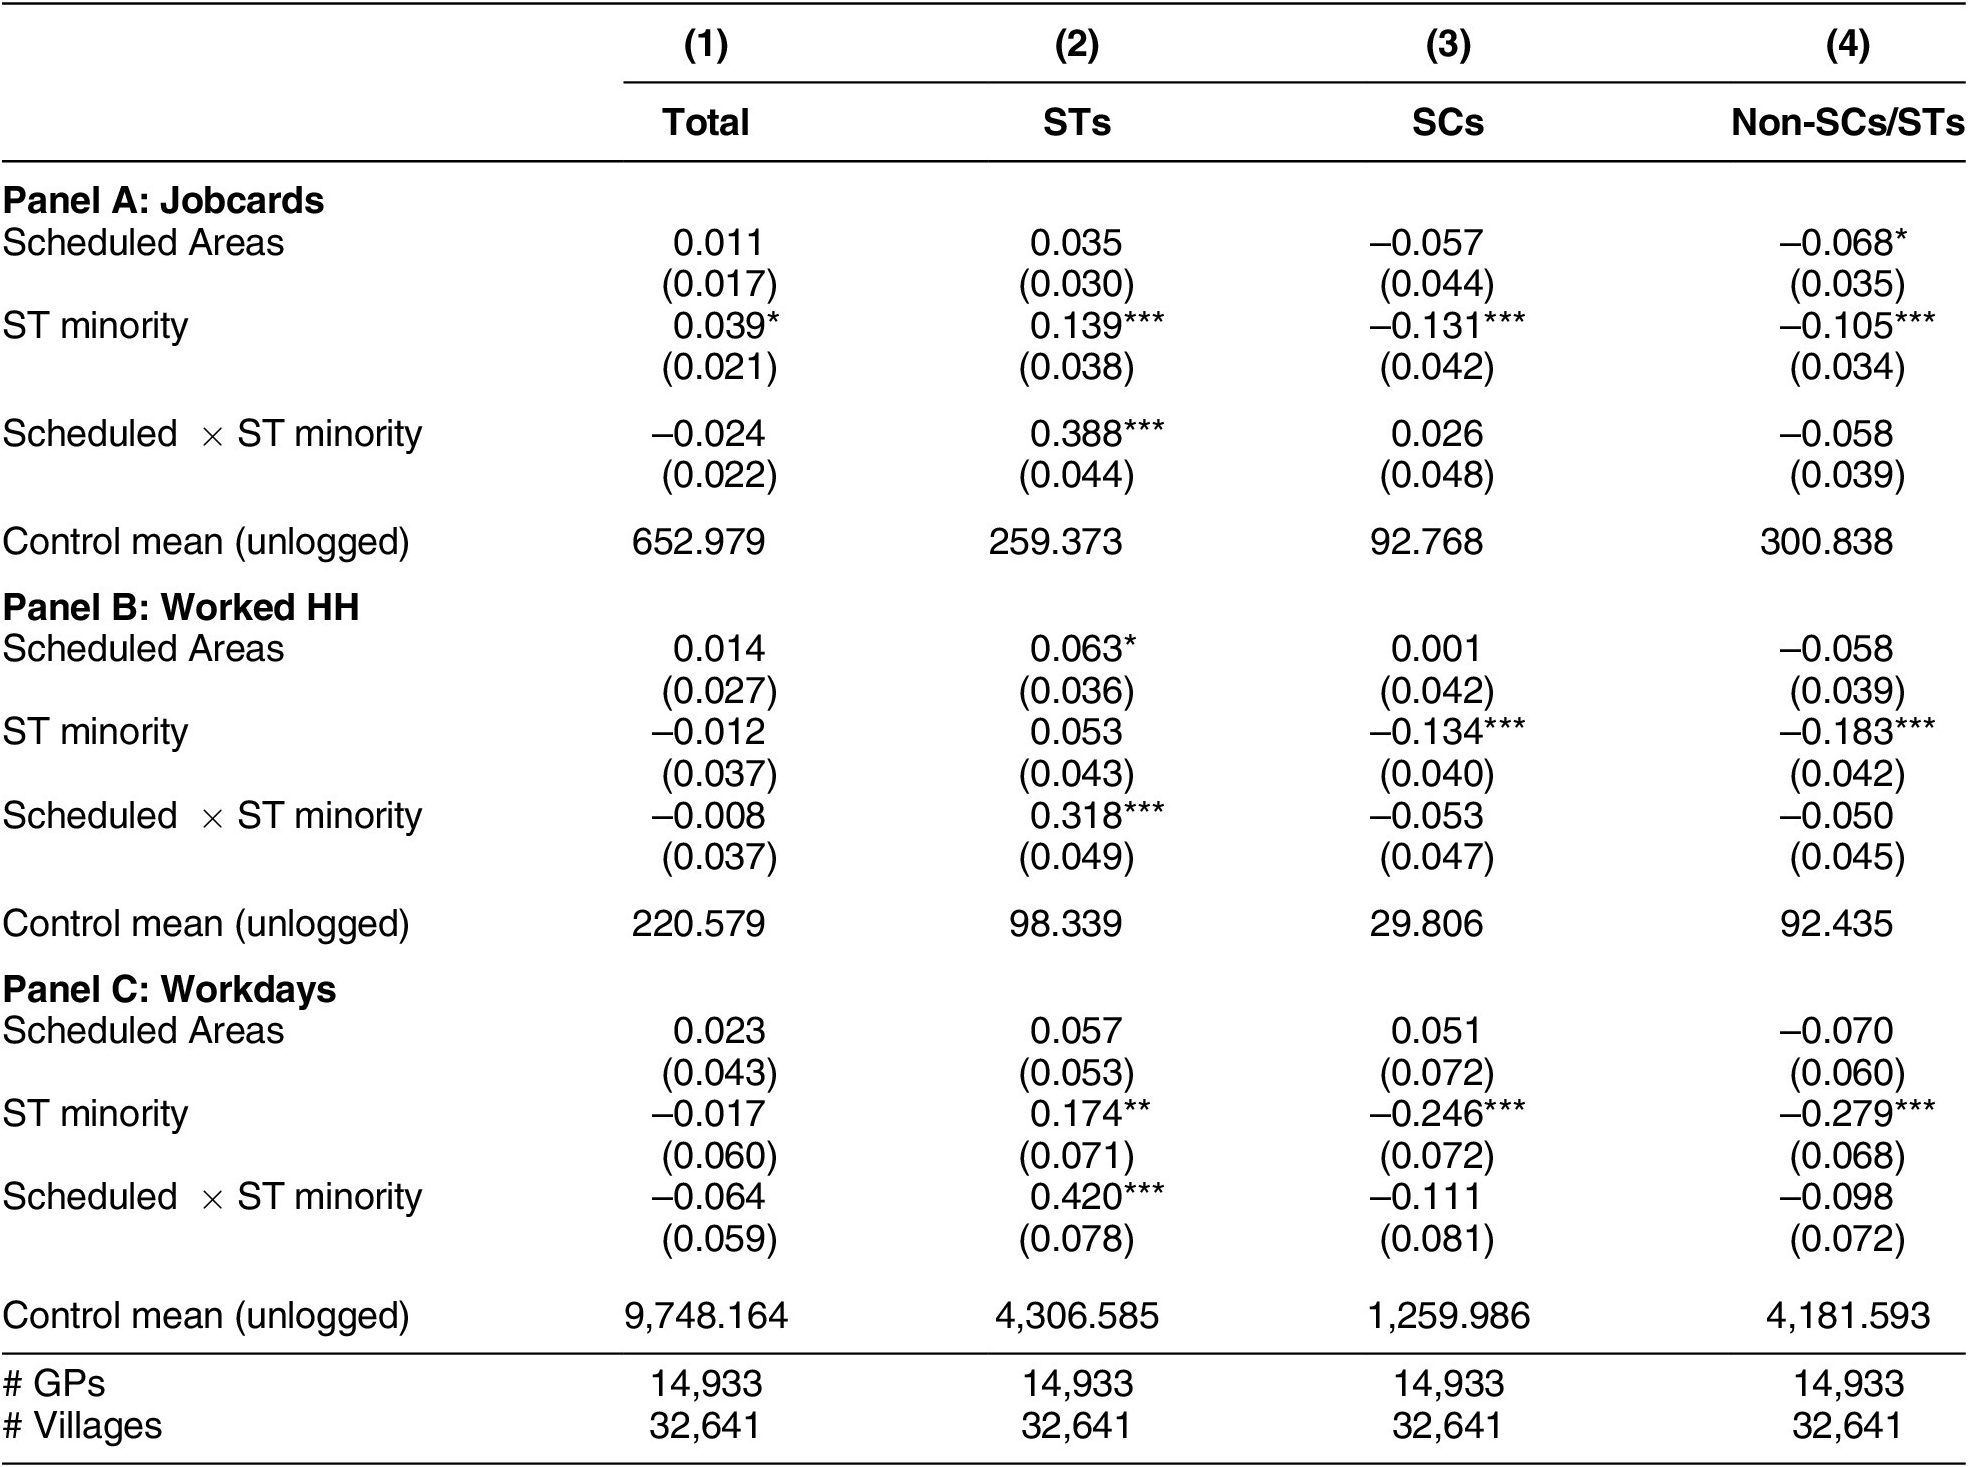
Alternatively, where benefits are individually targetable such as in programs like NREGS, it may be in a politician’s interest to deliver benefits to in-group individuals who stand to gain the most marginal benefit. We proxy for this by creating an indicator variable for whether ST are a non-plurality:  $$ ST\ Minorit{y}_v=\neg ST\ Pluralit{y}_v $$. Table 4 presents heterogeneous effects with our standard RD specification. There are two findings. First, for each of the three main outcomes under NREGS, we find that Scheduled Areas have a larger positive effect for ST in places where ST comprised an electoral minority prior to the implementation of PESA. Second, as before, the negative spillover on the residual non-SC/ST category is also more pronounced in these areas.
Treatment Effects by ST Plurality versus Minority (10-kilometer RD)

Note: *p < 0.10, **p < 0.05, ***p < 0.01. Standard errors clustered by GP.
Quota Overlap
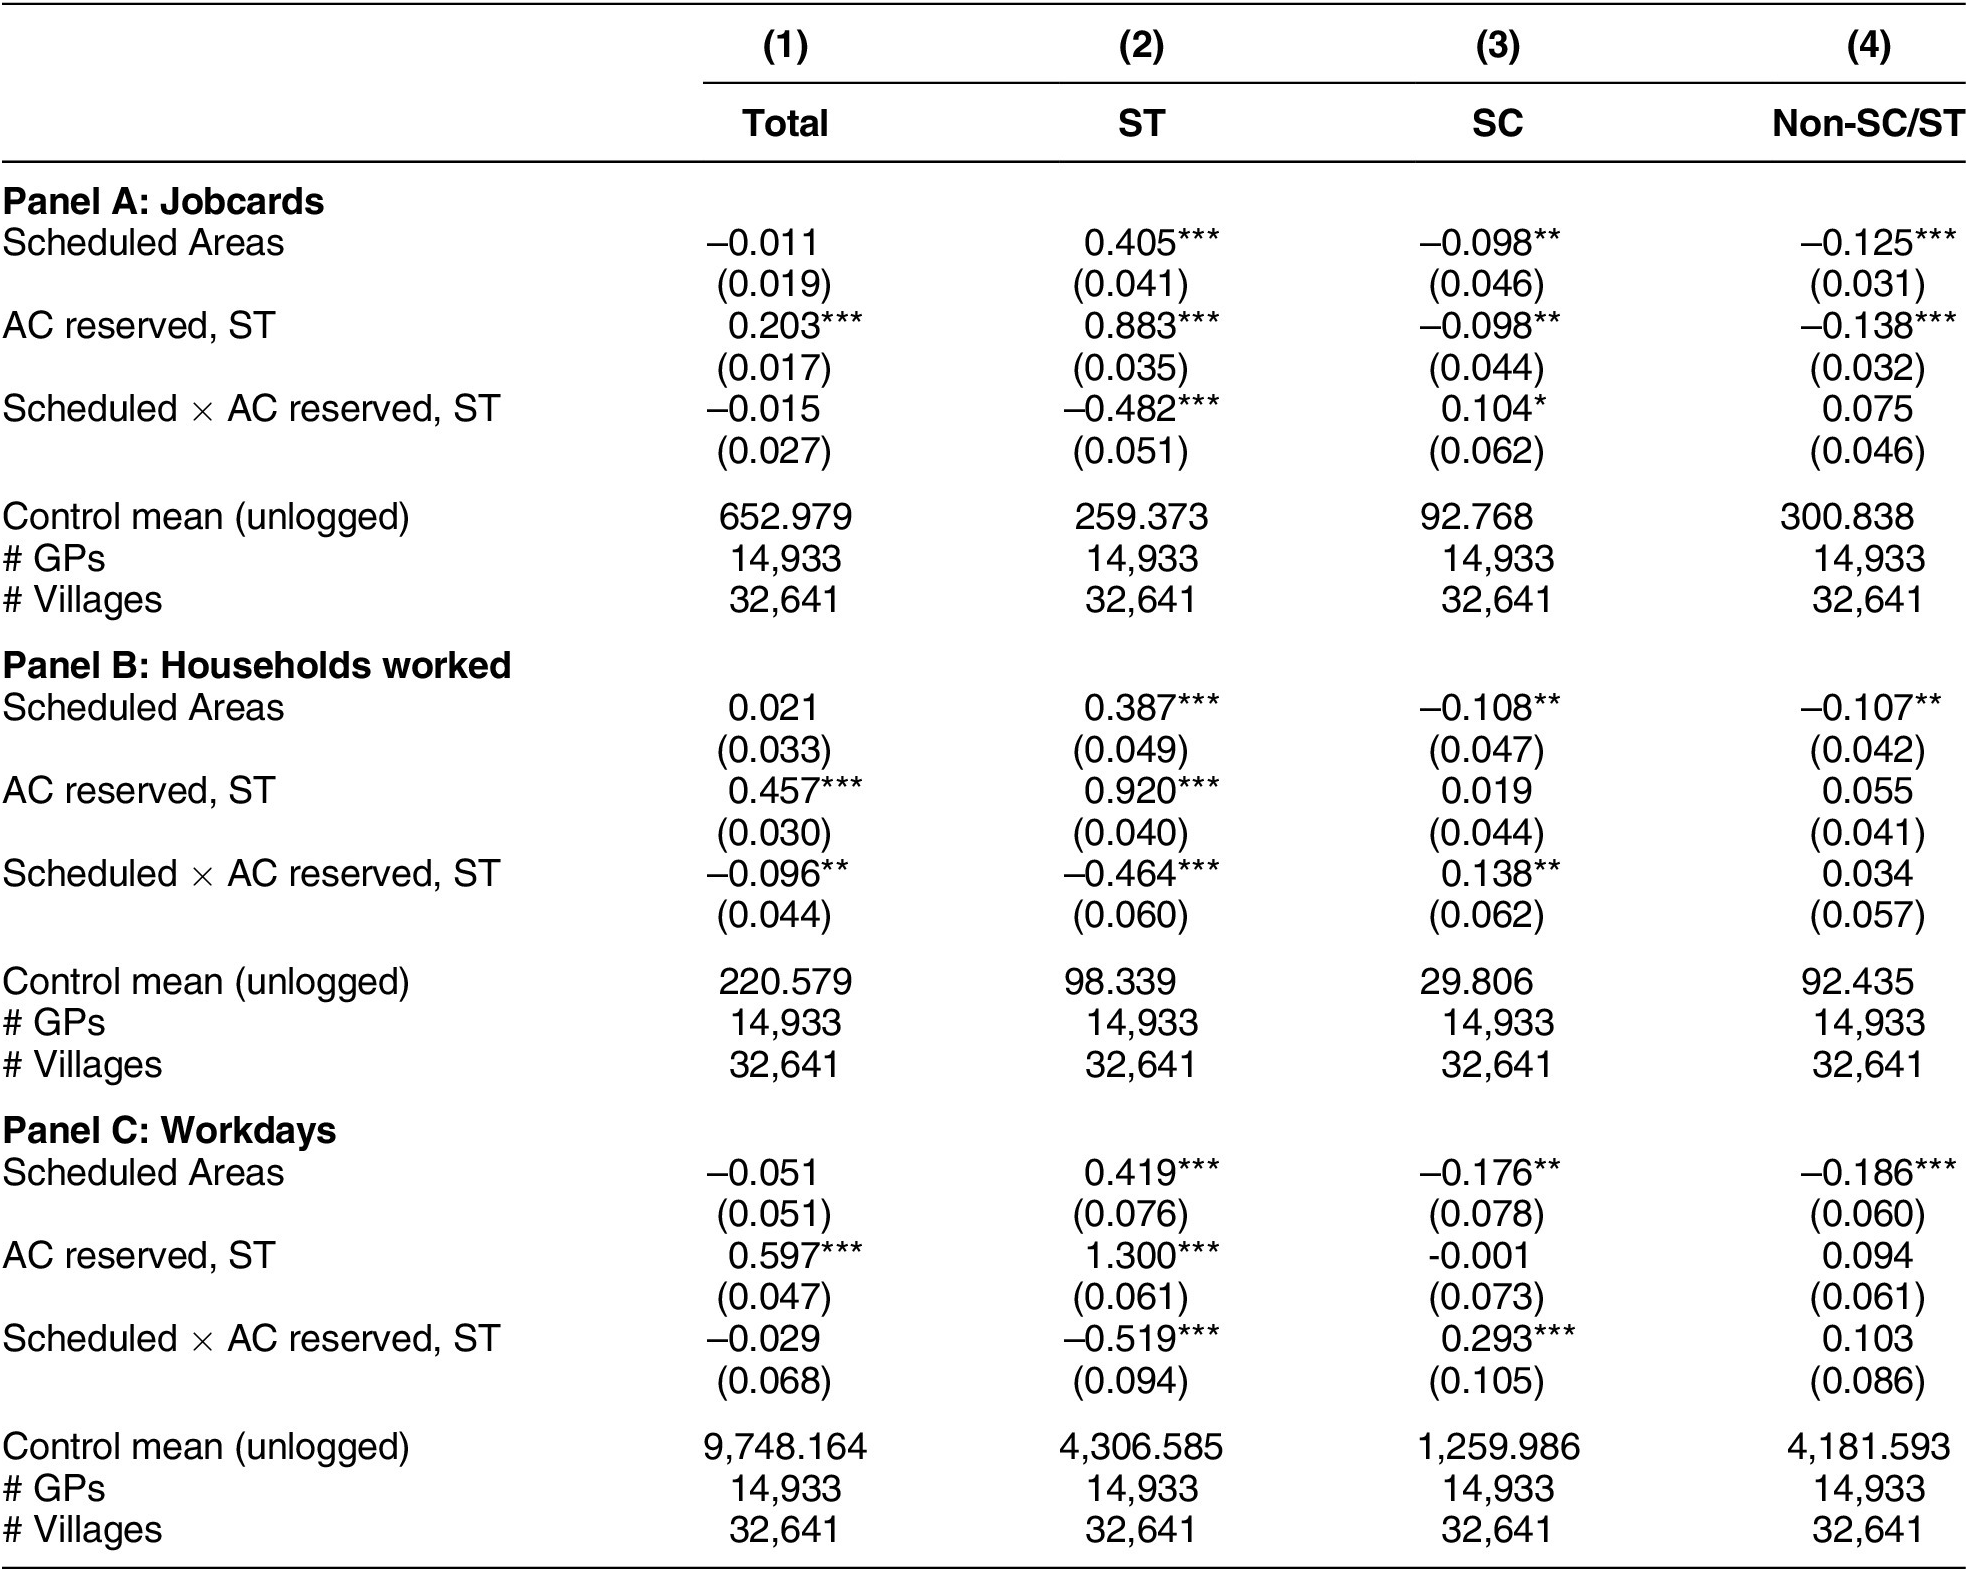
A certain proportion of State Assembly seats across India are reserved for minorities including ST and SC based on population (Jensenius Reference Jensenius2012). Although the higher-level quotas are not randomly assigned, we can use them to investigate quota overlap at different levels of government. On one hand, multiple quota politicians should reinforce the effect of political quotas by improving potential coordination between politicians who share an identity. On the other hand, there could exist some diminishing returns to quota politician effort because of credit claiming difficulties and free riding problems (Gulzar and Pasquale Reference Gulzar and Pasquale2017).
While our main results are robust to controlling for the incidence of Assembly Constituency level ST reservation (see Appendix F), in Table 5 we interact these higher-level reservations in the latest election before 2013 with the treatment indicator for Scheduled Areas to study whether overlapping Assembly Constituency reservations moderate effects on program implementation. The results show that Scheduled Areas reservations and Assembly Constituency reservations for ST, separately, improve NREGS program implementation tremendously for ST. However, when the two quotas overlap, the overall implementation of the program is less than the separate parts, suggesting that there exist some ceiling effects.Footnote 20 There is also evidence that overlapping quotas may similarly affect implementation of PMGSY. Overall, the results are consistent with program implementation varying with political institutions.
Additional Quota in Assembly Constituency (10-kilometer RD)

Note: *p < 0.10, **p < 0.05, ***p < 0.01. Standard errors clustered by GP.
Conclusion
Policymakers often treat economic and political efforts in isolation. We argue that political affirmative action and development programs may serve as complementary levers to deliver better outcomes for marginalized communities, at no cost to other minorities, or to society overall.
Our empirical setting is political affirmative action in India, where Scheduled Areas, as well as similar reservations more generally, are hotly debated and politically divisive. Protests and riots have broken out for a myriad of related affirmative action issues—out of fear of reductions in protections for SC and ST throughout India, in anticipation of the implementation of elections in Scheduled Areas, by groups agitating for inclusion in identity categories targeted by quotas, and in an effort to extend Scheduled Areas into new jurisdictions (AlJazeera 2018; Iyengar Reference Iyengar2015). Despite their importance, scale, and salience, Scheduled Areas remain understudied in political science and related disciplines. To our knowledge, this paper provides the first systematic evaluation of this institution.
We propose a novel theoretical framework comprising solidarity, crowding out, and performance hypotheses to understand the systematic effects of political affirmative action across groups. To test these, we build a new large-scale dataset combining administrative data on the largest employment program in the world, a rural roads program, as well as public goods from the Indian Census. We find that quotas deliver no worse outcomes overall and that gains for targeted minorities come at the cost of the relatively privileged rather than other historically disadvantaged groups. More broadly, improvements in other pro-poor policies, including a rural roads program and general public goods, further attest to the complementary impacts of political affirmative action and pro-poor economic development.
Effects appear to operate through an electoral mechanism. They appear strongly (1) after the introduction of local elections with reservations for minorities, (2) in places where we would expect vote-maximizing politicians to target benefits, and (3) where there is no overlap with other quotas targeting the same minority.
What are the implications of our results on debates surrounding affirmative action? Skeptics routinely argue that open competition in the political sphere brings the best politicians to the fore. However, our results show that quota politicians perform no worse than do status-quo politicians. This suggests that status-quo institutions may prevent equally qualified individuals from marginalized communities from running for office and more effectively representing their communities.
We hope other researchers add to these findings by further disaggregating identities of beneficiaries as well as adding evidence on other links in the causal chain from affirmative action to development, from district- and block-level actors through village councils, and to individual households.
What are the long-term consequences of electoral affirmative action? Our study measures effects up to 12 years after implementation of the institution and finds large positive effects for the targeted minority, which results in a closer alignment of the distribution of benefits with identity-category population share. However, one concern for the longer term is that fixed political affirmative action may develop its own unequal political structures by simply replacing which identity group is on top. Efforts that helpfully redistribute political power initially could create long-run political monopolies. We consider this to be an important open question to be explored in the future.
Supplementary Materials
To view supplementary material for this article, please visit http://dx.doi.org/10.1017/S0003055420000532. Replication materials can be found on Dataverse at: https://doi.org/10.7910/DVN/BOWEJG.






Comments
No Comments have been published for this article.