1. INTRODUCTION
Although considerable research exists on the location choice of immigrants [Borjas, (Reference Borjas1998); Edin et al. (Reference Edin, Frederiksson and Åslund2003); Kritz et al. (Reference Kritz, Gurak and Lee2013); McDonald (Reference McDonald2004)], much less attention has been given to identify factors underlying internal migration decisions of immigrants and to examine how these factors interact to jointly affect their mobility behavior. Given the resources and attention that is typically paid to immigrant recruitment – many Canadian provinces, for example, send recruitment teams around the globe with the mandate of attracting newcomers to particular destinations – too little research looks at the extent to which these recruitment efforts actually increase population in the areas they are intended to, especially since it is well-known that immigrants are more mobile than their Canadian-born peers. [Gurak and Kritz (Reference Gurak and Kritz2000); Hou (Reference Hou2007); Teixeira (Reference Texeira2009)].
Further, how do individual, household, and community characteristics affect internal migration decisions of immigrants? To what extent does low-income status, for example, result in out-migration from the current community of residence? What about marital status? Will single people initially live in an enclave and endure sub-optimal labor market outcomes until they find a spouse, or will they leave as soon as they can afford to, as many others do? Do immigrants take love, money, and location into account simultaneously when making internal migration decisions?
In this paper, we analyze how migration decisions of immigrants living in British Columbia (B.C.) are related with their individual, household, and community characteristics as well as with the macro-level economic conditions. We chose immigrants living in B.C. because Vancouver, which is located in B.C., is one of Canada's eminent destination cities, experiencing fairly high rates of internal mobility yet low rates of out-migration. This location allows us to assess our general argument that migration decisions are made in a complex social context as a function of many factors, each of which enters the utility function with different weights for different groups of immigrants, under different circumstances, during different life stages [Klabunde and Willekens (Reference Klabunde and Willekens2016)].
We believe that marital status, presence of children, and low-income status are three such factors. We hypothesize that although most people will leave an ethnic enclave,Footnote 1 low-income status will decrease their ability to do so, as immigrant households will be less able to afford to move to find better opportunities. We argue that being married will decrease the extent to which a region anchors immigrants to a given place. Compared to people with a spouse, which we describe as a “household-level social network,” single immigrants have a higher probability of staying in an ethnic enclave, because they will be more likely to rely on connections outside the home (including potential suitors). Finally, we hypothesize that households (single or married) with children will also be less likely to leave an ethnic community, as parents will be restricted not only by their own considerations, but also by those of their children, making a move more difficult. We conclude by discussing the implications of our work.
2. LITERATURE REVIEW
The initial choice of residence and internal migration pattern of immigrants have been widely documented around the world [Bartel and Koch (Reference Bartel, Koch, Abowd and Freeman1991); Belanger and Rogers (Reference Belanger and Rogers1992); Camarota and McArdle (Reference Camarota and McArdle2003); Chui (Reference Chui2003); Edmonston (Reference Edmonston2002); Molloy et al. (Reference Molloy, Smith and Wozniak2011); Moore and Rosenberg (Reference Moore and Rosenberg1995); Newbold (Reference Newbold1996); Rogers and Henning (Reference Rogers and Henning1999)]. Generally, these studies compare the migration pattern of foreign-born immigrants to their peers of native-born population and also try to establish where immigrants are located upon arrival and where they move. However, the focus of the mass literature is not the identification of factors affecting the decision of geographical locations, and the data are rarely longitudinal in nature.
Ethnic enclaves have also been intensively analyzed in terms of affecting the location decision of immigrants [Haan (Reference Haan2005); Hou (Reference Hou2007); Kritz and Nogle (Reference Kritz and Nogle1994); McDonald (Reference McDonald2004)], but largely with mixed results. Hou (Reference Hou2007) finds that the ethnic community is not related with geographical decisions once the location fixed effects are controlled, while the other studies conclude that the ethnic enclave is a significant determinant of the locational choice of immigrants. The other commonly controlled factors related with the migration decision of immigrants are community-level characteristics, such as the unemployment rate and welfare generosity, birth place of immigrants, and human capital of immigrants [Belanger and Rogers (Reference Belanger and Rogers1992); Fong and Hou (Reference Fong and Hou2009); Gurak and Kritz (Reference Gurak and Kritz2000); Newbold (Reference Newbold1996); Rogers and Henning (Reference Rogers and Henning1999); Zavodny (Reference Zavodny1999)].
Spatial assimilation theory [Massey and Denton (Reference Massey and Denton1985)] predicts that all racial minorities (not just immigrants) will move away from their co-ethnic community as they integrate into their host country over time, suggesting that the geographic distribution of an immigrant group can be seen as part of the overall level of adaptation/integration of that group [Murdie and Ghosh (Reference Murdie and Ghosh2010)]. Although there is considerable support for this theory, even in Canada [Fong and Wilkes (Reference Fong and Wilkes1999)], most believe that it tends to work better for explaining the distribution of socio-economically disadvantaged groups [Logan et al. (Reference Logan, Alba and Zhang2002)]. For more successful groups, the preference of living for some minority groups in a co-ethnic region is higher and their mobility patterns do not conform well to the traditional spatial assimilation theory [Logan et al. (Reference Logan, Alba and Zhang2002); Myles and Hou (Reference Myles and Hou2004); Hou (Reference Hou2006)].
Recently, several non-Canadian studies have jointly analyzed the initial and subsequent migration patterns of immigrants in the host country [Niedomsyl (Reference Niedomsyl2008); Sirojudin (Reference Sirojudin2009); Kirdar (Reference Kirdar2009)]. By examining the settlement pattern of immigrants in Norway in terms of their choices of landing places, moving across regions and emigrating out of Norway, Roed and Schone (Reference Roed and Schone2012) showed that immigrants’ settlement and mobility patterns are affected by labor market conditions, such as wages and the unemployment rate. Boman (Reference Boman2011) provided empirical evidence on internal migration of immigrants due to job cutbacks in Sweden. In Germany, Gundel and Peters (Reference Gundel and Peters2008) were the first to empirically show that the country of origin and skill levels affect the emigration decisions of German immigrants. McDonald and Worswick (Reference McDonald and Worswick2012) investigated the migration patterns of immigrant physicians in Canada and found that the retention of immigrant physicians in rural areas and in some provinces is difficult. King and Newbold (Reference King and Newbold2011) employed longitudinal data to investigate the internal migration pattern of Canadian immigrants and they controlled for the pre- and post-migration factors in their logistic models.
Finally, Aydemir and Robinson (2008) conducted a duration analysis to investigate the emigration patterns of new Canadian immigrants by using the Longitudinal Immigrant Database, the same dataset that we use here. They showed that a large part of migration to Canada is temporary and they also identified different retention rates across different groups of immigrants. Yet, they focus on the mobility of male immigrants over a longer term (particularly their international mobility) and not the factors underlying the internal migration decisions of all immigrants.
In the existing literature, few studies have systematically investigated how individual, household, community-level characteristics, and macro-level economic conditions, which could also be grouped into economic and socio-demographic factors have influence on immigrants’ migratory behavior. The broad consensus is that the location choices of immigrants are largely tied to their labor market performance [Frank (Reference Frank2013); Haan (Reference Haan2007, Reference Haan2008); Rashid (Reference Rashid2009); Warman (Reference Warman2007)]. Most studies show that mobility tends to result in better economic outcomes and that most immigrants do better outside an enclave than within it over the longer term. Although we do not dispute this, nor do we fully know the reasons for the differences in outcomes,Footnote 2 we believe that it is of great interest to policy makers to gain insights on to what extent these four groups of factors affect internal geographic mobility of immigrants in a simultaneous manner.
3. HYPOTHESES
Despite the growing literature on enclaves as destinations, the actual occurrence of affluent ethnic neighborhoods remains relatively rare,Footnote 3 Even though, it is possible that some members of some groups will be able to choose to both live in ethnic neighborhoods and avoid the economic penalty traditionally associated with ethnic enclaves [Edin et al. (Reference Edin, Frederiksson and Åslund2003); Fong and Shibuya (Reference Fong and Shibuya1995); Myles and Hou (Reference Myles and Hou2003)]. The more prevalent trend is the age-old spatial assimilation route, where immigrants will gradually leave their enclave over time.
In particular, when first arriving in the host country, immigrants might have higher tendency to locate in a place where they can get more support and resources from the same ethnic group. However, this tendency could be offset with time by fewer well-paid work opportunities available in these ethnic communities when immigrants make their subsequent migration decisions. Thus, immigrants who landed and are currently residing in an ethnic enclave might be more likely to migrate out of their ethnic neighborhoods for the reason of finding a more prosperous labor market or even a high-paying job, compared with those living in non-ethnic neighborhoods who might have lived in an ethnic enclave in first years since arrival in the host country or who might have considered this option in the first place.
H1: Immigrants will be more likely to migrate if they live in an ethnic enclave than they will be if they stay in a non-ethnic clustered community.
Although the ability to move is predicated on having the necessary resources to deal with transaction costs, the moving costs are unlikely one anchor inhibiting internal mobility of immigrants, especially when immigrants find it hard to move up along the economic ladder in their current residence community. As pointed out in the previous studies [Boman (Reference Boman2011); Roed and Schone (Reference Roed and Schone2012)], economic factors such as wage and macro-level economic conditions are always drivers causing immigrants to change their current geographic locations. If not the first, poverty would generally be considered as one of the top reasons that could result in mobility because the potential large economic gains associated with migration could easily overcome the costs of moving. Additionally, due to the advancement of internet and communication tools, many immigrants might have already found a better job in another location before having physically migrated to the new place, which greatly compensates the moving costs for poor immigrants and thus stimulate their mobility.
H2: Individuals living in poverty will be more likely to move compared with those in a better economic position, regardless of whether they live in an enclave or not.
Moving costs are believed to increase with marriage and the presence of children, so we expect that having children and being married/in a common-law relationship will reduce mobility. Further, when making migration decisions, immigrants having a spouse or children might need to consider a more complicated utility function for the whole family, compared with those for single immigrants. The costs and benefits associated with moving might vary across different members of the family. For instance, the wife might prefer staying in the current location if she has found a job here and children might also have the same preference for the reason of enjoying long-term friendship and familiar school environment, while the husband might get a better job offer in another area. In this situation, the comparison of costs with benefits of mobility for the whole family is not as evident as that for the husband, leading to the reduction of mobility tendency for immigrants being married/in a common-law relationship or having children.
H3: Social “anchors” such as marital status and having children reduce mobility of immigrants.
In an enclave, there may be additional inhibitors to mobility. The implicit assumption surrounding the argument, which we do not dispute here (although this is not our focus), is that individuals and households receive benefit from living in an ethnic enclave, but that the benefit wanes more quickly over time for socio-economically disadvantaged groups than it does for affluent groups. Presumably, this is because immigrants gain access to both bonding social capital and group-specific amenities (grocery stores, community centers, religious institutions, etc.). Edin et al. (2003) show that members of high-income ethnic groups gain more from living beside co-ethnics than do members of low-income groups, implying that the group resources matter.
Much less research exists on the social factors behind migration, even though it is likely that they too will affect migration. The pull or push that an enclave elicits on an individual depends in part on the extent to which that individual can find supports elsewhere, particularly, as we argue here, from a spouse or partner within the home. Consequently, we postulate that if a person is married, he/she will receive at least some of the social supports within the home, thereby reducing the need to live in an enclave. Unlike married/common-law people, those who are single will be more likely to look outside the home when seeking social supports. If an individual is single, they will value social supports more highly from outside the home, especially from co-ethnics, thereby increasing the overall utility of an enclave.
H4: The extent to which single people are more likely to migrate than their married counterparts is larger for those residing in non-enclaves than that of immigrants living in ethnic communities.
To test these hypotheses and to be robust to the definition of the duration, we use both discrete and continuous hazard models, and in addition to the traditionally controlled community-level factors, we look at how mobility-related demographic factors interact with ethnic enclaves. The unique data used here (described more fully below) allow us to monitor the relationships between social and economic characteristics, and subsequent location decisions.
4. DATA
The Longitudinal Immigrant Database (IMDB)Footnote 4 is suitable to study the mobility of immigrants in Canada. It covers 100% of immigrants, who landed from 1980 to 2013 and filed taxes at least once in these years. Given that the internal mobility could be potentially influenced by the emigration decision, only those immigrants who decided to stay in Canada are included in our analysis. We can identify the migration status of immigrants by using the geographical information of immigrants in the tax files such as the province (PR), census division (CD), census sub-division (CSD), and census tract (CT) of residence.
Although there are many choices of areal units available in the data, each has its limits. First, except for the PR variable, CD, CSD, and CT variables are not available every year in the IMDB tax file. For example, the CD and CSD are not available in 1987–1995, while CT is not available before 1996. The PR and CD variables represent larger geographical areas compared to those represented by the CSD and CT variables, and employing these variables to identify mobility will conceal migration of shorter distances. Additionally, one salient data challenge for migration analysis is the change of geographical boundaries of each lower unit (CD, CSD, and CT) every five years across censuses. Without using programs to create longitudinally consistent geography (such as PCCF+),Footnote 5 it is very difficult to use CD and CSD to track immigrants for more than five years.
Based on the aforementioned issues associated with each geographical variable, we decide to employ CSD in the mobility analysis of immigrants in B.C. Consequently, the migration analysis is restricted to be within a five-year census window due to the inconsistency of CSD boundaries across censuses. The migration is defined as the change of the residential locations across CSDs identified from the tax files over years. Further, for immigrants who move across CSDs more than once over the tracking period, only the first move is counted. This will not affect the identification of migration behavior of the immigrants; however, it will only confound the duration calculation. Besides, all the covariates controlled in the model capture the initial characteristics of immigrants before migrating across regions; multiple movers will not bias our results.
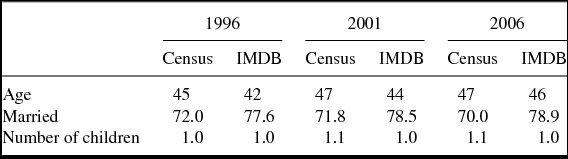
Since the IMDB provides information on tax filing behaviors, we cannot observe those who do not file taxes in the IMDB. Consequently, the IMDB may not be representative of all immigrants in Canada. That said, around 95% of all eligible population file taxes, and to ensure the accuracy of our analysis, we compare the sample statistics from the tax file of the IMDB with those from the corresponding census sample across basic characteristics and the results are in Appendix Table A.1 Footnote 6 . Through the comparison, we see that the two samples match fairly well with slightly younger people and higher proportions of married population in the IMDB tax filesFootnote 7 .
All the migration analyses are conducted on three successive cohorts of immigrants, who are grouped, based on the year they file their taxes. To cope with the issue of geographical boundary changes across censuses, we track all immigrants who filed taxes in each of the available census years (1996, 2001, and 2006) for five consecutive years.Footnote 8 Consequently, we explore three tax-filing cohorts of immigrants. For instance, the 1996 tax-filing cohort comprises of all immigrants who filed taxes in 1996 and the 2001 tax-filing cohort includes all immigrants who filed taxes in 2001. One advantage of conducting the tax-filing cohort analysis is that the migration decisions of the three cohorts of immigrants could be examined under different macro-economic conditions.
In particular, the 1996 cohort spanning from 1996 to 2000, covers the “dot-com bubble” that refers to the rapid growth in IT and its related industries. Conversely, immigrants in the 2001 tax-filing cohort were tracked from 2001, approximately when the “dot-com bubble” burst, to 2005. Overall, the 2001–2005 period experiences the decline of economy due to the bubble collapse and 9/11 effects. Similarly, the 2006 tax-filing cohort of Canadian immigrants were tracked over a time period undergoing a recent economic recession that resulted from the American housing market collapse in 2008. When all the other factors are held constant, the macro-economic differences across the three cohorts of immigrants are likely to explain part of the differences in their mobility patterns.
As the place of residence of immigrants could only be identified after landing if they file taxes in that year, the identification of migration could be censored in the data. For example, imagine that an individual was identified to live in Ottawa, Ontario with CSD code of 3506008 in 2006. That person did not file taxes in 2007 and in 2008 was found to live in another CSD. The migration status for that person could not be revealed from 2006 to 2007. We would treat this observation as a mover, but we would also assign that person to the group that includes those who did not report tax in at least one year within the 5-year tracking window. We suspect that the decision of not filing tax is correlated with factors affecting the migration behavior. Controlling for this group is critical to the identification of causal relationship between economic and demographic “anchors” and the migration decision of immigrants (for a comparison of our sample to that of the 2006 Census, please see Appendix A1).
Additionally, this paper mainly addresses the internal mobility of immigrants across urban CSDs within B.C. because this accounts for roughly 93–96.5% of all forms of observed migration (rural–urban/urban–rural, urban–urban and migration out of B.C.) for the province across cohorts.
Rich information contained in the IMDB enables us to control for many economic and socio-demographic individual, household, and community characteristics. The IMDB contains detailed information on initial landing locations, immigrant admission categories and many initial demographic characteristics of new immigrants upon arrival in Canada such as knowledge of the official languages, occupational skills, and highest education levels. In addition, the IMDB tracks immigrants on an annual basis; collecting information on many demographic and economic attributes prior-migration/emigration such as income by source, family structure, educational activities, and employment status. By linking IMDB data with the Census information at the level of CSD, we are able to include the community-level characteristics before migration such as the ethnic concentration of immigrants, labor market situation, community education level, housing price, etc.
Immigrants admitted to Canada under different immigration categories might have quite different characteristics and migration patterns within Canada. Therefore, we control for immigration classes in our models and we focus on principal immigrant applicants and their spouses/common-law partners whose immigration application was processed abroad and who landed in Canada at ages that range from 20 to 65 (inclusive). We exclude the dependents of immigrants from the sample. The unit of analysis for this paper includes principal applicants and their spouses/common-law partners, who either file taxes or are identified from their family members in the tax file.
Note that there is no variable recording the ethnicity of immigrants in the IMDB dataset, thus, we use the country of birth to approximate ethnicity.Footnote 9 We include the following ethnic groups in our analysis: Chinese,Footnote 10 Indian, South Korean, Filipino, Italian, German, Polish, Portuguese, Vietnamese, Ukrainian, Russian, Sri Lankan, Romanian, and Iranian. To measure the extent of ethnic clustering, we employ the indicator of an ethnic enclave following Bobo et al. (Reference Bobo, Oliver and Johnson2000), which takes the 10% of population by country of birth as a threshold. Specifically, if an immigrant lives in a region where more than 10% of population has the same birth country as his/hers, this immigrant will be treated as living in an ethnic enclave.
5. SAMPLE SUMMARY STATISTICS
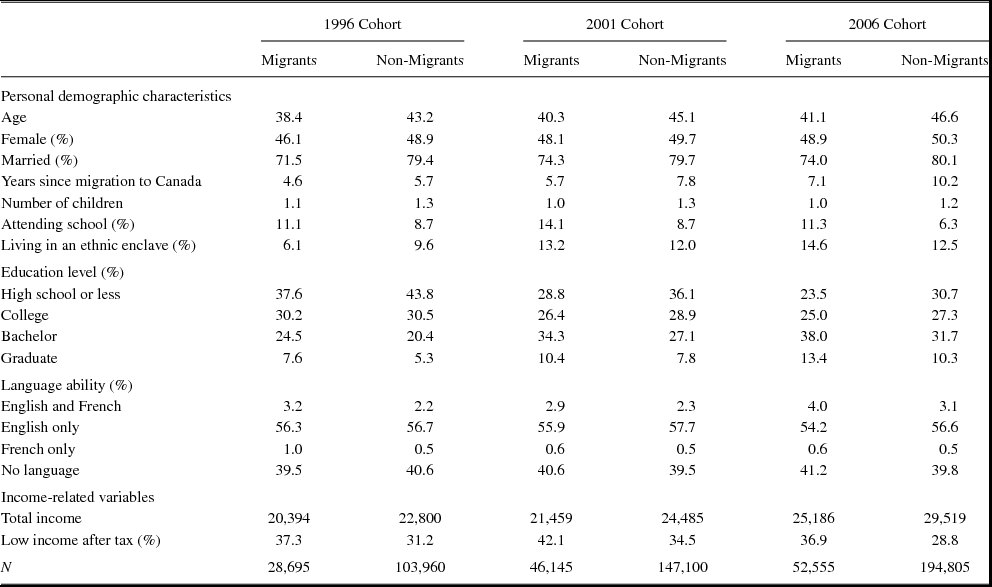
Table 1 provides some basic descriptive statistics on immigrants from each cohort in B.C.. For each covariate, two samples are considered: (1) immigrants who have moved across CSDs over the 5-year tracking period, and (2) immigrants who have stayed in the same location within the 5-year window.
Summary statistics of characteristics of immigrants in British Columbia by their migration status

Notes: (1) The total income is restricted to positive income with working status being equal to one.
(2) Families with more than five children are dropped from the sample.
Since an unconditional comparison of sample means could not capture the overall migration pattern and a conditional analysis is needed for this purpose, here, we provide some basic sample characteristics. Most statistical evidence is consistent across cohorts. Overall, roughly 21–24% of immigrants moved across CSDs over each 5-year period. The average age is lower for immigrants of each cohort who move from one CSD to another than that of immigrants who stay at the same places, implying that younger immigrants tend to migrate through years. Lower percentages of migrants are female or married, and they also spend fewer average years in Canada since landing compared to their counterparts who are non-migrants. On average, migrants have fewer children than their non-mobile peers. In contrast, among immigrants who have moved over the tracking period, higher percentages took some post-secondary education in the first year, and this pattern is fairly consistent across cohorts.Footnote 11 However, mixed results are shown across cohorts in terms of percentages of immigrants living in ethnic concentrated locations between movers and stayers. Particularly, in the 1996 cohort, immigrants who live in non-ethnic clustered communities make up a higher proportion among immigrant movers relative to immigrant stayers, while this trend is reversed in the latter 2001 and 2006 cohorts.
Clear differences in human capital between migrants and non-migrants are suggested by summary statistics of education attainment in Table 1. Among immigrants who moved to another region over the study period, a higher proportion of them holds a bachelor degree or above than that of non-movers.
Although immigrants with occupational skill levels 1 and 2 account for the majority of immigrant population across cohorts, there is a shift in the skills distribution of intended occupations over time. Particularly, more immigrants with skill level 1 are in later cohorts (2001 and 2006), while more immigrants with skill level 2 are in the earlier cohort (1996). Immigrants with knowledge only in French account for the lowest proportion of all immigrants in B.C., while Anglophone immigrants and immigrants without knowledge of either English or French make up for the largest proportion.
Further, preliminary statistical evidence suggests that movers are in economic disadvantaged positions with lower average annual total income and higher proportion of them being in low-income conditions. For example, migrants averagely earn $2500–4300 lower than their non-migrant peers and the difference increases over years. Similarly, there is around 6–8 percentage points differences in the proportion of low-income immigrants between movers and stayers across cohorts.
6. METHODOLOGY
The objective of this study is to assess whether immigrants living in B.C. are at risk of moving to a different location based on their economic (income) and socio-demographic (marital status and presence children) characteristics. We analyze the risk of migration, using a hazard model with unobserved frailty to evaluate the risk of migration of immigrants.
Our hypotheses can be tested using probability models. Since we have information about the length of stay before moving from the original place of landing, we can exploit this information and analyze the actual risk of moving that can be captured with a hazard model. Using the observed length before migration, the duration at risk is considered the first observed spell after arrival and before moving. Another important choice variable is the place of arrival. With this choice we wanted to minimize the impact of the selection issues that may cofound our parameter estimates.
For robustness purposes, our duration at risk is considered to be both an interval censored and a discrete event. These two assumptions are used to analyze the risk of migration. This is helpful as we test our hypotheses using a rich set of economic and socio-demographic control variables, which reduces the impact of unobserved heterogeneity in our analysis. In this sense, a flexible baseline hazard will not be confounded with the unobservables, and therefore will capture the duration dependence or in other words the common factors that are missing from the analysis, but are important for internal migration. Therefore, we propose to use both a discrete and a continuous mixed proportional hazard models to test the hypotheses. Alternative models are considered for robustness checks.
7. MODEL SPECIFICATION
To evaluate the risk of migration of immigrants, while controlling for different economic and socio-demographic “anchors” different hazard model specifications are considered. The choices allow the duration to migration be treated both as an interval censored continuous data and a discrete time data models. We explore both definitions of duration to make sure that our model specification captures the best information from the available data.
We start with a mixed proportional hazard model with shared frailty:
 $$\begin{equation}
h_{\it ij}(t | X) = \mu_{j} e^{X_{\it ij}\beta} h_{0}(t),
\end{equation}$$
 $$\begin{equation}
{{\bm{X}}_{{\bm{ij}}}}{\bm{\beta }} = {\beta _1}{\it ESDA}{_{ij}} + {\beta _2}{\it OC}{_{ij}} + {\beta _3}\left( {{\rm{Clusterin}}{{\rm{g}}_{ij}}{\it ^{*}ESDA}{_{ij}}} \right) + {\beta _5}{\rm{Clusterin}}{{\rm{g}}_{ij}},
\end{equation}$$
where i stands for individual and j stands for the group over which the frailty is shared. μ j is the unobserved heterogeneity, which is shared over the CD, where immigrants were initially located and in this case it is called group-level frailty and h 0(t) is the baseline hazard that determines the hazard as a function of time independent of any variation on the covariates. In our case, baseline hazard is estimated both parametrically and non-parametrically. It is reasonable to assume that immigrants living in the same CD might share similar unobserved characteristics so that controlling for their initial CD helps us disentangle the true effects of the aforementioned “anchors” on mobility. ESDA (Economic, Social and Demographic Anchors) includes a set of economic and socio-demographic “anchors” in the first tracking year since landingFootnote 12 (marital status; number of children; total individual income; self-employment status; knowledge of two official languages; education levels, skill levels, and years since migration to Canada; and community-level information at the CSD level such as the overall unemployment rate, income, housing price, community turn-over rates, house ownership rate, and education levels). OC contains other covariates (age, gender, and birthplace). The ethnic clustering variable is included in the model and is denoted by Clustering. It is worth noting that observations with missing values in either one of these characteristics could not be included in the estimation. We found a relatively large number of missing values in the variable of occupational skill levels. To rule out the possibility that the sample attrition due to missing values might not be random, we re-run all models without the occupational skill levels and the results are reported in Table A.2. Overall, the results are not sensitive to the exclusion of variables with many missing values.
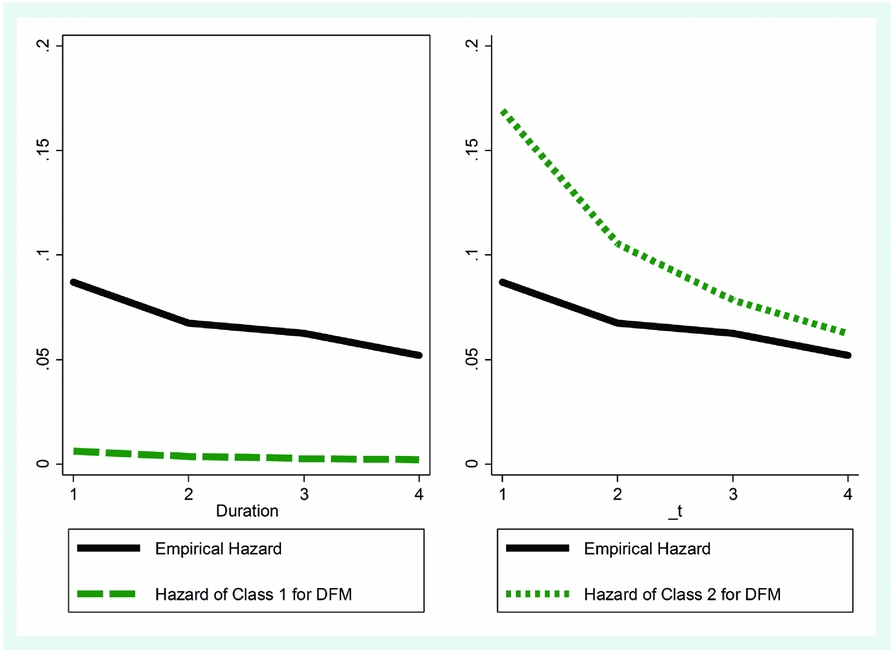
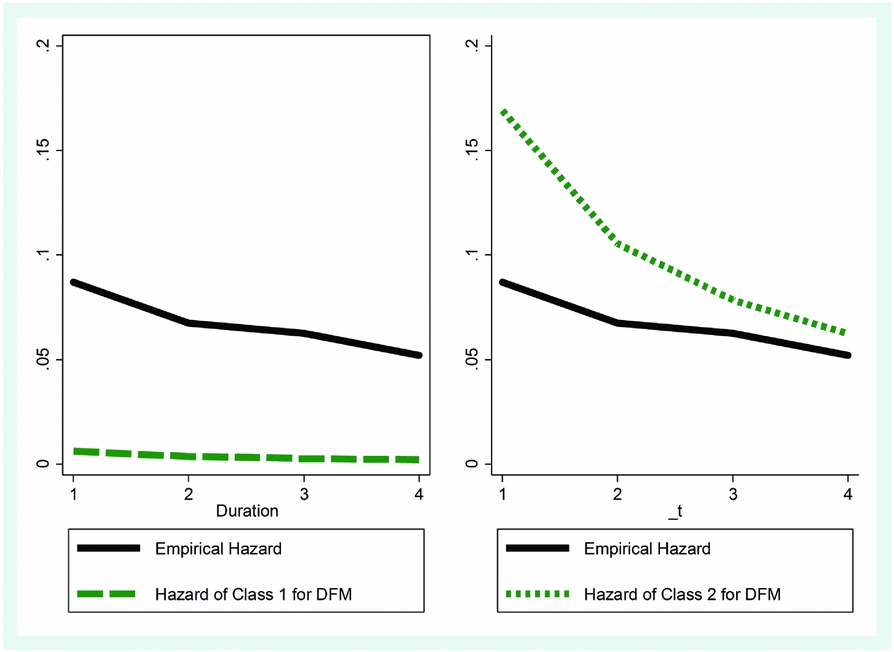
For the analysis, we also assume a discrete duration data, therefore we use of a semi-parametric discrete time finite mixtures hazard model (DFM), where heterogeneity is modeled non-parametrically (mass points), allowing for the presence of distinct types of heterogeneity across immigrants. The flexibility of the non-parametric specification can then be used to assess whether that heterogeneity affects the covariates (if endogeneity is present). Another advantage of this model specification is that is more robust to endogeneity than the parametric/semiparametric models.
The discrete finite mixture hazard model used can be written as
 $$\begin{equation*}
h\left( {t{\rm{|}}v,x} \right) = 1 - exp\big[ { - {\rm{exp}}(v + {\beta _0} + b\left( t \right) + \beta^{\prime} {X_{it}}} \big],
\end{equation*}$$
where unobserved heterogeneity has K discrete points v = v = {v
1 = 0, v
2, . . ., vk
} with probabilities p = {p
1, p
2, . . ., pk
}, where p
1 = {1 − p
2 − p
3 − . . . − pK
}, so that
 $E[ {h(t|v,x)} ] = \ \mathop \sum _{k = 1}^{k = K} [ {{p_k}h(t|{v_k},x)} ].$
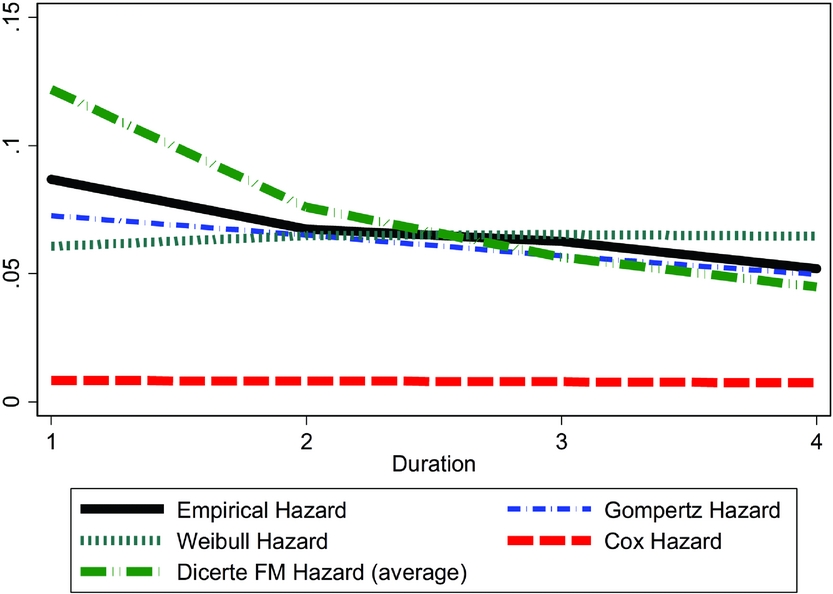
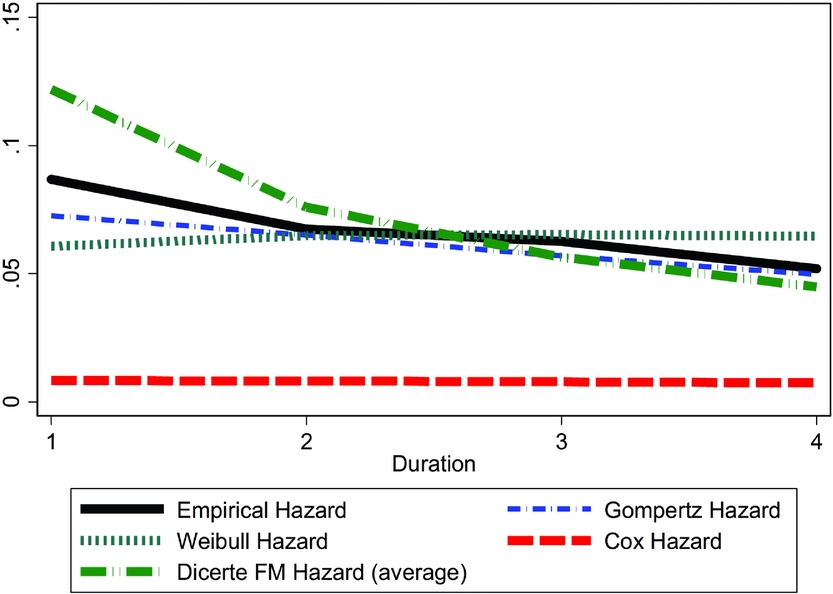
The choice of the appropriate model is done using two approaches. First, the predicted model is plotted against the data and in this way we can see how well a model follows the data and second Vuong (Reference Vuong1989) test is performed to discriminate between rival non-nested models. Vuong's model selection criteria identify the model that is closer to the true specification.
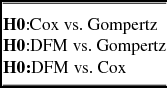
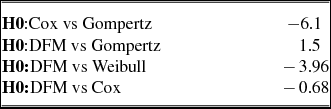
The following Null Hypotheses are tested after selecting between the continuous parametric and semiparametric and discrete hazard models:

In particular, a significant positive Vuong statistic leads to not rejecting that model on the left of the Null test dominates the one on the right of the Null test, while a significant negative value for the test rejects that the left model dominates the right side model. A non-significant Vuong statistic indicates no preference for either models. As an additional check, we look at the predictability of different model specifications versus the actual data.
The plots of the predicted models and the Vuong test results are presented in Figures 1 and 2 and Table 4. The results suggest that the parametric Gompertz model and the semiparametric discrete hazard model are performing the best. In what follows, we discuss the results obtained with these two models.
Predicted hazard specifications versus empirical hazard.
Discrete Finite mixtures predictions of the two types.
8. RESULTS
As a result of our analyses, two models are presented as our preferred ones (the parametric Gompertz model and the discrete finite mixture model). Both models present better predictions than the Cox hazard model,Footnote 13 according to the criteria discussed on the methodology section and both models show similar results, which suggest that endogeneity is not an issue in these models specifications (given that the discrete hazard model is robust to the endogeneity problem).
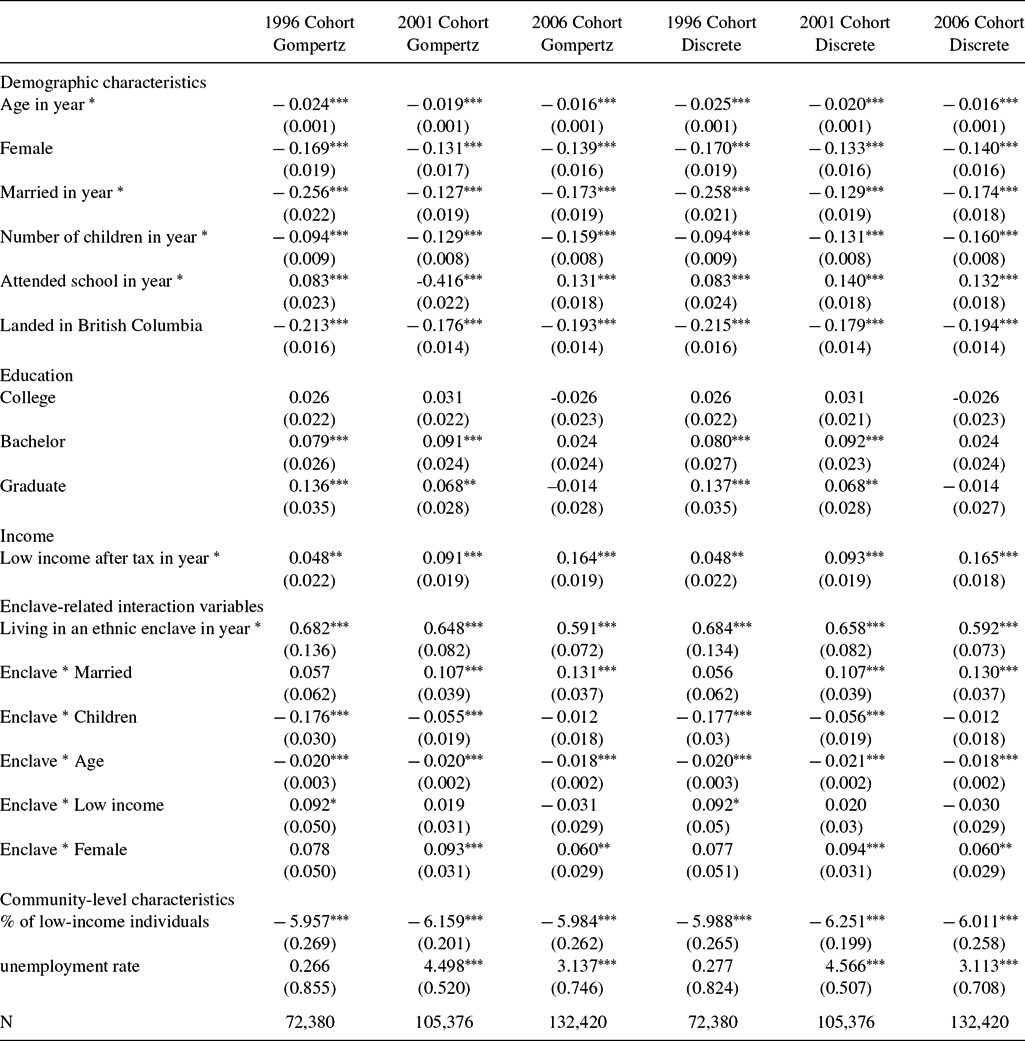
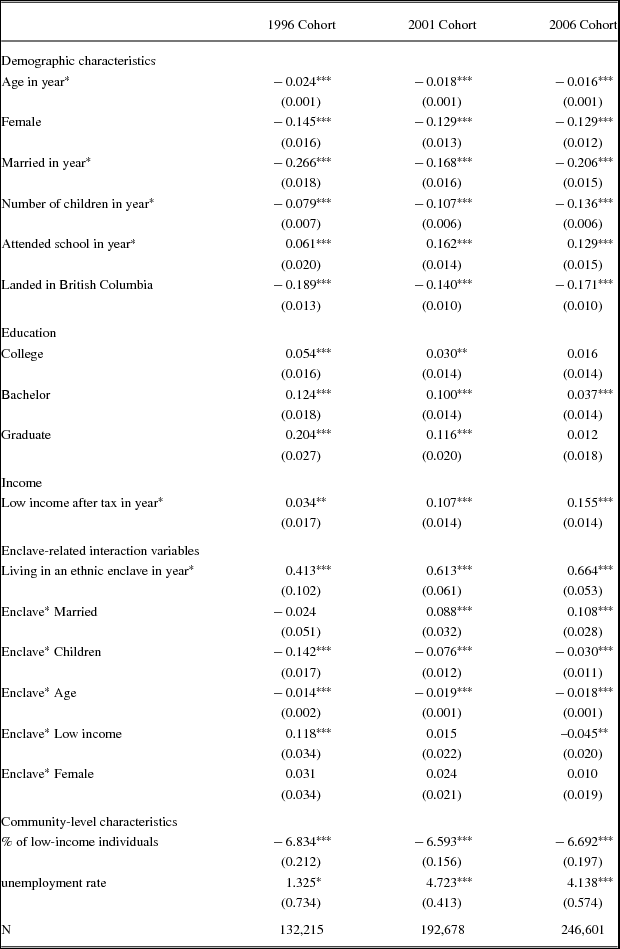
All the model specifications control for a rich set of information linked to the decision of migration for immigrants from B.C. The analysis is conducted respectively for three tax filing cohorts (1996, 2001, and 2006). Table 2 lists the estimated coefficients on some of the selected variables from the Gompertz and discrete hazard models, respectively.
Coefficients in the hazard model for each cohort in British Columbia
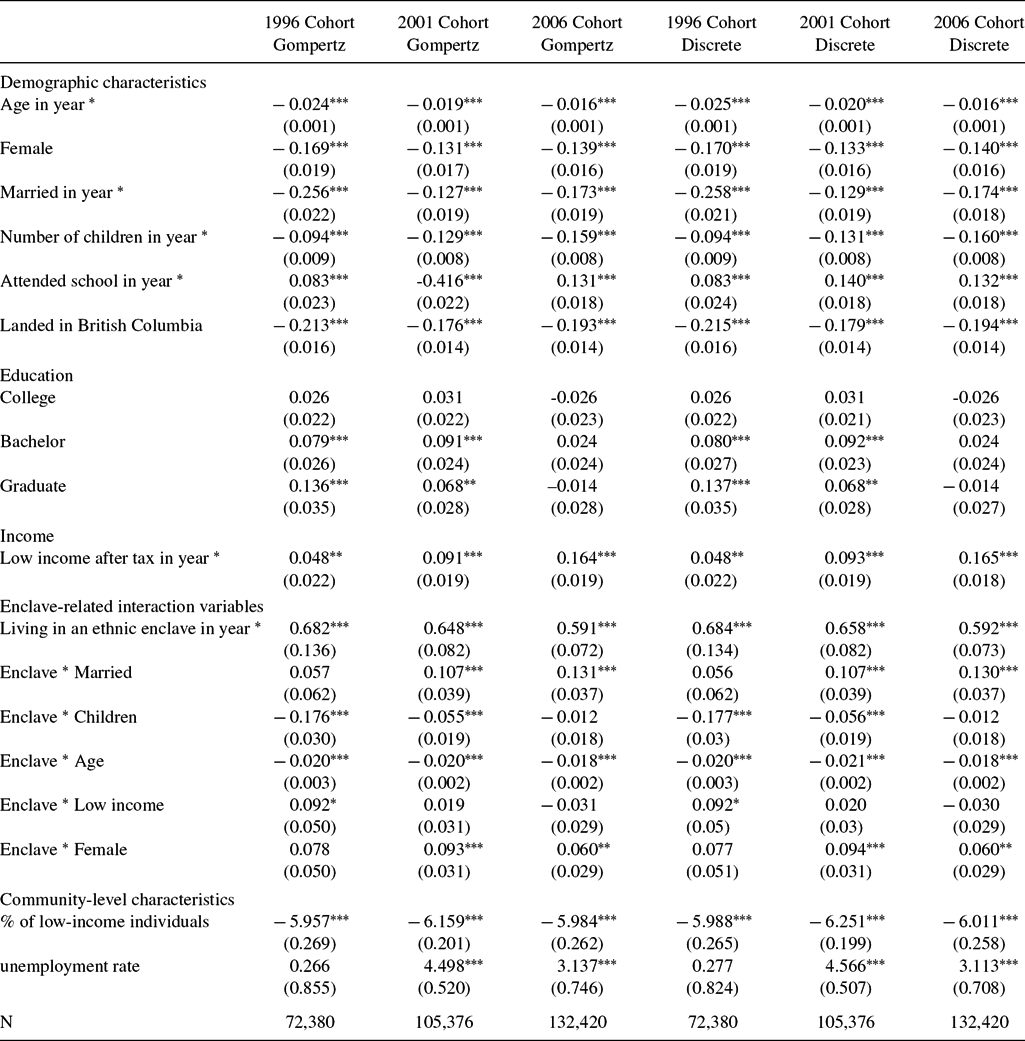
Notes: (1) Robust standard errors in parentheses, *** p < 0.01, ** p < 0.05, * p < 0.1. (2) The model also controls for occupational skill levels, self-employment status, prior-landing Canadian experience dummy, ability in official languages, total earnings, immigration category, years since arrival in Canada, source country, community-level house ownership rate, community-level education level, and an indicator of missing filing taxes in at least on year within each tracking widow. (3) “in year *”’ refers to the year of the survey, i.e., 1996, 2001, 2006, respectively. (4) Data source: Longitudinal Immigrant Database.
The coefficients are presented as their sign show the direction of our covariates on the risk of migration; however, the exponential of these coefficients defines the hazard ratio, which describes the relative risk of exit based on a comparison of events, which has a more direct interpretation on the risk of migration. Therefore, while we keep the presentation of the actual beta coefficients in the table, we discuss the 100*(1-exponential of these coefficients) (the percentage increase or decrease in the risk of migration).
Consistent with conventional wisdom, the results in Table 2 provide many stylized facts related to migration decisions of immigrants. In particular, older immigrants and female immigrants are less mobile and being in a married/common-law relationship is negatively correlated with the probability of migration across CSDs. Having more children appears to anchor immigrants to their current residential locations. Further, if immigrants initially landed in B.C., it is more likely that they will stay in the same CSD over the 5-year tracking period for each cohort. Taking post-secondary education in Canada is related with higher risks of mobility in the following five years for immigrants in B.C. and the “pushing” effect rises across cohorts. One possible explanation that could contribute to the cohort differences in the magnitude of the “anchor” and “oar” effects across cohorts could be the deteriorating economic environment from 1996 to 2006. Under depressed economic conditions, one would expect that immigrants’ migration decisions are mainly driven by economic factors and they will be more likely to ignore the demographic “anchors” in pursuit of economic benefits.
There are distinct patterns in how educational attainments are associated with migration patterns between the first two cohorts (1996, 2001) and the 2006 cohort. Specifically, compared to immigrants with a high school degree or lower, immigrants having obtained a bachelor or graduate degrees at the time of landing are more likely to be observed to move around in the first two cohorts of 1996 and 2001. However, no significant differences in mobility are shown among immigrants with different educational achievement in the 2006 cohort. Over the period spanning from 2006 through to 2010, low-educated immigrants are equally as mobile as their high-educated peers, which is not the case for the previous cohorts. One of the consequences of the oil boom in Alberta since 2000s is the labor shortages for the low-educated labors, which could explain part of the differences in the mobility patterns between educated and uneducated immigrants across cohorts.
The significant positive estimates of low-income status tell us that economic disadvantages in the initial year are associated with higher likelihood of migration in the following years. Furthermore, the positive impact of low-income status on mobility increases dramatically from 1996 to 2006 for immigrants living in non-ethnic regions, which supports our previous hypothesis that immigrants are more likely to move around in a weak economic environment to look for better jobs. Immigrants living in regions, where many co-ethnic immigrants cluster do not, nevertheless, show this pattern across cohorts.
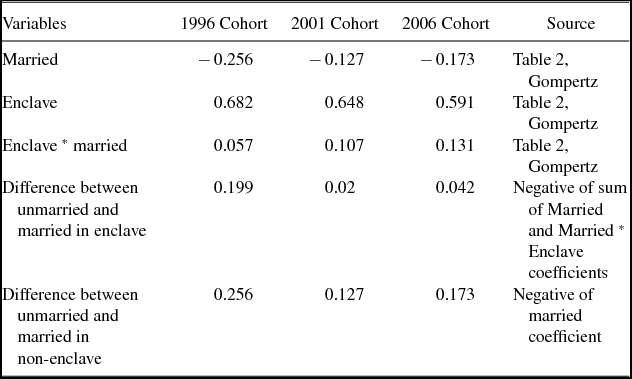
In addition, the impacts of many demographic and economic factors on the probability of migration of immigrants vary, in terms of either signs or magnitudes; according to whether the immigrants live in an ethnic community (these are the enclave interaction terms). Table 3 lists the detailed comparison of mobility pattern by marital status and the ethnic enclave. For example, the relative mobility tendency between married immigrants and their unmarried peers is larger for those living in non-ethnic enclaves compared to that living in an ethnic clustered community, although in both regions married immigrants are always less mobile than their single counterparts. This is consistent with our hypothesis from the introduction that the “inhibition” impacts of marriage/common-law relationship on mobility of immigrants are much weaker for those living in ethnic communities than that of immigrants living in non-ethnic enclaves because married immigrants have their family companions and are less likely to feel lonely in non-ethnic regions. Interestingly, similar patterns are found for the gender variable with the female “anchor” effect on mobility being much smaller for those living in ethnic neighborhoods than those living in ethnic communities.

Further, the impact of economic factors (low-income status) on mobility gets stronger for immigrants living in co-ethnic concentrated CSDs than those living in areas with fewer compatriots, which could be explained by the possibility that although many social facilities are provided by ethnic-enclaves such as local amenities, ethnic networks, etc., economic well-being could potentially offset all these demographic “anchors” in terms of making migration decisions. In contrast, the differential impacts of children and age on mobility between immigrants in co-ethnic areas and those in non-enclaves depend on the number of children they have and their age.
Finally, two interesting community-level mobility related facts are suggested by the rest of the estimates in Table 2. First, immigrants living in a poor area with a higher proportion of people in low-income families are significantly less likely to migrate across CSDs. The existence of this negative peer effect requires further exploration, and could stem from two sources: (1) living with people in similar disadvantaged economic positions may allow people to have support from each other so that they have lower incentives to move to another place; (2) immigrants with lower earnings could be generally less mobile and they self-select themselves to live together. We do not know which of these (if any) is true. At last, the higher the unemployment rate is in the area, the more likely it is that immigrants living in this region will move to other places while holding all other factors constant. This effect is much more pronounced in the last two cohorts, and could also be explained by the fact that since earlier 2000 many other areas such as those in Alberta underwent dramatic economic developments and therefore, there is an uneven labor demand across regions in Canada. In Table 4, we present results from a Vuong Test, which point to Gompertz as the best fitting model.
Vuong test results

9. CONCLUSION
In this paper, we identify some of the individual, household and community-level determinants of migration behavior of immigrations in B.C. We find distinct mobility patterns between immigrants, who live in an ethnic enclave and those who do not. Self-selection may contribute to the choice an immigrant makes for a place of residence, rather than other observed factors like years since arrival, housing structure, access to amenities, etc. Future longitudinal analysis that assesses location-related outcomes needs to take these selection issues into account.
First, we find that, under depressed economic conditions, migration decisions are largely driven by economic factors, and that socio-demographic factors like marital status are less consequential. Conversely, when economic conditions are better for immigrants, they will be more likely to consider socio-demographic factors when they make migration decisions. These findings are consistent with the work of others, such as Hou (Reference Hou2007) and McDonald (Reference McDonald2004).
The strength of economic factors (such as low income prevalence) on mobility is stronger for immigrants living in co-ethnic CSDs than it is for those living in areas with fewer co-ethnic residents. In some studies, these disparities are explained by looking at time of arrival, where more recent arrivals are expected to cluster in co-ethnic neighborhoods, and less recent arrivals will be more dispersed. Since we control for years since migration to Canada in our analysis, duration can be eliminated as an explanation, implying that other factors are driving the trends. It is possible, for example, that compared to many of the social facilities that are provided by the ethnic-enclaves such as local amenities, ethnic networks, etc., economic well-being is more appealing to those in low income, which could offset all these demographic “anchors” in terms of making migration decisions. It is an area worthy of further study.
One of the novel findings in this study concerns the differential impacts of marital status on migration decisions between immigrants living in ethnic enclaves and those living in communities with fewer co-ethnic residents. We find that being married has a higher “anchor” impact on mobility of immigrants living in non-ethnic enclaves than those living in ethnic enclaves. In contrast, single immigrants have much higher mobility probability than their married counterparts living in non-enclaves than that of those living in enclaves. A possible explanation for this disparity is married individuals have “built-in” social network at home, thus reducing the utility of an enclave. That said, children counteract this effect, presumably because parents will once again value the tangible benefits that living in an enclave can provide families with children, such as co-ethnic children's activities and events. It is interesting to see that female immigrants are less mobile than their male counterparts; however, this “inhibition” effect is much weaker for immigrants living in enclaves than that on those living in non-ethnic enclaves.
Based on the main findings from this paper, we have derived the following policy implications in terms of addressing uneven immigrant distribution across regions: (1) considering that married immigrants (especially with children) are generally less mobile after landing, their initial landing place is critical because they are most likely to permanently stay in the initial landing locations overtime. Therefore, how to lead new immigrant families to land in non-ethnic regions could be seen as a potential way to reduce immigrant clustering; (2) Immigrants with children and single immigrants are shown to be more attracted by tangible benefits provided by ethnic enclaves. One would expect it is easier for single immigrants to find partners and friends in ethnic-enclaves, while parents might want immigrant children to learn their own ethnic culture and languages, which are more available in enclaves. Accordingly, policy makers could implement corresponding ethnic culture promotion programs or increase social interactions between immigrants and non-immigrants in non-ethnic-clustering regions to attract immigrants to these areas; and (3) Consistent with other studies, we find that immigrants are quite responsive to economic factors when making their location decisions. Thus, it is of great importance to equip immigrants with timely and comprehensive information on smaller local labor market conditions across regions so that they are aware of where job opportunities could potentially exist, which will allow them to move to non-clustering immigrant areas with higher economic growth rate.
APPENDIX
Comparison of basic statistics in IMDB tax file with Census

Coefficients from the Gompertz hazard model for each cohort in British Columbia, without controls for occupational skill levels