INTRODUCTION
In contrast to freshwater and anadromous species, many marine species possess relatively weak population structures maintained by attributes such as large population sizes, high within-population genetic variances, high fecundity and pelagic larvae (Palumbi, Reference Palumbi1992; Kenchington et al., Reference Kenchington, Patwary, Zouros and Bird2006). However, increasing numbers of studies of significantly differentiated populations in marine fish are inconsistent with this general expectation (e.g. Liu et al., Reference Liu, Gao, Wu and Zhang2007; Han et al., Reference Han, Gao, Yanagimoto and Sakurai2008, Reference Han, Yanagimoto, Zhang and Gao2012). A number of mechanisms have been suggested to explain the genetic structure in these cases, which were related to the Pleistocene isolation, biological characteristics, behaviour of the species and ecological or hydrographic barriers to dispersal (reviewed in Kenchington et al., Reference Kenchington, Patwary, Zouros and Bird2006). The North-western Pacific was characterized by marginal seas, which were particularly impacted by Pleistocene glacial cycles (Shen et al., Reference Shen, Jamandre, Hsu, Tzeng and Durand2011). As a consequence, both intraspecific genetic diversity and species diversity of marine organisms in this area are believed to have been influenced by the Pleistocene glacial cycles (Ni et al., Reference Ni, Li, Kong and Yu2014). Previous genetic studies conducted in the North-western Pacific mainly focused on the influence of Pleistocene glacial cycles. However, besides historical processes, some genetic studies showed that contemporary physical barrier outflow of the Yangtze River between the East China Sea and Yellow Sea might be responsible for the genetic differentiation in the studied area (Dong et al., Reference Dong, Wang, Han, Ke, Zhan, Nakano and Williams2012; Han et al., Reference Han, Zhu, Zheng, Li and Shui2015).
Marine benthic invertebrates differ from marine fish and pelagic invertebrates in that the adults are typically sessile or have limited ranges of mobility (Kenchington et al., Reference Kenchington, Patwary, Zouros and Bird2006). The high dispersal capability during the larval stage may compensate for constraints on adult migration. Consequently, larval transport is expected to play a prominent role in facilitating gene flow and determining population structure. The mantis shrimp Oratosquilla oratoria provides an interesting case for the study of genetic structure in marine organisms. First, it has biological character associated with panmixia or weak genetic structure, which has a long-lived (36–59 days) passive larval dispersal stage (Hamano & Matsuura, Reference Hamano and Matsuura1987). Second, the basically burrowing nature of the adult, and significant phenotypic divergence in salinity and temperature tolerance and growth, are suggestive of population subdivision and local adaptation (Liu et al., Reference Liu, Xu and Lin2006, Reference Liu, Wang, Jiang and Chen2012). Oratosquilla oratoria is one of the most abundant benthic crustaceans in the East China Sea and Yellow Sea, and an economically important fisheries resource of China and Japan (Liu & Cui, Reference Liu and Cui2010). As a commercial species, knowledge of its genetic structure provides essential information to underpin resource recovery and aid in delineating and monitoring populations for fishery management. However, previous studies have been mainly biological, studying for example growth, reproduction and feeding habits (Yamasaki, Reference Yamasaki1988; Wang et al., Reference Wang, Chen and Sun1998), and there have been few publications concerning genetic population subdivisions of O. oratoria (Zhang et al., Reference Zhang, Ding, Ge, Zhang, Tang and Yang2014; Du et al., Reference Du, Cai, Yu, Jiang, Lin, Gao and Han2016). Two opposing results for the population subdivision in the East China Sea and Yellow Sea were revealed by the previous mitochondrial DNA 16S rRNA and COI genes. Lack of genetic structure within the East China Sea and Yellow Sea was shown in O. oratoria by the mtDNA COI gene (Zhang et al., Reference Zhang, Ding, Ge, Zhang, Tang and Yang2014); while significant genetic differentiation between populations of East China Sea and Yellow Sea was detected in our previous results by the mtDNA 16S rRNA (Du et al., Reference Du, Cai, Yu, Jiang, Lin, Gao and Han2016).
To confirm the degree of genetic divergence between populations of the East China Sea and Yellow Sea, we again reported on the genetic structure of O. oratoria collected from nine geographic locations with the mtDNA COI gene. MtDNA encodes 13 proteins, all playing vital roles in the electron transport chain. In a previous study, Ka/Ks (non-synonymous/synonymous substitution rates) ratio was used to detect functional constraints of the mtDNA encoding gene in birds and mammals (Shen et al., Reference Shen, Shi, Sun and Zhang2009). Therefore, the functional constraint acting on the fragment of COI gene was assessed to detect the possible evolution selection by the Ka/Ks ratio.
MATERIALS AND METHODS
Sample collection
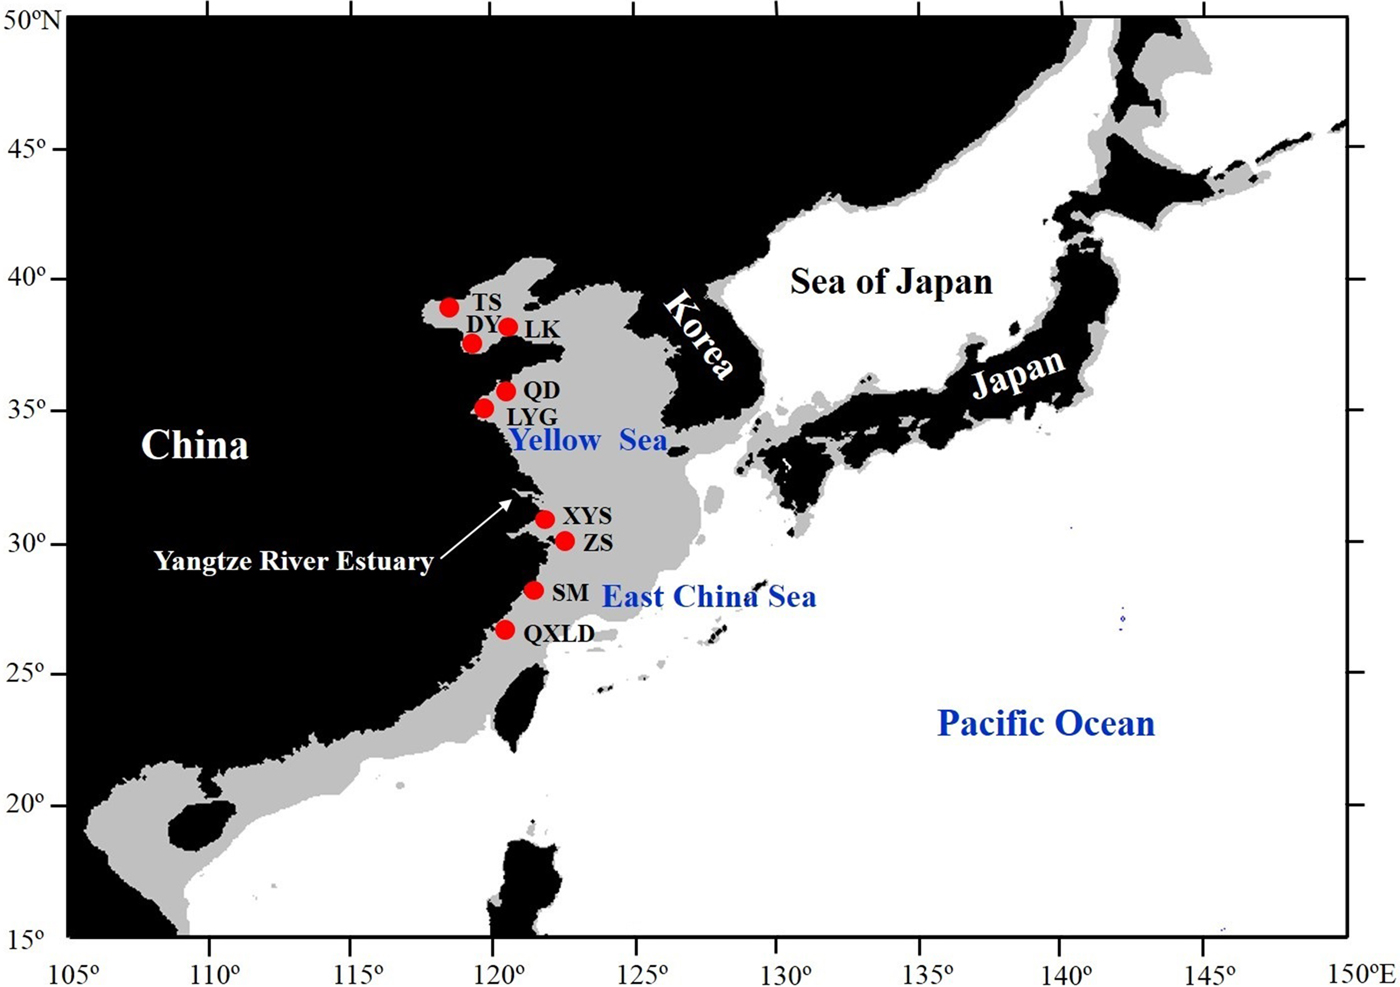
A total of 212 individuals of O. oratoria were collected from nine geographic locations in the East China Sea and Yellow Sea from 2011 to 2015 (Figure 1 and Table 1) by fishery resources surveys. Two species (Erugosquilla woodmasoni, Miyakea nepa) (GenBank accession numbers: MF173600–MF173603) from family Squilloidea were collected from coastal waters of Xiamen to serve as an outgroup for phylogenetic analyses. The samples were frozen in Zhejiang Ocean University. Muscle samples were obtained and preserved in 95% ethanol or frozen for subsequent DNA extraction.
Map showing sample locations of Oratosquilla oratoria, samples are marked by abbreviations that correspond to Table 1. Shaded sea areas are continental shelves that would have been exposed to the air during periods of low sea level.

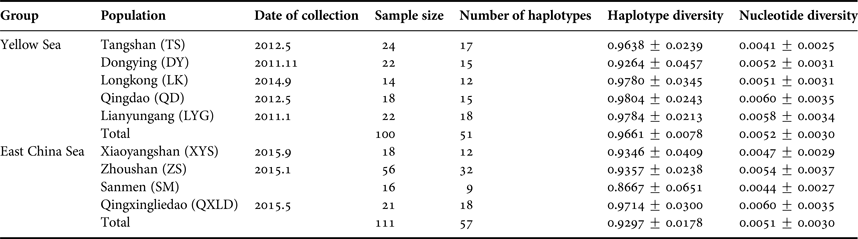
Sampling information and genetic diversity index of Oratosquilla oratoria.

DNA extraction, amplification and sequencing
The total genomic DNA was extracted using a standard phenol–chloroform method. DNA was subsequently resuspended in 100 µl of TE buffer (10 mmol l−1 Tris-Cl, 1 mmol EDTA, pH = 8.0).
Partial mtDNA COI gene sequences were amplified by polymerase chain reaction (PCR) using the universal primers L1491 (5′TTTCTACAAATCATAAAGACATTGG-3′) and H2198 (5′TAAACTTCAGGGTGACCAAAAAATCA-3′) (Folmer et al., Reference Folmer, Black, Hoeh, Lutz and Vrijenhoek1994). PCR was carried out in 50 µl volumes containing 1.25 U Taq DNA polymerase (Takara Co., China), 20 ng template DNA, 200 nmol l−1 forward and reverse primers, 200 µmol l−1 of each dNTPs, 10 mmol l−1 Tris, pH 8.3, 50 mmol l−1 KCl, 1.5 mmol l−1 MgCl2. The PCR amplification was carried out in an Eppendorf Mastercycler 5331 under the following conditions: 3 min initial denaturation at 94°C, and 40 cycles of 45 s at 94°C for denaturation, 30 s at 50°C for annealing, and 45 s at 72°C for extension, and a final extension at 72°C for 10 min. All sets of PCR included a negative control reaction tube in which all reagents were included, except template DNA. Sequencing of PCR product was conducted on an ABI Prism 3730XL (Applied Biosystems) automatic sequencer with both forward and reverse primers.
Data analysis
All COI sequences were edited and aligned using DNAStar software (DNAStar, Madison, WI, USA). Molecular diversity indices such as number of haplotypes, polymorphic sites, transitions, transversions and indels were obtained using ARLEQUIN v3.5 software (Excoffier & Lischer, Reference Excoffier and Lischer2010). Haplotype diversity (h), nucleotide diversity (p) and their corresponding variances were calculated after Nei (Reference Nei1987) as implemented in ARLEQUIN.
Genetic relationships among haplotypes were reconstructed using the neighbour-joining (NJ) method (Saitou & Nei, Reference Saitou and Nei1987) implemented in Mega 6.0 (Tamura et al., Reference Tamura, Stecher, Peterson, Filipski and Kumar2013). Bootstrap analysis with 1000 replicates was conducted to evaluate the support for phylogenetic relationships (Felsenstein, Reference Felsenstein1985). Genetic relationships were also examined by constructing haplotype networks using the reduced median-network approach (Bandelt et al., Reference Bandelt, Forster, Sykes and Richards1995).
Population genetic structure was evaluated with F ST statistics and AMOVA in ARLEQUIN. Genetic distances between haplotypes were found using the Kimura-2P model (Kimura, Reference Kimura1980) given by the Modeltest (Posada, Reference Posada2008). The significance of the F ST was tested by 10,000 permutations. We conducted AMOVA with two groups (East China Sea and Yellow Sea) based on the geographic distribution of two clades. Samples from Xiaoyangshan island, Zhoushan, Sanmeng, Qixing archipelago belonged to the East China Sea group. Samples from Tangshan, Dongying, Longkou, Qingdao and Lianyungang belonged to the Yellow Sea group. The significance of the covariance components associated with the different possible levels of genetic structure was tested using 1000 permutations.
Two different approaches in ARLEQUIN were applied to understand the demographic changes in O. oratoria. First the D test of Tajima and F S test of Fu were used to test if neutrality holds (Tajima, Reference Tajima1989; Fu, Reference Fu1997). Significant negative D and F S statistics can be interpreted as signatures of population expansion. Historic demographic expansions were also investigated by examination of frequency distributions of pairwise differences between sequences (mismatch distribution), which is based on three parameters: θ0, θ1 (θ before and after the population growth) and τ (time since expansion expressed in units of mutational time) (Rogers & Harpending, Reference Rogers and Harpending1992). The concordance of the observed with the expected distribution under the sudden expansion model of Rogers was tested by means of a least squares approach (Rogers & Harpending, Reference Rogers and Harpending1992). Both mismatch analysis and neutrality tests were performed separately on the entire sample and in the lineages suggested by NJ tree. The mutation rate of 2.33%/My for COI gene was applied to calculate the divergence time between the two lineages and expansion time within lineages in the present study (Zhang et al., Reference Zhang, Ding, Ge, Zhang, Tang and Yang2014).
To assess whether selection was acting on the COI gene, CodeML implemented in the PAML package (Yang, Reference Yang2007) was used to compute the Ka/Ks substitution rates between two clades. Model 1 was conducted, which allows the overall substitution rate and the ratio of Ka/Ks changes to have branch-specific values.
RESULTS
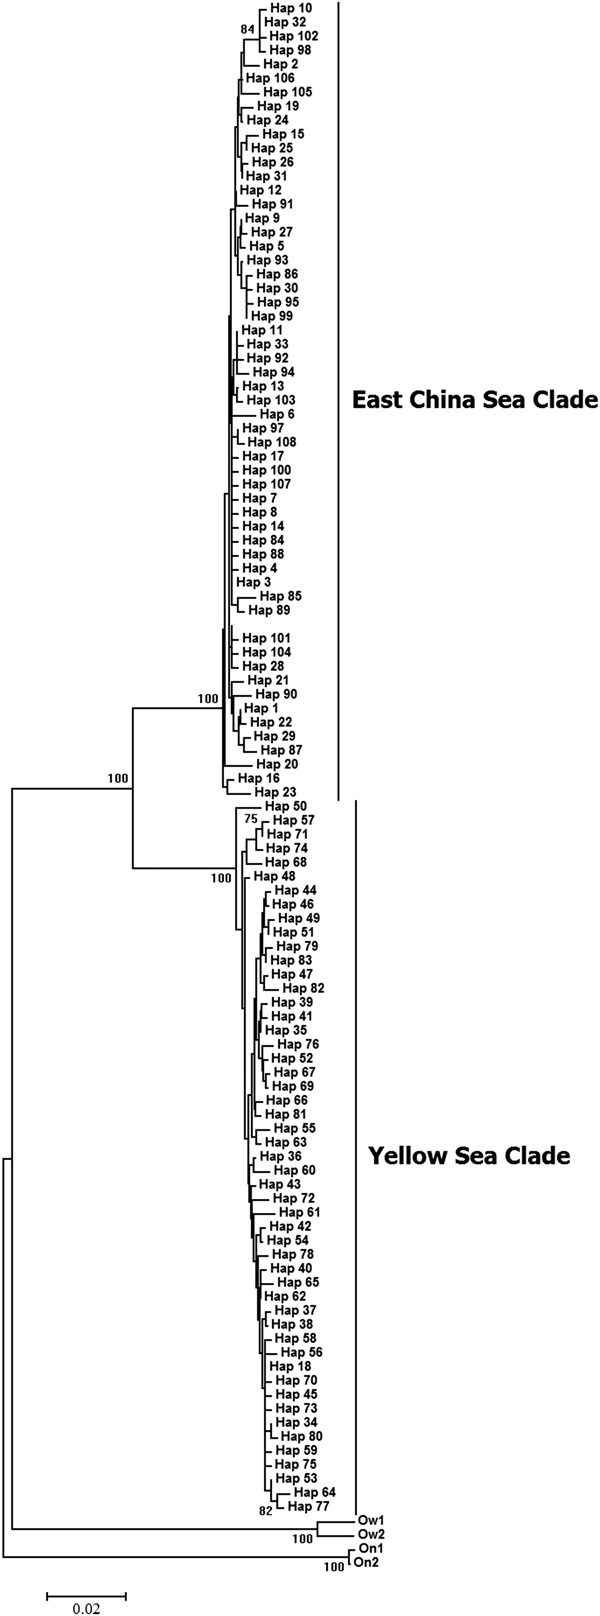
A total of 658 nucleotides of the COI gene were obtained from 212 individuals of O. oratoria. Among these sequences, 108 positions were variable, defining 108 haplotypes (GenBank accession numbers: MF173492–MF173599). Two reciprocal monophyly clades were revealed by the neighbour-joining (NJ) tree constructed with the COI gene (Figure 2). Five populations from the Yellow Sea formed the Yellow Sea clade, including 100 individuals. The East China Sea clade contained four populations from the East China Sea. The overall haplotype diversity and nucleotide diversity for the Yellow Sea clade were 0.9661 ± 0.0078 and 0.0052 ± 0.0030, respectively (Table 1). In the East China Sea clade, the overall haplotype diversity and nucleotide diversity were 0.9297 ± 0.0178 and 0.0051 ± 0.0030, respectively (Table 1). Across all nine populations, haplotype diversity (h) among populations varied from 0.9346 ± 0.0409 (XYS) to 0.9804 ± 0.0243 (QD), while nucleotide diversity ranged from 0.0041 ± 0.0025 (TS) to 0.0060 ± 0.0035 (QD and QXLD). The five populations in the Yellow Sea group showed relatively high genetic variation compared with the populations in the East China Sea Clade.
Neighbour-joining tree of COI gene haplotypes constructed using Kimura 2P distance for Oratosquilla oratoria. Bootstrap supports (>60%) with 1000 replicates are shown. Four individuals of Erugosquilla woodmasoni (Ow1 and Ow2), Miyakea nepa (On1 and On2) served as an outgroup.

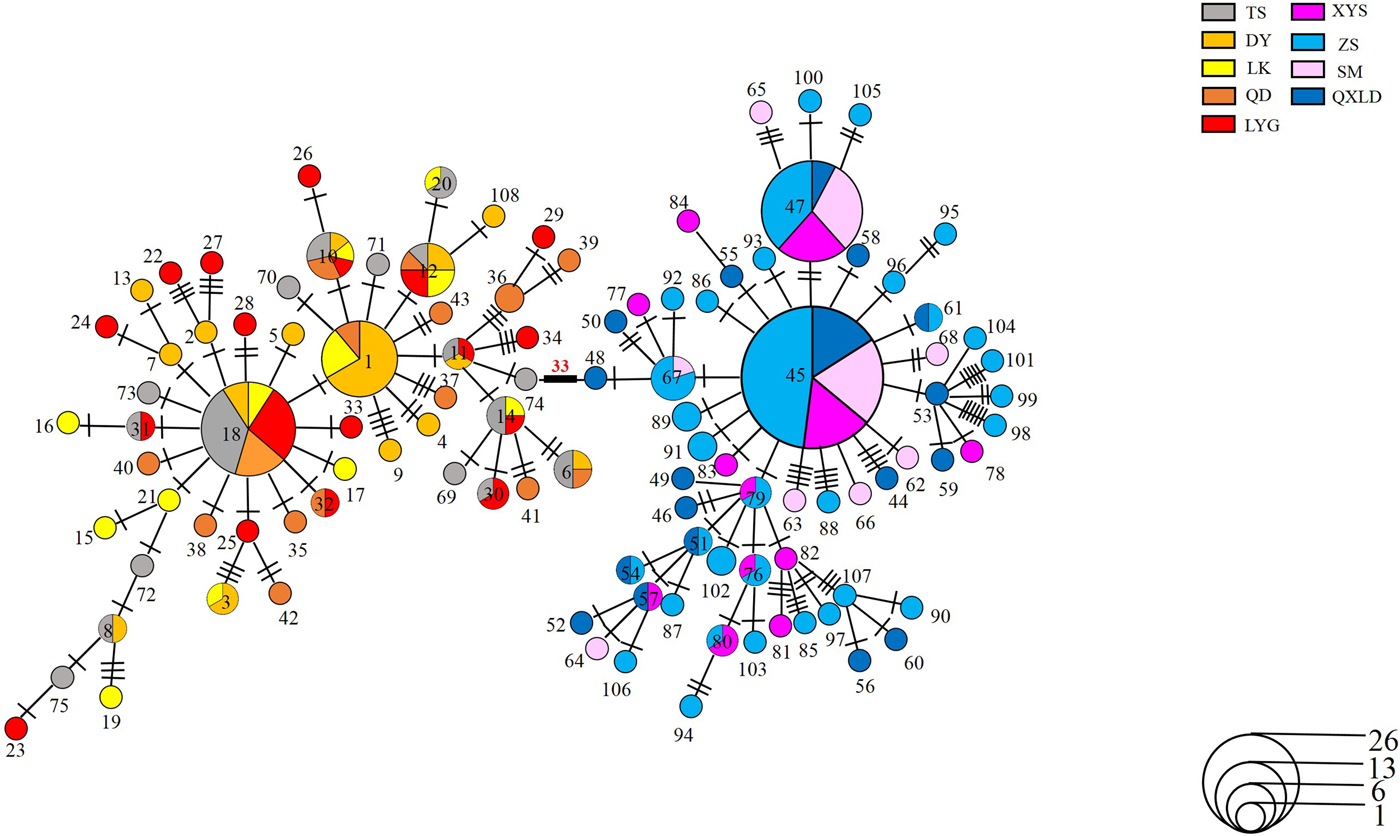
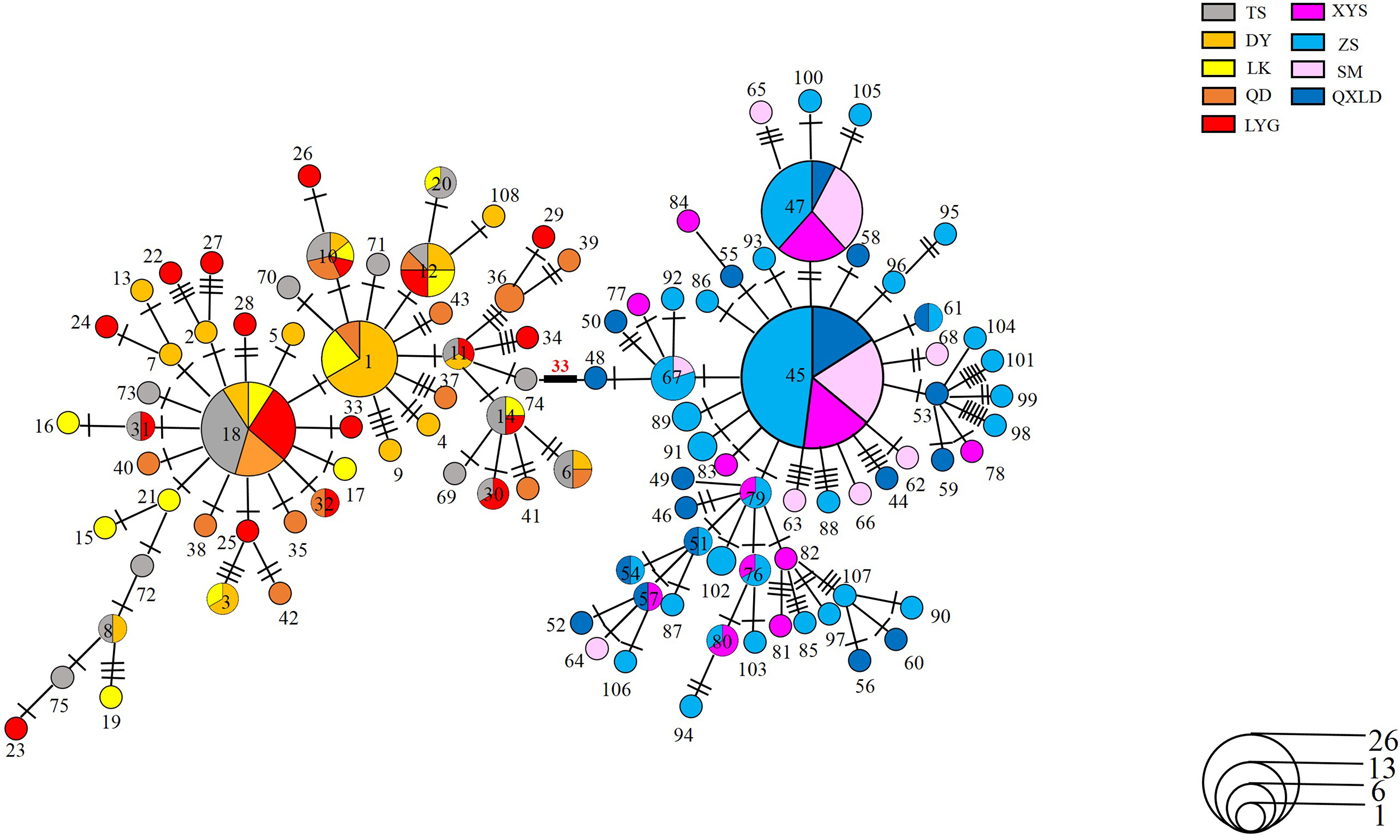
The average net genetic distance (Kimura-2P model) between the two clades (±SE) was 5.55% (±0.91%). The net genetic distance between outgroup species E. woodmasoni and M. nepa was 16.84%. The average net genetic distances between clades of O. oratoria and two outgroup species (E. woodmasoni and M. nepa) varied from 13.00 to 14.80%, suggesting two candidate cryptic species in O. oratoria. Applying the molecular clock of COI gene (4.66%/My), the divergence time of the Yellow Sea and East China Sea clades was about 1.18 million years before present. The average pairwise divergences between individuals within each of the clades (±SE) were 0.63% (±0.11%) and 0.52% (±0.12%) for East China Sea and Yellow Sea, respectively. The two clades were also identified by the network of 108 halotypes (Figure 3). The network of the Yellow Sea clade was star-like with a dominant haplotype shared by the five Yellow Sea populations; in the East China Sea clade, the dominant haplotype also formed the centre of a star-like network (Figure 3).
Reduced median network showing genetic relationship in Oratosquilla oratoria. Sizes of circles are proportional to haplotype frequency. Perpendicular tick marks on the lines joining haplotypes represent the number of nucleotide substitutions. The number of each circle represents the haplotype name.
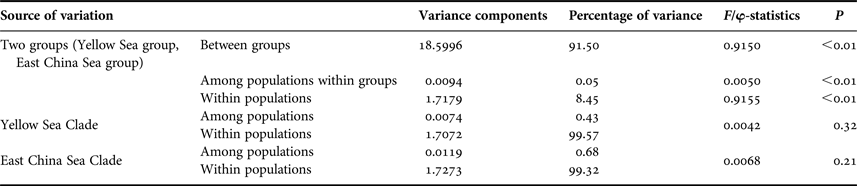
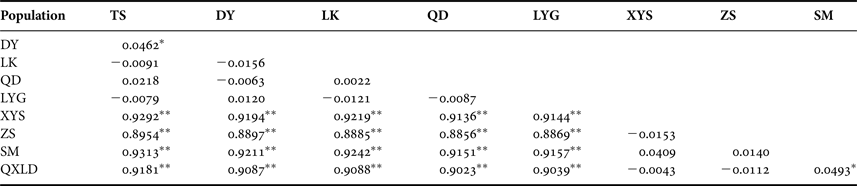
Significant separation of the East China and Yellow Sea clades was also supported by AMOVA (Table 2), with 91.50% of all variance being partitioned between the two clades (F CT = 0.9150, P < 0.01). The genetic structures of the populations within the two clades were also investigated by AMOVA. In the Yellow Sea clade, 99.57% of the genetic variation was found within populations, whereas 0.43% of the variation (P = 0.32) was detected between populations, indicating lack of population structure in the Yellow Sea populations. AMOVA analyses in the East China clade indicated a similar result. The genetic variation among populations of the East China Sea was small and not significant (0.68%, P = 0.21), indicating little genetic differentiation existed in the East China Sea clade (Table 2). Pairwise F ST values between the East China Sea and Yellow Sea populations were high and significant, suggesting limited gene flow between two clades (Table 3). Among the East China Sea populations, low pairwise F ST values were observed, ranging from −0.0153 to 0.0493, and only one comparison (between SM and QXLD) exhibited a significant value (Table 3). For the Yellow Sea populations, the genetic differences (F ST) between populations were low (−0.0091 to 0.0462) and the F ST value between TS and DY was statistically significant (P = 0.000).
AMOVA analysis of the genetic structure of Oratosquilla oratoria.

Pairwise F ST values among populations of Oratosquilla oratoria.

*P < 0.05; **P < 0.01.
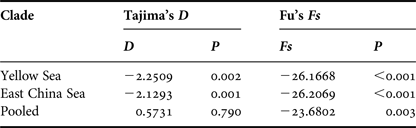
Tajima's D and Fu's Fs were used to test for neutrality, and the results in the two clades were similar (Table 4). All Tajima's D and Fu's values for two clades were negative and significant, indicating significant population expansion of O. oratoria in the East China Sea and Yellow Sea. Mismatch distributions, to explore the distribution of the number of pairwise differences between haplotypes, were unimodal, matching the sudden expansion model (Table 5). The tau value (τ), which reflects the location of the mismatch distribution crest, provides a rough estimate of the time when rapid population range expansion started. The observed values of the sudden expansion parameter (τ) were 2.6 and 2.65 U of mutational time for the Yellow Sea clade and East China Sea clade, respectively. Estimate of time of expansion for the Yellow Sea clade, based on the rates mentioned above for COI gene, was 84,800 years ago. For the East China Sea clade, this estimate was 86,400 years ago.
Tajima's D and Fu's Fs, corresponding P value for two clades of Oratosquilla oratoria.

Mismatch distribution parameter estimates for two clades of Oratosquilla oratoria based on the sudden expansion model.

aHarpending's raggedness index.
bSum of squared deviations.
The mean Ka/Ks ratios for the Yellow Sea group and East China Sea group were calculated based on model 1 in PAML. We found that the Ka/Ks ratio of the Yellow Sea group was higher than that of the East China Sea group (0.0067 vs 0.0001), indicating stronger purifying selection acting on the non-synonymous mutations in the East China Sea group.
DISCUSSION
The pattern of reciprocal monophyly, deep phylogenetic divergence between clades detected in O. oratoria indicated the existence of two cryptic species across its distribution. Our results confirmed the significant genetic divergence between the East China Sea and Yellow Sea, as first determined by the mtDNA 16S rRNA result, but conflicting with the previous study of Zhang et al. (Reference Zhang, Ding, Ge, Zhang, Tang and Yang2014), which revealed a lack of genetic structure in the studied area, but showed significant genetic divergence between the South China Sea and East China Sea.
The Pleistocene isolation and current physical barrier might be responsible for the complete genetic break between the East China Sea and Yellow Sea. The divergence time for the two distinct clades (about 1.18 million years) reflected an historical isolation event in this species, which might have occurred during the Pleistocene low sea-level period. Both the neutrality tests and the mismatch distribution analyses of the two clades in O. oratoria supported population sudden expansion, which was mainly concordant with the warm temperature and sea level rise in the North-western Pacific. Expansion times for the Yellow Sea Clade and East China Sea were 84,800 years ago and 86,400 years ago, respectively. The creation of two clades in this species was the result of an historical isolation event during the Pleistocene low sea-level period. In reality, a similar phylogeographic pattern was also observed in flathead mullet Mugil cephalus and the bivalve Cyclina sinensis (Shen et al., Reference Shen, Jamandre, Hsu, Tzeng and Durand2011; Ni et al., Reference Ni, Li, Kong and Zheng2012), although the magnitude of genetic subdivision varies among species.
The complete genetic break between the East China Sea and Yellow Sea also indicated that the contemporary genetic barrier prevented the mixing of two clades. For benthic species, the gene flow between distant populations is mainly through the dispersal of pelagic eggs or larvae (Song et al., Reference Song, Zhang, Sun, Yanagimoto and Gao2010). As discussed in our previous study, the freshwater outflow from the Yangtze River might prevent the dispersal of larvae of O. oratoria (Du et al., Reference Du, Cai, Yu, Jiang, Lin, Gao and Han2016). Low salinity and north shift of discharge from the Yangtze River during the reproductive season of O. oratoria may cause a disconnection between the Yellow Sea and East China Sea populations. This may, therefore, have isolated the Yellow Sea group and the East China Sea group. Previous genetic study of O. oratoria in Hong Kong using mtDNA control region has revealed a genetic patchiness pattern of O. oratoria in Hong Kong waters that may be attributable to the interplay between hydrographic conditions (e.g. salinity) and the species’ life history traits (Lui et al., Reference Lui, Leung, Ng and Leung2010). Similarly to the present study, a strong genetic break between the East China Sea and Yellow Sea populations has also been reported in cocktail shrimp Trachypenaeus curvirostris and limpet Cellana toreuma (Dong et al., Reference Dong, Wang, Han, Ke, Zhan, Nakano and Williams2012; Han et al., Reference Han, Zhu, Zheng, Li and Shui2015). Major rivers in other continents such as the Amazon and Orinoco have also been shown to be effective barriers to dispersal of the blennoid fish Ophioblennius (Muss et al., Reference Muss, Robertson, Stepien, Wirtz and Bowen2011), the surgeon fish Acanthurus bahianus (Rocha et al., Reference Rocha, Bass, Robertson and Bowen2002), and the sea urchins Diadema and Echinometra (Lessios et al., Reference Lessios, Kane and Robertson2003).
Besides the freshwater outflow from the Yangtze River and historical isolation in Pleistocene, local adaptation on the COI gene may also have contributed to the genetic differentation between the populations of Yellow Sea and East China. The different Ka/Ks ratios between the clades of Yellow Sea and East China Sea reflected different selection pressures and the local adaptation on the fragment of COI gene. Most phylogeography studies over the past 30 years based on mitochondrial markers assumed that selection was not acting on the molecule (Avise, Reference Avise2000). However, previous comparative genomic analysis of teleost and avian complete mitochondrial genomes provided evidence of functional constraints acting on mitochondria (Shen et al., Reference Shen, Shi, Sun and Zhang2009; Sun et al., Reference Sun, Shen, Irwin and Zhang2010), due to energy metabolism and/or thermoregulation, influencing the evolution of mitochondrial-encoded proteins, which contested the neutrality assumption. However, there are few studies focused on the selection pressure among different populations within species. Selection tests on the mtDNA cytb gene among different geographic populations of European anchovy, Engraulis encrasicolus revealed local temperature adaptation in cytb gene (Silva et al., Reference Silva, Lima, Martel and Castilho2014). In the present study, the East China Sea clade with high environmental temperature had a lower Ka/Ks ratio than that of the cold environment temperature clade in the Yellow Sea, which rejected the expectation from the comparative genomic analysis of teleost, that colder group species has experienced stronger selective constraints than the tropical and subtropical species groups. The lower value of Ka/Ks ratio in the East China Sea clade indicated strong selection pressure. The benthic biological character in O. oratoria could explain the different patterns of Ka/Ks ratio. The oxygen demand of the body increases with temperature. The imbalance between the dissolved oxygen in bottom water and demand oxygen was serious in benthic environment, which imposed more selection pressure on the high temperature group. This finding was consistent with recent genetic studies of M. cephalus species complex, in which water temperature was one of the main factors affecting the distribution of three NW Pacific cryptic species (Shen et al., Reference Shen, Jamandre, Hsu, Tzeng and Durand2011).
Different genetic patterns in the East China Sea and Yellow Sea were revealed by the present study and Zhang et al. (Reference Du, Cai, Yu, Jiang, Lin, Gao and Han2014). The sampling method might cause this difference. Only two locations in Zhang et al. (Reference Zhang, Ding, Ge, Zhang, Tang and Yang2014) were collected from the Zhoushan Islands in the northern part of the East China Sea. The sampling method in Zhang et al. (Reference Zhang, Ding, Ge, Zhang, Tang and Yang2014) was unknown. Some individuals of O. oratoria in Zhoushan fishing market were fished in the south Yellow Sea. In our study, to avoid any sampling error, the samples in the East China Sea and Yellow Sea were collected by the fishery resources survey. Based on the genetic studies of O. oratoria, the accurate sampling location was important for us to elucidate the genetic structure.
Although only a fragment of COI gene was analysed in the present study, our results contribute to a better understanding of the role of natural selection in influencing the genetic variation of marine species. It is possible that many more instances of selection may be hidden and remain unreported. Our results showed that two clades of O. oratoria experience significant genetic differentiation at the mitochondrial DNA level, and exhibit deep phylogenetic separation, indicating that the East China Sea and Yellow Sea clades may be different subspecies or species. Nuclear markers are needed to verify the taxonomic statues of two lineages. Additionally, more individuals and populations will be collected to detect the exact distribution of these two clades in the Yangtze River estuary. Based on these findings, conservation efforts are necessary to guarantee the genetic integrity of these distinct stocks.
ACKNOWLEDGEMENTS
This work was supported by the National Key Research and Development Program of China (2017YFA0604902), National Natural Science Foundation of China (31270527) and National Program on Global Change and Air-Sea Interaction (GASI-02-PAC-Ydspr).