


Introduction
Polythermal glaciers are widespread in Svalbard (Reference Dowdeswell, Drewry, Liestøl and OrheimDowdeswell and others, 1984; Reference Macheret, Zhuravlev and KotlyakovMacheret and Zhuravlev, 1985; Reference BamberBamber, 1989; Reference Macheret and KotlyakovMacheret and others, 1992). Recent analysis of radio-echo sounding (RES) data from Svalbard has shown at least 50 glaciers with clear two-layered internal structure, with an upper layer of cold ice and a lower layer of temperate ice (Reference Jiskoot, Murray and BoyleJiskoot and others, 2000).
Hansbreen is a well-studied polythermal glacier in Spitsbergen. Its two-layered hydrothermal structure was first determined from airborne RES data collected in 1977–79. This structure was confirmed by subsequent ground-based RES and ice-temperature measurements in boreholes. Radio-wave velocity (RWV) measurements by the common-midpoint method (CMP) and diffraction hyperbolae (Reference Macheret, Moskalevsky and VasilenkoMacheret and others, 1993; Reference MooreMoore and others, 1999), all of them made in spring before the start of the melting period, also confirmed the two-layered structure.
The approach of studying the hydrothermal changes in glaciers by repeated RES was previously applied on Athabasca Glacier, Canada (Reference GoodmanGoodman, 1973), Variegated Glacier, Alaska, USA (Reference Jacobel and AndersonJacobel and Anderson, 1987), and Fridtjovbreen, Spitsbergen (Reference Macheret and GlazovskyMacheret and Glazovsky, 2000), showing distinct changes in internal structure and water inclusions with time. This motivated the recent radiophysical investigations undertaken at Hansbreen in July–August 2003 and April 2004. The set of experimental studies included: (a) repeated RES profiling (at 20 and 25 MHz) along a particular profile transverse to the ice-flow direction near the equilibrium line; (b) repeated CMP RWV measurements at a point within this profile; (c) continuous radar measurements, with 1 min time interval during 8days, at a fixed point within this profile; (d) meteorological observations by an automatic weather station (AWS) during the whole period of radar observations; and (e) continuous ice surface velocity measurements from precise differential GPS (global positioning system) (DGPS) data collected at a fixed point in the profile.
This paper considers the RWV changes in the cold and temperate ice layers, as well as the changes in internal reflection power (IRP) and bedrock reflection power (BRP). RWV changes are considered in the context of water-content variations in temperate ice. The changes in IRP/BRP are examined against the variations in air temperature and ice velocity.
Geographical Setting
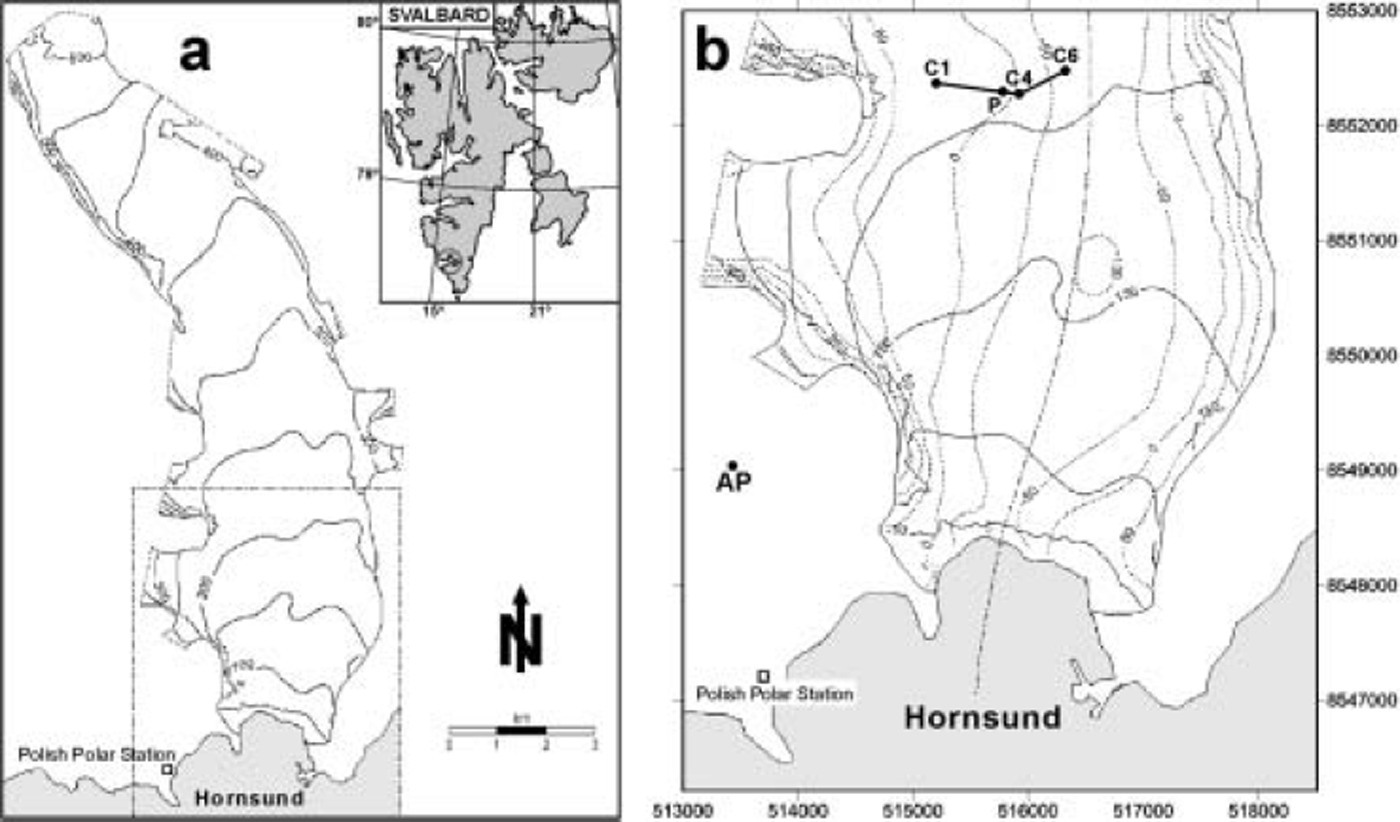
Hansbreen is a grounded tidewater glacier which flows into the fjord of Hornsund in southern Spitsbergen (Fig. 1a). The glacier is about 16km long and covers an area of 57 km2. The glacier tongue is about 2.5 km wide and terminates as a 1.5 km calving front. The lateral parts of the front are based on land. The glacier extends from 600m a.s.l. to sea level. The first 4 km up-glacier from the tongue have a reverse bed slope, and the central part of the glacier bed lies below sea level as far as 10 km up-glacier from the terminus (Fig. 1b). The maximum ice thickness is about 400 m. The thickness of the cold ice layer varies from 20 to 90 m and disappears at elevations above the firn line (Reference MooreMoore and others, 1999).
(a) Location map of Hansbreen. (b) Zoom showing the location of the transverse radar profile and the site for both CMP and fixed-point continuous measurements (P), nearly coincident at this scale. C1 and C6 are the extremes of the repeated profile, and C4 corresponds to the location of the stake for DGPS ice velocity measurements and the AWS. AP denotes Arieskardet Pass, one of the base stations used for DGPS.
Mass balance has been measured at the glacier since 1989. Mean winter accumulation in 2000 was 0.93 mw.e. and mean summer balance was –1.14mw.e., so the total net balance in 2000 was –0.21 m w.e. In recent years the mean equilibrium-line altitude (ELA) has varied between 320 and 370 ma.s.l. Ice surface velocity at the ELA is 30ma–1 (measured in 1988), but the glacier flows significantly faster towards the terminal ice cliff, exceeding 210 m a–1 near the terminus (Reference Jania, Mochnacki and GadekJania and others, 1996).
Ground-penetrating radar measurements at Hansbreen show that the temperate ice layer has an average water content of 1–2% during the winter, though in the zones of surface crevassing and moulins the water content increases to 3–7% (Reference MooreMoore and others, 1999). The water content of Hansbreen has also been observed to vary with depth: in spring 1988 the upper part of the temperate ice was two to three times more water-saturated than the lower part (Reference Macheret, Moskalevsky and VasilenkoMacheret and others, 1993; Reference Macheret and GlazovskyMacheret and Glazovsky, 2000).
Radar Equipment and Measurements
Two different low-frequency monopulse ice-penetrating radars were used for the fieldwork. For the CMP measurements and the fixed-point measurements, Video Impulse Radio Locator (VIRL) equipment was used (Reference Vasilenko, Sokolov, Macheret, Glazovsky, Cuadrado and NavarroVasilenko and others, 2002, Reference Vasilenko, Glazovsky, Macheret, Navarro, Sokolov and Shiraiwa2003), while a commercial Ramac ground-penetrating radar was employed for the repeated profiling during the ablation season.
The VIRL radar consists of transmitter, receiver and digital recording system (DRS). The transmitting system has a centre frequency of 20MHz and peak power of 1.8kW. The receiver has either a logarithmic or a linear amplifier, and the antennae are resistively loaded half-wave dipoles of 5.8m length. The synchronization between transmitter and receiver is achieved using either a high-frequency radio channel or an optic fibre link. The DRS provides a high signal-to-noise ratio (24dB by hardware and 32 dB with software) and a high rate of data acquisition: sampling interval is 5 ns for VIRL-2a and 2.5 ns for VIRL-6, and 4082 samples are recorded for each trace.
The Ramac/GPR was used with control unit CUII (pulse repetition frequency 100 kHz) and 25 MHz unshielded antennae (4.06 m long). The sampling interval was set to 4 ns, and 1000 samples were recorded for each trace.
The radar measurements included:
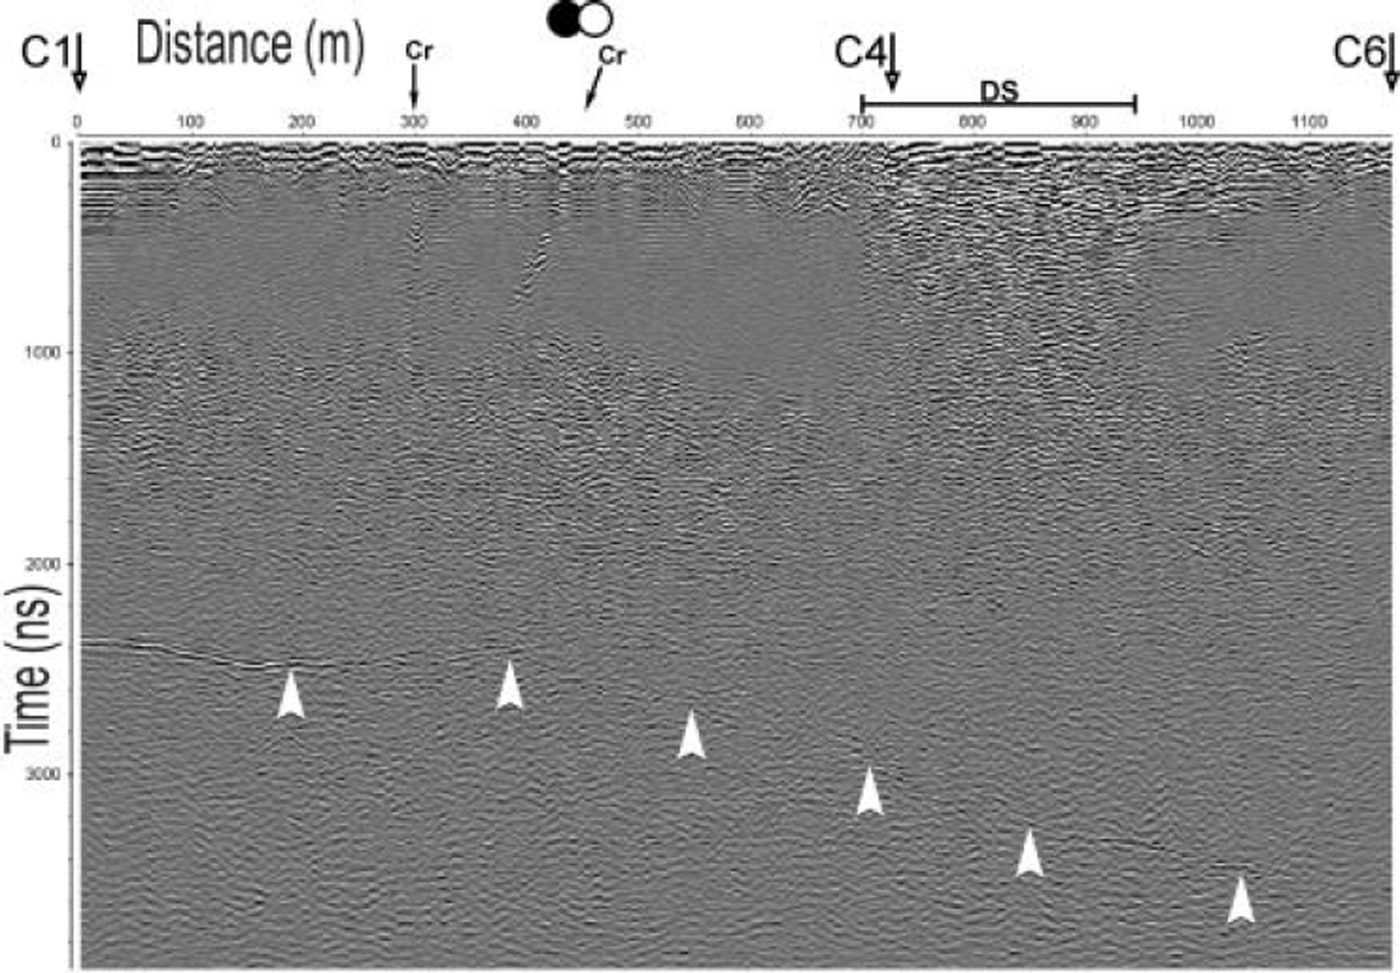
Repeated radar profiling along a particular profile transverse to the ice-flow direction, near the equilibrium line (see location in Fig. 1b). This profile was repeated 11 times with Ramac equipment during the period 17 July–4 August 2003. Figure 2 shows the migrated radar section for 23 July 2003.
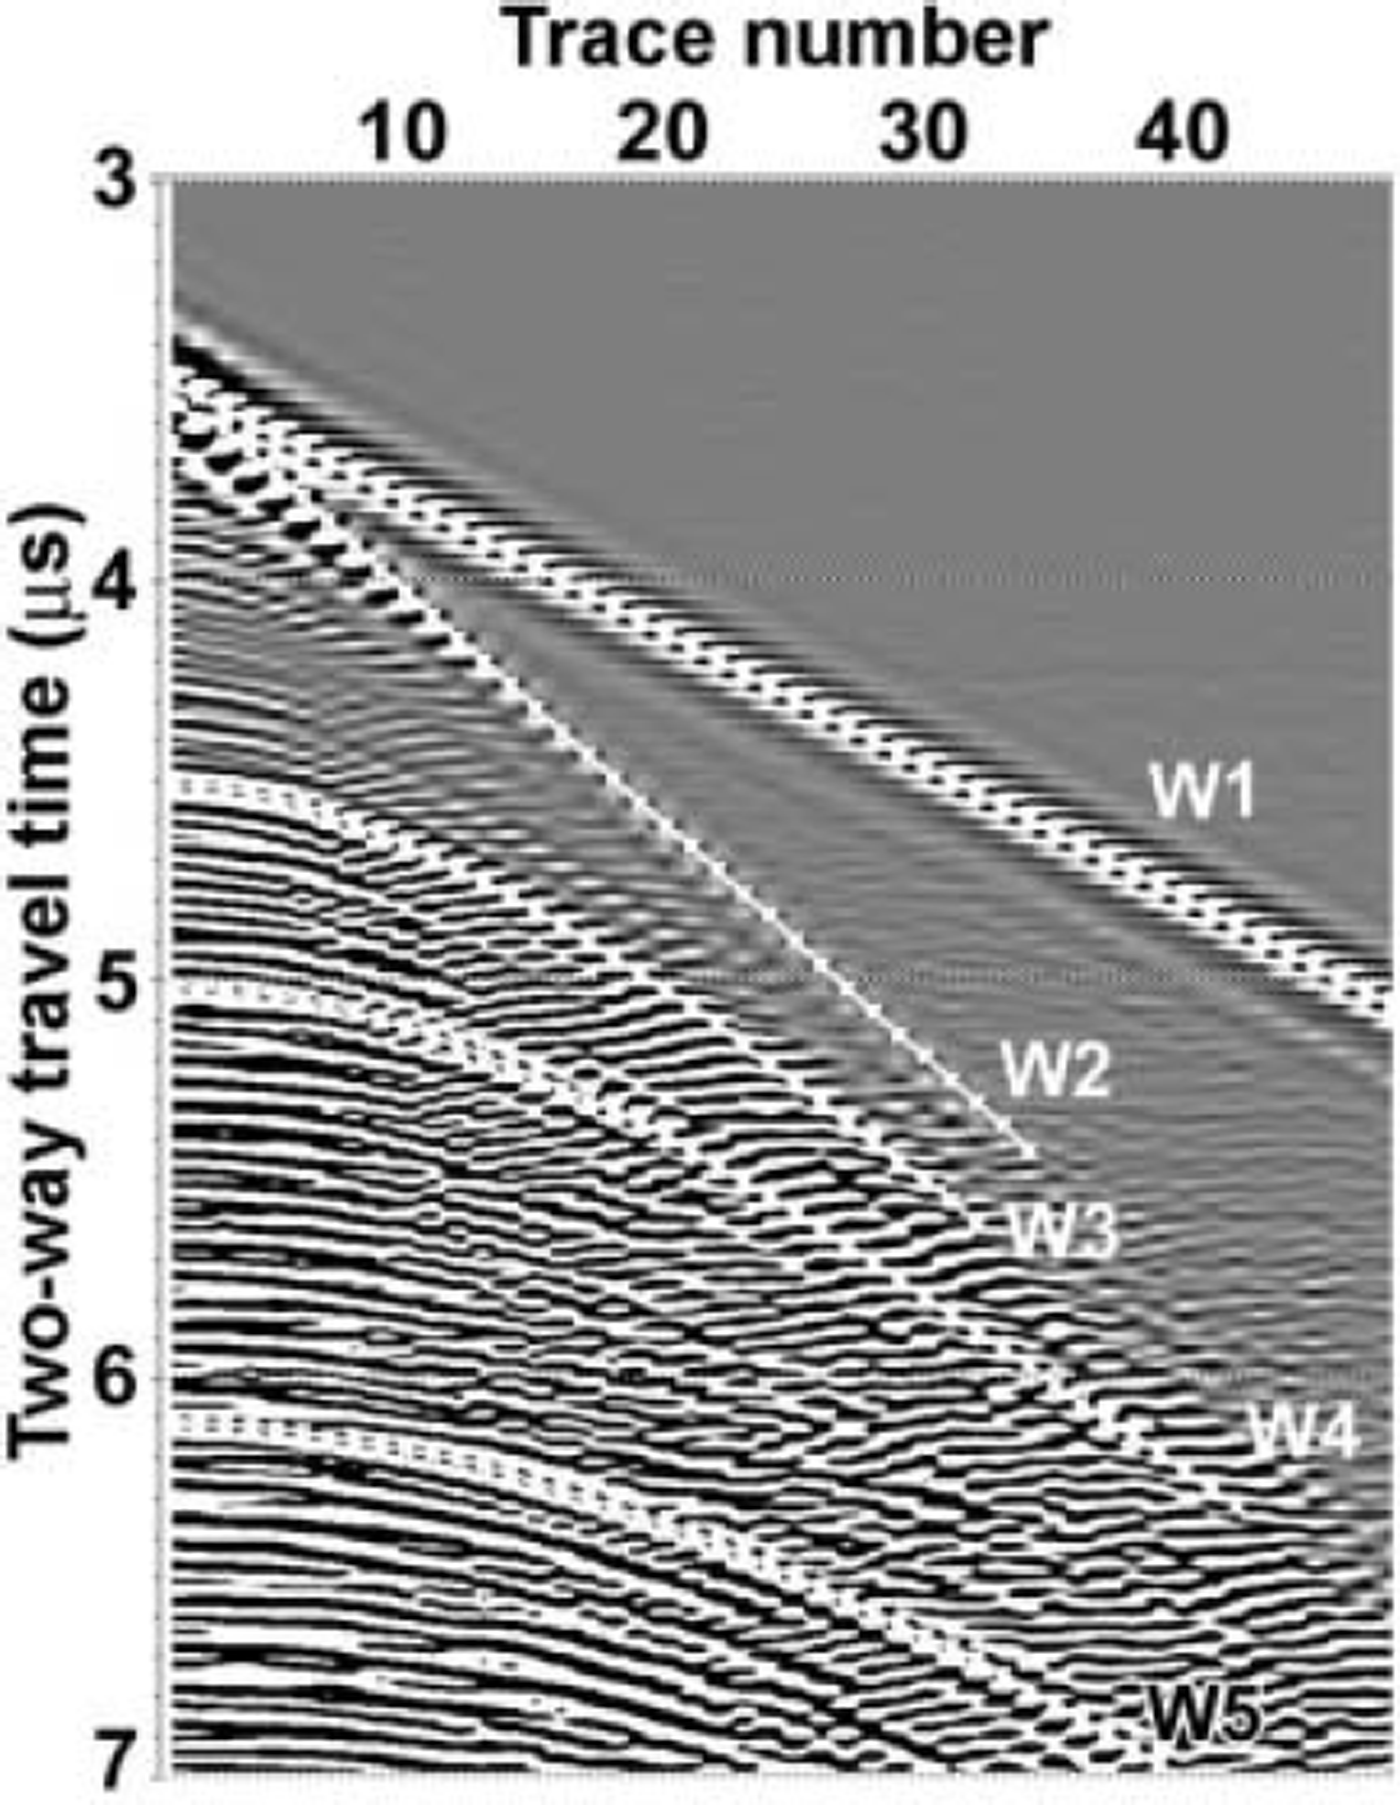
CMP RWV measurements, using VIRL-6 with 10 m offset increment, at a point within this profile (see location in Figs 1b and 2), repeated on 23 July (Fig. 3) and 7 August 2003 (CMP-1 and CMP-3, respectively) and on 11 April 2004 (CMP-4). The maximum separation between antennae was 480 m. The surface-elevation changes along the profile were measured by DGPS, and the RWV estimations corrected for such elevation changes.
Continuous radar measurements, with 1 min time interval during 8days, at a fixed point within this profile (see location in Figs 1b and 2), performed from 25 July to 1 August 2003. The VIRL-2a equipment was used for this purpose. The separation distance between transmitting and receiving antennae was 60 m.
Transverse radar profile obtained with Ramac radar on 23 July 2003. The positions of the sites for CMP and continuous radar measurements are shown as solid and open circles, respectively. Arrows labelled C1, C4 and C6 indicate stake positions, and Cr indicates crevasse location. DS marks the location of the area showing a well-developed drainage system. The white arrows show the bedrock reflection.
Example of CMP record obtained on 23 July 2003 (CMP-1). Direct wave through the air (W1), direct wave through the ice (W2) and reflected signals from bedrock (W5) and internal reflectors (W3 and W4) are accentuated.
Ice Velocity Measurements and Meteorological Data
Ice velocity at stake 4 (Fig. 1b) was measured by the static GPS method during the period 15 July–9 August 2003. The reference receiver, Leica SR530, was situated either at the Polish Polar Station in Hornsund or on the Arieskardet Pass (Fig. 1b), while the GPS receiver at stake 4 was an Ashtech Z-Surveyor. All coordinates used for ice velocity computations were achieved with ‘ambiguity fixed’ solutions.
During the full observation period, meteorological parameters in the studied area were recorded by an AWS located next to stake 4, with a scanning rate of 300 s and output data with hourly averages (except for the wind direction). In addition to the usual meteorological and radiation parameters, ablation measurements by a sonic ranging sensor were recorded.
Radar Data Processing
RES repeated profile data
The BRP and the IRP were defined by Reference Gades, Raymond, Conway and JacobelGades and others (2000) as one-half the sum of the squared amplitudes within a given time window divided by the number of samples within the time window. For BRP, the time window includes the bedrock reflection and spans a single wave period, while for IRP a time window of fixed width is used, which starts at a fixed time after the arrival of the direct waves though the air and through the ice surface, and ends before the bedrock reflection for the area of smallest ice thickness. This is probably suitable for the ice dome that Gades and others studied (Siple Dome, Antarctica), made of cold ice, without strong variations of ice thickness and showing a clear bedrock reflection, but it is not appropriate for our Hansbreen profile, made of cold and temperate layers, with strongly changing thickness and showing only a faint bedrock reflection.
We introduced the following changes: (1) BRP is computed using a time window of 175 ns width, encompassing several transmitted wave periods; (2) the IRP time window, of variable length, spans from the start of the radar record to the beginning of the BRP time window, with the effects of the direct waves removed by applying a subtracting average filter to the first 1100 ns of the radar records (this is made to preserve the near-surface information for areas such as that between 725 and 950 m in Figure 2, corresponding to a crevasse–moulin system).
We also computed a normalized depth-corrected bedrock reflection power (BRPN), as measured BRP divided by calculated BRP, where the calculated BRP was obtained by fitting the BRP vs two-way travel-time plot to an exponentially decaying function using radar records from different radar profiles made on the glacier. In this way, the calculated BRP represents the ‘average’ bed reflection properties as a function of depth. Additionally, we estimated the internal reflection energy (IRE), defined as IRP but without dividing by the number of samples within the time window. We think that, in our case, IRE is preferable to IRP, as it gives a measure of total energy, which is more suitable than average power when a variable-width time window is used. The level of background noise was estimated as noise power (NP), using a time window of 70 ns width ending before the arrival of the direct wave through the air.
Common-midpoint data
Five different arrivals were picked from the CMP records (see Fig. 3): the direct airwave (W1), used for estimating the delay time within the optic fibre cable and the synchronization system; the direct wave through the ice surface (W2); and the reflected waves from two different internal reflectors (W3 and W4) and from bedrock (W5), used to estimate the RWV in cold and temperate ice. The reflected wave W3 corresponds to the internal reflection horizon between cold and temperate ice layers, while wave W4 corresponds to a distinct reflector inside the temperate ice layer below the cold–temperate ice interface.
For the interpretation of CMP data we used two approaches: the ‘standard’ method for CMP RES data processing (Reference GreenGreen, 1938) and velocity analysis using the semblance method, originally developed for seismic data processing (Reference Neidell and TanerNeidell and Taner, 1971). The standard method is based on the calculation of the travel times of the waves reflected from bedrock or internal boundaries; the details may be found in Reference Macheret, Moskalevsky and VasilenkoMacheret and others (1993), though in our implementation we made corrections for the elevation changes along the CMP profile. The semblance method allows an estimate of the wave velocity as a function of depth by plotting a certain measure of coherency (using semblance coefficients) as a function of wave velocity and travel time.
Fixed-point data
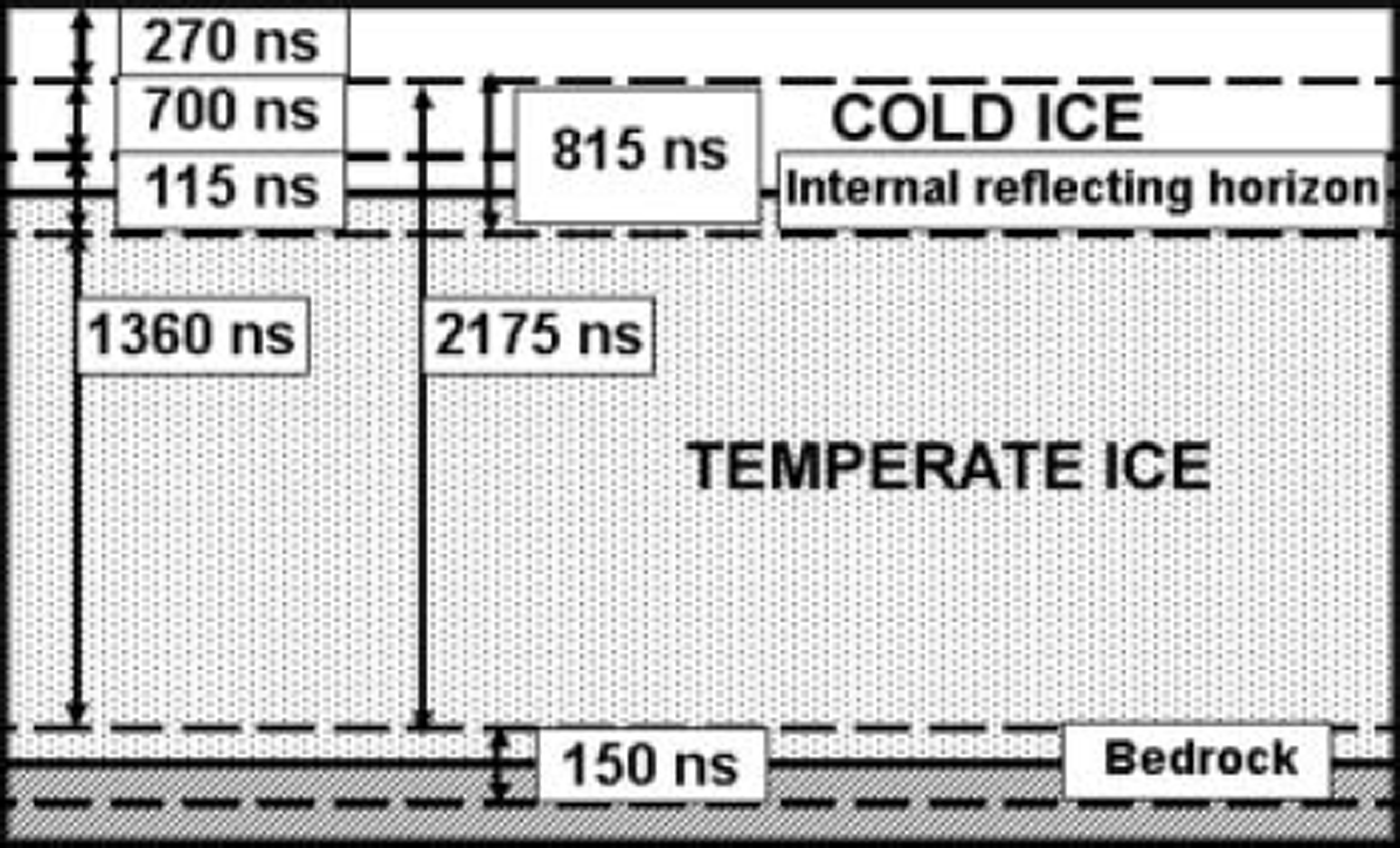
When processing the data from the continuous recording at a fixed site, reflected signals from both bedrock and the internal reflection horizon (interface between cold and temperate ice) were picked. We calculated power coefficients for interfaces and layers as one-half the sum of the squared amplitudes within given time windows (centred in interfaces or spanning layers, respectively) and divided by the corresponding time windows. In addition to BRP and IRP, as defined earlier, we estimated the power reflected from the interface between cold and temperate ice layers (horizon reflection power, HRP), the internal reflection power scattered in the cold ice layer (IRPC) and in the temperate ice layer (IRPT), and the reflection power for the sequence that includes the cold ice layer and the internal reflection horizon (IRPC&HRP). The transmitted power (TP) was also computed, using the uppermost time window, as we were interested in evaluating their temporal variations. The time windows used for all of these computations are shown in Figure 4.
Time windows used for power reflection calculations in the fixed-point experiment.
The temporal variations of the BRP under the fixed point might result from temporal changes in: (a) the bedrock reflection properties, (b) the power transmitted into ice, and (c) the reflection properties of the whole ice sequence above the bedrock. On the other hand, the temporal changes in IRP are a result of (b) and (c). Consequently, the normalization of BRP by IRP would attenuate the influence of the (b) and (c) components on the assessment of the variations of the intrinsic bedrock properties. The same procedure is valid to reveal the inherent reflection properties of the cold–temperate ice interface (normalization of HRP by IRPC) and of the temperate ice layer (normalization of IRPT by IRPC&HRP). As we scaled the reflection-power P values in dB (10 log10 P), the normalization operations were accomplished by subtracting, i.e. we computed BRP – IRP, HRP–IRPC and IRPT –IRPC&HRP.
Results
Repeated RES profiling with Ramac along-transverse profile
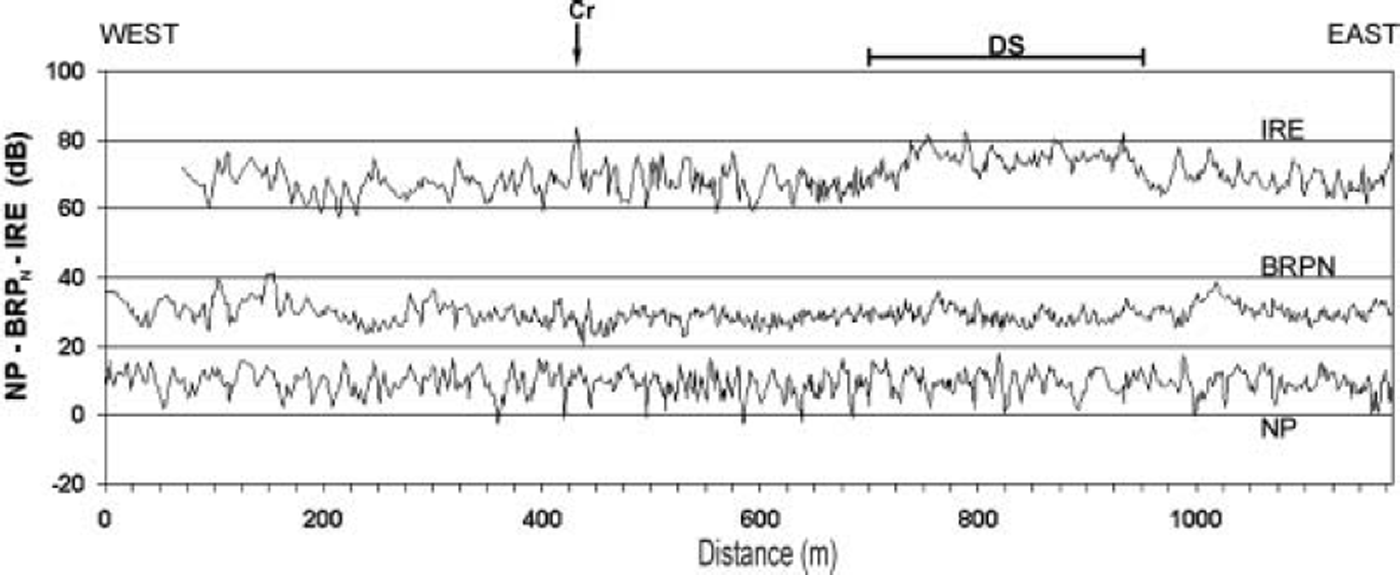
The spatial changes in normalized bedrock reflection power (BRPN), internal reflection energy (IRE) and noise power (NP) along the transect, measured on 19 July 2003, are shown in Figure 5. All magnitudes are expressed in dB scale. The mean BRP, IRP and NP for 19 July 2003 were 24.1, 43.3 and 10.6 dB, respectively. Both BRP and IRP signals are well above the noise level, and IRP is much higher than BRP.
Spatial changes of BRPN, IRE and NP (dB) along the transverse profile derived from Ramac records taken on 19 July 2003. BRPN has been added 30 dB to avoid overlapping with NP. Notice that it represents a normalized magnitude, so its values are close to unity and result in nearly zero values in dB scale. Cr is crevasse, and DS drainage system.
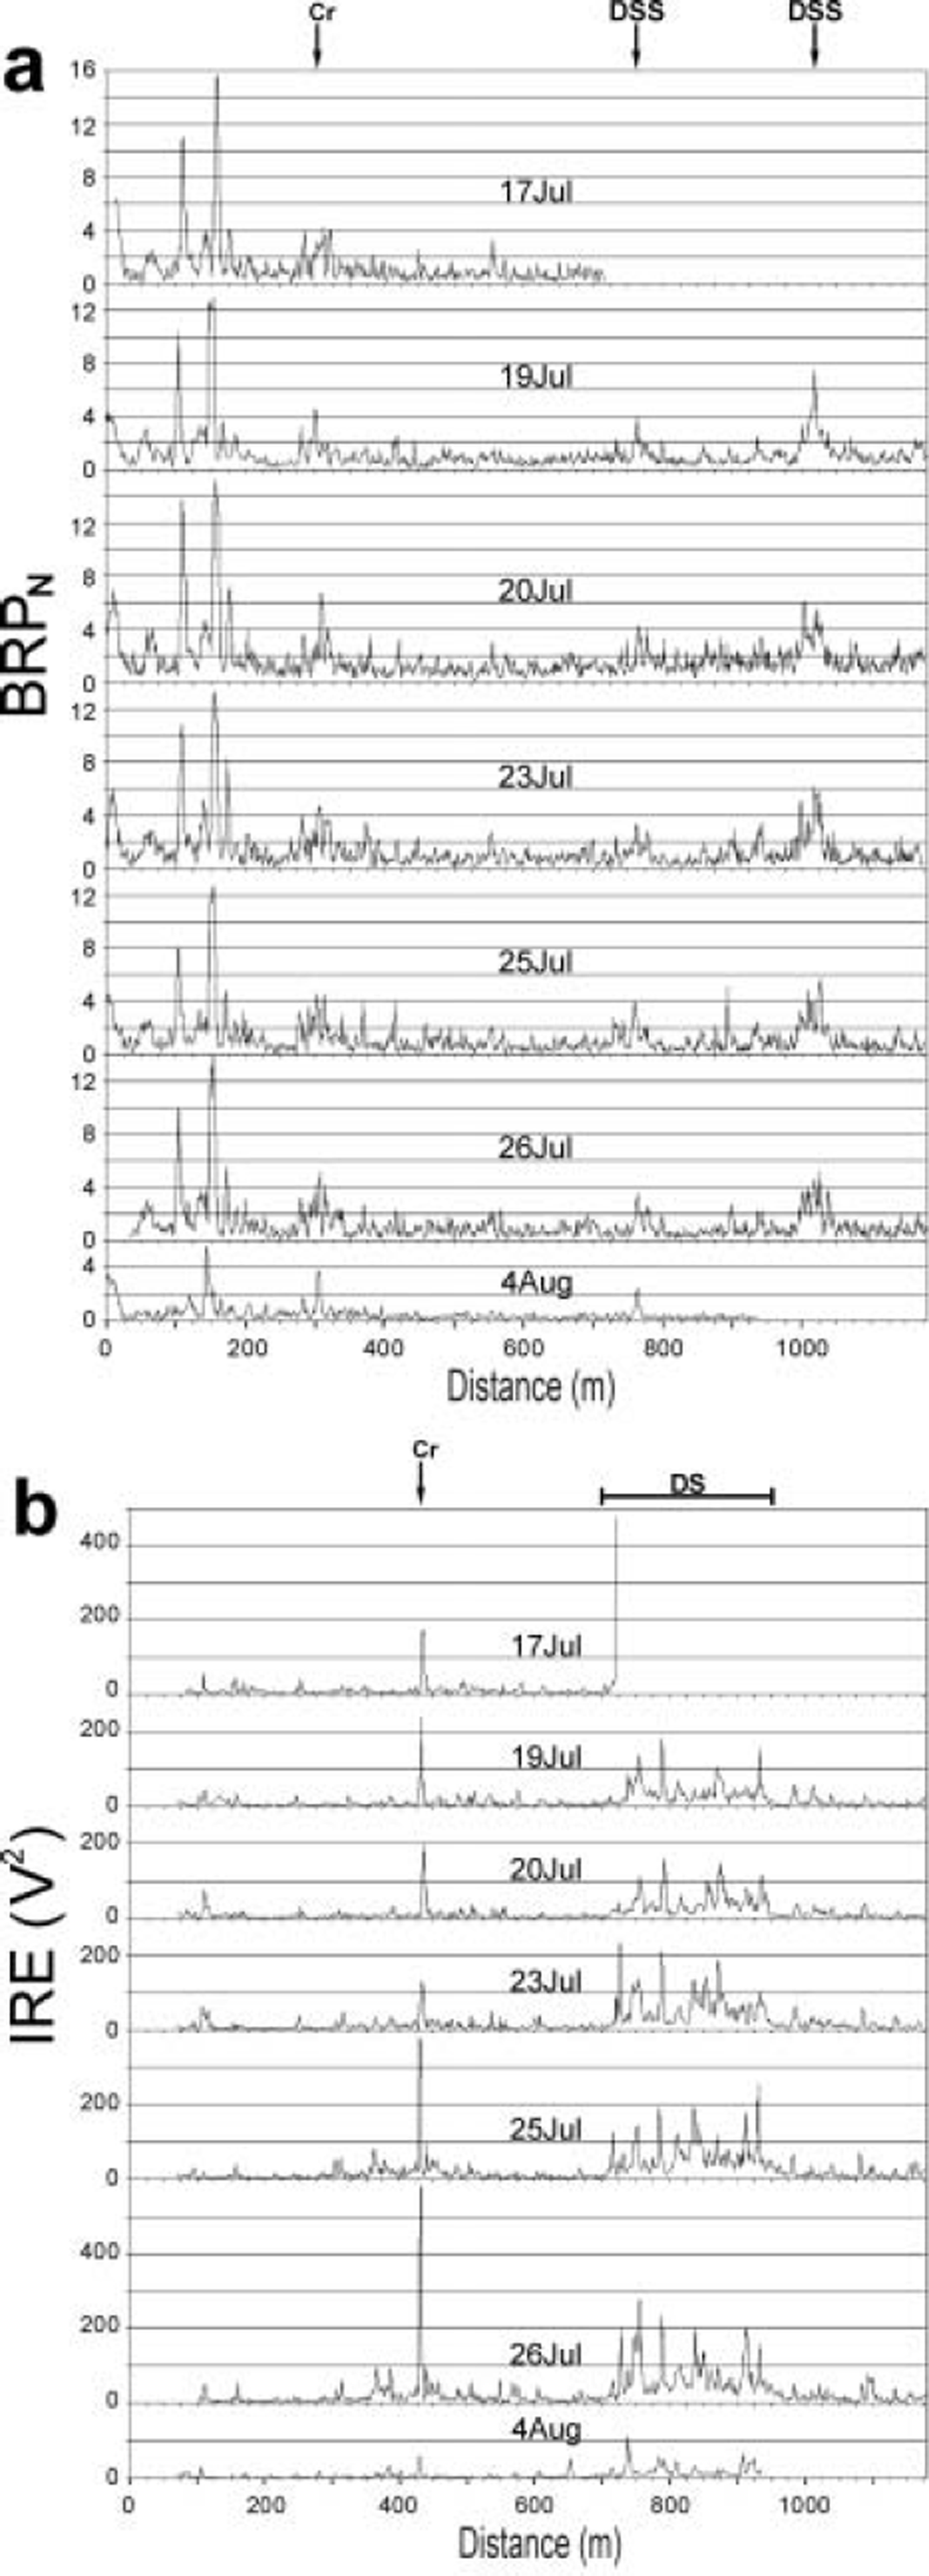
The spatial changes in BRPN and IRE along the transect, for the records taken on 17, 19, 20, 23, 25, 26 July and 4 August 2003, are presented in Figure 6a and b, respectively. The scaling of the figure has been kept constant for all of the plots, to provide an easy visualization of the temporal changes.
Spatial changes of BRPN (a) and IRE (b), both in linear scale, along the transverse profile derived from Ramac records taken on 17, 19, 20, 23, 25, 26 July and 4 August 2003. The vertical scaling is identical for all plots of each parameter. Cr is crevasse, DS drainage system, and DSS drainage system side.
CMP results
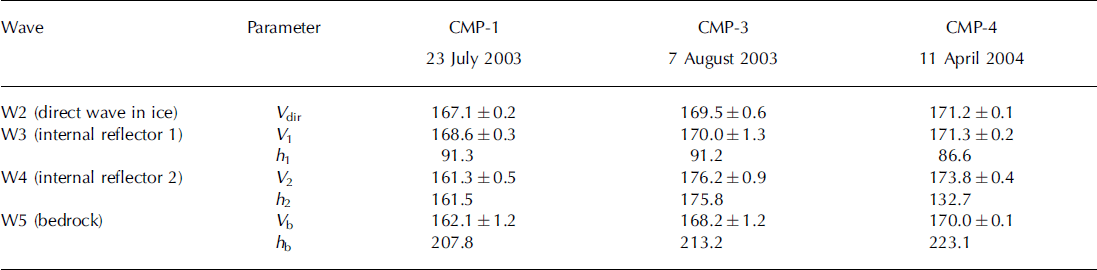
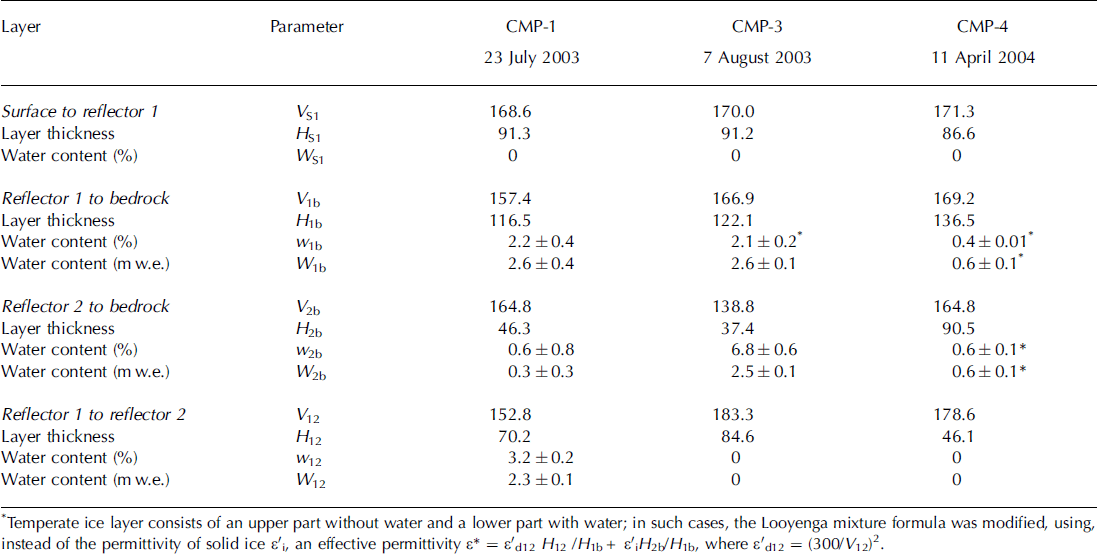
The velocities for the direct wave in ice, V dir, and the mean velocities for the ice columns above the internal reflectors and bedrock, V 1, V 2, V b, and the depths of such reflectors, h 1, h 2, h b, computed using the standard CMP method, are shown in Table 1. To obtain the RWV in individual layers, having different radiophysical properties, we used the multilayer model estimations (Reference Macheret, Moskalevsky and VasilenkoMacheret and others, 1993), obtaining the results shown in Table 2.
Mean radio-wave velocities V (mms–1) and depths h (m) derived from CMP measurements. Errors are standard errors from CMP fits to hyperbolic functions
Radio-wave velocities Vij (m μs–1) in individual layers (Vij is the RWV in the ice layer between the reflectors i and j; subscripts, S, b, 1 and 2 indicate surface, bedrock and internal reflectors respectively), water content expressed as percentage (w) and as metres water equivalent (W), and layer thickness Hij (m)
To understand the temporal changes in RWV vs depth, we also applied the semblance velocity analysis. The semblance spectrum plots for three CMP experiments are shown in Figure 7.
(a–c) Velocity semblance spectra for (a) CMP-1, (b) CMP-3 and (c) CMP-4. * indicates two-way travel time to reflector 1 , * * to reflector 2, and *** to bedrock. The white spots surrounded by black represent semblance maxima. (d–f) Water content as a function of depth for the temperate ice layer, estimated from the CMP RWV values for (d) 23 July 2003, (e) 7 August 2003 and (f) 11 April 2004.
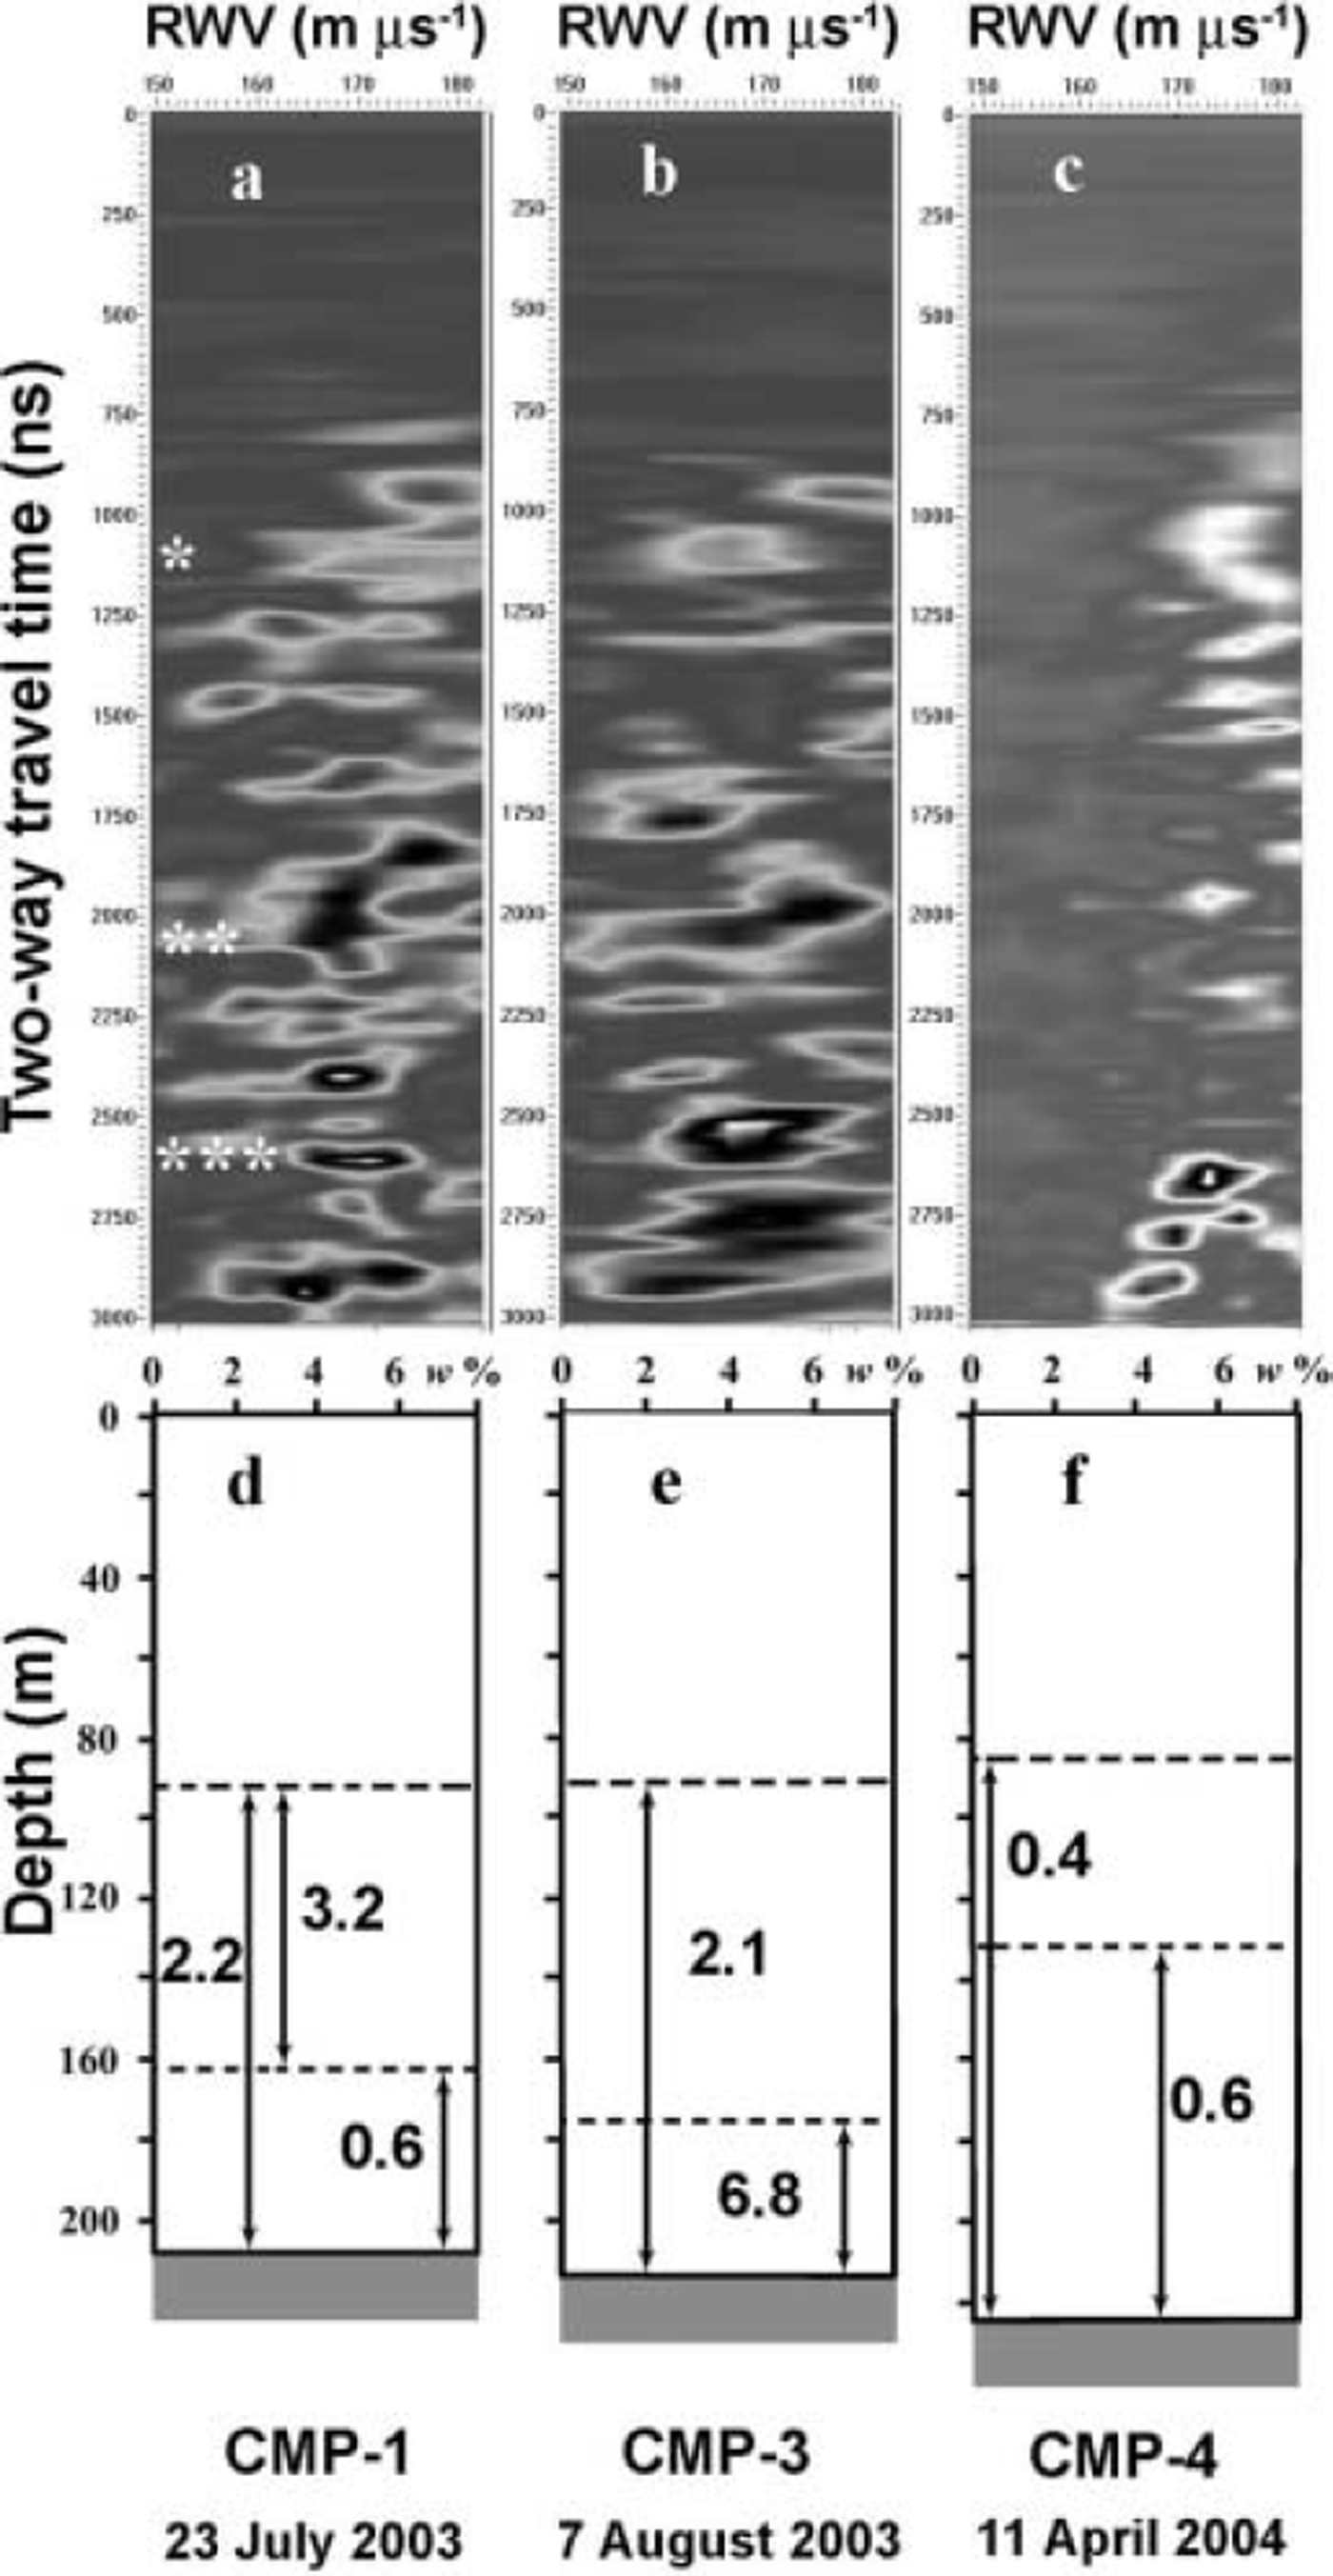
As shown in Reference Macheret and GlazovskyMacheret and Glazovsky (2000), the data on RWV within the glacier body can be applied to estimate the water content w in individual ice layers using the Looyenga formula for a two-component (ice/water) dielectric mixture. The results for the water-content estimations based on three CMP experiments are shown in Table 2. In the cases showing a temperate ice layer consisting of an upper part without water and a lower part with water, the Looyenga mixture formula was modified, using, instead of the dielectric permittivity of solid ice ε’i, an effective dielectric permittivity ε* = ε’ d12 H 12 /H 1b +ε’iH2b /H 1b, where ε’ d12 = (300/V 12)2.
Fixed-point results
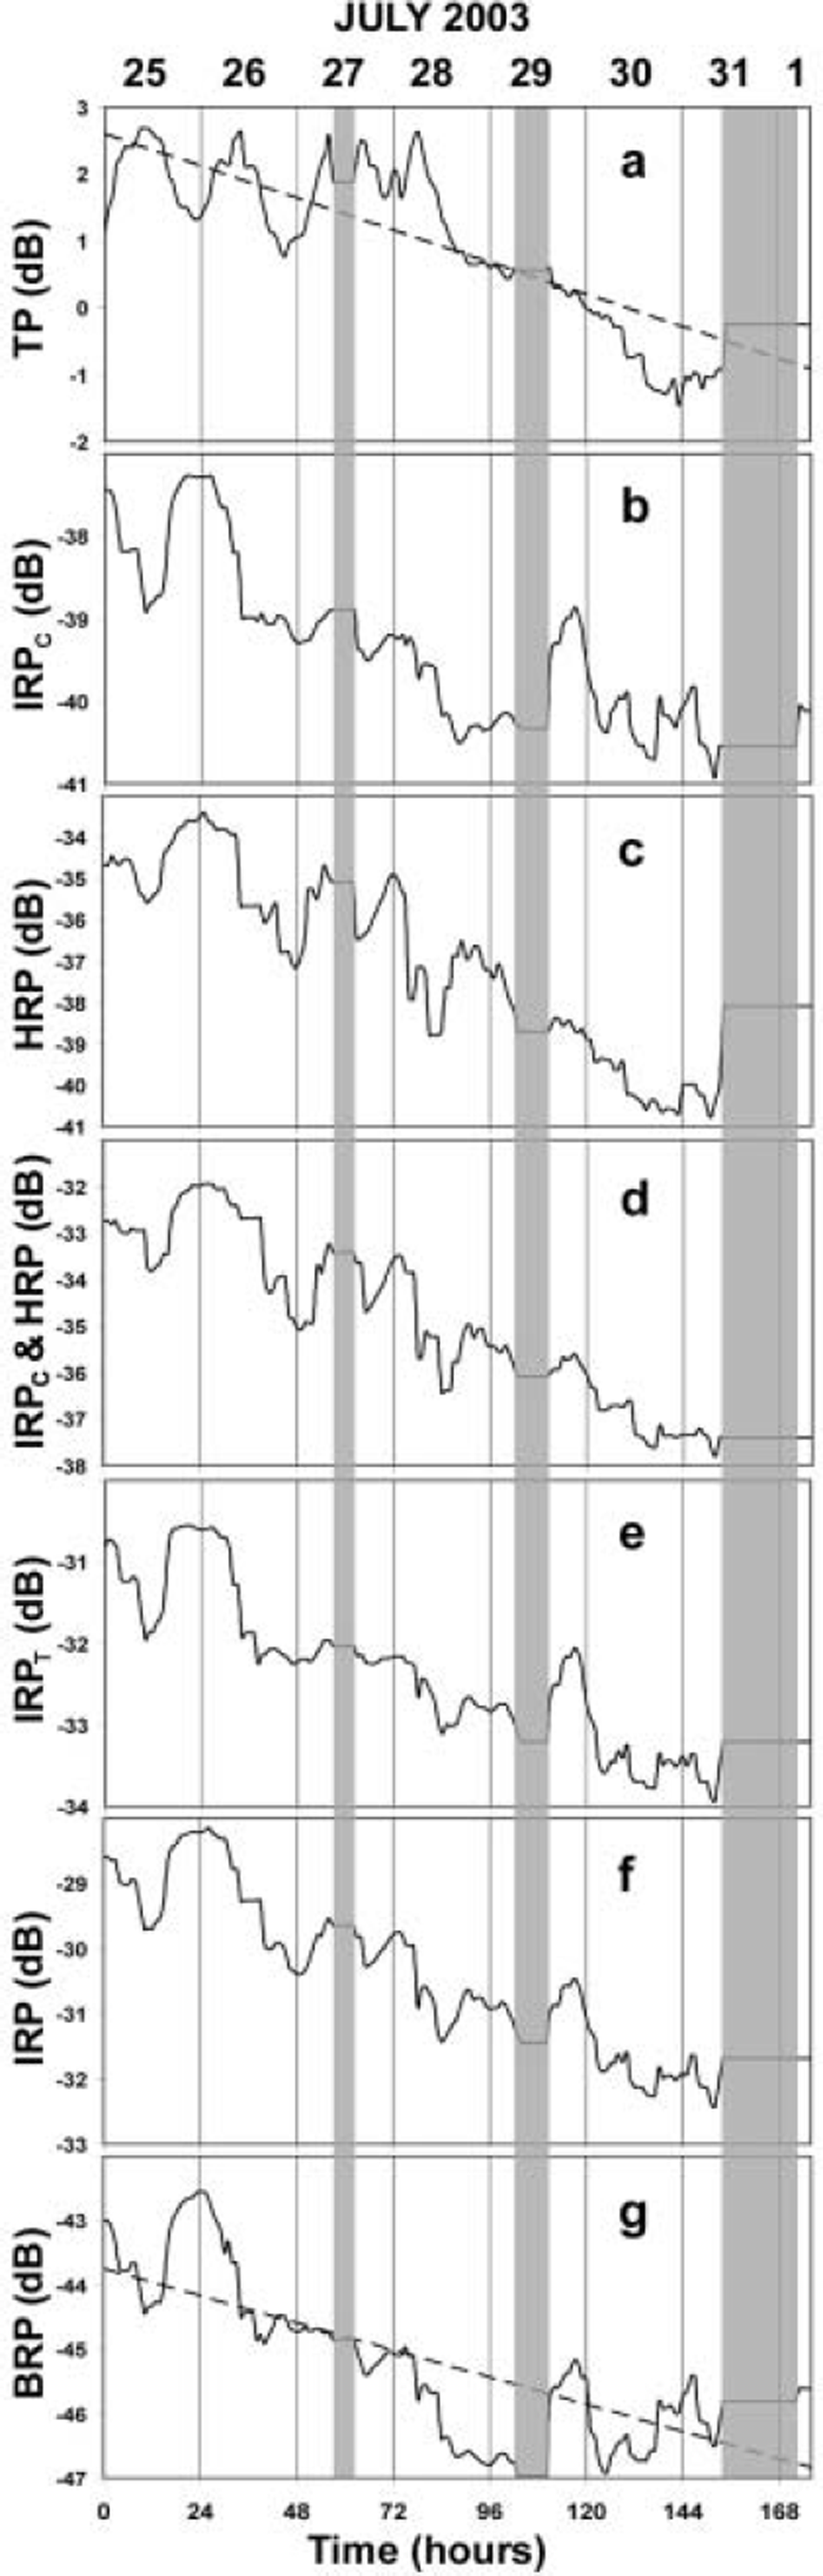
The results for the continuous measurements at a fixed site, presented as hourly-averaged transmitted power (TP) and reflection power values (IRP, IRPT, IRPC&HRP, HRP, IRPC and BRP) are shown in Figure 8.
Temporal changes in (a) hourly-averaged transmitted power, and reflection power values (b) IRPC, (c) HRP, (d) IRPC&HRP, (e) IRPT, (f) IRP and (g) BRP. Shaded areas show gaps in the time series.
Discussion
CMP data
Comparison of water content estimated from CMP experiments shows that there were evident changes in short-term and long-term timescales. As seen from Table 2, in the summer period there might be a strong redistribution of water in the temperate ice layer that is also qualitatively evident in the semblance velocity spectra (Fig. 7). On 23 July the main amount of water (nearly 2m w.e.) was concentrated in the upper part of the temperate ice layer. In contrast, on 7 August nearly the same amount (2 m w.e.) was identified in the lower part. The possibility of such an event might be sustained by earlier observations of temporal variations in ice velocities and flow water level in a moulin near our CMP site, made by A. Vieli in summer 1999 (Reference Pälli, Moore, Jania, Kolondra and GlowackiPälli and others, 2003). Short events with strongly increased ice surface velocities were observed in high-resolution subdiurnal records. After the ‘speed-up’ event, the water pressure in the moulin decreased rapidly from 0.85P i (ice overburden pressure) on 16 July to 0.2P i on 20 July, corresponding to 131 m of water-level drop.
The water content in the temperate ice layer also varies strongly in long-term timescale: from 2.1 m w.e. in summer to 0.4 mw.e. in spring, as shown in Table 2 and Figure 7. In spring 2004 the water was concentrated in the lower part of the temperate layer. The latter differs from previous estimations from a CMP experiment made on Hansbreen in April 1988, which showed that the upper part of the temperate ice was two to three times more water-saturated than the whole temperate layer with average water content 1.6% (Reference Macheret and GlazovskyMacheret and Glazovsky, 2000). This discrepancy might be explained, at least partly, by the different conditions in the areas around the measurement sites in 2004 and 1988, the former showing a well-developed moulin system, while the latter had much more homogeneous conditions, so that the water transfer downward into the ice body might be very different.
Fixed-point data
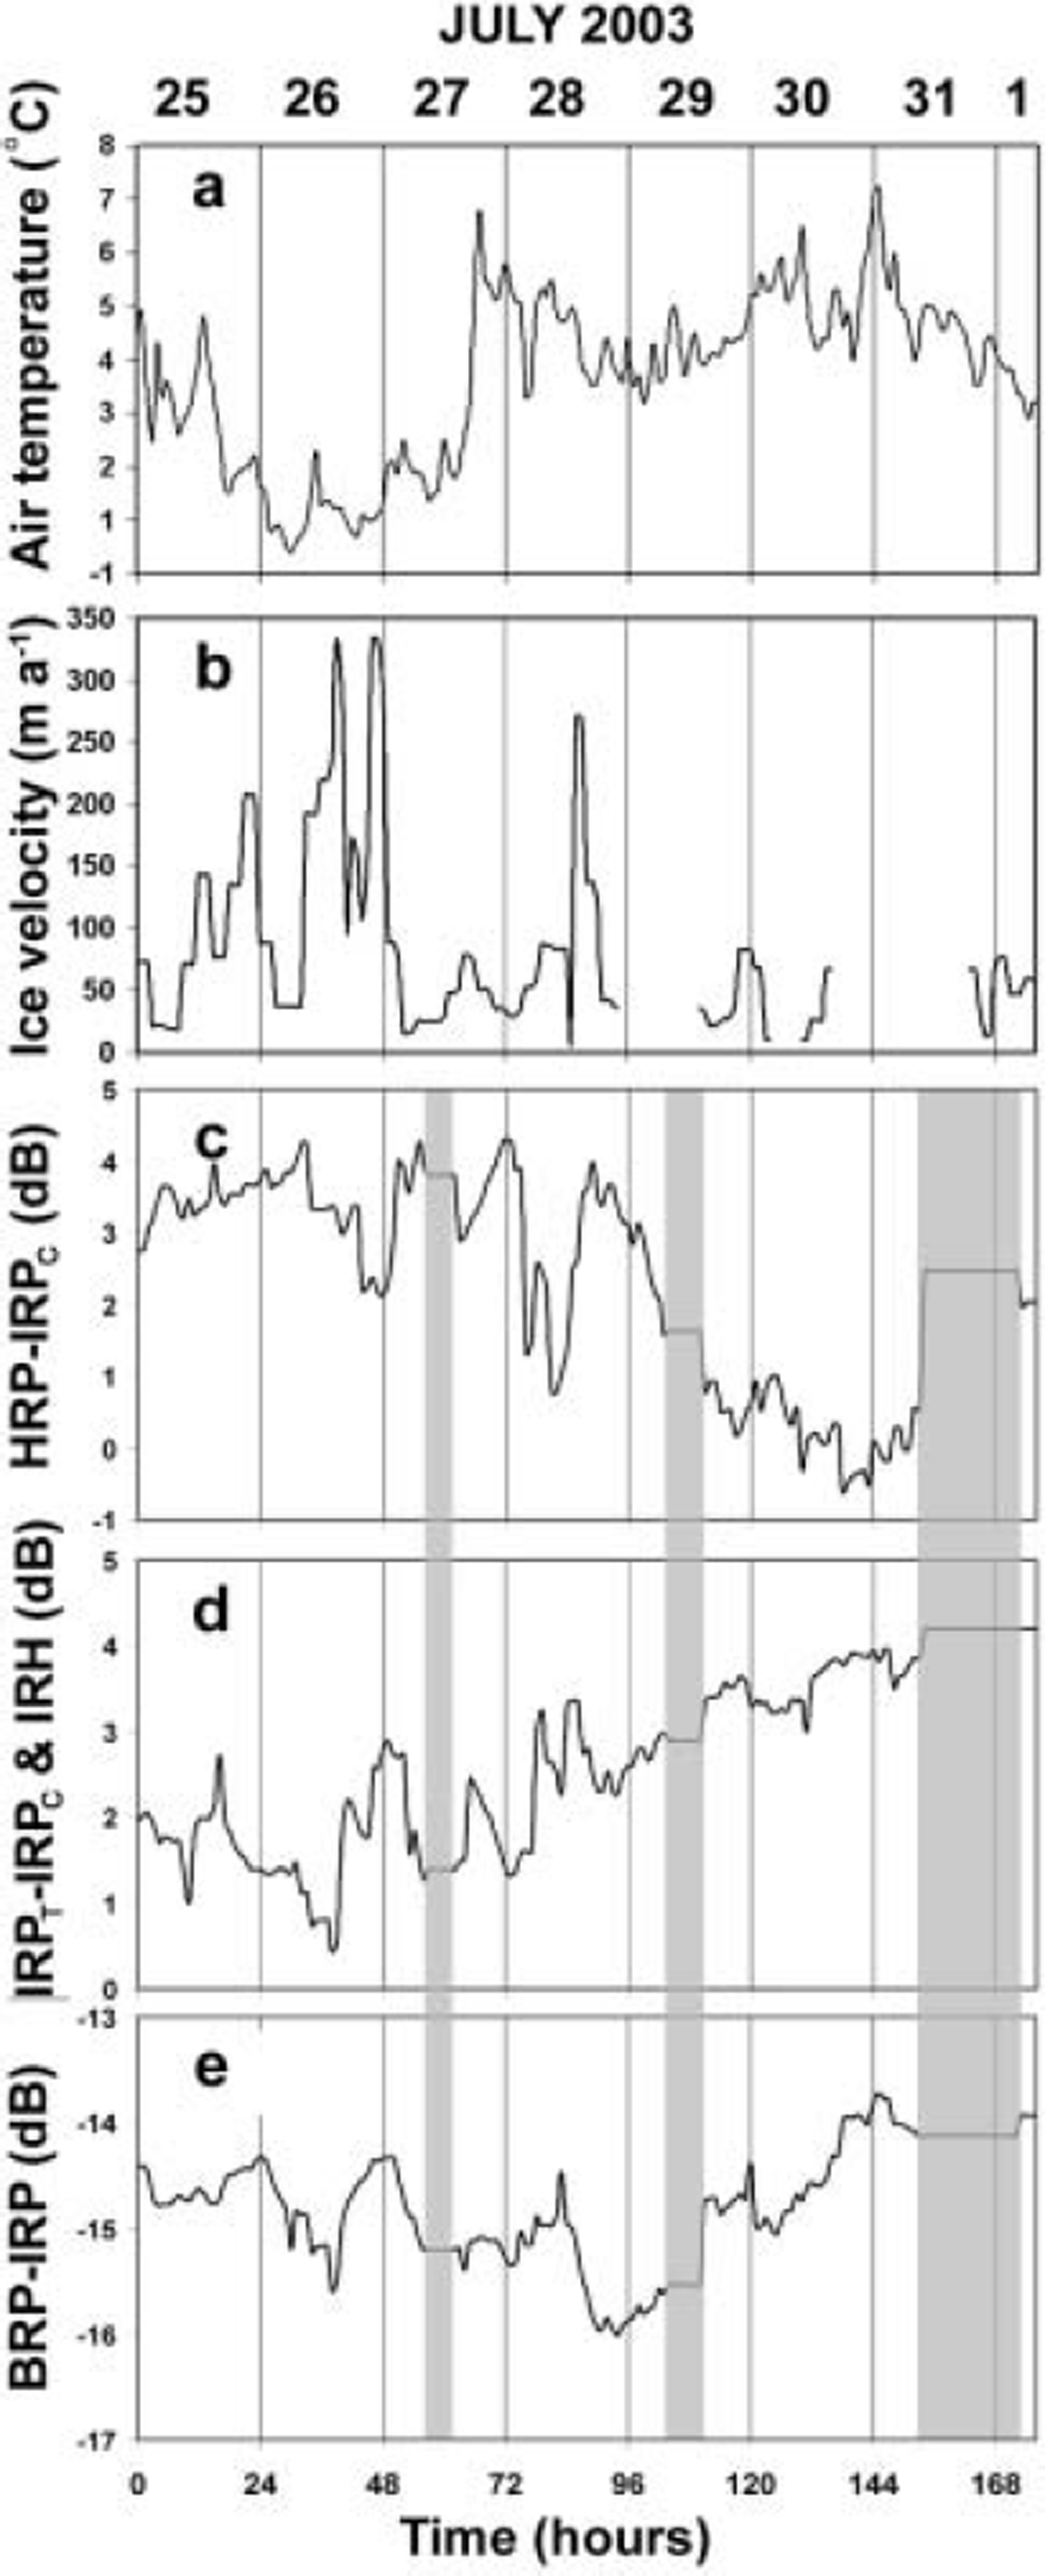
Comparison between the transmitted power (see Fig. 8a) and the air temperature (Fig. 9a) shows that the power decreases with temperature rise and conversely. This behaviour might be explained by variations in the amount of water on the surface that follows an air-temperature change. In 176 hours of observations, the level of TP dropped by ∼3 dB. The relation of power attenuation with water-film thickness at a given radio frequency (Reference Smith and EvansSmith and Evans, 1972) allows us to estimate the water-film thickness at the end of the observation period as 3 cm, suggesting that it was nearly zero at the beginning. The glacier surface change during the same period, measured by the AWS, was -33 cm. The total melting estimated from daily air temperatures was 23 cm w.e.
Temporal changes in (a) air temperature, (b) ice velocity, and (c–e) normalized reflection power for (c) cold/temperate ice interface, (d) temperate ice layer and (e) bedrock. Shaded areas show gaps in the time series.
The reflection properties of the cold-temperate ice interface reveal a general decreasing trend by ∼ 3 dB during the observation period. Such behaviour might be attributed to two possible causes. The first might be the growth of water-inclusions size at the internal reflection horizon. As shown by Reference BamberBamber (1988) for the 60MHz case, an increase of water-inclusions radius by 3 cm (from 22 cm to 25 cm), with no change of total water content, decreases the reflection coefficient by ∼15dB. This problem requires additional modelling of radar reflection from water inclusions in ice at 20 MHz. The second possible cause might be water drainage from the internal reflection horizon. The latter agrees with the CMP results showing a decreasing water content in the upper part of the temperate ice layer during the observation period.
The time series of temperate ice-layer reflection properties (Fig. 9d) generally follows the air-temperature variations with approximately an 11 hour time lag with correlation coefficient of 0.6. The time lag might be interpreted as delay time in the water transfer from the glacier surface to the temperate layer. In that case, only a well-developed drainage system penetrating through the cold ice layer would support such high rates of water transport.
The time series of bedrock reflection properties (Fig. 9e) shows variability in a range of ∼ 2 dB. These variations might be attributed to the changes in the water-film thickness at the bedrock. Some idea of the scale of the variation in water-film thickness is provided by the estimations of the reflection power coefficient made for 35 MHz frequency (Reference Smith and EvansSmith and Evans, 1972). These estimations show that the reflection coefficient decreases by 12 dB when the water-film thickness increases from zero to 25 cm. Decrease of BRP by 3 dB at 35 MHz would correspond to a 6 cm increment of water-film thickness. In first approximation at 20 MHz it corresponds to a 2 cm increment.
The bedrock reflection properties also vary in accordance with the ice velocity changes (Fig. 9b and e). The visible correspondence of maxima and minima of both curves is seen at time interval 0-132 hours. The recording period 132-176 hours with large gaps between DGPS records does not allow systematic correlation of the two curves.
Repeated RES profiling data
The BRPN shown in Figure 5 gives a measure of the power reflected by the bedrock and corrected by the changes in ice thickness, while the IRE is a measure of the energy attenuated/scattered in the full ice column from surface to bed. It is important to plot both together, because, as pointed out by Reference Gades, Raymond, Conway and JacobelGades and others (2000), an increase (decrease) in the BRPN could be just caused by a decrease (increase) in IRE, while a simultaneous increasing (decreasing) trend of both magnitudes might be an indicator of changes in the power transmitted into the ice.
The western part of the profile is characterized by a bed shallower than that of the eastern part (200 m as compared to 300 m for the extremes); however, BRPN level does not show a decreasing trend eastwards (which would be shown if BRP were plotted) because it is a depth-corrected power index. Its relative high at 150-200 m could be interpreted as an indicator of a larger amount of water at the ice-bed interface, which shows a depression in this area. The IRE plot shows a clear region of high values between 725 and 950 m, approximately (while BRPN remains nearly constant), that correlates perfectly with the location of the zone of the well-developed drainage system penetrating through the cold ice (and manifested as a crevasse-moulin system at the surface) mentioned earlier (see Fig. 2). There is a spatial change of BRPN that only becomes evident when analyzing Figure 6a (with linear scale, in contrast to the dB scale of Figure 5), namely, the relative highs at both sides of the area of the well-developed drainage system. This could be interpreted as follows: this area allows easy transfer of water to the temperate ice layer and to bedrock; however, the very high IRE in this area implies a low BRPN. In contrast, the increased amount of water at the ice-bed interface in this zone manifests as high BRPN values at both of its sides, as a result of their relatively low IRE. Such low values of IRE (especially evident at ∼650 m) at both sides of the crevasse-moulin system correlate well with the location of the thickest cold ice layer, for which a much smaller level of scattering/attenuation is expected than for temperate ice.
The crevasse apparent in Figure 2 (which is a migrated image) at ∼300 m is shown as a local maximum in the BRPN plot (Figs 5 and 6a) but does not have a counterpart in the IRE plot, and, conversely, the crevasse apparent at ∼430 m is shown as a local maximum in the IRE plot (see Figs 5 and 6b) which does not have a counterpart in the BRPN plot. This different pattern could be interpreted as the crevasse at 300 m having a good link, through the hydraulic system, with the bedrock underneath, thus transmitting higher amounts of water to it, resulting in a higher ice-bed interface reflectivity, while the inclined crevasse at 430m might not have such a link.
A complete analysis of temporal changes of BRPN and IRE is of course not possible because the profile was repeated only a certain number of times (11, of which only 7 were fully usable) during the period 17 July-4 August 2003. However, some trends can be detected by analyzing Figure 6 in relation with temperature data. What becomes apparent is an increasing trend of BRPN and IRE as the temperature decreased during the first days of recording, while there was a strong drop following the strong August warming and melting, associated with a warm fohn wind episode (notice the extremely low levels of both BRPN and IRE for the 4 August plot in Figure 6a and b, respectively). Unfortunately, this is not a consequence of the increasing amount of water supplied to the glacier hydraulic system (which would have the reverse effect) but of the already mentioned decrease in power transmitted to the ice because of the increased surface reflectivity due to strong melting at the surface (Ramac radar antennae were placed on sledges, at ∼30–40 cm above the snow/ice surface).
All of the above comments are related to the trends (in space and in time) manifested by BRPN and IRE. However, to compare their relative power levels, BRP and IRP should be used instead, as mentioned earlier. The point to stress here is that the IRP values for our transverse profile were almost 20 dB higher than those for BRP. This clearly contrasts with Reference Gades, Raymond, Conway and JacobelGades and others’ (2000) results, though it is perfectly understandable considering that they studied a cold ice dome, while we are analyzing, during the ablation season, a polythermal glacier with a thick temperate layer and a well-developed englacial hydraulic system.
In the same way as we did for the fixed-point measurements, we also calculated, using the relation of power attenuation with water-film thickness at a radio frequency given by Reference Smith and EvansSmith and Evans (1972), the water-film thickness at the end of the observation period. In the case of the repeated profile, we used the BRPN profile averaged values for 26 July and 4 August (i.e. before and after the strong melting episode), resulting in a 3 cm water-film thickness, in full agreement with the result from the fixed-point experiment.
Conclusions
This paper presents the first attempt to monitor the temporal variations of the radiophysical properties of a polythermal glacier during the ablation season and to relate them to measurements of ice velocity and meteorological conditions. The main conclusions are:
The ice velocity reveals appreciable variability at short-and long-term timescales. We attribute these variations to the changes in the water saturation of the temperate ice layer, which fluctuates from 0.4% to 2.1% from the cold (spring) to the warm (summer) period and reveals evidence of a fast redistribution of water within the temperate ice layer during summer.
The bedrock reflection properties vary in accordance with the ice velocity and are attributed to changes of the water-film thickness. The reflection properties of the temperate ice layer have a positive correlation with the air temperature, with a nearly half-diurnal time lag. The time lag is interpreted as evidence of a well-developed drainage system connecting the temperate layer with the glacier surface. The temporal variability of the reflection properties of the internal horizon suggests water-inclusions enlargement or water drainage from the horizon. This problem requires further investigation.
The repeated RES profiling reveals a stable spatial pattern in BRPN which could be interpreted as variations in the amount of water at the ice–bed interface related to bedrock topography, while the relative changes of BRPN and IRE with time seem to be governed by variations in surface melting which decreases the power transmitted into the ice.
The spatial variations of internal reflection energy along the repeated profile perfectly correlate with the thickness of the cold ice layer and the occurrence of drainage and crevasse systems. Comparison of BRPN and IRE allows us to suggest different styles of hydraulic connection of two crevasse systems with the underlying bedrock that are manifested as different patterns of local BRPN and IRE maxima. Zones of high IRE bounded by zones of high BRPN can be interpreted as an indicator of a good hydraulic connection between surface and bed, and a corresponding increased amount of water at the ice–bed interface which extends beyond the zone of a well-developed drainage system. Within the latter, BRPN could be either low or high. Such good hydraulic connection between surface and bed seems to be responsible for the increase in basal sliding, and thus surface velocity, immediately following high-surface-melting events.
Acknowledgements
This research has been supported by grants 6-PO4E-014-21 from the State Committee for Scientific Research (KBN) of Poland, 04-05-64773 from the Russian Foundation of Basic Research, 43.043.11.1627 from the Russian Ministry of Science and Technology and REN2002-03199/ANT from the Spanish Ministry of Science and Technology.



