1. Introduction
Radical innovation refers to a revolutionary change in existing technology that can replace outdated manufacturing processes, market structures, and business models. In contrast, incremental innovation yields only marginal improvements to existing technology, translating into minor enhancements to current products. Consequently, radical innovation is more challenging to develop, requiring profound scientific theories and prolonged knowledge accumulation, particularly breakthroughs in basic research. An academic environment that fosters greater research autonomy encourages scientists to follow their curiosity and intuition to explore boldly, which increases the attractiveness of engaging in basic research, thereby facilitating technical change toward radical innovation and generating economic growth. In addition to basic research, applied research is a necessary part of the innovation process, transforming patents into blueprints for new products. However, greater academic autonomy may reduce the appeal of engaging in applied research and crowd out the labor supply for such research, which could harm economic growth. To the best of our knowledge, the impact of the academic environment on applied research, directed technical change, and economic growth has not been thoroughly addressed in the existing literature.
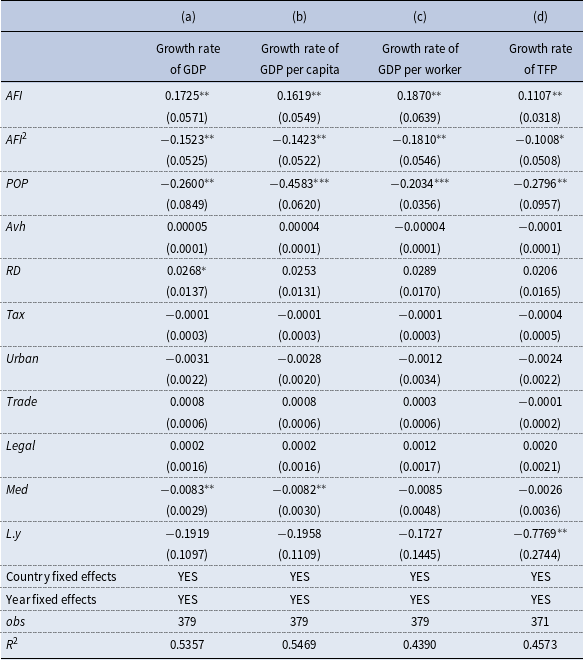
Accordingly, the motivation behind our analysis is the hypothesis that excessive autonomy in academic environment may be detrimental to economic growth. We first investigate the plausibility of this hypothesis by examining the correlation between the academic environment and the economic growth rate at the country level. Using the Academic Freedom Index (AFI) provided by the Varieties of Democracy (V-dem) databaseFootnote 1 (Berggren and Bjørnskov, Reference Berggren and Bjørnskov2022) to characterize research autonomy within the academic environment, we document the following findings. With the GDP growth rate as the dependent variable, the results in Column (a) of Table 1 show that the estimated coefficient of AFI is significantly positive, while the estimated coefficient of the quadratic term is significantly negative, suggesting that a country’s AFI has an inverted U-shaped impact on its economic growth.Footnote 2 Additionally, we explore an alternative measure of economic growth, specifically the growth rates of GDP per capita, GDP per worker and total factor productivity, and perform robustness tests. Columns (b)–(d) of Table 1 show the effects of AFI and its quadratic term on these alternative measures. Consistent with the baseline regression, the estimated coefficients of AFI are significantly positive, while the estimated coefficients of the quadratic term are significantly negative, reconfirming the inverted U-shaped effect of academic autonomy on economic growth.
Academic environment and economic growth

Notes: *, **, and *** indicate significance at the 10, 5, and 1% levels, respectively. Robust standard errors are provided in parentheses and clustered at the country-year level. Sample period: 2005–2019. Control variables: Logarithm of population (
 $POP$
), average annual hours worked by employed persons (
 $Avh$
), logarithm of R&D expenditure (
 $RD$
), logarithm of tax revenue (
 $Tax$
), ratio of the urban population to the total population (
 $\textit{Urban}$
), ratio of the total trade value to GDP (
 $\textit{Trade}$
), index of legal rights (
 $\textit{Legal}$
), neonatal mortality rate (
 $Med$
), and log dependent variable of t-1 (
 $L.y$
). Data source: Varieties of Democracy (V-dem) database, Penn World Table database (Feenstra et al. Reference Feenstra, Inklaar and Timmer2015), and World Bank database (https://data.worldbank.org.cn/).
Building on the preceding empirical observations, we developed a heterogeneous Schumpeterian growth model to explore the mechanisms and effects of the academic environment on economic growth. In our model, radical innovation refers to the process of creative destruction within high-quality ladder industries. This concept aligns with the work of Acemoglu et al. (Reference Acemoglu, Akcigit and Celik2022), who distinguished radical innovation from incremental innovation based on their contributions to society’s knowledge and economic value. Furthermore, we assume that basic research is a necessary and sufficient condition for the creative destruction inherent in radical innovation. Specifically, applied research is assumed to drive radical innovation by transforming ideas into blueprints for new products, with R&D efficiency determined by the extent of knowledge spillover from basic research.
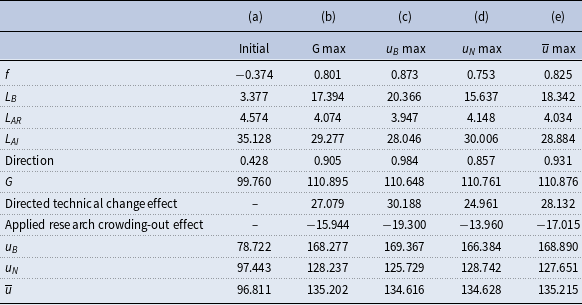
Our model demonstrates that the academic environment affects economic growth through two primary channels. First, enhanced academic autonomy stimulates basic research, encourages technical change directed toward radical innovation, and thereby promotes economic growth, which we call the directed technical change effect. Second, enhanced academic autonomy decreases the labor supply for applied research, which negatively impacts economic growth, a mechanism known as the applied research crowding-out effect. The quantitative illustration based on Chinese data shows that under the current academic environment, scientists engaged in basic research experience a negative autonomy utility (−0.37) due to constraints on their research autonomy. To maximize economic growth rate, academic environment must be improved until autonomy utility reaches the optimal level of 0.80. At this optimal point, the economic growth rate rises by 11.14 model units, in which the directed technical change effect contributing 27.08 units and the applied research crowding-out effect accounting for −15.94 units. Furthermore, welfare analysis reveals that increased academic autonomy affects the welfare of basic research labor through three channels: economic growth, income reduction, and enhanced research autonomy. In contrast, the welfare of non-basic research labor is impacted only by economic growth and income reduction. Our numerical estimates indicate that the optimal autonomy utility for maximizing consumer welfare is 0.87 for basic research labor and 0.75 for non-basic research labor. This disparity implies that a uniform academic environment policy cannot simultaneously optimize both economic growth and welfare objectives. Consequently, policymakers face a trade-off and must prioritize goals based on their specific targets. We further documented that our results are robust to variations in the model. In particular, we investigate the implications of the feedback mechanism between applied and basic research and estimate the effects of the academic environment on economic growth and welfare, allowing the implementation of applied research subsidies and incorporating the heterogeneity of the labor supply. Overall, most main qualitative and quantitative features of the effects of the academic environment are fairly robust across a range of plausible variations.
The impact of the academic environment has been studied extensively. According to Fernando (Reference Fernando1989), academic autonomy is “the freedom of members of the academic community, individually or collectively, in the pursuit, development, and transmission of knowledge, through research, study, discussion, documentation, production, creation, teaching, lecturing, and writing.” Therefore, a more supportive environment for academic exploration is deemed essential for scientists to pursue truth and discover new knowledge in basic research (Dewey, Reference Dewey1902; Polanyi, Reference Polanyi1958). Aghion et al. (Reference Aghion, Dewatripont and Stein2008) defined academic autonomy as the ability of scientists to retain decision-making authority over which projects to undertake and methods to use, after which they theoretically explored the optimal number of academic scientists and private-sector scientists. Mokyr (Reference Mokyr2010) used the Industrial Revolution in Great Britain to illustrate the positive role of the improved academic autonomy in fostering innovation. Empirically, Spannagel and Kinzelbach (Reference Spannagel and Kinzelbach2023) measured global autonomy levels in academic environments from 1900 to 2020, discovering a rapid increase in the early 1990s, followed by prolonged stabilization at a relatively high level. However, Cozzi and Galli (Reference Cozzi and Galli2009) demonstrated that excessive academic autonomy may impede innovation. Their analysis indicated that strengthening the mission orientation of basic research can enhances its capacity to address applied R&D open problems, thereby improving innovation performance. Complementarily, Akcigit et al. (Reference Akcigit, Hanley and Serrano-Velarde2021) contended that private-sector basic research outperforms public-sector due to greater market alignment. Further, Prettner and Werner (Reference Prettner and Werner2016) and Huang et al. (Reference Huang, Lai and Peretto2025) found that the excessive incentives for basic research may crowd out productive investments and private R&D, adversely impacting short-term growth and welfare – though such crowding-out effects may dissipate long-term.
Moreover, aggregate technical progress is the primary driver of economic growth (Romer, Reference Romer1990; Grossman and Helpman, Reference Grossman and Helpman1991; Aghion and Howitt, Reference Aghion and Howitt1992; Segerstrom, Reference Segerstrom1998); however, technical change is not neutral (Acemoglu, Reference Acemoglu1998). Acemoglu (Reference Acemoglu2002) employed an endogenous growth model to explain skill-biased technical change in the United States since the 1950s and found that the price effect and market size effect influenced scientists’ research decisions, ultimately determining the direction of technical change. Using data from the British cotton textile industry, Hanlon (Reference Hanlon2015) empirically tested the impact of relative price changes on the direction of technical change. Acemoglu et al. (Reference Acemoglu, Aghion, Bursztyn and Hemous2012) divided technical change into “dirty” and “clean” and demonstrated that technical change can be directed toward clean inputs through carbon taxes and research subsidies. This finding was supported by subsequent empirical work by Popp (Reference Popp2002) and Aghion et al. (Reference Aghion, Dechezleprêtre, Hemous, Martin and Van Reenen2016).
Technical change can also be classified into radical and incremental innovations based on the extent of technological improvement (Chandy and Tellis, Reference Chandy and Tellis1998; Kotelnikov, Reference Kotelnikov2000). Radical innovation, characterized by the disruption and replacement of existing technologies (Henderson and Clark, Reference Henderson and Clark1990; Benner and Tushman, Reference Benner and Tushman2003), often emerges from breakthroughs in basic research (McDermott and O’Connor, Reference McDermott and O’Connor2002; Kelley et al. Reference Kelley, Ali and Zahra2013; Suen, Reference Suen2013; Gersbach et al. Reference Gersbach, Sorger and Amon2018). In contrast, incremental innovation involves minor enhancements to existing technologies and can occur without foundational research (Christensen, Reference Christensen1997; Song and Montoya-Weiss, Reference Song and Montoya-Weiss1998; Garcia et al. Reference Garcia, Calantone and Levine2003). Due to the lack of diminishing returns that are inherent to incremental innovation (Abrams et al. Reference Abrams, Akcigit and Grennan2013), radical innovation plays a more significant role in promoting technological progress (Sorescu et al. Reference Sorescu, Chandy and Prabhu2003; Stevens and Burley, Reference Stevens and Burley2003) and is essential for sustaining long-term economic growth (Acemoglu et al. Reference Acemoglu, Akcigit and Celik2022). Using patent citations to differentiate types of innovation, Akcigit and Kerr (Reference Akcigit and Kerr2018) empirically verified the critical role of radical innovation in economic growth. Lentz and Mortensen (Reference Lentz and Mortensen2008) found that approximately 75% of the productivity variations in Danish firms could be attributed to radical innovation. Similarly, Kogan et al. (Reference Kogan, Papanikolaou, Seru and Stoffman2017) measured the economic value of new innovations based on stock market reactions to patent grants and found that radical innovation, characterized by higher patent citation rates, generates greater economic value.
The rest of the paper is organized as follows. Section 2 sets up the formal model. Section 3 defines and analyzes the competitive equilibrium of the theoretical model. Section 4 provides a numeric example of our model, which replicates the academic environment and innovation patterns of the Chinese economy. In this section, we also illustrate the robustness of our estimation results and counterfactual analysis to several variations in our model. Section 5 concludes.
2. Model
We developed a heterogeneous Schumpeterian growth model to explore how the academic environment shapes the direction of technical change and drives economic growth. The economy features one production sector for final consumer goods and another for a range of differentiated intermediate goods. Additionally, the model includes two R&D sectors. Funded exclusively by the government, basic research generates ideas, theories, and prototypes that enhance the efficiency of applied research through knowledge spillover. Conversely, applied research is conducted by private researchers dedicated to developing blueprints for new intermediate goods. These blueprints are protected by everlasting patents, allowing the intermediate goods sector to operate under monopolistic competition.
Consider an economy with a continuum of intermediate goods indexed by
 $\omega \in \{1,\ldots ,\varOmega \}$
. Each product (or industry)
 $\omega$
can potentially be supplied in a countably infinite number of qualities. We chose units, so the quality of every good at time
 $t=0$
equals one. The quality of the product
 $\omega$
is given by
 $\lambda ^{j}(\omega )$
, where
 $\lambda (\omega )\gt 1$
. To achieve quality
 $\lambda ^{j}(\omega )$
, a product must be improved
 $j$
times after
 $t=0$
. To simplify the exposition, all industries are ranked according to the magnitude of their quality ladders, that is,
 $\lambda '(\omega )\lt 0$
. Each step up the quality ladder requires a new patent. According to Acemoglu et al. (Reference Acemoglu, Akcigit and Celik2022), radical innovation can generate patents that substantially improve product quality.Footnote 3 Therefore, we establish the threshold
 $\lambda (\overline{\omega })$
and define that if an industry
 $\omega \leq \overline{\omega }$
, namely, its quality ladder
 $\lambda (\omega )\geq \lambda (\overline{\omega })$
, the creative destruction within it is classified as radical innovation. Otherwise, it is categorized as incremental innovation.
2.1. Manufacture
Final output. A single homogeneous final good is produced from labor and differentiated intermediate goods. The production function for the final output is as follows:
 \begin{equation}lnY\!\left(t\right)=\left(1-\alpha \right)lnL_{Y}\!\left(t\right)+\frac{\alpha }{\varOmega }\sum _{1}^{\varOmega }\mathit{\ln } \!\left[\lambda ^{J\left(\omega ,t\right)}\!\left(\omega \right)d\!\left(\omega ,t\right)\right]\!,\end{equation}
where
 $Y(t)$
,
 $L_{Y}(t)$
, and
 $d(\omega ,t)$
denote the final output, the corresponding input of labor, and the intermediate good
 $\omega$
in period
 $t$
, respectively. Moreover,
 $\lambda ^{J(\omega ,t)}(\omega )$
is the quality of the cutting-edge intermediate good
 $\omega$
. The number
 $(1-\alpha )\in (0,1)$
is the exogenous share of labor in final production.
According to the first-order conditions for this profit maximization problem, the static demand functions of the final product manufacturer for labor and intermediate goods are as follows:
 \begin{equation}L_{Y}\!\left(t\right)=\frac{\left(1-\alpha \right)E\!\left(t\right)}{w\!\left(t\right)},\end{equation}
 \begin{equation}d\!\left(\omega ,t\right)=\frac{\alpha E\!\left(t\right)}{\varOmega p\!\left(\omega \right)},\end{equation}
where
 $E(t)$
,Footnote 4
 $w(t)$
, and
 $p(\omega )$
denote the flow of total spending, the wage rate, and the price of the intermediate good
 $\omega$
of quality
 $\lambda ^{J(\omega ,t)}(\omega )$
at time
 $t$
.
Intermediate goods. We assume that one unit of labor is required to produce one unit of intermediate goods. Thus, the profit function for intermediate good
 $\omega$
is as follows:
 \begin{equation}\pi \!\left(\omega ,t\right)=\left[p\!\left(\omega \right)-w\!\left(t\right)\right]d\!\left(\omega ,t\right)\!.\end{equation}
Production rights for intermediate good
 $\omega$
are protected by a permanent patent. Therefore, the firm holding that patent is a monopolist. As usual, all firms engage in Bertrand competition, allowing the quality leader to set the lowest quality-adjusted price
 \begin{equation}p\!\left(\omega \right)=\lambda \!\left(\omega \right)w\!\left(t\right)\!.\end{equation}
Consequently, the total labor employed in the intermediate goods sector can be derived from (3) and (5)
 \begin{equation}L_{M}\!\left(t\right)=\frac{\alpha E\!\left(t\right)}{\varOmega w\!\left(t\right)}\sum _{1}^{\varOmega }\frac{1}{\lambda \!\left(\omega \right)}.\end{equation}
The quality leader monopolizes its relative market until a successive innovation emerges within its product line, at which point it loses its profit flow
 $\pi \!\left(\omega ,t\right)=\frac{\alpha E\!\left(t\right)}{\varOmega }[1-\frac{1}{\lambda(\omega)}]$
.
2.2. Households
The economy is populated by a continuum of measure
 $\overline{L}\gt 0$
of identical infinitely lived households. There is no population growth; that is,
 $\overline{L}$
is a constant. Each member is endowed with one unit of homogeneous labor per unit of time, which can be allocated to applied research, basic research, intermediate goods production, or final good production. The representative household derives utility from consumption and career choices according to the utility function
 \begin{equation}U=\int _{0}^{\infty }e^{-\rho t}\!\left[\mathit{lnc}\!\left(t\right) +fl_{B}\!\left(t\right)\right]dt,\end{equation}
where
 $c(t)$
Footnote 5 denotes per-capita consumption in period
 $t$
. The parameter
 $\rho \gt 0$
is the common time-preference rate of the household. If the household chooses to engage in basic research,
 $l_{B}(t)=1$
. Otherwise,
 $l_{B}(t)=0$
. In addition,
 $f$
denotes autonomy utility. We assume that the utility of engaging in applied research is independent of the academic environment; therefore,
 $f$
reflects the difference in environmental utility between basic and applied research. This utility is positively correlated with the degree of scientists’ research autonomy. A negative value of
 $f$
indicates that constraints on academic autonomy diminish the relative appeal of basic research, while a positive value suggests that greater autonomy enhances its attractiveness.Footnote 6
The flow budget constraint of the representative household is as follows:
 \begin{equation}\dot{a}\!\left(t\right)=r\!\left(t\right)a\!\left(t\right)+(1-\tau )w\!\left(t\right)\!\left[1-l_{B}\!\left(t\right)\right]+w_{B}\!\left(t\right)l_{B}\!\left(t\right)-p_{Y}\!\left(t\right)c\!\left(t\right)\!,\end{equation}
where
 $a(t)$
denotes the real wealth owned by the representative household at time
 $t$
,
 $w_{B}(t)$
is the wage rate in the basic research sector at time
 $t$
,
 $r(t)$
is the instantaneous interest rate at time
 $t$
, and
 $\tau$
is the proportional tax rate of labor income imposed by the government.
The representative household maximizes the utility given in (7) subject to the flow budget constraint (8) and the no Ponzi-game condition
 \begin{equation}lim_{t\rightarrow \infty }e^{-\int _{0}^{t}r\left(s\right)ds}a\!\left(t\right)=0.\end{equation}
A necessary and sufficient condition for an optimal consumption path is that (9) holds as an equality (transversality condition) and that the Euler equation
 \begin{equation}\dot{c}\!\left(t\right)\!/c\!\left(t\right)+\dot{p_{Y}}\!\left(t\right)\!/p_{Y}\!\left(t\right)=r\!\left(t\right)-\rho,\end{equation}
 \begin{equation}(1-\tau )w\!\left(t\right)=fc\!\left(t\right)p_{Y}\!\left(t\right)+w_{B}\!\left(t\right)\!,\end{equation}
is satisfied, whereas (11) is also the no-arbitrage condition of a representative household’s career choices.
2.3. Basic research and applied research
Basic research generates new ideas and enhances the efficiency of applied research through knowledge spillover. Let
 ${L_{B}}^{\mu }(t)$
Footnote 7 denote the measure of domestic knowledge spillover, where
 $L_{B}(t)$
represents the total labor allocated to basic research and
 $\mu \in (0,1)$
is the exogenous spillover parameter. Unlike incremental innovation, radical innovation relies on breakthroughs in basic research. Accordingly, we assume that the industry-wide instantaneous probability of innovation is
 \begin{equation}prob\!\left(\omega ,t\right)=\begin{cases} \dfrac{{L_{B}}^{\mu }\!\left(t\right)+B_{f}}{x\!\left(\omega \right)}l_{Ai}\!\left(\omega ,t\right)dt, & \omega \leq \overline{\omega }\\[9pt] \dfrac{1}{x\!\left(\omega \right)}l_{Ai}\!\left(\omega ,t\right)dt, & \omega \gt \overline{\omega } \end{cases},\end{equation}
where
 $B_{f}\gt 0$
denotes the measure of international knowledge spillovers,
 $l_{Ai}(\omega ,t)$
is the applied research labor employed by R&D firm
 $i$
in industry
 $\omega$
at time
 $t$
. The R&D difficulty index
 $x(\omega )=\lambda ^{\delta }(\omega )$
(
 $\delta \gt 0$
) increases along the quality ladder. Let
 $V(\omega ,t)$
denote the expected discounted reward for winning an R&D race in industry
 $\omega$
at time
 $t$
. Thus, the problem faced by an R&D firm undertaking radical innovation is choosing the labor input to maximize its expected profits.
 \begin{equation}\mathop{\max }_{l_{\mathit{Ai}}\left(\omega ,t\right)} V\!\left(\omega ,t\right)\frac{{L_{B}}^{\mu }\!\left(t\right)+B_{f}}{x\!\left(\omega \right)}l_{Ai}\!\left(\omega ,t\right)dt-w\!\left(t\right)l_{Ai}\!\left(\omega ,t\right)dt.\end{equation}
Only when
 \begin{equation}V\!\left(\omega ,t\right)=\frac{w\!\left(t\right)x\!\left(\omega \right)}{{L_{B}}^{\mu }\!\left(t\right)+B_{f}},\end{equation}
will firms find it profit maximizing to allocate a positive (finite) amount of labor to applied research. Notably, in this case, though finite, the size of the R&D firm is indeterminate because of the constant returns of research technology. Similarly, the problem faced by an R&D firm engaging in incremental innovation is as follows:
 \begin{equation}\mathop{\max }_{l_{\mathit{Ai}}\left(\omega ,t\right)} V\!\left(\omega ,t\right)\frac{1}{x\!\left(\omega \right)}l_{Ai}\!\left(\omega ,t\right)dt-w\!\left(t\right)l_{Ai}\!\left(\omega ,t\right)dt.\end{equation}
The first-order condition for profit maximization is
 \begin{equation}V\!\left(\omega ,t\right)=w\!\left(t\right)x\!\left(\omega \right)\!.\end{equation}
Whenever an R&D firm succeeds in innovating, it acquires the uncertain profit flow that accrues to a monopolist in the intermediate goods market; that is, the expected discounted reward of the R&D firm is as follows:
 \begin{equation}V\!\left(\omega ,t\right)=\begin{cases} \int _{t}^{\infty }e^{-\int _{t}^{s}r(\kappa )d\kappa -\frac{{L_{B}}^{\mu }\left(s\right)+B_{f}}{x\left(\omega \right)}{L_{A}}\left(\omega ,s\right)\left(s-t\right)}\pi \!\left(\omega ,s\right)ds,\omega \leq \overline{\omega }\\[4pt] \int _{t}^{\infty }e^{-\int _{t}^{s}r\left(\kappa \right)d\kappa -\frac{1}{x(\omega )}{L_{A}}\left(\omega ,s\right)\left(s-t\right)}\pi \!\left(\omega ,s\right)ds,\omega \gt \overline{\omega } \end{cases},\end{equation}
where
 $L_{A}(\omega ,s)(s-t)=\sum _{i}l_{Ai}(\omega ,s)(s-t)$
. The profits earned by each monopolist
 $\pi (\omega ,s)$
are appropriately discounted using the interest rate
 $r$
and the instantaneous probability
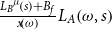 $\frac{{L_{B}}^{\mu }\!\left(s\right)+B_{f}}{x\!\left(\omega \right)}L_{A}\!\left(\omega ,s\right)$
(or
 $\frac{1}{x\!\left(\omega \right)}L_{A}\!\left(\omega ,s\right)$
) of being displaced by subsequent innovation. The differentiation of (17) yields a no-arbitrage condition for the R&D firms:
 \begin{equation}r\!\left(t\right)=\begin{cases} \dfrac{\pi \!\left(\omega ,t\right)+\dot{V}\!\left(\omega ,t\right)}{V\!\left(\omega ,t\right)}-\dfrac{{L_{B}}^{\mu }\!\left(t\right)+B_{f}}{x\!\left(\omega \right)}L_{A}\!\left(\omega ,t\right)\!,\omega \leq \overline{\omega }\\[9pt] \dfrac{\pi \!\left(\omega ,t\right)+\dot{V}\!\left(\omega ,t\right)}{V\!\left(\omega ,t\right)}-\dfrac{1}{x\!\left(\omega \right)}L_{A}\!\left(\omega ,t\right)\!,\omega \gt \overline{\omega } \end{cases}\!.\end{equation}
In equilibrium, each R&D firm expects equal discounted rewards across industries, rendering them indifferent to industry selection.
2.4. Government
In our model, basic research cannot be commercialized directly and therefore relies entirely on government funding. The total government expenditure is financed through the taxation of labor income, with the government’s budget constraint expressed as followsFootnote 8:
 \begin{equation}w_{B}\!\left(t\right)L_{B}\!\left(t\right)=\tau w\!\left(t\right)\!\left[\sum _{1}^{\varOmega }L_{A}\!\left(\omega ,t\right)+L_{Y}\!\left(t\right)+L_{M}\!\left(t\right)\right]\!.\end{equation}
2.5. Market clearing
Having described the behavior of all agents in the economy, let us now turn to market clearing. According to the definition of
 $\pi (\omega ,t)$
, the no-arbitrage condition for R&D firms (18) is expressed as:
 \begin{align} \begin{array}{ccc} & \dfrac{\alpha E\!\left(t\right)}{\varOmega w\!\left(t\right)}\!\left[1-\dfrac{1}{\lambda \!\left(\omega \right)}\right]-L_{A}\!\left(\omega ,t\right)-\rho \dfrac{x\!\left(\omega \right)}{{L_{B}}^{\mu }\!\left(t\right)+B_{f}}=0, & \omega \leq \overline{\omega }\\[9pt] & \dfrac{\alpha E\!\left(t\right)}{\varOmega w\!\left(t\right)}\!\left[1-\dfrac{1}{\lambda \!\left(\omega \right)}\right]-L_{A}\!\left(\omega ,t\right)-\rho x\!\left(\omega \right)=0, & \omega \gt \overline{\omega } \end{array}. \end{align}
The labor market’s clearing condition follows:
 \begin{equation}L_{Y}\!\left(t\right)+L_{M}\!\left(t\right)+\sum _{1}^{\varOmega }L_{A}\!\left(\omega ,t\right)+L_{B}\!\left(t\right)=\overline{L},\end{equation}
where
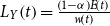 $L_{Y}\!\left(t\right)=\frac{\!\left(1-\alpha \right)E\!\left(t\right)}{w\!\left(t\right)}$
and
 $L_{M}\!\left(t\right)=\frac{\alpha E\!\left(t\right)}{\varOmega w\!\left(t\right)}\sum _{1}^{\varOmega }\frac{1}{\lambda \!\left(\omega \right)}$
.
3. Equilibrium
We are now ready to define an equilibrium of the model. Choose the wage rate in non-basic research sector as a numeraire; that is,
 $w(t)=1$
. The no-arbitrage condition of career choices (11), government budget constraints (19), and the no-arbitrage equation for R&D firms (20), together with the labor market’s clearing condition (21) describe the equilibrium of our economy
 $\{E(t),w_{B}(t),L_{B}(t),L_{A}(\omega ,t)\}$
.
3.1. Balanced growth paths
In this subsection, we examine the existence of balanced growth paths, that is, equilibria along which all endogenous variables grow at constant rates. Given that the population growth rate is zero, the Euler equation (10) indicates that a constant per capita spending path is optimal when the market interest rate
 $r(t)$
equals the subjective discount rate
 $\rho$
.Footnote 9 Analogously, along a BGP equilibrium, the labor shares
 $L_{B}(t)$
,
 $L_{A}(\omega ,t)$
as well as the wage rate in the basic research sector
 $w_{B}(t)$
must be constant over time. We will therefore omit the time argument from these functions.
With
 $\sum _{1}^{\varOmega }L_{A}(\omega )$
given by (20), (21) yields a balanced-growth resource condition-A
 \begin{equation}E=-L_{B}+\rho \left[\!\left(L_{B}\right)^{\mu }+B_{f}\right]^{-1}\sum _{1}^{\overline{\omega }}x\left(\omega \right)+\rho \sum _{\overline{\omega }+1}^{\varOmega }x\left(\omega \right)+\overline{L}.\end{equation}
With
 $w_{B}$
given by (11) and
 $\sum _{1}^{\varOmega }L_{A}(\omega )$
given by (19), (21) yields a balanced-growth resource condition-B
 \begin{equation}fE=-\tau \overline{L}^{2}\!\left(L_{B}\right)^{-1}+\overline{L}.\end{equation}
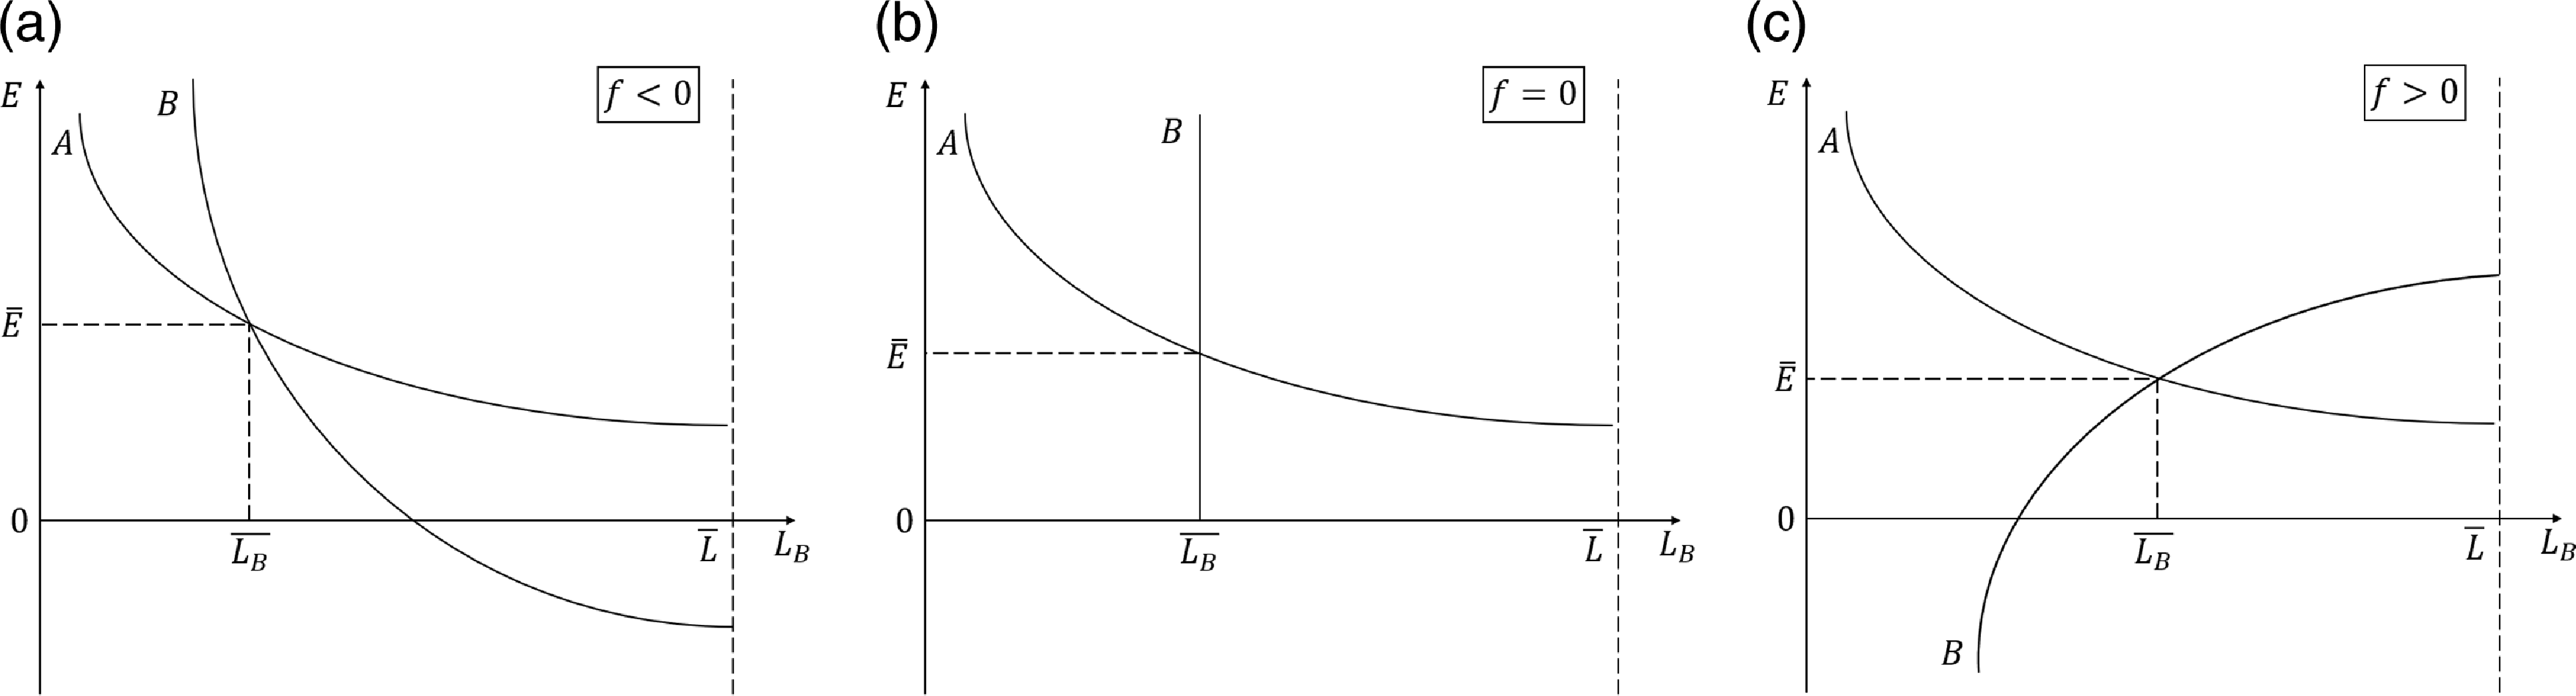
Both balanced-growth conditions are illustrated in Figure 1. The vertical axis measures total spending
 $E$
and the horizontal axis measures basic research labor
 $L_{B}$
. From the technical properties of these balanced-growth resource conditions stated in Appendix A1, the following results are obvious.
The unique balanced-growth equilibrium.

If
 $f\leq 0$
(Figure 1(a) and (b)), whenever
 $L_{B}\in [0,\overline{L})$
, there exists a unique equilibrium
 $\{\overline{E},\overline{L_{B}}\}$
; If
 $f\gt 0$
(Figure 1(c)), a unique equilibrium exists for
 $L_{B}\in [0,\overline{L})$
if and only if
 $E_{A}(\overline{L})\lt E_{B}(\overline{L})$
, that is,
 $(1-\tau )\overline{L}-f\rho (\overline{L}^{\mu }+B_{f})^{-1}\sum _{1}^{\overline{\omega }}x(\omega )-f\rho \sum _{\overline{\omega }+1}^{\varOmega }x(\omega )\gt 0$
. For the following analysis it will be convenient to define the function
 $H(L_{B})$
by
 \begin{equation}H\left(L_{B}\right)=-L_{B}+\rho \left[\left(L_{B}\right)^{\mu }+B_{f}\right]^{-1}\sum _{1}^{\overline{\omega }}x\left(\omega \right)+\tau \frac{\overline{L}^{2}}{f}\left(L_{B}\right)^{-1}+\rho \sum _{\overline{\omega }+1}^{\varOmega }x\left(\omega \right)+\overline{L}-\frac{\overline{L}}{f}, \quad f\neq 0.\end{equation}
Let us denote this solution
 $H(L_{B})=0$
by
 $\widetilde{L_{B}}$
. Therefore
 \begin{equation}\overline{L_{B}}=\left\{\begin{array}{lll} \widetilde{L_{B}}, & f\lt 0 & \\ \tau \overline{L}, & f=0 & \\ \widetilde{L_{B}}, & f\gt 0 & and\; E_{A}\!\left(\overline{L}\right)\lt E_{B}\!\left(\overline{L}\right) \end{array}. \right.\end{equation}
The unique balanced-growth spending
 $\overline{E}$
can be solved from (22) or (23). Thus, according to (20), the equilibrium applied research labor are obtained as follows:
 \begin{equation}\overline{L_{A}}\!\left(\omega \right)=\left\{\begin{array}{lll} & \dfrac{\alpha \overline{E}}{\varOmega }\!\left[1-\dfrac{1}{\lambda \!\left(\omega \right)}\right]-\rho \dfrac{x\!\left(\omega \right)}{\!\left(\overline{L_{B}}\right)^{\mu }+B_{f}}, & \omega \leq \overline{\omega }\\& \dfrac{\alpha \overline{E}}{\varOmega }\!\left[1-\dfrac{1}{\lambda \!\left(\omega \right)}\right]-\rho x\!\left(\omega \right)\!, & \omega \gt \overline{\omega } \end{array}.\right.\end{equation}
In Appendix A2, we show that if
 $\{E,L_{B}\}=\{\overline{E},\overline{L_{B}}\}$
at time
 $t=0$
, then an immediate jump to the balanced-growth path can occur. Otherwise, it is imperative to investigate the transitional dynamic properties of the model.
3.2. Academic environment and labor reallocation
Enhanced academic autonomy increases the attractiveness of engaging in basic research, triggering a reallocation of labor between basic research and applied research across innovation types. This subsection examines the impact of the academic environment on labor reallocation in equilibrium using a comparative static analysis. We begin by analyzing the derivative of basic research labor with respect to the autonomy utility.Footnote 10
 \begin{equation}\frac{dL_{B}}{df}\gt 0.\end{equation}
Equation (27) implies a positive relationship between basic research labor and the research autonomy in academic environment.
Subsequently, we investigate the influence of the academic environment on applied research labor engaged in both radical and incremental innovation.
 \begin{align}\frac{dL_{A}\!\left(\omega \right)}{df}&=-\frac{\alpha }{\varOmega }\!\left[1-\frac{1}{\lambda \!\left(\omega \right)}\right]\left\{1+\frac{\mu \rho \sum _{1}^{\overline{\omega }}x\!\left(\omega \right)}{\left[\!\left(L_{B}\right)^{\mu }+B_{f}\right]^{2}\!\left(L_{B}\right)^{1-\mu }}\right\}\frac{dL_{B}}{df}\nonumber \\[5pt]&\quad +\frac{\mu \rho x\!\left(\omega \right)}{\left[\!\left(L_{B}\right)^{\mu } +B_{f}\right]^{2}\!\left(L_{B}\right)^{1-\mu }}\frac{dL_{B}}{df},\omega \leq \overline{\omega },\end{align}
 \begin{equation}\frac{dL_{A}\!\left(\omega \right)}{df}=-\frac{\alpha }{\varOmega }\left[1-\frac{1}{\lambda \!\left(\omega \right)}\right]\left\{1+\frac{\mu \rho \sum _{1}^{\overline{\omega }}x\!\left(\omega \right)}{\left[\!\left(L_{B}\right)^{\mu }+B_{f}\right]^{2}\!\left(L_{B}\right)^{1-\mu }}\right\}\frac{dL_{B}}{df},\omega \gt \overline{\omega }.\end{equation}
Equation (28) indicates that greater academic autonomy crowds out applied research labor in radical innovation by enhancing the attractiveness of the basic research sector (the first term is negative). In contrast, it crowds in applied research labor in radical innovation by improving applied research efficiency through the knowledge spillover of basic research (the second term is positive). However, (29) shows that greater academic autonomy exclusively exerts a negative effect on applied research labor in incremental innovation.
Proposition 1: Enhanced academic autonomy reallocates research labor from applied to basic research. Nevertheless, knowledge spillovers generated by basic research partially mitigate this crowding-out effect on the applied research labor engaged in radical innovation.
3.3. Academic environment, directed technical change, and economic growth
This labor reallocation fosters directed technical change, with significant implications for economic growth. Following Acemoglu (Reference Acemoglu2002), we defined the direction of technical change as the ratio of the quality growth rates between radical and incremental innovationFootnote 11
 \begin{equation}\textit{Direction}=\frac{G_{R}}{G_{I}}=\frac{\left[\!\left(L_{B}\right)^{\mu }+B_{f}\right]\sum _{1}^{\overline{\omega }}ln\lambda \!\left(\omega \right)L_{A}\!\left(\omega \right)\!/x\!\left(\omega \right)}{\sum _{\overline{\omega }+1}^{\varOmega }ln\lambda \!\left(\omega \right)L_{A}\!\left(\omega \right)\!/x\!\left(\omega \right)}.\end{equation}
Equation (30) increases when technical change is directed toward radical innovation. Notably, the shift in technical change toward radical innovation occurs under several conditions: an increase in basic research labor, a higher proportion of applied research labor devoted to radical rather than incremental innovation, an increase in international knowledge spillovers, or an elevated significance of basic research, as indicated by a higher spillover parameter.
Taking the partial derivative of (30) with respect to the autonomy utility
 \begin{align}&\frac{\textit{dDirection}}{df}\geq -\frac{1}{{G_{I}}^{2}}\rho \frac{\alpha }{\varOmega }\frac{dE}{df}\nonumber \\&\quad \left\{\!\left[\!\left(L_{B}\right)^{\mu }+B_{f}\right]\sum _{1}^{\overline{\omega }}\frac{ln\lambda \!\left(\omega \right)}{x\!\left(\omega \right)}\left[1-\frac{1}{\lambda \!\left(\omega \right)}\right]\sum _{\overline{\omega }+1}^{\varOmega }ln\lambda \!\left(\omega \right)-\sum _{\overline{\omega }+1}^{\varOmega }\frac{ln\lambda \!\left(\omega \right)}{x\!\left(\omega \right)}\left[1-\frac{1}{\lambda \!\left(\omega \right)}\right]\sum _{1}^{\overline{\omega }}ln\lambda \!\left(\omega \right)\!\right\}\!,\end{align}
where
 $\frac{dE}{df}=-\left\{1+\frac{\mu \rho \sum _{1}^{\overline{\omega }}x\!\left(\omega \right)}{\left[\!\left(L_{B}\right)^{\mu }+B_{f}\right]^{2}\!\left(L_{B}\right)^{1-\mu }}\right\}\frac{dL_{B}}{df}\lt 0$
. Equation (31) indicates that the relative magnitudes of the spillover parameter
 $\mu$
and R&D difficulty
 $x(\omega )$
affect the academic environment’s influence on the direction of technical change. When
 $\mu \gt ln\!\left\{\frac{\sum _{1}^{\overline{\omega }}ln\lambda \!\left(\omega \right)\sum _{\overline{\omega }+1}^{\varOmega }\frac{ln\lambda \!\left(\omega \right)}{x\!\left(\omega \right)}\left[1-\frac{1}{\lambda \!\left(\omega \right)}\right]}{\sum _{\overline{\omega }+1}^{\varOmega }ln\lambda \!\left(\omega \right)\sum _{1}^{\overline{\omega }}\frac{ln\lambda \!\left(\omega \right)}{x\!\left(\omega \right)}\left[1-\frac{1}{\lambda \!\left(\omega \right)}\right]}-B_{f}\right\}/ln\!\left(L_{B}\right)$
, there must be
 $\frac{\textit{dDirection}}{df}\gt 0$
(see Appendix C).Footnote 12 That is, when knowledge spillover is substantial, the R&D difficulty associated with radical innovation is significantly alleviated through enhanced basic research, thereby accelerating product quality growth. This leads us to the following proposition:
Proposition 2:
If the knowledge spillover (
 $\mu$
) of basic research is strong, enhancing academic autonomy will promote technical change toward radical innovation.
We denote the economic growth rate as
 \begin{equation}G=\dot{Y}\!\left(t\right)\!/Y\!\left(t\right)=\left[\!\left(L_{B}\right)^{\mu }+B_{f}\right]\sum _{1}^{\overline{\omega }}\frac{ln\lambda \!\left(\omega \right)}{x\!\left(\omega \right)}L_{A}\!\left(\omega \right)+\sum _{\overline{\omega }+1}^{\varOmega }\frac{ln\lambda \!\left(\omega \right)}{x\!\left(\omega \right)}L_{A}\!\left(\omega \right)\!.\end{equation}
The partial derivative of (32) with respect to the autonomy utility is
 \begin{align} &\frac{dG}{df}=\underset{\textit{Directed}\; \textit{technical}\; \textit{change}\; \textit{effect}}{\underbrace{\left[\mu \!\left(L_{B}\right)^{\mu -1}\sum _{1}^{\overline{\omega }}\frac{ln\lambda \!\left(\omega \right)}{x\!\left(\omega \right)}L_{A}\!\left(\omega \right)+\frac{\mu \!\left(L_{B}\right)^{\mu -1}\rho }{\!\left(L_{B}\right)^{\mu }+B_{f}}\sum _{1}^{\overline{\omega }}ln\lambda \!\left(\omega \right)\right]\frac{dL_{B}}{df}}}\nonumber\\[8pt]& +\underset{\textit{Applied}\; \textit{research}\; \textit{crowding}-out\; \textit{effect}}{\underbrace{\frac{\alpha }{\varOmega }\left\{-1-\frac{\mu \!\left(L_{B}\right)^{\mu -1}\rho \sum _{1}^{\overline{\omega }}x\!\left(\omega \right)}{\left[\!\left(L_{B}\right)^{\mu }+B_{f}\right]^{2}}\right\}\left\{\left[\!\left(L_{B}\right)^{\mu }+B_{f}\right]\sum _{1}^{\overline{\omega }}\frac{ln\lambda \!\left(\omega \right)}{x\!\left(\omega \right)}\left[1-\frac{1}{\lambda \!\left(\omega \right)}\right]+\sum _{\overline{\omega }+1}^{\varOmega }\frac{ln\lambda \!\left(\omega \right)}{x\!\left(\omega \right)}\left[1-\frac{1}{\lambda \!\left(\omega \right)}\right]\right\}\frac{dL_{B}}{df}}}. \end{align}
Equation (33) implies that an increase of
 $f$
has two opposite effects on economic growth. The first is the directed technical change effect, in which greater academic autonomy stimulates basic research, leading to increased knowledge spillover to radical innovation, thereby promoting economic growth. The second is the applied research crowding-out effect. Enhancing academic autonomy also deters economic growth by crowding out applied research labor as the basic research sector becomes more appealing.
Proposition 3: Two competing effects determine the impact of the academic environment on economic growth: the directed technical change effect and the applied research crowding-out effect. While the former promotes economic growth by encouraging technical change toward radical innovation, the latter hinders economic growth by crowding out applied research.
3.4. Welfare analysis
We turn now to issues of welfare. Using (7), we can calculate the following exact expression for the per capita welfare of basic research labor and non-basic research labor:
 \begin{align}u_{B}&=\frac{1}{\rho ^{2}}\frac{\alpha }{\varOmega }\left\{\left[\!\left(L_{B}\right)^{\mu }+B_{f}\right]\sum _{1}^{\overline{\omega }}\frac{ln\lambda \!\left(\omega \right)}{x\!\left(\omega \right)}L_{A}\!\left(\omega \right)+\sum _{\overline{\omega }+1}^{\varOmega }\frac{ln\lambda \!\left(\omega \right)}{x\!\left(\omega \right)}L_{A}\!\left(\omega \right)\right\}+\frac{lnE}{\rho }\nonumber \\&\quad +\frac{ln\!\left[\!\left(1-\alpha \right)^{1-\alpha }\!\left(\frac{\alpha }{\varOmega }\right)^{\alpha }\right]-\frac{\alpha }{\varOmega }\sum _{1}^{\varOmega }\mathit{\ln } \lambda \!\left(\omega \right)-ln\overline{L}}{\rho }+\frac{f}{\rho },\end{align}
 \begin{align}u_{N}&=\frac{1}{\rho ^{2}}\frac{\alpha }{\varOmega }\left\{\left[\!\left(L_{B}\right)^{\mu }+B_{f}\right]\sum _{1}^{\overline{\omega }}\frac{ln\lambda \!\left(\omega \right)}{x\!\left(\omega \right)}L_{A}\!\left(\omega \right)+\sum _{\overline{\omega }+1}^{\varOmega }\frac{ln\lambda \!\left(\omega \right)}{x\!\left(\omega \right)}L_{A}\!\left(\omega \right)\right\}+\frac{lnE}{\rho }\nonumber \\&\quad +\frac{ln\!\left[\!\left(1-\alpha \right)^{1-\alpha }\!\left(\frac{\alpha }{\varOmega }\right)^{\alpha }\right]-\frac{\alpha }{\varOmega }\sum _{1}^{\varOmega }\mathit{\ln } \lambda \!\left(\omega \right)-ln\overline{L}}{\rho }.\end{align}
As shown in (34) and (35), the welfare of both labor types depends on economic growth and income. Moreover, in contrast to non-basic research labor, the welfare of basic research labor incorporates an additional non-pecuniary compensation
 $f/\rho$
derived from academic autonomy.
First, we take the partial derivative of (34) with respect to the autonomy utility
 \begin{equation}\frac{\partial u_{B}}{\partial f}=\underset{\textit{Economic}\; \textit{growth}\; \textit{effect}}{\underbrace{\frac{1}{\rho ^{2}}\frac{\alpha }{\varOmega }\frac{\partial G}{\partial f}}}+\underset{\textit{Income}\; \textit{effect}}{\underbrace{\frac{1}{\rho E}\frac{\partial E}{\partial f}}}+\underset{\textit{Academic}\; \textit{autonomy}\; \textit{effect}}{\underbrace{\frac{1}{\rho }}}.\end{equation}
Equation (36) implies that an increase of
 $f$
has three effects on the welfare of basic research labor. The first is the economic growth effect, which incorporates both positive directed technical change effect and negative applied research crowding-out effect as discussed above. The second is the negative income effect. Enhanced academic autonomy incentivizes scientists to shift toward basic research. This crowds out applied research and productive labor, which diminishes productive capacity, thereby reducing aggregate output and depressing overall income. Third, the positive academic autonomy effect provides scientists’ intrinsic satisfaction by fostering research autonomy.
Next, the partial derivative of (35) with respect to the autonomy utility is
 \begin{equation}\frac{\partial u_{N}}{\partial f}=\underset{\textit{Economic}\; \textit{growth}\; \textit{effect}}{\underbrace{\frac{1}{\rho ^{2}}\frac{\alpha }{\varOmega }\frac{\partial G}{\partial f}}}+\underset{\textit{Income}\; \textit{effect}}{\underbrace{\frac{1}{\rho E}\frac{\partial E}{\partial f}}}\!.\end{equation}
Equation (37) indicates that enhancing academic autonomy has two effects on the welfare of non-basic research labor. Similarly, the first is the economic growth effect, while the second is the negative income effect.
Proposition 4: Enhanced academic autonomy influences the welfare of basic research labor through three channels: (i) an economic growth effect comprising positive directed technical change effect and negative applied research crowding-out effect, (ii) a negative income effect, and (iii) a positive academic autonomy effect. In contrast, the welfare of non-basic research labor is affected solely by the economic growth effect and negative income effect.
4. Quantification
In this section, we parameterize the model to match the salient features of the Chinese economy and quantitatively evaluate the impact of the academic environment on directed technical change, economic growth and welfare.
4.1. Parameter choices
We assigned values to a subset of parameters drawn from the existing literature. Following Chang et al. (Reference Chang, Liu and Spiegel2015), we set the share of labor in the final production at
 $(1-\alpha )=0.50$
. Furthermore, we followed Gersbach et al. (Reference Gersbach, Sorger and Amon2018) and set the time-preference rate to
 $\rho =0.02$
. Following Khandelwal (Reference Khandelwal2010), we measure the quality ladder as the range of qualities within a product. Using China customs trade data, we calculate the quality ladder
 $\lambda (\omega )$
for 366 four-digit industries.Footnote 13 Following Acemoglu et al. (Reference Acemoglu, Akcigit and Celik2022), we classify innovations occurring in industries with quality ladders above the 90th percentile as radical innovations and set
 $\overline{\omega }=36$
. Following Kortum (Reference Kortum1993) and Segerstrom (Reference Segerstrom1998), we define R&D difficulty as the firm-level patent-per-expenditure ratio and estimate the elasticity of R&D difficulty relative to the quality ladder, setting
 $\delta =0.092$
. Finally, we set
 $\overline{L}=100$
.
In addition to the parameters discussed above, we have four parameters to calibrate. These include the autonomy utility
 $f$
, the domestic knowledge spillover parameter
 $\mu$
, the tax rate
 $\tau$
, and the international knowledge spillovers
 $B_{f}$
. We calibrated the parameters as follows. Given an arbitrary set of parameters
 $\Theta =\{f,\mu ,\tau ,B_{f}\}$
, we simulate the model and calculate a set of four moments (
 $M^{\textit{model}})$
based on the simulations. We search over the space of
 $\Theta$
to minimize an objective function given by
 $(M^{\textit{model}}-M^{\textit{data}})\hat{W}(M^{\textit{model}}-M^{\textit{data}})$
, where
 $M^{\textit{data}}$
is the data counterpart of
 $M^{\textit{model}}$
. To simplify the calculation, we set the weight matrix
 $\hat{W}=1$
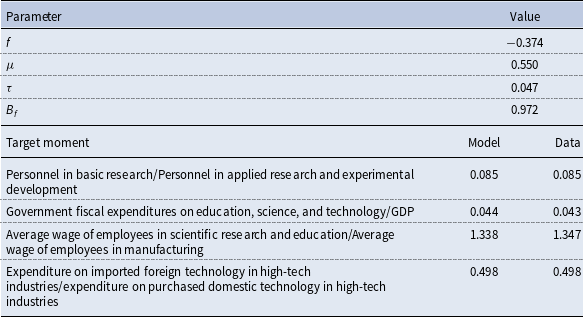
. Table 2 presents the calibrated parameters and target moments, showing minimal differences between the data- and model-generated moments.Footnote 14 To bolster confidence in using the model to conduct counterfactual experiments, we provide additional evidence that the model generates sensible predictions along dimensions that are not directly targeted. A key model feature is the distribution of applied research labor across industries. Using the calibrated parameters, we solved the equilibrium and calculated the applied research labor across industries. The correlation in industry-applied research labor between the model and the data is 0.58, achieving significance at the 1% level.Footnote 15
Calibrated parameters and target moments

Data source: China Statistical Yearbook (2017–2022), China Statistical Yearbook on Science and Technology (2017–2022).
Our calibration reveals a negative autonomy utility for basic researchers (
 $f=-0.37$
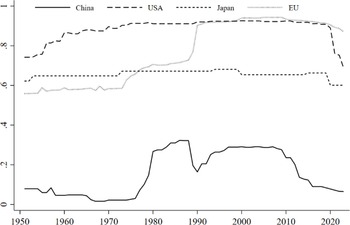
), indicating constraints on scientific exploration within China’s current academic environment. As shown in international comparisons of the Academic Freedom Index (AFI) in Figure 2, the average AFI in China from 1950 to 2023Footnote 16 was 0.16, significantly less than that of the United States (0.88), Japan (0.66), and the European Union (0.76). These differences in AFI may stem from variations in the structure of basic research entities across countries. Unlike developed economies, where private sector engagement plays a prominent role, China’s basic research is predominantly conducted within the public sector. Public sectors such as universities and research institutions often focus on meeting national strategic requirements. This alignment ensures a high degree of congruence between scientific research and national objectives but may also limit the autonomy of scientists in selecting research projects. In contrast, China’s private sectors exhibit greater autonomy in conducting basic research. As articulated by Zhengfei Ren, CEO of Huawei, the company’s evaluation mechanism exempts basic researchers from direct accountability for specific outcomes, instead encouraging autonomous scientific exploration. However, in 2021, the average share of basic research expenditures by the business enterprise sector in China’s total basic research expenditures was only 9.18%, considerably less than the corresponding figures in the United States (35.45%), Japan (46.63%), and France (20.36%). Thus, although private entities in China demonstrate higher research autonomy compared to their public counterparts, the overall assessment of academic environment (AFI) still lags behind that of developed countries.
AFI trends in selected countries.

Recent market-oriented institutional reforms in China suggest a shift toward greater research autonomy. The 2022 joint policy “Q&A on Expanding Scientific Research Autonomy” issued by the Ministry of Science and Technology and Ministry of Education reaffirms the commitment to reducing government intervention by granting researchers greater decision-making authority over programs and funding allocation. Concurrently, enterprises like Huawei (2012 Laboratory) and Alibaba (Damo Academy) have established dedicated basic research institutes, a dual trend expected to diversify funding sources and cultivate an academic environment with higher research autonomy in China.
Our calibration further indicates that the domestic knowledge spillover parameter is 0.55, representing the elasticity of applied research efficiency in relation to basic research investment. Given the calibrated values for spillover parameters and R&D difficulty, the condition
 $\mu \gt ln\!\left\{\frac{\sum _{1}^{\overline{\omega }}ln\lambda \left(\omega \right)\sum _{\overline{\omega }+1}^{\varOmega }\frac{ln\lambda \left(\omega \right)}{x\left(\omega \right)}\left[1-\frac{1}{\lambda \left(\omega \right)}\right]}{\sum _{\overline{\omega }+1}^{\varOmega }ln\lambda \left(\omega \right)\sum _{1}^{\overline{\omega }}\frac{ln\lambda \left(\omega \right)}{x\left(\omega \right)}\left[1-\frac{1}{\lambda \left(\omega \right)}\right]}-B_{f}\right\}/ln\!\left(L_{B}\right)$
is satisfied, indicating that greater academic autonomy will promote technical change toward radical innovation. Additionally, the calibrated value for international knowledge spillovers is 0.97, accounting for 33.23% of total basic research spillovers. Furthermore, counterfactual analysis reveals that eliminating international knowledge spillovers (
 $B_{f}=0$
) would reduce the share of applied research labor involved in radical innovation by 3.35%. This result underscores the critical importance of international knowledge spillovers for China’s innovation system. Specifically, these knowledge flows, including foreign direct investment, trade, academic collaboration, and open-access research, mitigate the adverse effects of China’s current academic environment on radical innovation.
4.2. Counterfactual analysis
First, we solve the initial equilibrium under the current autonomy utility (
 $f=-0.37$
). Column (a) of Table 3 shows that basic research labor constitutes 3.38% of the total population, representing only 8.50% of the applied research labor. Within the applied research sector, approximately 11.52% of the researchers engaged in radical innovation. The value of the technical change direction is 0.43 and the economic growth rate is 99.76 (in model units), which reflect China’s economic growth condition in our calculated economy.
Results of counterfactual analysis

Notes:
 $L_{AR}=\sum _{1}^{\overline{\omega }}L_{A}(\omega )$
,
 $L_{AI}=\sum _{\overline{\omega }+1}^{\varOmega }L_{A}(\omega )$
,
 $\overline{u}=[u_{B}L_{B}+u_{N}(\overline{L}-L_{B})]/\overline{L}$
.
We then evaluate how changes in academic autonomy would impact the research labor allocation and the directed technical change in the calculated economy. In particular, suppose we vary
 $f\in [-0.37,\; 2]$
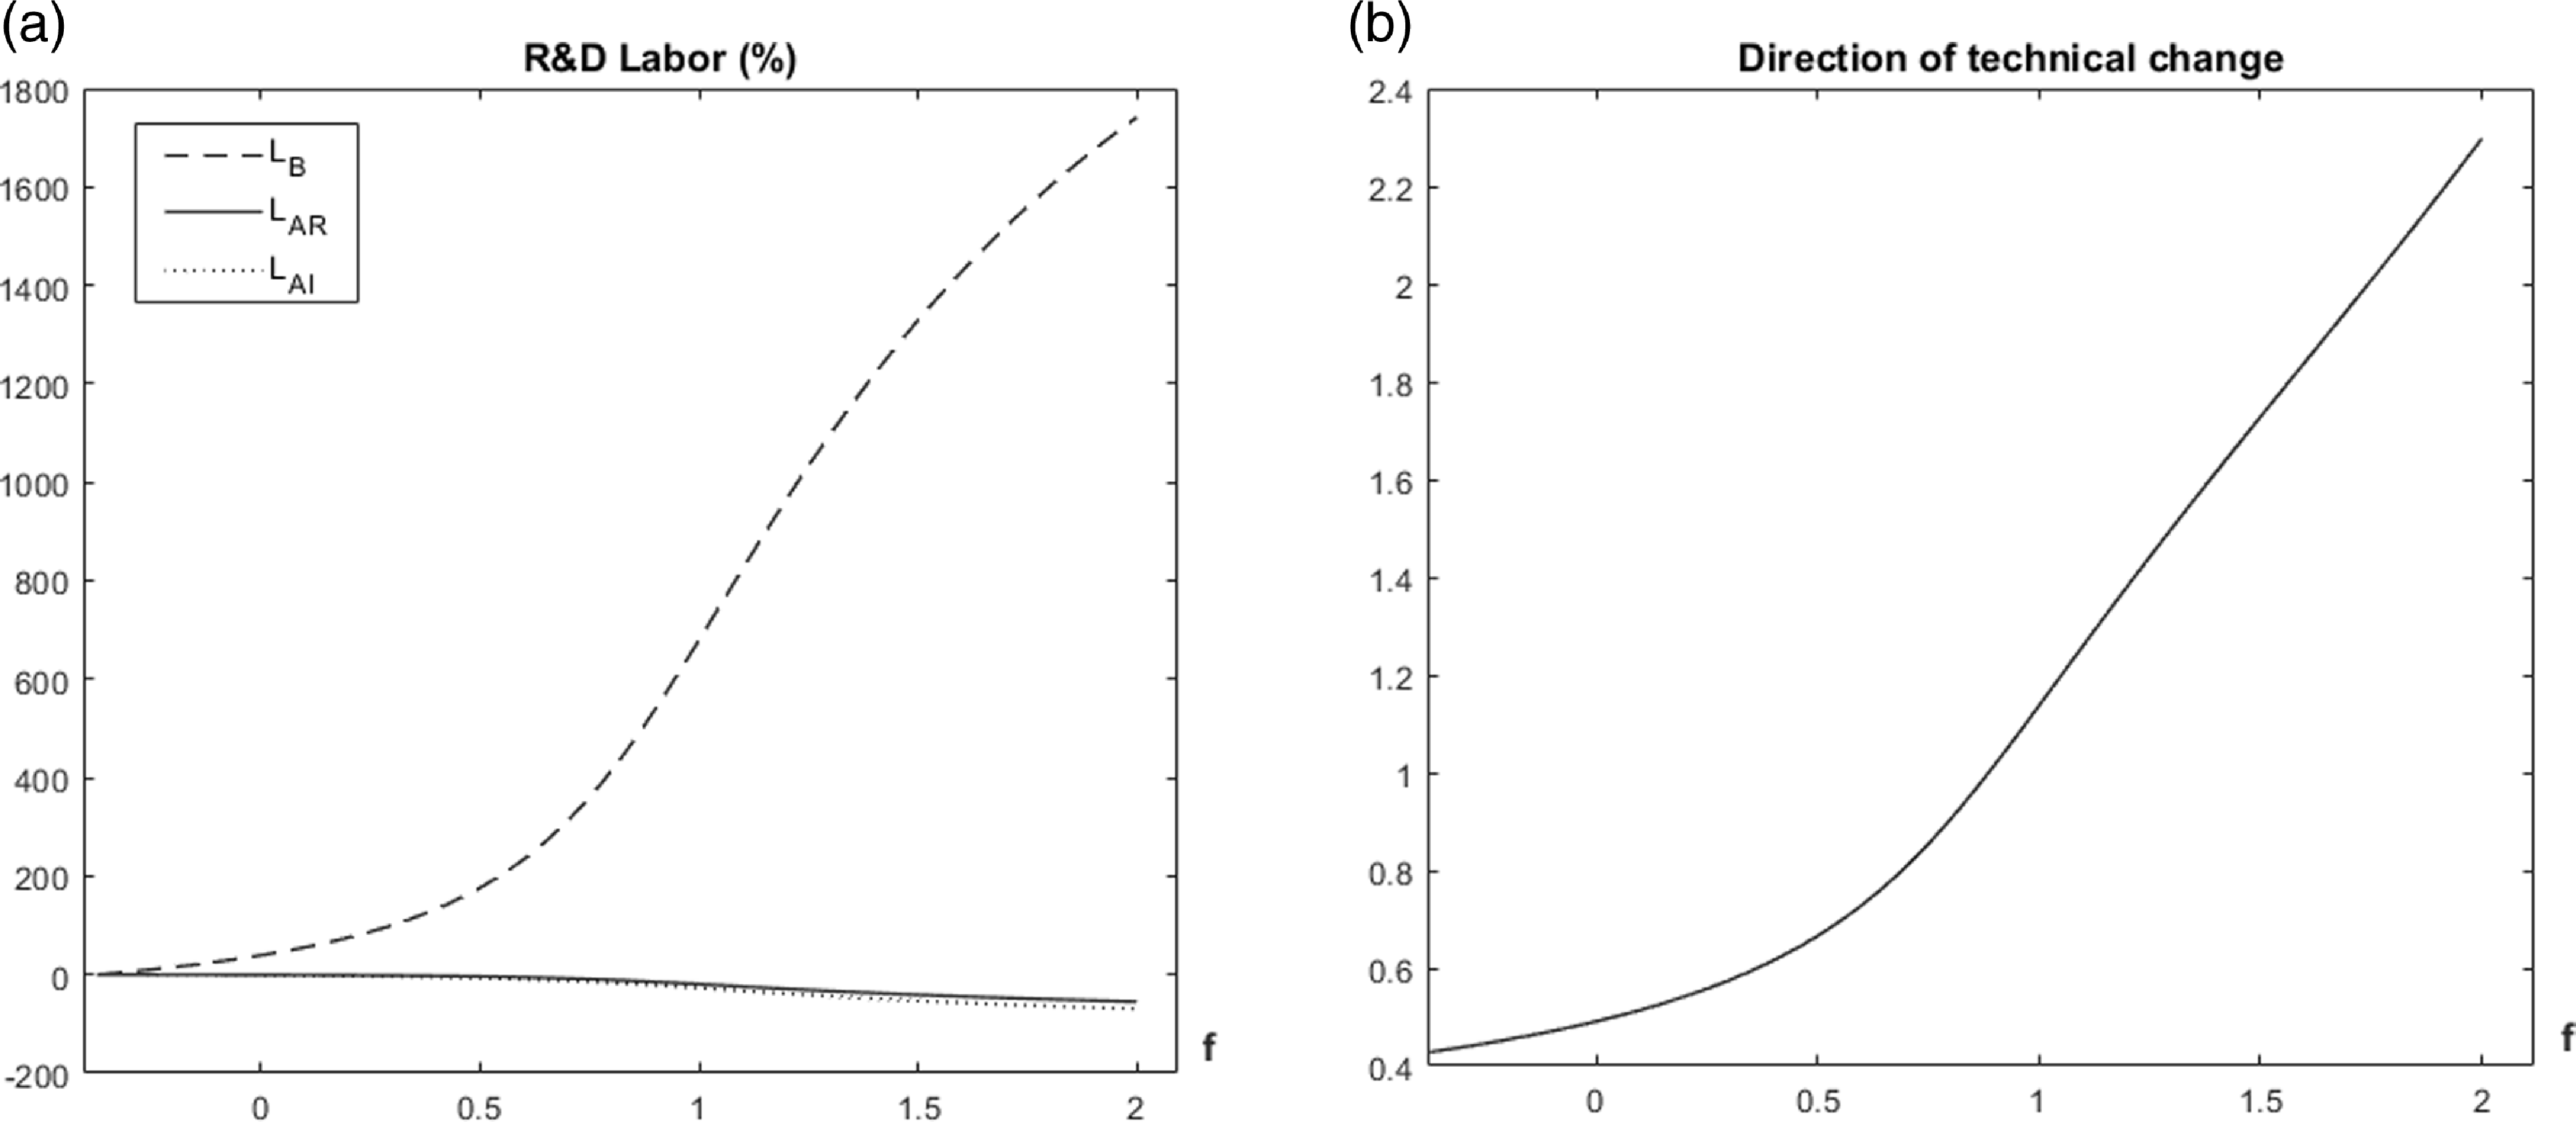
in the system above, leaving all other parameters unchanged. Figure 3(a) shows that across the entire parameter range, the greater academic autonomy increases basic research labor while decreasing applied research labor. Notably, the decline in applied research labor involved in incremental innovation is more pronounced than in radical innovation. Regarding the direction of technical change, Figure 3(b) demonstrates a positive correlation with autonomy utility, indicating a shift toward radical innovation as the academic environment improves.
Impact of the academic environment on directed technical change.
Note: The vertical axes in figure (a) and Figure 5 represent the rate of change, expressed as a percentage.

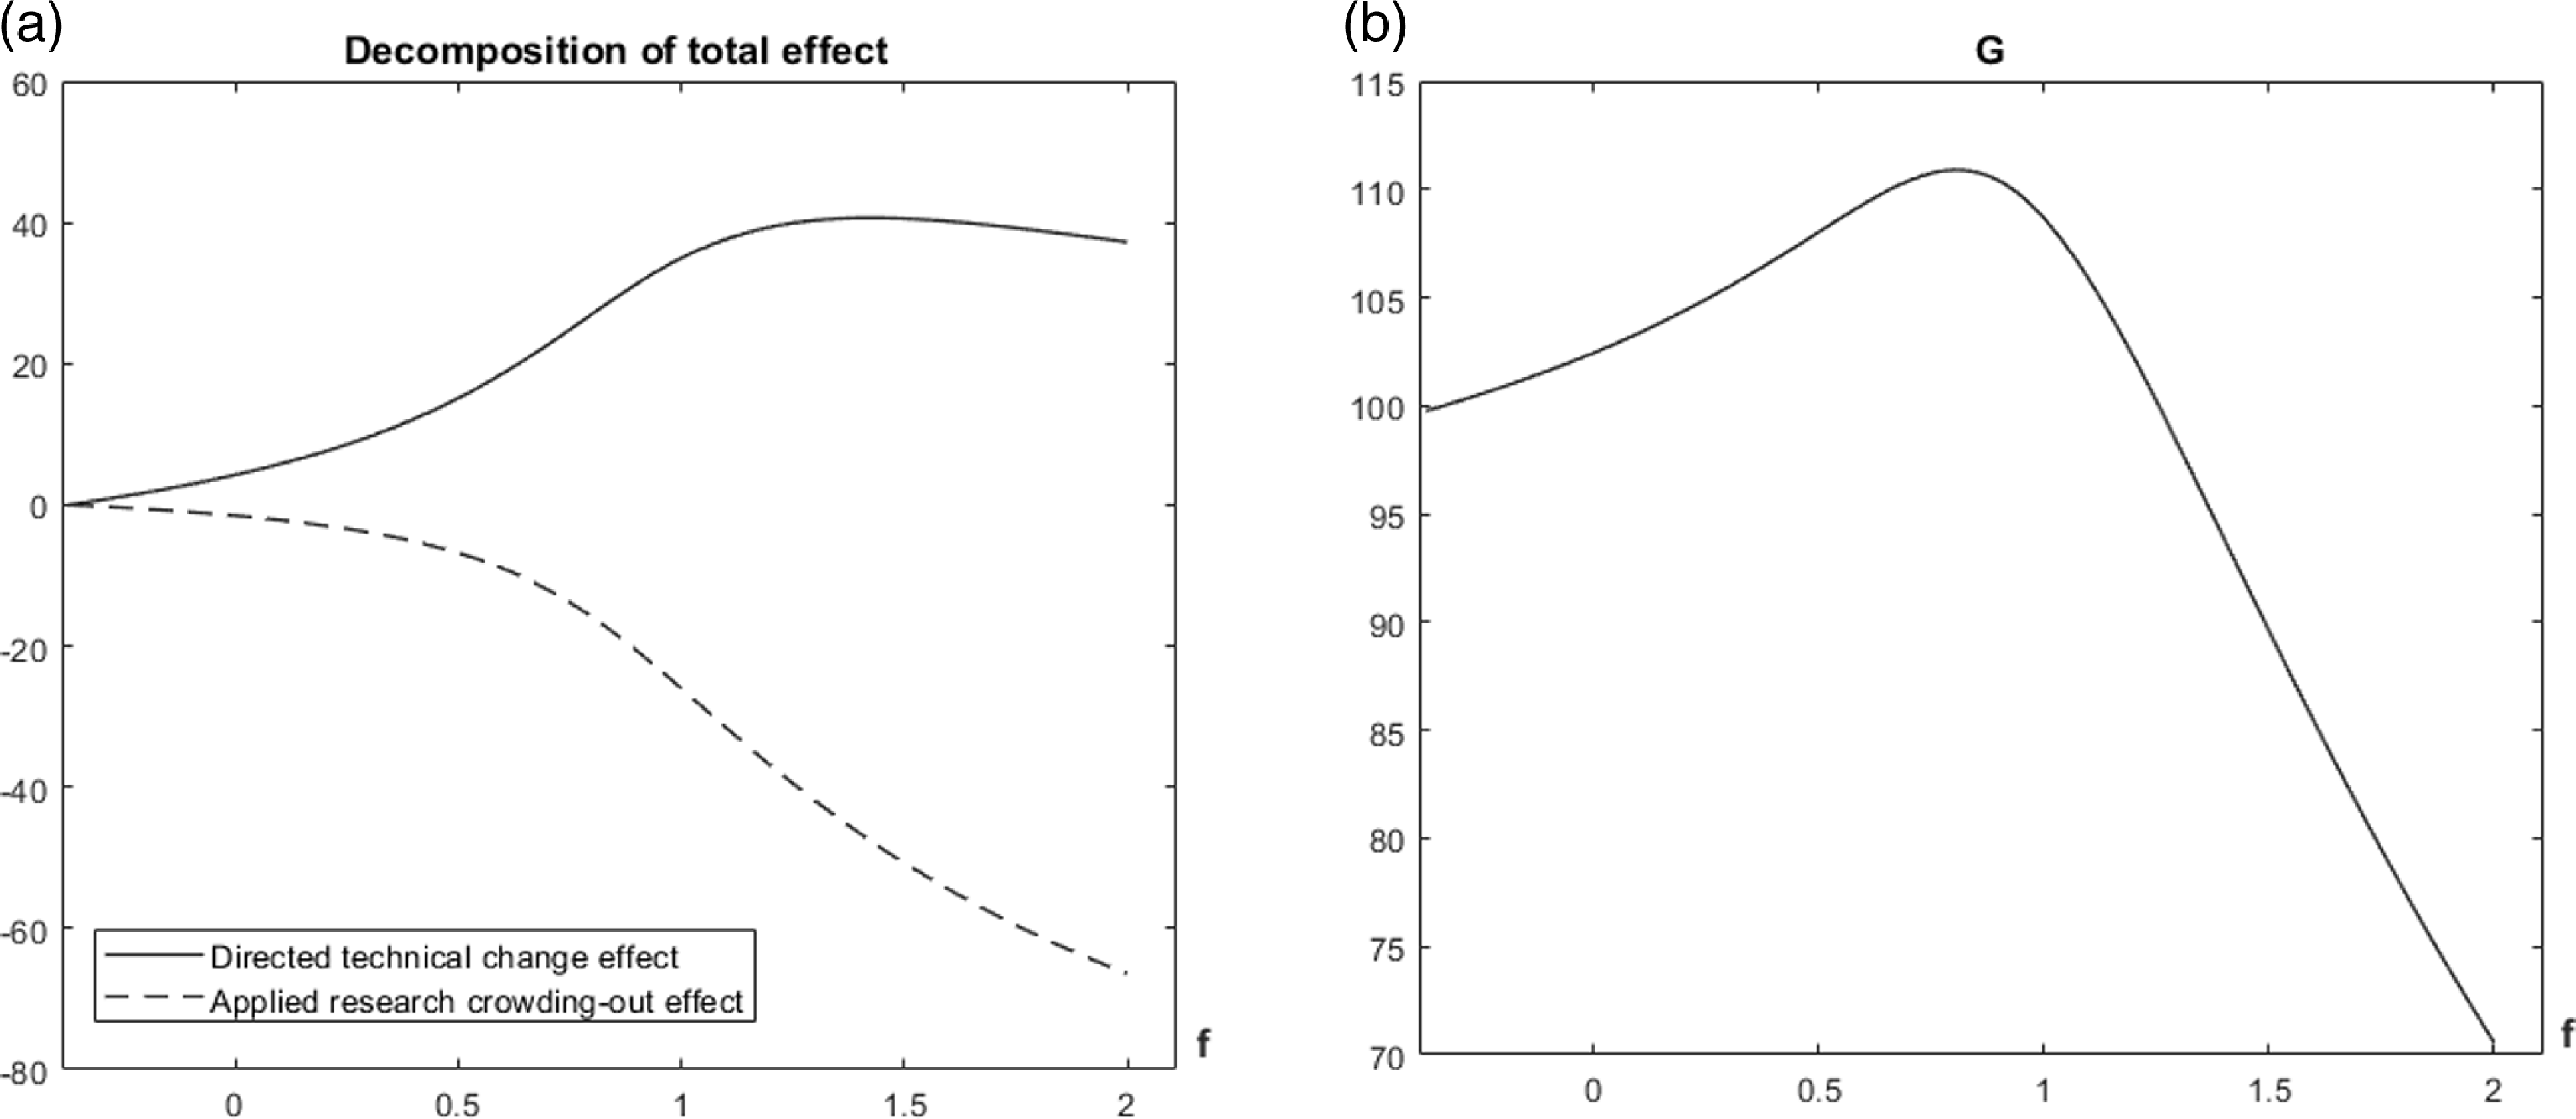
We further investigated the effect of the academic environment on economic growth rate, with our findings aligning with Proposition 3. As illustrated in Figure 4(a), the directed technical change effect is positive, while the applied research crowding-out effect is negative. Regarding the total effect, Figure 4(b) demonstrates that the academic autonomy has an inverted U-shaped relationship with economic growth rate. The growth-maximizing autonomy utility is calibrated at 0.80, yielding 11.14 units increase in the economic growth rate at this optimum. The directed technical change effect and the applied research crowding-out effect contribute 27.08 and −15.94 units, respectively. Additionally, basic research labor expanded by 5.15 times its initial level, while the applied research labor engaged in radical and incremental innovation decreased by 10.93 and 16.65%, respectively (as depicted in Column (b) of Table 3).
Impact of the academic environment on economic growth.

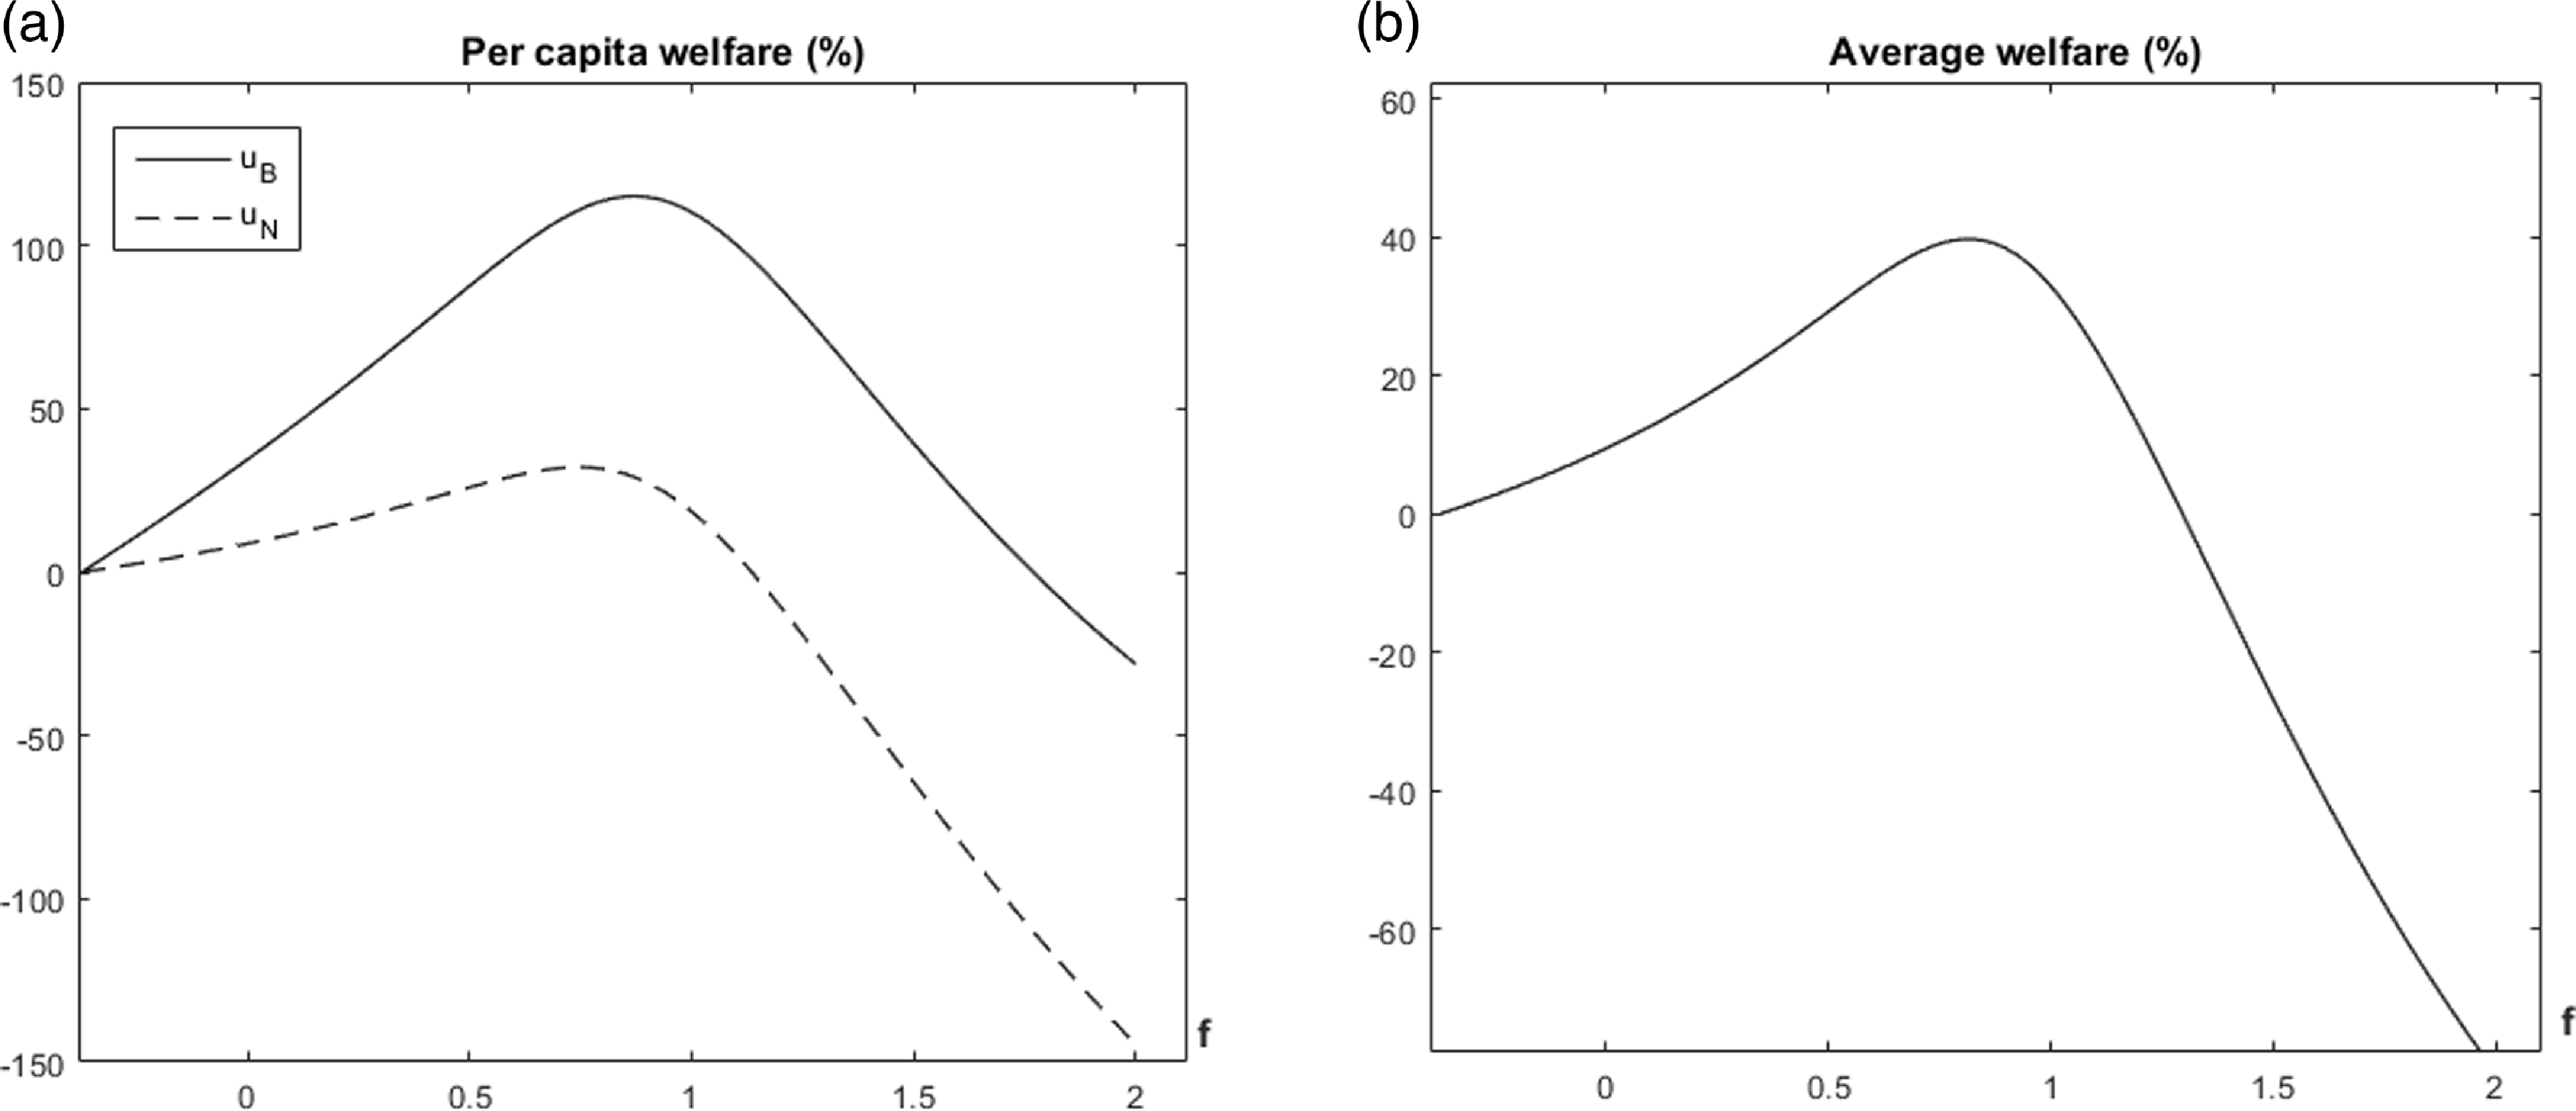
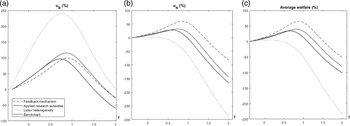
Finally, we examine welfare implications of academic environment reforms. Figure 5(a) demonstrates an inverted U-shaped relationship between academic autonomy and welfare for both labor types. The welfare-maximizing autonomy utility is 0.87 for basic research labor and 0.75 for non-basic research labor. Initially, enhancing academic autonomy increases welfare through radical innovation-driven economic growth. Beyond a critical threshold, however, further autonomy induces excessive resource reallocation toward basic research. This reduces applied research effort and production labor supply, eroding productive capacity and generating welfare losses through diminished income. Crucially, basic researchers derive non-pecuniary compensation from academic exploration, explaining their higher optimal level of autonomy utility. When aiming to maximize average welfare, as illustrated in Figure 5(b), the compromise autonomy utility is 0.83.
Impact of the academic environment on welfare.

In summary, the current academic environment in China has dampened scientists’ motivation to engage in basic research. Enhancing academic autonomy would direct technical change toward radical innovation, significantly contributing to economic growth. However, excessive academic autonomy could markedly reduce the applied research workforce, particularly among researchers engaged in incremental innovation, ultimately hindering economic growth. Welfare analysis indicates that the optimal autonomy utility for basic research labor exceeds the growth-maximizing level, while for non-basic research labor it falls below. This divergence implies uniform academic policies cannot simultaneously optimize all objectives. Policymakers should therefore adjust academic autonomy according to specific growth or welfare target.
4.3. Extensions and robustness checks
In this section, we investigate how our estimation and counterfactual results are affected by a range of variations in our model. In each case, the implied parameter estimates and the match between the model and the data moments are depicted in Appendix D. Overall, we found that our main conclusions were fairly robust across these variations.
Feedback mechanism. In the benchmark model, the reverse effect of applied research on basic research is not considered. However, successful applied research (particularly radical innovation) may generate new theoretical questions and practical insights that inform future basic research. We therefore incorporate this feedback mechanism between applied and basic research as our first robustness check. According to Gersbach et al. (Reference Gersbach, Sorger and Amon2018), we assume that the industry-wide instantaneous probability of innovation is
 \begin{equation}prob\!\left(\omega \right)=\begin{cases} \dfrac{\!\left(L_{AR}\right)^{\mu A}\!\left(L_{B}\right)^{\mu }+B_{f}}{x\!\left(\omega \right)}l_{Ai}\!\left(\omega \right)dt, & \omega \leq \overline{\omega }\\[9pt] \dfrac{1}{x\!\left(\omega \right)}l_{Ai}\!\left(\omega \right)dt, & \omega \gt \overline{\omega } \end{cases},\end{equation}
where
 $L_{AR}=\sum _{1}^{\overline{\omega }}L_{A}(\omega )$
denotes the applied research labor in radical innovation,
 $\mu A\in (0,1)$
is the exogenous spillover parameter from applied research to basic research. The no-arbitrage condition for R&D firms then becomes
 \begin{align}\begin{array}{ccc} & \dfrac{\alpha E}{\varOmega }\left[1-\dfrac{1}{\lambda \!\left(\omega \right)}\right]-L_{A}\!\left(\omega \right)-\dfrac{\rho x\!\left(\omega \right)}{\!\left(L_{AR}\right)^{\mu A}\!\left(L_{B}\right)^{\mu }+B_{f}}=0, & \omega \leq \overline{\omega }\\[9pt] & \dfrac{\alpha E}{\varOmega }\left[1-\dfrac{1}{\lambda \!\left(\omega \right)}\right]-L_{A}\!\left(\omega \right)-\rho x\!\left(\omega \right)=0, & \omega \gt \overline{\omega } \end{array}. \end{align}
Following Gersbach et al. (Reference Gersbach, Sorger and Amon2018), we set the spillover parameter from applied research to basic research
 $\mu A=0.6$
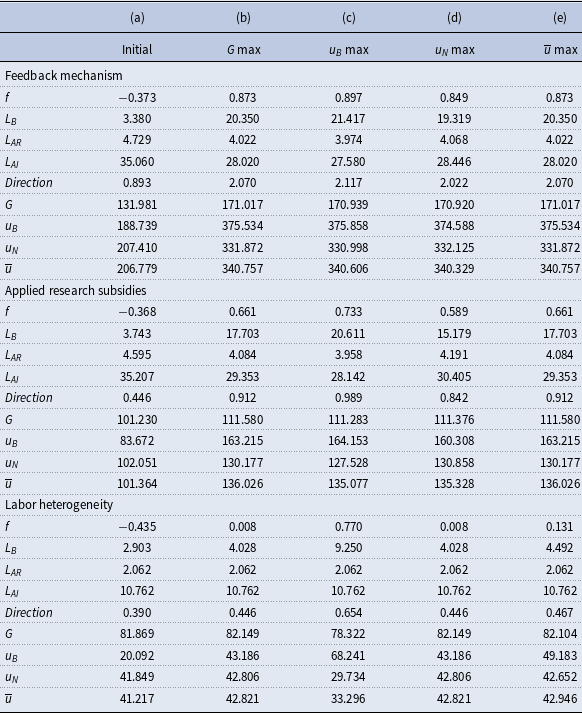
and recalibrate the model parameters. The results in Column (a) of Table 4 indicate that, under the assumption of feedback mechanism, the utility of academic autonomy remains negative at −0.37. Compared with the benchmark, the labor engaged in basic research and radical innovation-related applied research increased by 0.09% and 3.38%, respectively. This causes technical change to be more inclined toward radical innovation, thereby accelerating economic growth. As shown in Figures 6 and 7, the effects of the academic environment on economic growth rate and welfare are very similar to our baseline. As reported in Table 4, the autonomy utility for maximizing the economic growth rate is 0.87. However, the welfare-maximizing autonomy utility is calibrated at 0.90 for basic research labor, 0.85 for non-basic research labor, and 0.87 for average welfare.
Results of counterfactual analysis: robustness checks

Notes:
 $L_{AR}=\sum _{1}^{\overline{\omega }}L_{A}(\omega )$
,
 $L_{AI}=\sum _{\overline{\omega }+1}^{\varOmega }L_{A}(\omega )$
,
 $\overline{u}=[u_{B}L_{B}+u_{N}(\overline{L}-L_{B})]/\overline{L}$
.
Impact of the academic environment on economic growth rate: robustness checks.

Impact of the academic environment on welfare: robustness checks.

Applied research subsidies. We next investigate the robustness of our results to scenarios in which government implements subsidies for applied research. The no-arbitrage condition for R&D firms now transforms to
 \begin{align} \begin{array}{ccc} & \frac{\alpha E}{\varOmega \!\left(1-\varphi \right)}\left[1-\dfrac{1}{\lambda \!\left(\omega \right)}\right]-L_{A}\!\left(\omega \right)-\dfrac{\rho x\!\left(\omega \right)}{\!\left(L_{B}\right)^{\mu B}+B_{f}}=0, & \omega \leq \overline{\omega }\\ & \dfrac{\alpha E}{\varOmega\!\!\left(1-\varphi \right)}\left[1-\dfrac{1}{\lambda\!\!\left(\omega \right)}\right]-L_{A}\!\!\left(\omega \right)-\rho x\!\!\left(\omega \right)=0, & \omega \gt \overline{\omega } \end{array},\end{align}
where
 $\varphi \in [0,1)$
represents the subsidy rate. The government budget constraint becomes
 \begin{equation}w_{B}L_{B}+\varphi \sum _{1}^{\varOmega }L_{A}\!\left(\omega \right)=\tau \left[\sum _{1}^{\varOmega }L_{A}\!\left(\omega \right)+L_{Y}+L_{M}\right]\!.\end{equation}
Column (a) of Table 4 presents the general equilibrium when
 $\varphi =0.01$
. The recalibrated autonomy utility is −0.37, and labor allocation to applied research increases by 0.46% for radical innovation and 0.23% for incremental innovation relative to the benchmark. This reallocation promotes technical change toward radical innovation, thereby increasing economic growth rate. Figures 6 and 7 illustrate that, with the implementation of applied research subsidies, the effects of the academic environment on economic growth and welfare is remarkably similar to the baseline. The resulting optimal autonomy utility for maximizing the economic growth rate is 0.66 in Table 4. Moreover, Table 4 shows that welfare-maximizing autonomy utilities are 0.73 (basic research labor), 0.59 (non-basic research labor), and 0.66 (average welfare), respectively.
Labor heterogeneity. Finally, we considered variations in the model’s assumptions. In the benchmark quantitative framework, labor is assumed to be homogeneous, allowing free movement between the production and research sectors. One concern is that, in developing countries, considerable variations in labor skills present greater challenges to free career choices among sectors. To address this concern, we formulate and re-estimate a version of the model featuring labor heterogeneity. In particular, we categorize labor into two types: workers and scientists. Workers are assumed to merely produce final and intermediate goods, while scientists engage exclusively in basic and applied research. The total numbers of workers and scientists are
 $\overline{L}_{w}$
and
 $\overline{L}_{s}$
, respectively. Scientists are required to make career choices each period, and the no-arbitrage condition of the representative scientist is as follows:
 \begin{equation}\!\left(1-\tau \right)w_{A}=fcp_{Y}+w_{B},\end{equation}
where
 $w_{A}$
is the wage rate in the applied research sector. The government budget constraint becomes
 \begin{equation}w_{B}L_{B}=\tau w_{A}\sum _{1}^{\varOmega }L_{A}\!\left(\omega \right)+\tau \!\left(L_{Y}+L_{M}\right)\!.\end{equation}
The market clearing conditions for workers and scientists are, respectively,
 \begin{equation}L_{Y}+L_{M}=\overline{L}_{w},\end{equation}
 \begin{equation}\sum _{1}^{\varOmega }L_{A}\!\left(\omega \right)+L_{B}=\overline{L}_{s}.\end{equation}
According to the average employment ratio of manufacturing and scientific research in China from 2017 to 2022, we set
 $\overline{L}_{w}=63.55$
and
 $\overline{L}_{s}=36.45$
. Subsequently, we re-estimate the parameters of this model. Column (a) of Table 4 reports that the recalibrated autonomy utility is −0.44, which is still negative under the assumption of labor heterogeneity. Restricted labor mobility between sectors reduces the number of researchers in both basic and applied fields, leading to a lower technical change index and a slower economic growth rate. Figures 6 and 7 illustrate that the effects of the academic environment on economic growth rate and welfare are again very similar to the baseline, and the optimal autonomy utility for economic growth reported in Table 4 is 0.01. The optimal autonomy utility values differ substantially across groups: 0.77 for basic research labor, 0.01 for non-basic research labor, and 0.13 for average welfare.
Overall, the robustness exercises presented in this section show that the estimation of the current autonomy utility in China and the qualitative patterns of the effects of the academic environment on economic growth rate and welfare are fairly robust.
5. Conclusion
Although the literature on academic environment is extensive, relatively few studies have examined its effects on directed technical change and economic growth. This paper introduces a heterogeneous Schumpeterian growth model that distinguishes between radical and incremental innovations, with radical innovation undertaken by industries with high-quality ladders. In this model, basic research is established as a necessary and sufficient condition for the R&D of radical innovation. Our findings indicate that when the knowledge spillover from basic research is strong, enhancing academic autonomy promotes technical change toward radical innovation, thereby stimulating economic growth. However, the greater academic autonomy can also make the basic research sector more attractive, potentially leading to the crowding out of applied research and adversely affecting overall economic growth. We term these effects the directed technical change effect and the applied research crowding-out effect, respectively. Moreover, welfare analysis reveals that enhanced academic autonomy impacts the welfare of basic research labor through economic growth, lower income, and increased research autonomy, whereas the welfare of non-basic research labor is solely affected by economic growth and lower income.
To illustrate our model, we present an example that reflects the academic environment and innovation patterns in China. Our quantitative analysis identifies a negative autonomy utility (−0.37) for Chinese basic researchers, indicating constrained research autonomy within the current academic environment. To maximize the economic growth rate, substantial improvements to the academic environment are required until the autonomy utility reaches 0.80. At this optimum, the growth rate increases by 11.14 units, where the directed technical change effect contributes 27.08 units and the applied research crowding-out effect reduces growth by 15.94 units. Furthermore, welfare analysis reveals that promoting academic autonomy generate an inverted U-shaped effect on both basic research labor and non-basic research labor, and the optimal autonomy utility levels are 0.87 and 0.75 respectively. When maximizing average welfare, a compromise autonomy utility is 0.83. The main conclusions of this paper are very robust across a range of variations in innovation mechanisms, government policies, and labor mobility.
This paper contributes to ongoing discourse on the impact of the academic environment on economic growth and welfare by underscoring the necessity of further investigation into the distinct roles of basic and applied research. Future researchers should consider the heterogeneity in basic research paradigms, particularly comparing the differences in economic growth and welfare effects between privately and publicly funded basic research—a potentially complex task, yet essential for advancing our understanding of the broader economic implications of the academic environment.
Supplementary material
The supplementary material for this article can be found at https://doi.org/10.1017/S1365100525100783.
Acknowledgements
Ye Meng acknowledges the financial support from the National Social Science Fund of China (grant number 25CJY178). Xiwei Zhu acknowledges the financial support from the National Natural Science Foundation of China (grant number 72273130) and the Fundamental Research Funds for the Central Universities.
Competing interests
The authors declared no potential conflicts of interest with respect to the research, authorship, and publication of this article.