

1. INTRODUCTION
Researchers have long noted that late nineteenth-century North American mortality, particularly in urban environments, remained higher than would be expected given European mortality trends during this same period.Footnote 1 The theory of a uniform mortality transition has given way to a view that mortality decline depended upon a much more complex set of local conditions and experiences.Footnote 2 For the United States, the evidence suggests that overall mortality may have declined in the third and early fourth quarters of the nineteenth century.Footnote 3 However, in Massachusetts, mortality plateaued during the latter half of the nineteenth century, and not until the turn of the twentieth century did mortality begin a slow but sustained decline.Footnote 4 In previous work, we have argued that high overall regional mortality was sustained by the strains of significant population growth within newly emerging urban–industrial communities.Footnote 5 These strains were ultimately relieved as population growth stabilised and urban infrastructures developed, notably with the introduction of filtered water supplies and sewage systems.Footnote 6 Although such improvements began after mid-century, their widespread penetration into emerging industrial cities was not completed until near the turn of the century or later, when regional mortality finally began to fall.
In this article, we expand our previous work on population growth and ecological conditions by assessing the impact of family wealth and immigration patterns on individual-level mortality during the early stages of the mortality transition in Northampton and Holyoke, Massachusetts. Immigrant populations in industrial destinations such as Northampton and Holyoke may have depressed mortality due to ‘healthy migrant’ and ‘healthy worker’ selection effects, i.e. migrants are more likely to be healthy, to be young adults, to have survived the rigours of migration, and to remain in these settings. In contrast, newly arriving immigrants may also temporarily increase mortality, as they become ‘seasoned’ in the new environment, and this effect may be particularly pronounced in urban destinations with higher population density and higher disease loads.Footnote 7 Contemporaries argued that immigrant populations flooding into new urban communities, bringing with them vice, ill health and poverty, were responsible for high mortality conditions.Footnote 8 The incredible levels of wealth inequality and squalor in many emerging urban cities, exemplified particularly in Holyoke, may also have contributed to high mortality through the impoverished condition of the lower economic classes, or the most vulnerable among them.Footnote 9 Rapid influxes of new immigrant populations coupled with high levels of wealth inequality provide evidence for suggesting alternative, or complementary, hypotheses for Massachusetts' mortality plateau.
Mortality in Holyoke and Northampton exhibited a pattern of initial increase, followed by a plateau, and then a decline late in the period.Footnote 10 We argue that the balancing of rapid growth from a series of in-migrating populations with the establishment of earlier migrants contributed significantly to this mortality pattern. There were three periods, or waves, of immigration into Northampton and Holyoke during the nineteenth century. The first large-scale wave consisted of Irish immigrants in the 1840s following the Irish famine in 1846. In the second wave French Canadian immigrants began arriving in Holyoke shortly after the 1857 economic crisis (the ‘Panic of 1857’) and continued with a larger influx in the 1870s following another series of economic crises (e.g. the ‘Panic of 1873’). The third wave of immigration during the study period was that of Eastern Europeans (largely Polish speakers), who began entering the community in the 1880s.Footnote 11 Newly arriving migrants throughout the period were disproportionately young and healthy but perhaps new to the urban experience and more susceptible to the infectious disease environment of nineteenth-century cities and may also have had fewer economic resources. Established migrants came to resemble the native-born in terms of wealth accumulation and population composition. As time passed, new immigrants were also a smaller proportion of the population. The population subsequently aged and population growth slowed, even as clean water and functioning sewers reached more areas. Mortality at last began to decline, with a shift from infectious to chronic degenerative diseases.
2. THE COMPLEXITY OF LOCALLY SITUATED MORTALITY TRANSITIONS
In the United States overall, sustained mortality decline began in the 1870s. Dramatic changes followed quickly. Overall life expectancy improved from 47 to 51.5 years between 1880 and 1900 as the infant mortality rate fell from about 225 deaths per 1,000 live births in 1880 to 114 in 1910.Footnote 12 Urban mortality decline played a central role in this transition. Maris Vinovskis noted both the sharply higher mortality of emerging urban–industrial communities of Massachusetts,Footnote 13 and significant early mortality declines in regions mostly confined to the largest established cities (e.g. Boston and Salem, which contained only a fraction of the Massachusetts population).Footnote 14 Size of place also had a pervasive influence on turn-of-the-century mortality in Samuel H. Preston and Michael R. Haines's 1991 analysis. Mortality was elevated by 20 per cent in US cities with 5,000–24,999 inhabitants and by 30 per cent in larger cities of 25,000 inhabitants or more, compared with smaller cities. At the same time, mortality was actually lower among the very largest cities such as New York, Boston and Philadelphia.Footnote 15 In addition, urban mortality change had profoundly different impacts upon different age groups,Footnote 16 sex-specific age groupsFootnote 17 and immigrant groups.Footnote 18
The relationship between wealth and mortality has been one of the more difficult to address historically. However, recent research on nineteenth-century mortality and the importance of standards of living to the mortality transition has clarified some of the effects of family wealth, and the complex interactions of proximate mortality determinants.Footnote 19 Perhaps the greatest strides in understanding mortality change have been in documenting patterns of infant and childhood mortality among different populations. The resurgence of interest in explanations of infant mortality produced a number of landmark studies in the United StatesFootnote 20 some examining specific trends in urban areas.Footnote 21 Parallel studies were also conducted using Canadian and European data.Footnote 22 A key issue in many of these studies was estimating associations between household/family, socio-economic and public health variables and rates of infant or childhood mortality. Preston and Haines provided a comprehensive study of cross-regional variation in US childhood mortality at the turn of the century, and made a compelling argument against nutrition and socio-economic status, or ‘class’, as major childhood mortality determinants in the United States prior to the early 1900s.Footnote 23 However, by the first decades of the twentieth century, wages and other socio-economic variables do seem to account for significant variation in childhood mortality in some US cities.Footnote 24 Studies of aggregate data have been less clear in support for the import of public health initiatives,Footnote 25 or find socio-economic status generally more significant.Footnote 26 Studies of specific localities and/or the use of localised health intervention data have proved more successful in isolating the role of specific improvements in general public health measures on age- and cause-specific mortality.Footnote 27
We also have a clearer picture of the effects of socio-economic status on late-nineteenth and early-twentieth-century adult mortality.Footnote 28 A number of studies have documented the importance of sharply changing age-specific or sex–age-specific differentials.Footnote 29 Sex- and age-specific changes, including collinear socio-economic mortality differentials, reflect new regimes of occupational exposure, rising rates of degenerative diseases, and the possibility of emerging ecologies which may increase the risk of contracting certain infectious diseases as others decline.Footnote 30 Gretchen A. Condran and Eileen Crimmins-Gardner, for example, noted a greater contribution of airborne diseases to adult mortality, and waterborne diseases to infant mortality,Footnote 31 while Condran et al. demonstrated the resulting differential impact of public health improvements on adult and infant mortality.Footnote 32 Joseph Ferrie argued for the potential importance of socio-economic effects specifically on adult mortality based upon antebellum cross-sectional associations between wealth and mortality.Footnote 33 Heterogeneities in the response of working-age individuals can be expected during health transitions, including a shift to mortality at older ages, a rising incidence of degenerative diseases, increased relative male mortality, and even overall increases in the rates of adult mortality.Footnote 34
Previous research has contributed to a growing recognition that the complexity of health and wealth relationships requires further fine-grained analyses in which associations uncovered in national- or regional-level data can be more sensitively measured and understood in specific disease environments.Footnote 35 Some individual-level and small-area studies suggest that standard of living may have effects only in the worst health environments,Footnote 36 with others suggesting the effects of wealth may be overwhelmed, or less pronounced, in the face of high infectious mortality.Footnote 37 Longitudinal studies of the effects of wealth on mortality are further complicated by changes in population and disease environments due to natural increase and migration.
Efforts to understand the relationships of wealth and health in the United States are hampered because the census stopped collecting wealth data during the critical years of the nineteenth-century mortality transition, resulting in what has been called the ‘dark ages of American inequality’.Footnote 38 Research using regionally or locally specific wealth information has begun to fill the gap in our understanding of the relationship between wealth and health during this period. In Massachusetts, for example, Henry F. Bedford's study of reports from the Massachusetts Bureau of Statistics of Labor provides a general picture of the conditions of the working poor from 1870 to 1900,Footnote 39 while David Wagner's study of Tewksbury ‘Almshouse’ inmate biographies offers a more nuanced biographical and longitudinal view of ordinary people falling into and rising out of poverty from 1865 to 1895.Footnote 40 Nevertheless, few studies link specific individual wealth assessments in Massachusetts to individual mortality during this critical period, or assess these relationships in the context of urban–industrial growth and immigration.
3. THE EMERGENT INDUSTRIAL CITIES OF NORTHAMPTON AND HOLYOKE
The mill towns of Northampton and Holyoke changed dramatically between 1850 and 1910 due to industrial growth.Footnote 41 Northampton's population quadrupled during this period, from 5,278 in 1850 to 19,431 in 1910, as this county seat made the transition from a rural market economy to a robust mix of industry, agriculture, commerce and government.Footnote 42 Northampton's infrastructure developed slowly, with severe housing shortages and lack of public works contributing to poor public health conditions. There were a small number of industrial mills of moderate size in Northampton, which in 1855 employed only 10 per cent of the labour force in the valley.Footnote 43 A number of these firms were destroyed by a major flood in 1874 and many of the larger firms moved to nearby Holyoke.Footnote 44 Although Northampton never recovered to emerge as a major industrial centre, moderate-sized wood, metal, textile and other manufacturing firms contributed to its diverse economy, and it was incorporated as a city in 1884.
Over the same period, Holyoke residents experienced similar conditions, yet on a much larger scale. Holyoke's population grew far more rapidly, from 3,249 in 1850 to 59,732 in 1910, and the town was incorporated as a city in 1873.Footnote 45 As in Northampton, Holyoke's economic opportunity was the driving force underlying this growth, but its industrial emergence followed a more deliberate and singular path. Unlike Northampton, Holyoke was planned by the Boston Associates, a group of New England capitalists. Earlier ventures in Waltham, Massachusetts and along the length of the Merrimack River proved lucrative, and with the natural resources of the Connecticut River, Holyoke held even greater potential as an industrial mill town. The cotton textile industry became Holyoke's first principal industry as a result, serving as a catalyst for its exploding immigrant population.
Despite differences in development, the demographic histories of these two cities ran on parallel courses in many respects. Strains of urban growth and resulting high mortality environments were ameliorated only by infrastructural development and the later slowing of population increase.Footnote 46
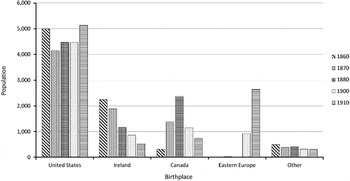
As Figure 1 shows, waves of immigration were transnational in scale and affected the composition of the two cities similarly over time, as apparent in our selected sample of the most urban residents.Footnote 47 Moreover, the constant influx of poor immigrant labourers fuelled by these transnational population movements sustained remarkable levels of inequality in the two developing urban–industrial areas. Crude death rates early in the 1850s in Holyoke were between 5 and 10 deaths per 1,000 inhabitants; they rose to a peak of nearly 35 per 1,000 in 1872, fell to about 25 per 1,000 in the 1880s, and ended the period at around 17 per 1,000. Northampton had higher mortality initially – 15 deaths per 1,000 inhabitants – with peaks around 35 per 1,000 in the mid-1860s and mid-1870s, rates then fluctuating between 15 and 22 per 1,000, and with slightly rising mortality at the end of the period. As would be expected in a pre-transition population, crude mortality was driven by deaths among infants and young children, although estimates of mortality for infants from our census-linked data are somewhat unreliable due to the impossibility of linking very young children who died before the census was taken. However, both cities exhibited the expected J-shaped age-specific mortality profile throughout the study period. Over time, mortality rates for the elderly rose, and there was some mitigation of mortality for infants and young children after the 1870s. Among all deaths (not just those linked to census records), consumption, and later phthisis and tuberculosis, were the leading causes of death among adults in all decades, with dysentery, typhoid fever and pneumonia being the next most common causes. By the 1900s, the five most frequent causes of adult death included heart disease and apoplexy, with chronic nephritis becoming a leading cause of death in the 1910s. Among children, dysentery, cholera infantum or gastroenteritis was the leading cause of death in all decades, followed in the 1870s by smallpox, scarlet fever, croup and whooping cough. Beginning in the 1880s, pneumonia and meningitis were also among the five most frequent causes of child death. We expect that relationships between immigration, family wealth and mortality might be more readily discerned in such settings than on a national/regional scale or within urban centres such as New York, Philadelphia or Chicago. At the same time, rapid growth and immigration, the very conditions that created stressful environments, present challenges to the identification of wealth effects.
Population by place of birth, Northampton and Holyoke sample, 1860–1910.

4. DATA SOURCES
Our data are drawn from an existing individual-level database constructed by computerised linkage of sampled census records from each of the two cities in our study between 1850 and 1910 to corresponding death records from the two years following each census.Footnote 48 These linked records were then supplemented through a further linkage to tax valuation records. Our wealth analyses required demographic information, such as age, gender, occupation and nativity, which was not available in the tax records alone and necessitated a population sample of all individuals, not only those holding wealth. The US censuses, first conducted in 1790, were decennial surveys of the US population, which consisted of ‘schedules’, or questionnaires, that recorded individual respondents' answers to questions asked by census enumerators. Earlier schedules were primarily concerned with simple head counts, for example, the 1800 schedules asked for the name of the head of household, the number of free white males and females in age groups, and number of slaves owned. By 1850, the schedules gathered more than simple head counts, with questions asking for the names of every individual in the household, and their age, sex, race, occupation, the value of real estate, birthplace and literacy. The census schedules changed throughout this period, reflecting the nation's changing needs and interests in understanding its population.Footnote 49
In order to examine the relationship of taxed wealth to wealth as recorded in the census, and the effect of accumulated economic resources on the risk of death from the mid-nineteenth century through to the turn of the twentieth century, we linked tax valuation records to population census records. Wealth information is available from the census for the decades 1850, 1860 and 1870 and from city tax records for the decades from 1860 to 1910. The census merely recorded a total dollar amount for individuals of real estate in 1850, 1860 and 1870 and personal estate in 1860 and 1870. As Richard Steckel and Carolyn Moehling note, at the beginning of the nineteenth century:
All real and personal property not specially exempted was subject to taxation. Real estate included land and buildings, and personal estate included goods, chattels, money and effects (whatever they were); ships; money at interest; public stocks and securities; stocks in turnpikes, bridges, and moneyed corporations, in or out of state. Property exempted from taxation included household furniture not exceeding $1000 in value, wearing apparel, farm utensils, and mechanics' tools up to the value of $300.Footnote 50
The overlap from 1860 to 1870 in wealth information from census and tax records allowed us to examine the relationship of taxed wealth with wealth as recorded on the census.Footnote 51
The linkage procedure employed a nominal matching strategy similar to, but more limited than, that used in the Saguenay project which used computerised record linkage to examine all possible criteria for linking individuals to each other in a family reconstitution of over 600,000 parish records from the Saguenay region of Quebec.Footnote 52 To link individuals to wealth records we took a more conservative approach, using a subset of possible linkage criteria considered most reliable and more limited efforts to resolve ambiguous linkages by stopping after implementing 12–15 sets of criteria developed from name, age and wealth and applied in a multiple-pass linkage algorithm similar to that developed by Charles Harvey, Edmund Green and Penelope Corfield.Footnote 53 Higher likelihood linkage criteria required more demanding matches, for example, exact literal matches of first, middle and last names. The fewer the matches between census and tax records, the greater the likelihood that our linkage procedure produced a true match. Given the relatively small numbers of linked records in the database and the interactive linkage process, all were manually examined to some extent. The interactive and manually confirmed linkage process ensured the maximum quality of the record-linkage results.Footnote 54 After linkage, the data file contains 50,137 linked census, death and tax records for Northampton and Holyoke. Linkage rates varied across decades and although there is no precise method for computing the number of links one would expect in the database, examination by town and decade gave us no reason to expect bias. The percentage of successfully linked tax records in each decade appears to be in the 80–95 per cent range.Footnote 55
5. ANALYSIS AND COMPARISON OF WEALTH SOURCES
Population and mortality data are relatively easy to come by for nineteenth-century settings compared with data on wealth. The issue of measuring inequality in relation to health and mortality also depends upon the types of socio-economic measures used and their reliability. The most widely used data on socio-economic status have been income-based measures. One of the limitations of using income data exclusively is its inability to provide a more comprehensive picture of total wealth holdings. Most studies on infant and childhood mortality correlates have attempted to avoid this limitation by relying on aggregate measures of census wealth within families. Census family wealth does provide a more comprehensive measure of socio-economic status than income, but affords a limited period of coverage.Footnote 56 As Steckel suggested, tax assessment lists are another source for measuring wealth in local settings and can be found in tax valuation records.Footnote 57 Steckel's data for Massachusetts show a significant overall correlation between wealth measures derived from tax assessments and those based on reported census wealth, as well as rising inequality within urban areas and the growing importance of real estate wealth.Footnote 58 In addition to longitudinal coverage, tax records also distinguish various types of wealth holding. Moreover, the reporting of taxable wealth was generally compulsory while the reporting of wealth in the census was voluntary and subject to arbitrary enumerator distinctions. Our data for Northampton and Holyoke, Massachusetts, confirm this general correlation across sources of wealth data for the years 1860 and 1870, when both data sources are reliably available. There are also clear differences important for mortality analysis in the distribution of family wealth from the two different sources. Family wealth in our analyses is the sum of individually reported wealth aggregated across families as defined by the census and identified by the enumerator, often called ‘census families’ and roughly analogous to households. The term ‘family wealth’ reflects the real and personal resources of the co-resident household.
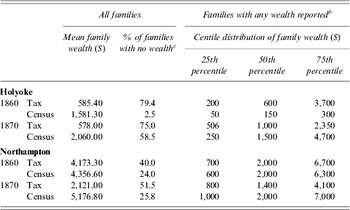
One of the more important discrepancies between tax and census assessments, demonstrated in Table 1, is the under-reporting of family wealth in the tax assessments. It was not uncommon for tax assessments to under-report and exempt small amounts of wealth. Census records appear to report small amounts of personal wealth inconsistently, and may over-report such wealth relative to tax records. For example, the 1860 and 1870 Holyoke censuses recorded $50 of personal wealth for a large number of individuals, resulting in families with multiples of $50. It is clear from the census records that enumerators entered this rate consistently – perhaps even automatically – for large residential groups in poorer areas of the town. As a result, it is unclear in substantive terms what distinguished those households or individuals with this small but not trivial amount of wealth. By any reasonable standard of living measure, such as size and geographic location of dwelling, family structure, or occupation, households with small amounts of wealth are indistinguishable from households without wealth. Table 1 presents, for 1860 and 1870, tax assessments and census-recorded wealth, the mean amount of wealth for all families, the percentage of families with no wealth, and for families with any wealth, the dollar amounts of wealth at each quartile.
Distributions of family wealth holdinga in current US dollars from tax assessments and census records, Holyoke and Northampton, 1860 and 1870

a Family wealth holdings are the sum of individually reported wealth in census ‘families’ (analogous to households).
b Wealth greater than zero reported for any family member in the relevant source.
c Wealth not reported for any family member in the relevant source.
Since we are primarily interested in either the longer-term effects of significant wealth or the effects of more substantial resource mobilisation that wealth may have afforded in the face of acute health needs, one simple solution to measurement inconsistency is to rely upon a measure that does not draw fine distinctions at the lower end of wealth distributions. For this purpose, we constructed a dichotomy of ‘significant wealth holding’. Families with significant wealth are in the upper three quartiles of the wealth distribution among those with any wealth. Families without significant wealth are in the lowest quartile or had no recorded wealth. Referring to Table 1, Holyoke families without significant tax wealth are those with less than 200 dollars reported in the tax assessment of 1860, aggregated across family members, and families without significant census wealth are those with less than 50 dollars reported in the census of 1860, again aggregated across family members. Although this measure is less sensitive to reporting discrepancies than the simple presence or absence of wealth, it is still somewhat affected by the heaping of wealth-reporting categories, and thus different numbers of individuals end up in lower quartiles as a result of different heaping. Nonetheless, this measure appears robust enough for the analyses we present. The general caution remains that fine distinctions between wealth-holding categories are likely to be plagued by measurement errors and inconsistency across different resources when using historical records. Ideally, analytical distinctions of wealth holding should not be highly sensitive to such minor discrepancies which are likely, at the same time, to affect classification or analysis of a very large, poor segment of the population.
6. MORTALITY BY WEALTH AND IMMIGRANT ETHNICITY IN NORTHAMPTON AND HOLYOKE
The following analyses first examine the correlation of family wealth holding and cause-specific mortality for Northampton and Holyoke in 1860 and 1880 in some detail, and then proceed to a multivariate modelling of wealth effects across all decades from 1860 to 1910. The comparison of 1860 to 1880 provides both a stable geographic base for comparison, as the urban sample area does not significantly change over this period,Footnote 59 and a chance to examine wealth and immigration effects reaching beyond the last collection of census data on wealth in 1870.Footnote 60 To examine wealth and mortality across these periods we compare the mortality rate of those with significant wealth holdings with the mortality rate for those without. To control for the confounding influence of changes or differences in the age distribution from 1860 to 1880, we directly standardised the mortality rates of 1860 and 1880 to the 1870 census age distribution.Footnote 61 Given the extreme fluidity of our study population, we focus our analysis on age-specific mortality rates for adults and children.Footnote 62 Finally, to afford the largest and most robust sample size possible, the two town populations are pooled for the computation of these standardised rates.
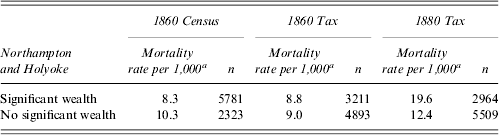
Mortality in 1860 was higher for those without significant family wealth holdings and lower for those with greater, with very similar mortality findings between census and tax assessment wealth, as shown in Table 2. However, by 1880, when only tax assessment data are available, lower mortality occurred among those with no significant family wealth, contrary to hypothesised effects of urban inequality and wealth. This reversal of fortunes may be rooted in the dynamic and changing nature of these emergent communities over the course of the transition, central to hypothesised immigration effects. The age-standardised analysis in Table 2 ignores changing population composition through immigration and aggregates distinct ethnic categories that radically changed in proportion and composition over the period of analysis.
Age-standardised mortality rates per 1,000 population for those with significant census wealth in 1860 and those with significant tax wealth in 1860 and 1880, Holyoke and Northampton combined
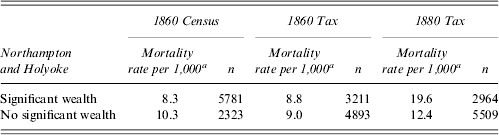
a Mortality rates were calculated for 1860–1861 and 1880–1881. Mortality rates were calculated using deaths occurring during the year following each census, beginning in June and ending in May (e.g. 1 June 1860–31 May 1861), and population counts from censuses taken as of 1 June in both 1860 and 1880. Families with significant wealth are in the upper three quartiles of the wealth distribution among those with any wealth. Families without significant wealth are in the lowest quartile or had no recorded wealth.
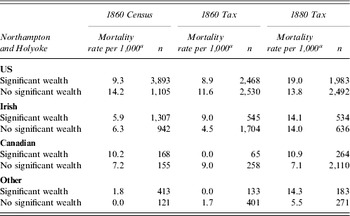
Comparisons of age-standardised mortality rates for US-born, Irish, Canadians and other foreign-born presented in Table 3 show that lower mortality among those with resources in 1860 seen in Table 2 is largely due to the US native population.Footnote 63 The Irish-born in 1860 had lower overall age-standardised mortality rates than the US native population regardless of wealth holding. This surprising effect probably represents migration and ‘healthy worker’ selection effects. Such effects might be consistent with taxable wealth differences in mortality reported for 1860, since newly arrived immigrants would be less likely to have significant wealth holdings than the US-born. Nevertheless, Irish mortality results in 1860 are also clearly affected by reporting differences between the census and tax assessments. Mortality comparisons in 1870 are compounded by both changes in the immigration stream and epidemic mortality events, and so are not included in Table 3. However, by 1880, when Irish immigration had declined significantly, mortality among that group had risen considerably and differences by wealth had disappeared. Again, the rising mortality and decline in differential mortality by wealth could reflect the loss of selection advantages in the now relatively stable residential population of Irish immigrants.
Age-standardised mortality rates per 1,000 population by significant family census wealth in 1860 and significant tax wealth in 1860 and 1880, for selected ethnic groups, Holyoke and Northampton combined
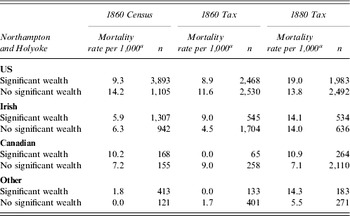
a Mortality rates were calculated for 1860–1861 and 1880–1881. Mortality rates were calculated using deaths occurring during the year following each census, beginning in June and ending in May (e.g. 1 June 1860–31 May 1861), and population counts from censuses taken as of 1 June in both 1860 and 1880.
French Canadians were not an appreciable segment of the cities' populations in 1860. This situation changed radically by 1880 when French Canadians comprised nearly one-quarter of the population. Despite well-documented higher infant mortality,Footnote 64 French Canadians in our sample who did not report significant wealth nevertheless had lower mortality than the Irish or native-born. The dramatic growth and lower mortality of this group were the major reasons for lower mortality among those without wealth in the aggregated 1880 rates seen in Table 2. Again, lower mortality among the French Canadian population might well reflect more recent arrival of healthy migrants.
Differential mortality levels, especially the much lower than expected French Canadian mortality and the rapid decline in any mortality advantage among Irish immigrants, are consistent with the different immigration patterns of these two groups. French Canadians began arriving following the economic crisis of 1857. Mill agents travelled to Quebec recruiting workers, most of whom were young, single women. It was assumed that most of the workers would be temporary or seasonal labourers, and this was also the intent of many of the migrants. Those hired in this first migration phase of direct recruitment had year-long contracts.Footnote 65 Whether they actually returned to Canada after their contracts ended or simply remitted their earnings is unclear but, as Claude Bélanger notes, ‘As Eastern North America's railroad became more complex and affordable, immigrating to the United States became simpler and cheaper. Indeed, while in 1840 a trip from Montreal to Vermont would have taken several arduous and expensive days in a cart, by the 1880s it would only be a question of a few dollars and hours.’Footnote 66 The gamble was not a difficult one to make given the prevailing conditions of poverty in Quebec, and inexpensive transportation also made the decision to relocate easier for families. If their situation in the United States turned for the worse, returning to Canada was not that difficult. As with Irish immigrants, we cannot know the migration history, but French Canadians most likely came directly from rural areas of Quebec to Holyoke and Northampton.Footnote 67 In contrast, the Irish transatlantic migration was more permanent from the outset, was probably not a migration directly to this area, and in some cases was a more inclusive family migration.
Immigration and selection effects might also explain the trends in age-standardised mortality and wealth among the US native population. Virtually everyone in Holyoke in 1860 was a recent arrival, and given the rapid growth during this period, the same situation was true to a lesser degree in Northampton. During this decade, wealth appears to have had some advantage and mortality was lower compared with later decades. By 1880, there was continuing, but much diminished, native migration into the cities. Age-standardised mortality rose considerably for all groups, consistent with a declining selection effect. Those without wealth gained a relative mortality advantage, with both low wealth and low mortality consistent with newly arrived migrants. Only the Irish, with much curtailed immigration, had increases in age-standardised mortality irrespective of wealth.
7. MODELLING IMMIGRATION SELECTION AND WEALTH EFFECTS ON MORTALITY
To further examine the suggestion of immigration and wealth effects on the mortality plateau, we analysed the probability of death for adults and children separately through logit regression of recorded death on individual-level characteristics across the entire period of 1860–1910. Wealth in current dollars is directly entered into the regressions in the form of taxable personal wealth and taxable real estate wealth from the linked tax records. Distinguishing real estate wealth from personal wealth was considered of potential importance given our initial findings suggesting an interaction between wealth and recency of immigration. Real estate wealth may likely be more reflective of wealth holdings among a more established population.Footnote 68
Although we can readily estimate the effect of place of birth, which is available across this period, our analysis thus far suggests those estimates would confound selection effects from recently arriving immigrants with effects of later periods when the same immigrant group was a more stable residential population. Data on the year of immigration are not consistently available across this period of time in US censuses, making it impossible to directly estimate selection effects among immigrants. After examining ethnicity-by-decade interactions, we created a dummy variable for each immigrant group, indicating whether the individual was born in Ireland, Canada or an Eastern European country, and resided in the city during a decade prior to the decline in immigration from those areas (1860, 1880 and 1910, respectively). These variables are thus nested ethnicity effects within decades where the immigrant group was a newly arriving population. Decades are entered into the models as dummy variables with 1860 as the excluded category. Although these models are limited because they do not directly operationalise the timing of individual arrival, model results should be consistent with predictions from the hypothesised wealth and immigration selection effects. Models were fitted separately for adults, defined as being 15 years of age or greater, and children, taken as those less than or equal to 14 years of age, as well as for each city. Several other effects potentially related to ethnic group and mortality, including gender and dwelling density, were examined but not included due to lack of significance.
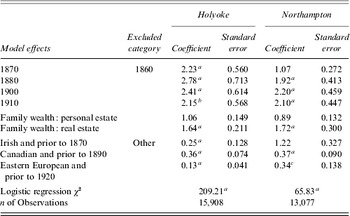
Results for adults are presented in Table 4. The odds ratios for decade effects confirm what we know of the mortality rise and plateau in these developing urban industrial centres. In both cities, mortality was higher in all decades than in the early period and peaked during the most expansive decades of population growth. Any slight indication of mortality decline is early in the twentieth century. Total family wealth from personal estate is not significant, yet total family real estate wealth is associated with higher mortality in both Northampton and Holyoke. In Holyoke, mortality rates for the newly arrived immigrants in all three waves of immigration are significantly below the rest of the population. In Northampton, this is true for all but the Irish, who were a much smaller group in that city and who did not arrive in the force that they did in the organised mill town of Holyoke.
Logistic regression odds ratios of individual mortality effects for adults 15 years of age or older, Holyoke and Northampton, 1860–1910
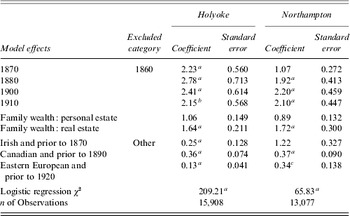
Significance levels presented are selected to reflect significant cut-off points of the models, e.g. there are no results significant at 0.01 that are not significant with an even more conservative significance probability cut-off. ap < 0.001, bp < 0.005, cp < 0.05.
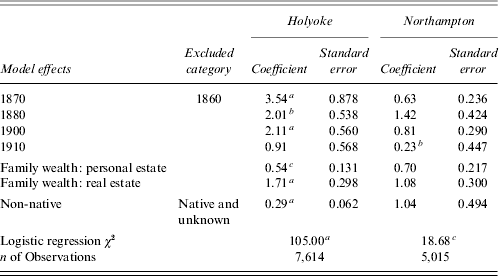
Table 5 presents results for children 14 years of age or less. Since most children, even of immigrants, were native born, all non-native children have been combined into a single category. No nesting within time is required to capture healthy migration selection effects among the non-native born because they all arrived relatively recently. Children as a group had a much more homogeneous mortality experience, as might be expected, particularly in the smaller city of Northampton. In Holyoke, child mortality was higher in all decades between the initial period of settlement and the eventual decline during the last decade. Child mortality was especially high in the 1870s, revealing the devastating toll of epidemic mortality on Holyoke's children during this period. In contrast, for Northampton only the lower mortality in the 1910 panel is significant. The cities also differ in the effects of parental wealth and immigration on child mortality. There is modest evidence that personal wealth might have purchased lower mortality among children in Holyoke. Similar to the effect for adults, having parents with real estate wealth conveyed a mortality penalty. Non-native immigrant children in Holyoke seem to reflect a selection effect quite similar to the adult population. For Northampton, neither wealth nor nativity effects explain any difference in child mortality.
Logistic regression odds ratios of individual mortality effects for children 14 years of age or younger, Holyoke and Northampton, 1860–1910
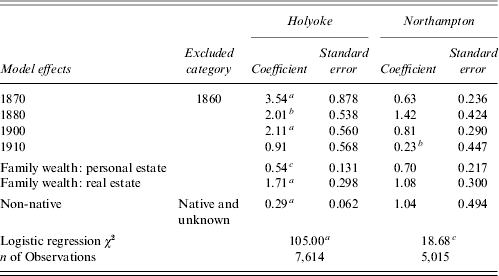
Significance levels presented are selected to reflect significant cut-off points of the models, e.g. there are no results significant at 0.01 that are not significant with an even more conservative significance probability cut-off. ap < 0.001, bp < 0.005, cp < 0.05.
After an extensive investigation of alternative model specifications, we believe that the model results presented in this paper accurately capture a complex relationship between mortality, wealth and immigration in western Massachusetts. The final models presented resulted from collaborative discussion of initial findings, which did not include time and ethnicity interactions, at an International Union for the Scientific Study of Population (IUSSP) seminar at the University of Utah and a presentation at the Minnesota Population Center. Robust estimates were obtained only through controlling for ethnic group and time interactions, which led to the models presented here. A variety of individual-level measures are not included in these regressions due to lack of significance, lack of relationship to hypotheses tested and/or concern for possible collinearity. Inclusion of any of these effects did not, however, substantially alter the estimated effects presented. Variables excluded from the results notably include census family size, a classification of occupational groups into agricultural, professional, trade and transportation, and a number of the interaction terms explored. Although the models are stratified by age, lower adult ages within newly arriving immigrant groups did affect the magnitude of wealth in these groups and could plausibly affect the results through selection biases. To examine this possibility, all interactions of age, ethnicity and wealth were tested in the models. The only statistically significant result was for an age-by-Irish interaction on mortality. While statistically significant, the result was substantively trivial, did not interact with wealth or alter the wealth effects presented and was omitted from the model. Concern over the substantial skew in census family size due to the inclusion of boarders, lodgers, servants and others in their definition of family was also addressed by fitting these models to a subsample with census family size of less than 14 family members. Eliminating larger census families had only minor effects on the magnitude of wealth effects and did not alter their statistical significance. Various non-linear transformations of wealth were also explored before deciding to dichotomise wealth. Because of the extreme skew in wealth for this population, dichotomies are somewhat more robust and higher power logarithmic transformations were found to substantively approach the dichotomous effects presented.
8. CONCLUSION
The expectation, following most studies on socio-economic status and mortality, is that those with significant wealth holdings will typically experience lower mortality than those with insignificant or no wealth holdings. Historical as well as contemporary research shows that lower socio-economic status is associated, by and large, with greater health risks. As Ferrie notes, ‘…it seems reasonable to imagine that higher status individuals may be able to purchase better nutrition (both more calories and a greater variety of calories sources), and better housing (larger, better ventilated, farther from sanitary hazards, more thoroughly protected against rain and cold)’.Footnote 69 However, in complex local environments the simple hypothesis that family wealth and resources will lead to lower mortality is not an unconditional expectation.
Northampton and Holyoke together constitute a case study in which localised determinants of mortality and mortality decline are likely to have been salient at the same time as such relationships were being shaped by radical population growth and changes in population composition. We have shown that in years when both census and tax assessment records of family wealth are available (1860 and 1870), the general conclusions drawn from each source of wealth data are largely similar. We have also demonstrated that the family wealth effects on mortality derived from tax assessments are both reasonable and insightful. With either resource we have demonstrated the advantages of individual-level data to disentangle the often very complex relationships between family wealth and mortality during the mortality plateau and early stages of the mortality transition. We do, however, find that caution is necessary when analysing small amounts of family wealth. Important discrepancies between tax and census assessments were present at the low end of the scale and we doubt the consistency or accuracy of either data source for small amounts of wealth.
Using these resources we found further evidence of the complexity and importance of local environments in analysing the relationship between immigration, family wealth and mortality in the nineteenth and early twentieth centuries. Regardless of whether census or tax assessment wealth is used, in 1860 mortality was higher overall for those without significant family wealth holdings. During the following period of dramatic population growth and immigration, overall mortality rates changed direction and those with significant family wealth holdings experienced higher mortality. We argue that this surprising shift in mortality is due to successive waves of immigration bringing in healthy persons with lower initial mortality burdens. Mortality effects due to out-migration are difficult to directly assess given the lack of data on these groups and are, therefore, speculative. Any losses due to out-migration would inflate mortality rates for some groups while deflating them for others. Nevertheless, the effects of out-migration are likely to be small when compared with those of in-migration for these two rapidly growing industrial cities. As a result, it is difficult to develop any clear sense of shifting mortality trends due to the effects of out-migration.
The general pattern of more recently arriving immigrants having the lowest mortality, especially in more rapidly growing and industrialising Holyoke, is consistent with the hypothesised migration selection bias of healthy workers and families. Other results of our analysis also lend support to that hypothesis. The multivariate estimates of wealth effects are similar in direction to the marginal shift in age-standardised rates from lower mortality to higher mortality among those with wealth in Table 2. Higher mortality among those with real estate is consistent with the interpretation that such wealth largely differentiates between newly arrived and longer-term residents. Our findings also support recent research that suggests that such effects may not be easily discerned or especially salient in dynamic settings of urban–industrial development in the nineteenth century. Like Alice Reid's and Chulhee Lee's emphasis on the changing disease environments of such settings,Footnote 70 our analysis suggests that changing population composition and immigration patterns associated with development may have significant confounding and even ameliorating effects on the health of the poor in otherwise harsh disease environments. The single finding of significant personal wealth benefits for the children of Holyoke, however, supports those who have argued that the positive benefits of disposable wealth are likely to be found only in the most stressful circumstances and for the most vulnerable of populations.
Our findings are especially important for the rather simplistic view of emerging urban–industrial areas as environments placing satanic burdens upon the poor. Whatever those burdens might have been, they may not have been sufficient to overcome the fact that family migration favours the healthy. With the evidence at hand it is not possible for us to weigh whether the benefits of healthy immigration were greater than the collective costs to these rapidly growing communities. However, it is entirely plausible that without the constant influx of new immigrant populations mortality would have been much higher. We remain convinced that the high mortality of emergent communities such as Northampton and Holyoke, the lack of urban infrastructures and the high, often epidemic, mortality they engendered is a principle compositional feature of the overall mortality plateau in the Northeast United States. Through the dramatic growth of New England cities during this period, possible negative effects of poverty may have been hidden by a steady stream of newly arriving healthy workers and by the homogenising mortality effects of an underdeveloped health infrastructure affecting all members of the community. Those who stayed across the decades may have acquired wealth and property, but they were not selected for health. A collectively experienced mortality among those who became long-term residents declined only after the significant investment in collective health infrastructure.
ACKNOWLEDGEMENTS
This research was supported by the National Science Foundation (NSF) (grant nos. 9910755, 994572 and 0961304) and the National Institutes of Health, Eunice Kennedy Shriver National Institute of Child Health and Human Development (NICHD) (grant no. R01HD04407). Its contents are solely the responsibility of the authors and do not necessarily represent the official views of the NICHD or NSF. Both the Interuniversity Consortium for Political and Social Research (ICPSR) at the University of Michigan and the Social and Demographic Research Institute (SADRI) at the University of Massachusetts Amherst provided support. We wish to acknowledge the helpful comments of Alan Swedlund, Adrienne Fielding, the participants in the IUSSP International Seminar on Kinship and Demographic Behavior, and the anonymous reviewers of the journal.