Introduction
Microsatellites, or simple sequence repeats (SSRs), are short (1–6 bp long) tandemly arranged, repeating DNA motifs that are widely distributed throughout the genomes of eukaryotic organisms (Tautz, Reference Tautz1989; Temnykh et al., Reference Temnykh, DeClerck, Lukashova, Lipovich, Cartinhour and McCouch2001). Among the various classes of molecular markers, SSRs have a number of advantages, including co-dominance, multi-allelic behavior, abundance and dispersion across the genome, high information content, low DNA requirements for analysis, reproducibility and locus specificity (Powell et al., Reference Powell, Machray and Provan1996; Feingold et al., Reference Feingold, Lloyd, Norero, Bonierbale and Lorenzen2005). In the last decade, SSRs have become one of the most popular types of PCR-based DNA markers and have been widely applied for DNA fingerprinting, genetic diversity assessments, population and evolutionary studies, and gene mapping and cloning of many eukaryotic organisms (Pérez et al., Reference Pérez, Ortiz, Zhinaula, Gonzabay, Calderón and Volckaert2005; Weng et al., Reference Weng, Azhaguvel, Michels and Rudd2007).
In general, SSR markers are developed from genome sequences. For non-model organisms for which genome sequence information is unavailable, SSR markers are usually developed by screening large numbers of clones from genomic libraries with repetitive probes, but this process is time-consuming, laborious and expensive (Varshney et al., Reference Varshney, Thiel, Stein, Langridge and Graner2002; Feingold et al., Reference Feingold, Lloyd, Norero, Bonierbale and Lorenzen2005). However, in recent years, a number of random and targeted gene discovery programs have been initiated for a range of species, which has led to a dramatic increase in the number of expressed sequence tags (ESTs) in public and private databases (Cato et al., Reference Cato, Gardner, Kent and Richardson2001). Consequently, EST databases have become valuable resources for SSR marker development. These markers are known as EST-SSRs, or genic SSRs. EST-SSRs can be mined in silico at low cost from EST databases. Since EST-SSRs correspond to the coding regions of genes that are conserved among genomes, they have a lower level of polymorphism than genomic SSRs. However, EST-SSR markers have several advantages. Firstly, recent reports for plants and animals have indicated that EST-SSRs show a higher degree of transferability across species, and even genera, compared to genomic SSRs (Sourdille et al., Reference Sourdille, Tavaud, Charmet and Bernard2001; Weng et al., Reference Weng, Azhaguvel, Michels and Rudd2007). Secondly, due to the cross-amplification of EST-SSRs, they are ideal markers for comparative mapping. Finally, the ease with which EST-SSRs can be mapped may facilitate the identification of new genes that are linked to traits that are of particular interest (Moccia et al., Reference Moccia, Oger-Desfeux, Marais and Widmer2009). EST-SSR markers have been developed and applied in a number of plant and animal species (Thiel et al., Reference Thiel, Michalek, Varshney and Graner2003; Pérez et al., Reference Pérez, Ortiz, Zhinaula, Gonzabay, Calderón and Volckaert2005; Wang et al., Reference Wang, Li and Xiang2005; Weng et al., Reference Weng, Azhaguvel, Michels and Rudd2007).
Planthoppers commonly feed, oviposit and develop primarily on monocots, such as members of the plant family Poaceae (Denno & Roderick, Reference Denno and Roderick1990; Wilson et al., Reference Wilson, Mitter, Denno, Wilson, Denno and Perfect1994); and most of these planthopper species are economically important pests that feed directly or serve as vectors of pathogenic microorganisms and viruses to crops, resulting in significant damage and yield losses for farmers (Dupo & Barrion, Reference Dupo, Barrion, Heong and Hardy2009). Several species of planthopper feed on rice (Oryza sativa L.); among them brown planthopper Nilaparvata lugens Stål is a serious threat to rice production throughout Asia (Denno & Roderick, Reference Denno and Roderick1990). In recent decades, brown planthopper has become notorious due to the emergence of new, virulent populations that can overcome host resistance. These forms of N. lugens that can damage rice varieties bearing certain genes conferring resistance have been called ‘biotypes’ (Pathak, Reference Pathak and Pimentel1975). There are only minor morphological and chemical differences between biotypes, and they lack significant breeding barriers (Claridge & Den Hollander, Reference Claridge and Den Hollander1982). Currently, biotype determination relies on determining either the survival rate, the average amounts of honeydew produced by the brown planthopper when feeding on the rice varieties TN1, Mudgo and ASD7 (Pathak & Khush, Reference Pathak and Khush1977) or other rice varieties carrying different resistance genes. Populations or individuals that cannot infest any rice variety that carry the resistance gene Bph 1 or bph 2 are defined as biotype 1, while populations/individuals that can attack rice varieties carrying these genes are called biotypes 2 and 3, respectively. However, wide variation has been reported within each biotype, and there is a considerable overlap between biotypes with respect to virulence (Claridge & Hollander, Reference Claridge and Hollander1980; Hollander & Pathak, Reference Hollander and Pathak1981). The biological nature of the different N. lugens biotypes remains unclear.
Molecular markers are useful tools for studying the distribution of genetic diversity and understanding population genetics. Compared with phenotypic and protein markers, DNA markers have many advantages, including high levels of genetic variation and reliability (Behura, Reference Behura2006). Random amplified polymorphic DNA (RAPD) markers have been previously used in population studies of the brown planthopper (Shufran & Whalon, Reference Shufran and Whalon1995; Guan et al., Reference Guan, Fu, Wang, Lai and Zhang2004; Latif et al., Reference Latif, Soon Guan, Mohd Yusoh and Siraj2008). However, RAPD markers are no longer considered suitable for population studies because of their poor reliability and reproducibility (Black, Reference Black1993). No previous studies have examined brown planthopper populations using SSR markers, although, in addition to their utility for studying population genetics, they can also be used to examine phylogenetic relationships of closely related species with fewer loci than previously assumed (Schlötterer, Reference Schlötterer2001). The whole genome sequence is currently unavailable for the brown planthopper; and, to the best of our knowledge, no publicly accessible SSR markers have been reported for any planthopper species to date. Fortunately, however, many clusters of ESTs are available in public databases for the non-model organism N. lugens (Noda et al., Reference Noda, Kawai, Koizumi, Matsui, Zhang, Furukawa, Shimomura and Mita2008), providing an opportunity to develop EST-SSR molecular markers in this insect. In this study, we identified EST-SSR markers from the publicly available clusters of EST sequences of the brown planthopper and applied them in a genetic diversity analysis of different biotype populations. We also evaluated the transferability of identified SSRs in the related species Nilaparvata muiri China, which feeds on grass plant Leersia hexandra. Our results demonstrate that the coding regions of the brown planthopper genome contain many SSRs, which are powerful tools for assessing genetic diversity, distinguishing between biotype populations and elucidating the nature of differences between biotypes in brown planthopper.
Materials and methods
Insect populations
Insects from four N. lugens populations, designated biotypes 1, 2, 3 and Y, were maintained at the Genetics Institute, Wuhan University, on four rice varieties: TN1 (a susceptible variety) for biotype 1, Mudgo (carrying the resistance gene Bph1) for biotype 2, and ASD7 (carrying the resistance gene bph2) for biotype 3 (Claridge & Hollander, Reference Claridge and Hollander1980) and YHY15 (carrying the resistance gene Bph15) for biotype Y. Biotype Y insects were derived from biotype 1 insects, by forcing them to feed on the resistant variety YHY15 for more than two years, 33 generations, from January 2007. Samples of N. muiri were collected from Leersia hexandra plants in field and maintained on the plants. The temperature in the insectary was maintained at 25°C.
Database mining and development of SSR markers
All clusters of EST sequences of the brown planthopper were downloaded from the UNKA (BPH) EST database and are available online at http://bphest.dna.affrc.go.jp. A total of 12,303 clusters of ESTs, consisting of 8053 singletons and 4250 contigs, based on CBP clustering results, were identified (Noda et al., Reference Noda, Kawai, Koizumi, Matsui, Zhang, Furukawa, Shimomura and Mita2008). The average length of the clusters of ESTs was 626.7 bp, so in total this corresponds to a total cluster of EST length of approximately 7.7 Mb. Simple perfect SSRs were screened electronically by the SSRIT discover program (http://www.gramene.org/db/markers/ssrtool). For practical use, SSRs with mononucleotide repeats were not counted or included in the final statistics. In this program, the minimum length of the SSRs was set to 10 bp, and only SSRs with repeat units of 2–6 bp in the motif were considered. PCR primer pairs were designed using Primer 3.0 software (http://frodo.wi.mit.edu/). The major parameters for designing the primers were as follows: primer length ranging from 18 to 24 with 20 as the optimum, SSR repeat length at least 12 bp, PCR product size from 100 to 300 bp, optimum annealing temperature 55°C, and a GC content from 35% to 65%, with 50% as the optimum.
DNA extraction and genotyping
DNA was pooled from 60 female and 60 male adults of each population of N. lugens and population of N. muiri. To screen for the polymorphic SSRs, DNA pools of four different populations of N. lugens, i.e. biotypes 1, 2, 3 and Y, were used, and the DNA pool of N. muiri was used for examination of transferability of EST-SSRs. Sixteen adult females and five males were also collected to isolate the DNA from individual insects of each population of N. lugens, which were used for assessing the genetic diversity and genetic relationships between populations. The CTAB method (Tang et al., Reference Tang, Lv, Jing, Zhu and He2010) was used to extract DNA from the insects. For all PCR amplifications, we used a PTC-100 thermal cycler (MJ Research) and 10 μl reaction mixtures containing 10 ng of template DNA, 0.3 μΜ of each of the two primers, 0.2 mM deoxynucleotide triphosphates (dNTPs), 2.5 mM MgCl2, 1×PCR buffer, and 1 unit of Taq DNA polymerase (Fermentas). The PCR cycling program, in each case, was 94°C for 5 min, followed by 35 cycles of 94°C for 15 s, 55°C for 15 s, and 72°C for 30 s, with a final extension step of 72°C for 10 min.
Genotypes were detected on 6% urea-denaturing polyacrylamide sequencing gels that were run at a constant power of 60 W. PCR amplification products were detected by silver staining (Han et al., Reference Han, Teng, Hu and Song2008). Allele sizes were determined by comparing the products to pBR322 DNA/Msp I DNA size markers (Tiangen Biotech).
Data analysis
The PCR products were scored in binary format, with the presence of a band being scored as 1 and its absence as 0, thus generating a binary matrix. Jaccard's similarity coefficients for pair-wise comparisons were calculated based on the proportions of shared alleles. A similarity matrix was generated using NTSYS-PC software, version 2.1 (Rohlf, Reference Rohlf2000). The similarity coefficients were used for clustering analysis and a dendrogram was constructed using the unweighted pair-group method (UPGMA) (Sneath & Sokal, Reference Sneath and Sokal1973). To measure the goodness of fit for clustering analysis, a correlation coefficient (r) was calculated by a Mantel test between genetic similarity and the matrix upon which the clustering information was based (Mantel, Reference Mantel1967). Correlation levels were interpreted subjectively (very good fit, r≥0.9; good fit, 0.9>r≥0.8; poor fit, 0.8>r≥0.7). Analysis of molecular variance (AMOVA) was conducted by Arlequin 3.11 (Excoffier et al., Reference Excoffier, Laval and Schneider2005), and the significance of the results was examined by comparing observed distributions of genotypes among populations against null distributions obtained by 50,000 random permutations. For each locus, the number of alleles (nA), observed heterozygosity (Ho), expected heterozygosity (He) and polymorphism information content (PIC), based on 1000 bootstrapping repetitions, were calculated by PowerMarker (Liu & Muse, Reference Liu and Muse2005). A principal coordinates analysis (PCoA) of the 84 individuals based on the genotypes at 61 loci using a standardized covariance distance matrix was performed by GenAlEx 6.3 (Peakall & Smouse, Reference Peakall and Smouse2006).
Results
Frequency and distribution of different SSRs in brown planthopper ESTs
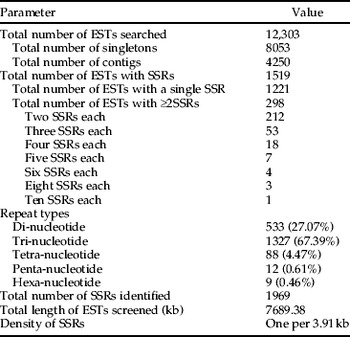
A total of 12,303 brown planthopper clusters of EST sequences were downloaded from the UNKA EST database. The distribution of simple perfect SSRs spanning 10 bp or more in these clusters of EST sequences was analyzed. As a result, a total of 1969 SSRs were detected in 1519 of the 12,303 clusters of EST sequences screened. This indicated that 12.4% of the clusters of ESTs contained SSRs, representing an average density of one SSR per 3.91 kb of cluster of EST sequence. When two SSRs were close to each other in one cluster of EST, they were counted as two separate SSRs, rather than as one compound SSR (Gupta et al., Reference Gupta, Rustgi, Sharma, Singh, Kumar and Balyan2003); such SSRs constituted 38.0% of the total identified. The frequency of the five repeat types that we identified was not evenly distributed. Trinucleotide repeats were the most abundant repeat type, accounting for 67.39% of the total, while hexanucleotide repeats were the least abundant, accounting for only 0.46% of the total. The frequency and distribution of the different EST-SSR repeat types are summarized in table 1.
Characterization of EST-SSRs in the brown planthopper genome.

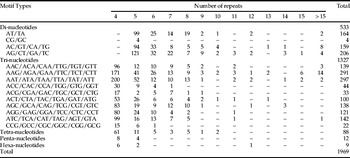
The distribution of each repeat type is shown in table 2. AT-rich SSR motifs were significantly more abundant in the EST sequences than GC-rich SSR motifs. For example, the most abundant trinucleotide motif was AAT (15.1%), closely followed by AAG (14.8%), while CCG was the least abundant motif, accounting for only 1.12% of the total. Among the dinucleotide motifs, AG was the most abundant, accounting for 10.5% of the total, while only four CG repeats were found. For all repeat classes, SSR length varied considerably, ranging from 10 to 153 bp.
Distributions of motif types in the brown planthopper EST-SSRs.

Polymorphisms detected using the EST-SSR markers among brown planthopper populations
Although the 1519 brown planthopper clusters of EST sequences contained approximately 2000 SSRs, most were not suitable for primer design. By setting the minimum repeat length of 12 bp, we found 502 SSRs contained in 482 clusters of ESTs for which we developed primers. Finally, these EST-SSR markers were used to detect polymorphisms among four brown planthopper populations of: biotype 1, biotype 2, biotype 3 and biotype Y.
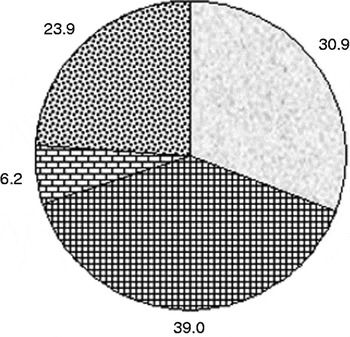
Of the 502 EST-SSR markers, 120 (23.9%) did not yield any amplification product from samples of the four brown planthopper populations; 31 (6.2%) markers produced weak amplicons and were excluded from further analysis. Three hundred and fifty-one SSR markers (69.9%) which yielded clear bands are listed in supplemental table S1, of which 155 showed polymorphism among the four populations, representing approximately 30.9% of the total EST-SSR markers (fig. 1). Therefore, amplification success was high for the EST-SSR markers in the different biotype populations feeding on O. sativa varieties. As reported in previous studies (Pérez et al., Reference Pérez, Ortiz, Zhinaula, Gonzabay, Calderón and Volckaert2005; Yu & Li, Reference Yu and Li2008; Moccia et al., Reference Moccia, Oger-Desfeux, Marais and Widmer2009), we also found that some of the amplification products were not within the expected size range. The number of SSRs for which the products were smaller and larger than expected were five and ten, respectively. The clusters of EST sequences for 351 EST-SSRs were searched against the Non-Redundant Protein Database, which was downloaded from NCBI, through BLASTX. As a result, 109 clusters of ESTs (31.1%) matched to genes of known functions at E values less than 10−3.
Pie chart showing percentages of the 502 EST-SSRs amplified among four brown planthopper populations feeding on specific rice varieties ( , polymorphism;
 , nonamplification;
 , poor amplification;
 , monomorphism).

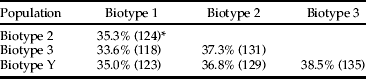
The level of polymorphism among the different biotype populations feeding on specific rice varieties was similar. For example, the degree of polymorphism in the 351 SSR markers among different populations was highest (38.5%) between biotypes 3 and Y, and lowest (33.6%) between biotypes 3 and 1 (table 3).
Polymorphism rates of the 351 EST-SSR markers among four brown planthopper populations feeding on different rice varieties.
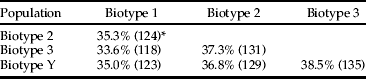
* The figure between brackets is the number of polymorphic markers between two populations. The percentage (%) represents the ratio of polymorphic markers in tested 351 EST-SSR markers between two populations.
Cross-species transferability of the EST-SSR markers
Interspecific transferability was high for the newly developed EST-SSR markers of the brown planthopper, as showed by amplifying the SSR markers in the related planthopper species N. muiri. Three hundred and twenty-four (92.3%) of the 351 EST-SSR markers successfully amplified from the pooled genomic DNA template of N. muiri, of which 100 yielded the same size bands as in N. lugens. The high rate of amplification suggests the gene sequences are well conserved between the two Nilaparvata species, and the EST-SSR markers can be used in the related planthopper species as well.
Genetic diversity and genetic relationships between brown planthopper populations
A set of 61 polymorphic SSR markers (supplemental table S1) was employed to assess the level of genetic diversity and population subdivision in the four populations of the brown planthopper. Allelic diversity, observed heterozygosity (Ho), expected heterozygosity (He) and polymorphism information content (PIC) of the biotype 1 population were significantly lower than those of biotypes 2 and Y (nA, He and PIC, P<0.001; Ho, P<0.05), and were also lower than those of biotype 3 (nA, P<0.05; PIC, P<0.001; Ho and He, P>0.05) (table 4). The numbers of detected alleles per locus in each population ranged from one to five in biotype 1, from two to nine in biotype 2, from one to seven in biotype 3 and from two to nine in biotype Y. The average number of alleles per locus for the different populations ranged from 2.3±0.1 (biotype 1) to 4.5±0.2 (biotype Y). The mean expected heterozygosity ranged from 0.345±0.029 (biotype 1) to 0.574±0.022 (biotype Y). Among the 61 EST-SSRs, there were ten and seven monomorphic markers among individuals of biotypes 1 and 3, respectively, while all markers were polymorphic among individuals of biotypes 2 and Y. Hence, genetic diversity was higher in the brown planthopper populations feeding on resistant rice varieties than in the population feeding on the susceptible rice variety. PIC values, which have greater potential to reveal allelic variation and can be preferentially used for molecular mapping or assessing genetic diversity within a population (Anderson et al., Reference Anderson, Churchill, Autrique, Tanksley and Sorrells1993), showed the same pattern. These 61 SSR markers could be used for genetic analysis of populations and for biotype determination in the brown planthopper.
Measures of genetic diversity for the four populations of brown planthopper, based on the analyses of 61 microsatellite loci.

Note: nA is the average number of alleles per locus. He and Ho are the expected and observed heterozygosity, respectively. PIC is the polymorphism information content. SD is the standard deviation. 2.5% l.b. and 97.5% u.b. are lower and upper boundaries of the 95% confidence interval based on 1000 bootstraps, respectively.
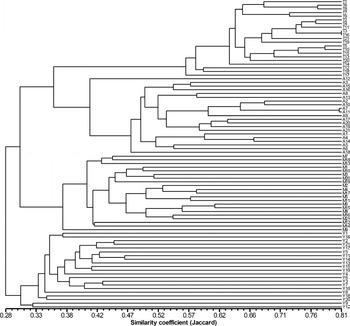
A UPGMA dendrogram was constructed based on the genotypes of the 84 individuals in the four brown planthopper populations using Jaccard's similarity coefficients. This dendrogram was supported by results of a Mantel test, which showed a significant correlation (r=0.94) between the genetic similarity matrix generated from the SSR data and the matrix from the clustering tree, suggesting the dendrogram was very reliable. We found a wide distribution of similarity coefficients among the individuals, with values ranging from 0.28 to 0.81. From the dendrogram, we identified a high similarity coefficient for biotypes 1 and 3, compared to the other two populations. Our results suggest that the individuals in biotype 1 were more similar to each other than those in the other populations. A similarity of approximately 57.0% was found among all individuals in biotype 1, whereas the difference among all individuals in biotype Y was more evident and the similarity was approximately 30.0%. Four clusters were identified in the dendrogram that corresponded to the four brown planthopper biotypes; each cluster was composed of only individuals from the same biotype (fig. 2). These results demonstrated that while genetic diversity was high within the populations, differentiation at the genome level was present among the biotypes feeding on the different host rice varieties. The EST-SSR markers provided sufficient resolution to distinguish within and among biotype populations.
UPGMA dendrogram of 84 individuals from four brown planthopper populations based on 61 EST-SSR loci. T, M, A and Y, are abbreviations for biotypes 1, 2, 3 and Y, respectively.

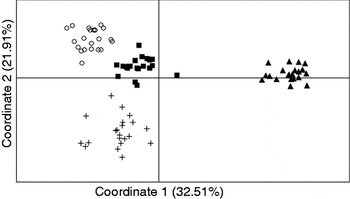
Principal coordinates analysis (PCoA) based on genotypic data at 61 loci further showed that the genetic differentiation among the brown planthopper populations was correlated with the resistance of the host rice. As shown in fig. 3, axis 1 separated biotype 1 insects, feeding on the susceptible cultivated variety TN1 from the other three populations feeding on the resistant cultivated rice varieties (Mudgo, ASD7 and YHY15) and accounted for 32.5% of total genetic variation. In contrast, axis 2 distinguished biotype Y insects, feeding on the resistant cultivated variety YHY15 and the other three populations, and accounted for 21.9% of the variation. In the four rice varieties (TN1, Mudgo, ASD7 and YHY15) on which the four biotypes of brown planthopper were reared, YHY15 (which carries the resistance gene Bph15) showed the highest resistance, followed by Mudgo (carrying the resistance gene Bph1); the resistance levels of ASD7 (carrying the resistance gene bph2) and TN1 (a susceptible variety) were very similar (data not shown). The results show that PCoA based on the EST-SSR markers distinguished the brown planthopper populations that fed on host rice varieties with different resistance levels.
Principal coordinates analysis (PCoA) plot of the 84 individuals based on genotypic information from 61 loci. Each population is represented by a different symbol (▲, biotype 1; ○, biotype 2; ▪, biotype 3; +, biotype Y).

AMOVA partitioning of the genetic variance among populations of N. lugens
Analysis of molecular variance (AMOVA) detected significant population genetic structuring at two hierarchical levels. Variance within populations accounted for 74.5% of the total variance, while among population variance contributed only 25.5% (table 5). Greater genetic variation within than among populations has been previously found in out-crossing species, e.g. an Australian marsupial (Hansen et al., Reference Hansen, Harley, Lindenmayer and Taylor2009). In addition, this analysis was supported by a global fixation index (F st=0.255) that was similar to the population-specific fixation indices (between 0.250 and 0.259 for all extant populations), suggesting that there was significant genetic differentiation among the four populations (Hartl & Clark, Reference Hartl and Clark1997).
Summary of analysis of molecular variance (AMOVA) results for 84 genotypes from four brown planthopper populations based on 61 EST-SSRs markers.

Discussion
This is the first study in which large numbers of SSR markers have been developed from clusters of EST sequences of the brown planthopper. The results demonstrate that coding regions of the brown planthopper genome contain many SSRs and that these SSR markers are useful molecular tools for genetic diversity assessments, population genetics studies and determining biotypes of N. lugens.
The frequency of SSR-ESTs (12.4%) detected in the brown planthopper in this study was much higher than frequencies reported for many other plant and animal species. For example, Kumpatla & Mukhopadhyay (Reference Kumpatla and Mukhopadhyay2005) reported frequencies of SSR-containing ESTs between 2.65% and 11.66% for 44 dicotyledonous species, while Kantety et al. (Reference Kantety, La Rota, Matthews and Sorrells2002) found proportions ranging from 1.5% to 4.7% in monocots. In animal species, reported proportions of SSR-containing ESTs vary from 1.5% in Xiphophorus (Ju et al., Reference Ju, Wells, Martinez, Hazlewood and Walter2005) through 2.2% in Fenneropenaeus chinensis (Wang et al., Reference Wang, Li and Xiang2005), 3.63% in Crassostrea gigas (Yu & Li, Reference Yu and Li2008) and 11.2% in Ictalurus punctatus (Serapion et al., Reference Serapion, Kucuktas, Feng and Liu2004). Thus, the distribution of SSRs in EST sequences appears to vary widely among investigated species, as do the parameter sets used to identify the markers. We found an SSR marker per 3.91 kb of brown planthopper cluster of EST sequence, on average, similar to the reported frequency in the pea aphid (one SSR per 3.0 kb: Weng et al., Reference Weng, Azhaguvel, Michels and Rudd2007) but substantially higher than the detected frequency in green peach aphid (one per 5.26 kb: Weng et al., Reference Weng, Azhaguvel, Michels and Rudd2007).
Trinucleotide repeats were the most abundant repeat type in the clusters of EST sequences of the brown planthopper, in accordance with findings in other species (Metzgar et al., Reference Metzgar, Bytof and Wills2000; Weng et al., Reference Weng, Azhaguvel, Michels and Rudd2007). This can be explained by the higher likelihood that triplet units, rather than non-triplet units, will be duplicated following frameshift mutations in coding regions, as a result of specific selection (Metzgar et al., Reference Metzgar, Bytof and Wills2000). AAT was the dominant trinucleotide motif in the brown planthopper EST-SSRs, again in accordance with observations in other animals, including the aphid (Weng et al., Reference Weng, Azhaguvel, Michels and Rudd2007), catfish (Serapion et al., Reference Serapion, Kucuktas, Feng and Liu2004) and a coral species (Wang et al., Reference Wang, Zhang and Matz2009). Among the dimerics, AG was more common than the other repeat types in the brown planthopper clusters of ESTs. AG is also the predominant motif among the dinucleotide repeats in the three Nasonia species (Pannebakker et al., Reference Pannebakker, Niehuis, Hedley, Gadau and Shuker2010). GC-rich SSR motifs were much less frequent in the brown planthopper ESTs (table 2). According to the sequence annotations (supplemental table S1 and data not shown), the AT-rich SSR motifs (e.g. AAT and AT) are mainly located in UTRs, especially in 3'UTRs. As a contrast, most of GC-rich SSR motifs occurred in codon-determining sequences (CDS) and 5'UTRs. Such phenomenon was quite common in a coral species (Wang et al., Reference Wang, Zhang and Matz2009) and rice (Grover et al., Reference Grover, Aishwarya and Sharma2007). This may be caused by the higher slippage rate of AAT and the possibility of such a repeat including a stretch of stop codons (Grover et al., Reference Grover, Aishwarya and Sharma2007; Wang et al., Reference Wang, Zhang and Matz2009).
The best advantage of using EST-SSR resides is the fact that they can be closely associated with genes and serve as direct markers of them. According to the function annotation information of SSR-containing clusters of ESTs for the polymorphic markers (supplemental table S1), some markers may be associated with the adaptation of brown planthopper to different rice varieties. The annotation function of BM63 was cysteine proteinase inhibitor precursor. Pechan et al. (Reference Pechan, Ye, Chang, Mitra, Lin, Davis, Williams and Luthe2000) have reported that a novel insect defense mechanism in plants is resolved in maize genotypes by induction of a cysteine proteinase, whereas the cysteine proteinase inhibitor can hold back the function of this enzyme to help brown planthopper to survive on the resistant rice varieties. The annotation of BM288 was chitin deacetylase. Most of the reported insect chitin deacetylase are mainly distributed in midgut, and these enzymes may be associated with increased absorption of nutrients (Ghormade et al., Reference Ghormade, Kulkarni, Doiphode, Rajamohanan, Deshpande and Méndez-Vilas2010) and might, thus, play an important role for brown planthopper to survive on the resistant rice plants.
Of the PCR primers designed for the 502 EST-SSR markers, approximately 70% yielded clear bands and 30.9% showed polymorphism among the four brown planthopper populations. One hundred and ninety-six EST-SSR markers (39.0%) were monomorphic among the populations, representing highly conserved coding sequences in the brown planthopper. The high rate of successful amplification and high level of polymorphism of these EST-SSR markers in the brown planthopper suggest that these markers will be very useful for future molecular studies of this non-model insect. In total, we developed 351 informative SSR markers that will be a valuable resource for future molecular genetics studies of this important insect (supplemental table S1).
The high interspecific transferability is an important feature of EST–SSRs due to the virtue of the sequence conservation of coding regions of ESTs (Yu & Li, Reference Yu and Li2008). In this study, the cross-amplification success was high in N. muiri. In addition, the amplification bands of most EST-SSR loci were the same in N. lugens and N. muiri, suggesting highly conserved transcribed sequences in two species. Thus, the newly developed EST-SSR markers of the brown planthopper should be applicable in the other economically important species of delphacid planthoppers for which the genome sequences are unavailable.
According to our findings, it may be hypothesized that the genetic diversity in the brown planthopper populations was consistent with the resistance level of the host rice varieties. In bioassays following standard procedures (Huang et al., Reference Huang, He, Shu, Li and Zhang2001), the resistance of rice variety YHY15 (carrying the resistance gene Bph15) was the highest among the four varieties, followed by Mudgo (carrying the resistance gene Bph1), ASD7 (carrying the resistance gene bph2) and then TN1 (which carries no resistance gene and is highly susceptible). The number of alleles per locus and heterozygosity are generally used to measure genetic diversity, and polymorphic information content (PIC) values are important measures of the allelic variation of markers. PIC values determined using 61 SSRs varied among the brown planthopper populations, ranging from 0 to 0.681 in biotype 1, 0.086 to 0.765 in biotype 2, 0 to 0.728 in biotype 3, and 0.130 to 0.827 in biotype Y. According to criteria proposed by Botstein et al. (Reference Botstein, White, Skolnick and Davis1980) – that the informativeness level is high when PIC>0.5, moderate when 0.5<PIC>0.25, and low when PIC<0.25 – half of the 61 markers were highly informative in biotypes 2 and Y, while within biotypes 1 and 3 PIC values was less informative; ten and seven markers were monomorphic in these biotypes, respectively (PIC=0). The heterozygosity showed the same pattern as the PIC values, i.e. it was highest in biotype Y and successively lower in biotypes 2, 3 and 1. Clearly, genetic diversity was highest in biotype Y, feeding on rice variety YHY15, which has the highest resistance level, and lowest in biotype 1, feeding on the susceptible rice variety TN1. In addition, both the UPGMA dendrogram and PCoA analysis showed that the genetic relationship between biotypes was closest between biotypes 1 and 3, and most distant between biotypes 1 and Y (figs 2 and 3). In the principal coordinates analysis (PCoA), biotype 1 (feeding on the susceptible rice variety TN1) was significantly separated from the other three populations by axis 1, whereas axis 2 distinguished biotype Y (feeding on the highly resistant variety YHY15) from the other populations (fig. 3).
A conventional view holds that population bottlenecks cause massive losses of genetic variability. However, in this experiment, the level of genetic diversity or polymorphism of the biotype Y is higher than that of the biotype 1 from which it derived. The similar case that genetic variance increased after a single severe bottleneck can be demonstrated by empirical evidence from Drosophila and housefly population, and the increase may result from conversion of balanced epistatic variance to additive variance that becomes immediately available to selection (Carson, Reference Carson1990). During the evolutionary history of virulent populations of N. lugens, it is possible that the resistance of host rice varieties exerted pressure on the original population, which in turn led to the occurrence of variants that adapted to specific rice varieties. For example, the biotype Y population was derived by forcing members of biotype 1 population to feed on the resistant variety YHY15 for 33 generations; individuals with diverse alleles appeared and were detected in the biotype Y population that were adapted to feed on the rice variety YHY15. Besides the genetic differentiation among biotype populations, which is host-resistance dependent, we observed a wide range of variation within each examined biotype population. The AMOVA and clustering analysis showed that there was a high level of genetic variation among individuals within the populations (fig. 2, table 4). The wide range of variation in the genome explains the substantial variation in virulence observed within biotypes (Claridge & Hollander, Reference Claridge and Hollander1980; Hollander & Pathak, Reference Hollander and Pathak1981). Such genomic variation should ensure that there is sufficient potential in the population to overcome rice resistance mechanisms that the insects will encounter. Nevertheless, the origin and evolution of virulent populations require further study.
Acknowledgements
This work was supported by Special Fund for Agro-scientific Research in the Public Interest of China (grant number 200803003).
Supplementary material
The online table can be viewed at http://journals.cambridge.org/ber.