Introduction
The middle ear can be anatomically and functionally subdivided into two communicating air spaces: the tympanum and the mastoid air cell system. Throughout these two spaces, the middle-ear is lined by mucosa with an embedded vascular network, which provides the metabolic requirements of the mucosa and also represents a source and sink for transmucosal gas exchange between the middle-ear and local mucosal blood.
The tympanum is essentially a single, large air cell that contains the middle-ear ossicles, which couple movements of the tympanic membrane to those of the round window. Thus, the tympanum functions as the peripheral transducer organ for hearing. In contrast, the mastoid air cell system is a multiply partitioned, cellular air space which increases middle-ear volume but does not participate directly in sound transduction. While the function of the mastoid air cell system is still debated,Reference Doyle1 numerous studies have shown that mastoid air cell volume is indirectly related to a predisposition of the middle-ear to certain pathological conditions, including cholesteatoma and otitis media.Reference Sade and Fuchs2–Reference Valtonen, Dietz, Qvarnberg and Nuutinen6 One hypothesis advanced to explain this relationship is that the mastoid air cell system functions as a middle-ear gas reserve, such that middle ears with larger mastoid air cell systems require less frequent eustachian tube openings to maintain near-ambient total pressure.Reference Doyle1
Using computed tomography (CT) scans of human middle ears with ‘normal’ mastoid air cell volume, a previous study reconstructed the geometry of the mastoid air cell system and reported a very high mastoid air cell surface area, which was a linear function of the mastoid air cell volume.Reference Park, Yoo and Lee7 The mastoid air cell surface area is directly related to the rate of gas exchange across the mastoid air cell mucosa, for both diffusion-limited and perfusion-limited models of gas exchange (assuming that blood perfusion is a function of surface area).Reference Ranade, Lambertsen and Noordergraaf8 Thus, the mastoid air cell surface area is one of the parameters that determine whether or not the mastoid air cell system functions as a middle-ear gas reserve.
The purpose of the present study was to measure the surface area and volume of the adult human mastoid air cell system, over a wide range of volumes. The study tested the hypothesis that the slope of the mathematical function relating mastoid air cell surface area to volume would be different for smaller versus larger mastoid air cell volumes.
Methods
Twenty-eight adult subjects with and without a history of childhood otitis media were recruited by advertisement.
All subjects were informed of the risks and benefits of study participation, and signed an institutionally approved informed consent form. The study protocol was approved by the institutional review board of the University of Pittsburgh.
Subjects were then screened by bilateral pneumatic otoscopy and tympanometry to document disease-free middle-ears, and by bilateral middle-ear X-ray (Schuller projection) to determine the pneumatised area for each mastoid air cell system. Pneumatised area was used as an estimate of mastoid air cell volume. Thus, the first 20 subjects whose pneumatised areas were evenly distributed within the expected range of values were selected for CT scanning (left ears, mean area ± standard deviation (SD) = 7.8 ± 4.1 cm2, range = 1.8–16.4 cm2; for right ears = 8.3 ± 4.0 cm2, range 2.7–18.0 cm2; r 2 = 0.90 for left versus right ear pneumatised areas (p < 0.01). Eight subjects had pneumatised areas similar or identical to previously enrolled subjects; according to the study protocol (which limited CT scanning to 20 subjects), these subjects were excluded from further participation.
Computed tomography scanning of the middle-ear was performed in the transverse plane at a resolution of 0.031 mm/pixel and a slice thickness of 0.63 mm, using a GE LightSpeed volume computed tomography (VCT) system (General Electric Health Care, Chalfont, UK). From each CT scan we selected a set of transverse images of both mastoid air cell systems (superior to inferior) at 0.25 cm intervals. Using Image J software (http://rsbweb.nih.gov/ij/), these images were imported and the left and right mastoid air cell systems identified, segmented out and analysed. For each image, the perimeter (in cm) and area (in cm2) of all air cells were highlighted and measured, and results summed for all images from that subject. These summed values were then multiplied by 0.25 cm (the section interval) to yield the mastoid air cell surface area (in cm2) and volume (in ml). This procedure was essentially identical to that reported previously to measure mastoid air cell surface area and volume in adult subjects with ‘normal’ mastoid air cell system volumes.Reference Park, Yoo and Lee7
All data were entered into Microsoft Excel for analysis. With the exception of the left mastoid air cell volume (p = 0.03; see comments below on outlier data), a normal distribution could not be rejected for any other variable. Parametric statistics were therefore used for analysis. Linear regression was used to determine the relationships between: (1) mastoid air cell volume and pneumatised area (from Schuller projection X-ray); (2) right and left mastoid air cell volumes; (3) right and left mastoid air cell surface areas; and (4) mastoid air cell surface area and volume. The right and left mastoid air cell volumes were highly correlated; thus, bilateral data from the same subject provided potentially redundant information. Consequently, analyses were done separately for right and left mastoid air cell systems.
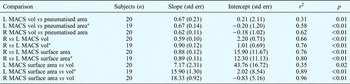
Summary parameters for these regression analyses are reported in Table I.
Statistical analysis results

Results evaluate the significance of a non-zero slope calculated by least-squares linear regression analysis for each tested relationship. r 2 calculated by square of Pearson product moment correlation coefficient; p calculated by Student's t-test; pneumatised area calculated from Schuller projection X-ray; surface area and volume calculated from CT scan. *Omitting outlier data for left ear of subject 13. Std err = standard error; L = left; R = right; MACS = mastoid air cell system; vol = volume
Data for the left mastoid air cell system of one subject (subject number 13, a 40-year-old man with no history of otitis media) represented an outlier for all relationships. Therefore, Table I presents not only separate results for the analyses of the left and right mastoid air cell systems, but also the results from an analysis of the left mastoid air cell system excluding this outlier.
Between-group comparisons were analysed using Student's t-test. Data are presented below as mean ± SD. Table I reports regression parameters and their standard errors.
Results
The study population consisted of 14 women and six men, aged 26.3 ± 6.4 years (range, 20.4–40.5). All subjects were Caucasian. Six (30 per cent) subjects reported a history of childhood otitis media (four had had tympanostomy tubes inserted).
In these 20 subjects, the left and right mastoid air cell volumes were respectively 5.5 ± 4.9 ml (range, 0.7–21.4) and 5.5 ± 3.6 ml (range, 0.7–14.1) (p = 0.96, paired Student's t-test). The left and right mastoid air cell surface areas were respectively 82.8 ± 59.8 cm2 (range, 13.3–253.7) and 88.9 ± 60.3 cm2 (range, 13.3–256.4) (p = 0.37). The ratio of surface area to volume for the left and right mastoid air cell systems was respectively 17.4 ± 4.8 cm2/ml (range, 3.2–24.4) and 16.7 ± 3.7 cm2/ml (range, 11.2–24.7) (p = 0.36).
Subjects with a history of otitis media had reduced left and right mastoid air cell volumes (left mean volume = 2.9 ± 1.6 ml, right mean volume = 3.7 ± 3.1 ml), compared to subjects with no otitis media history (left mean volume = 6.6 ± 5.5 ml, right mean volume = 6.2 ± 3.6 ml). We proposed a directional hypothesis that the mastoid air cell volume of subjects with no otitis media history would be greater than that of subjects with a positive otitis media history. Under the directional hypothesis that mastoid air cell volume is greater for ears of persons with a negative otitis media history, the between-group differences approached statistical significance (1 tailed-Student's t-test, p = 0.06 and 0.07, respectively).
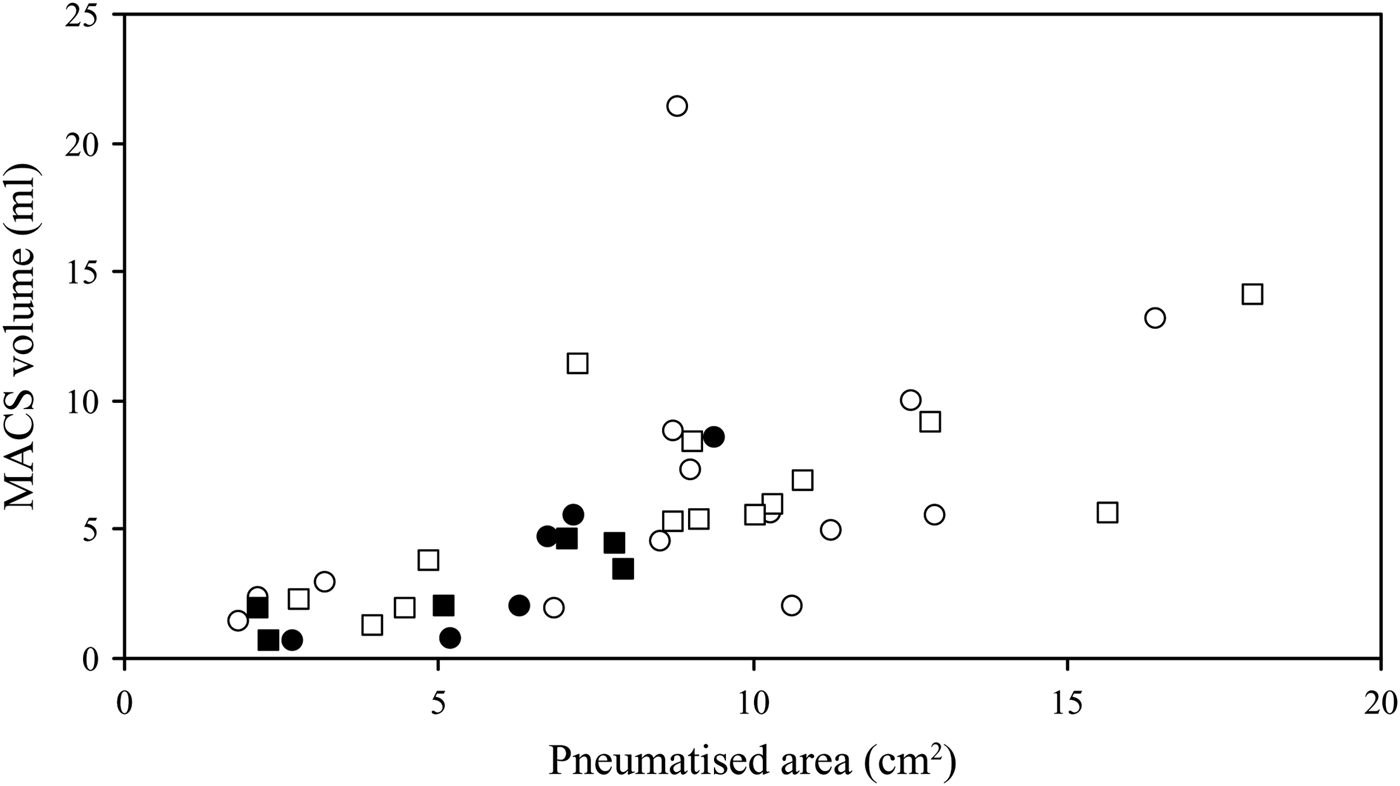
Figure 1 shows the mastoid air cell volumes of subjects with and without a history of otitis media, as a function of their mastoid air cell pneumatised area (as per Schuller projection X-ray). With the exception of a single outlier (subject number 13; left ear pneumatised area = 8.8 cm2, left ear volume = 21.4 ml), these relationships were approximately linear, with 58 and 62 per cent of left and right mastoid air cell volume variance, respectively, explained by the pneumatised area regression (see Table I). There was no apparent effect of otitis media history on these relationships.
Comparison between mastoid air cell system (MACS) pneumatised area (from Schuller projection X-ray) versus MACS volume, for all subjects' right (squares) and left (circles) ears. Filled symbols indicate ears with a history of childhood otitis media.
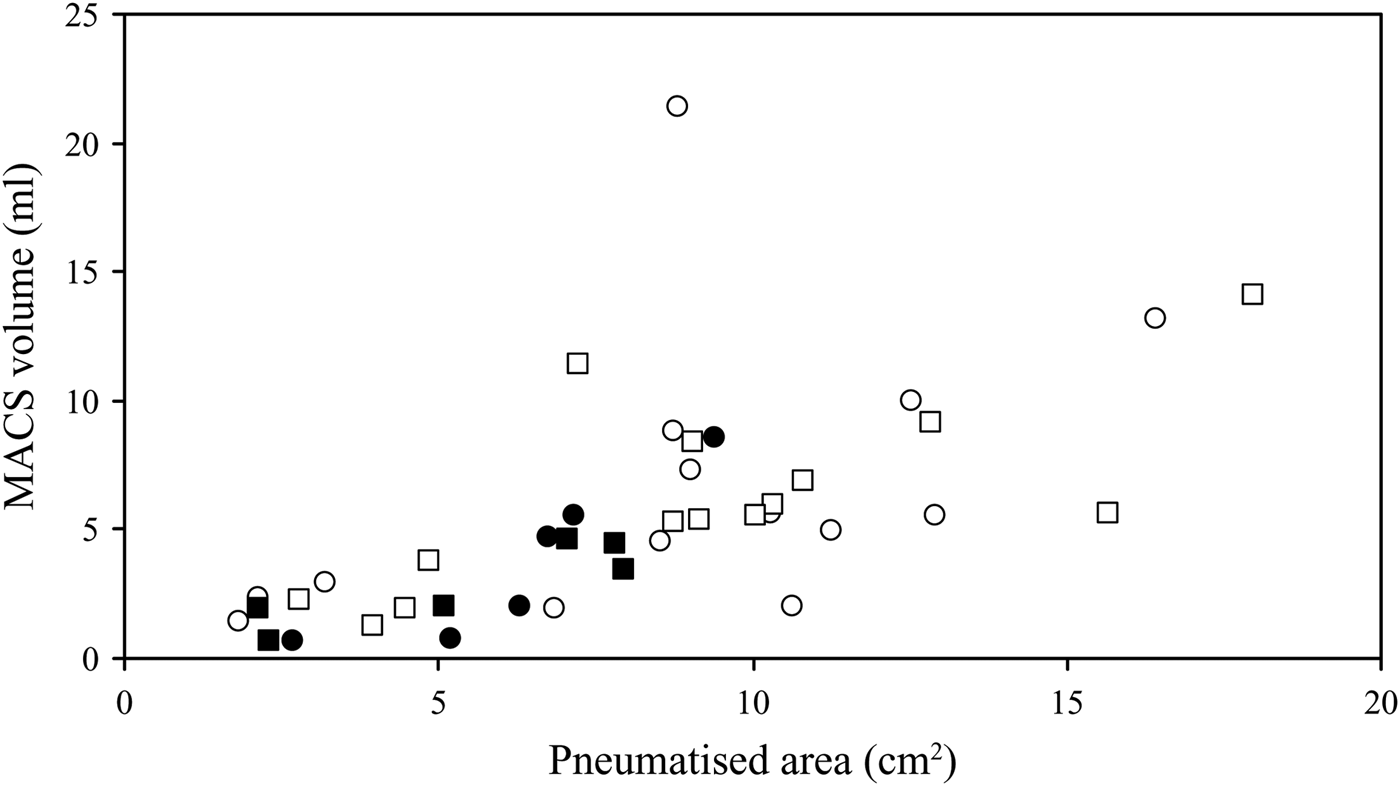
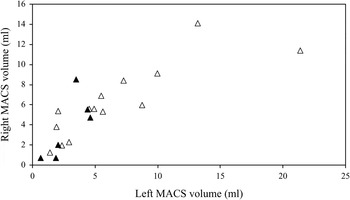
Figure 2 shows the right mastoid air cell volume of subjects with and without a history of otitis media, as a function of their respective left mastoid air cell volumes. With the exception of a single outlier (subject number 13; left ear volume = 21.4 ml, right ear volume = 11.4 ml), these relationships were linear, with 76 per cent of right mastoid air cell volume variance explained by left mastoid air cell volume regression (see Table I). There was no apparent effect of otitis media history on these relationships.
Comparison between left versus right mastoid air cell system (MACS) volumes, for ears with (filled triangles) and without (open triangles) a history of childhood otitis media.

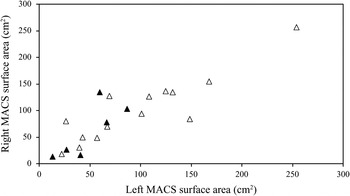
Figure 3 shows the right mastoid air cell surface area of subjects with and without a history of otitis media, as a function of their left mastoid air cell surface area. These relationships were linear, with 80 per cent of the right mastoid air cell surface area variance explained by left mastoid air cell surface area regression (see Table I). There was no apparent effect of otitis media history on these relationships.
Comparison between left versus right mastoid air cell system (MACS) surface areas, for ears with (filled triangles) and without (open triangles) a history of childhood otitis media.

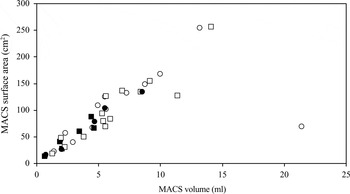
Figure 4 shows the left and right mastoid air cell surface areas as a function of their respective volumes. Again, data for the left ear of subject 13 represented an outlier (volume = 21.4 ml, surface area = 69.1 cm2). Excluding that data point, there was a linear relationship between the mastoid air cell surface area and the mastoid air cell volume, for both ears. For the left and right ears, 89 and 96 per cent of mastoid air cell surface area variance, respectively, was explained by mastoid air cell volume regression (see Table I). There was no apparent effect of otitis media history on these relationships.
Comparison between mastoid air cell system (MACS) volume versus surface area, for all subjects' right (squares) and left (circles) ears. Filled symbols indicate ears with a history of childhood otitis media.

Discussion
In this study, mastoid air cell volume was estimated from the mastoid air cell pneumatised area calculated from Schuller projection X-rays, and also from reconstructions based on CT sections. Comparison of these two measures (i.e. X-rays and CT) revealed a direct linear relationship with a high correlation coefficient (r ≈ 0.77). A similar linear relationship between these two measures was previously reported in a study of 26 normal cadaveric temporal bones (r = 0.95).Reference Colhoun, O'Neill, Francis and Hayward9 These results suggest that the mastoid air cell pneumatised area, measured by a relatively simple X-ray procedure, can be used as an estimate of mastoid air cell volume.
Numerous previous studies have shown that ears with smaller mastoid air cell volumes are more susceptible to cholesteatoma and otitis media, compared with ears with larger volumes.Reference Sade and Fuchs2–Reference Valtonen, Dietz, Qvarnberg and Nuutinen6 The present study documented reduced mastoid air cell volumes in subjects with a self-reported history of otitis media, compared with subjects without a history of otitis media; however, this difference was not statistically significant at the usually accepted level (i.e. p < 0.05). This discrepancy, between our findings and those of past studies, is probably due to the low statistical power of the current study (given the small number of subjects with a positive disease history), and to the use of group classifications based on historical information obtained from adults who may or may not accurately recall their disease history.
Our subject number 13 did not report a history of otitis media, other middle-ear disease or mastoid air cell surgery. In this patient, the relationship between the left ear mastoid air cell surface area and volume did not fit that noted for all other subjects. Visual examination of CT scans for this ear showed an abnormally high distribution of large air cells throughout the mastoid air cell system. In comparison to the other mastoid air cell systems studied, this ear's geometry was atypical, with no obvious explanation. The data for this individual mastoid air cell system were considered to be an outlier, and were thus eliminated from the various correlation calculations reported above. (However, these data were included in all graphs, and the regression analyses shown in Table I were performed with and without these data, for completeness.)
The right and left values for mastoid air cell pneumatisation (r = 0.90) and mastoid air cell volume (r = 0.87) were highly correlated. Consequently, the right and left mastoid air cell systems could not be treated as independent observations; therefore, data for the two ears were analysed separately. This bilateral symmetry suggests that expansion of mastoid air cell volume during development is highly heritable, as suggested previously,Reference Diamant10 but also that inflammatory middle-ear disease can stunt the genetically programmed growth of the mastoid air cell system, as shown by others in animal modelsReference Aoki, Esaki, Honda and Tos11 and humans.Reference Valtonen, Dietz, Qvarnberg and Nuutinen6, Reference Tos and Stangerup12
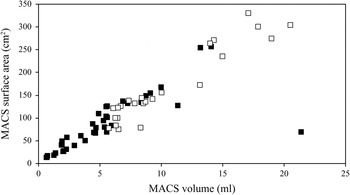
Park and colleagues' study of 24 ears of 15 adult subjects with ‘normal’ mastoid air cell volumes documented a linear relationship between mastoid air cell surface area and volume, with a Pearson correlation coefficient of 0.95.Reference Park, Yoo and Lee7 The present study findings are consistent with this result (Figure 4). Figure 5 combines data from the current study and that of Park et al., and confirms a linear relationship between mastoid air cell surface area and volume over the full range of mastoid air cell volumes encountered in the two studies (i.e. SA = 16.1V + 2.8, where SA = surface area and V = volume; r = 0.96, p < 0.01). The ratio of mean surface area to volume for the combined data set was 16.7 ± 3.7 cm2/ml; this compares with 16.7 ± 3.7 cm2/ml for right ears and 17.4 ± 4.8 cm2/ml for left ears in the present study, and 15.9 ± 2.6 cm2/ml for all ears in the earlier study.
Comparison between mastoid air cell system (MACS) volume versus surface area, for all current study ears (filled squares) and all ears reported by Park et al. 7 (open squares).

Consequently, we reject our initial hypothesis that the slope of the mathematical function relating mastoid air cell surface area to volume is different for smaller versus larger mastoid air cell volumes.
Equations for both diffusion-limited and perfusion-limited gas exchange directly relate the exchange rate of a gas across an inert barrier (such as the mastoid air cell system mucosa) to the surface area of that barrier, assuming that blood perfusion is a function of surface area.Reference Ranade, Lambertsen and Noordergraaf8 Previous studies have documented gas exchange across the mucosa of the mastoid air cell system.Reference Takahashi, Honjo, Naito, Miura, Tanabe and Hasebe13–Reference Ikarashi and Tsuchiya16 One hypothesis explaining the indirect relationship between mastoid air cell volume and otitis media susceptibilityReference Sade and Fuchs2–Reference Valtonen, Dietz, Qvarnberg and Nuutinen6 proposes that the mastoid air cell system functions as a middle-ear gas reserve, and thus slows the rate of middle-ear pressure decrease between eustachian tube openings.Reference Doyle1 A simpler theory explaining this same function proposes that the mastoid air cell surface area (which is directly related to the gas exchange rate) is reduced in ears with greater mastoid air cell volumes. However, such a relationship was not supported by the present study findings. This suggests that, if the mastoid air cell system does function as a gas reserve, then either the blood perfusion/surface area ratio is much less in larger mastoid air cell systems, or other mechanisms are in operation.
• The mastoid air cell system has been hypothesised to function as a gas reserve for the middle ear
• An inverse relationship between mastoid air cell surface area and mastoid air cell volume has previously been suggested, as part of the mechanism supporting this function
• However, this study found that the mastoid air cell surface area was directly related to the mastoid air cell volume in all cases
• This result is inconsistent with the previously suggested mechanism
Indeed, an alternative mechanism has recently been proposed by Cohen et al.,Reference Cohen, Raveh, Peleg, Nazarian and Perez17 based on evidence that gas exchange from the blood to the middle ear is greater in healthy middle ears compared to those with otitis media or other middle-ear disease. These authors suggest that this is a consequence of the presumably larger mastoid air cell volumes in the healthy group, given the reported inverse relationship between mastoid air cell volume and otitis media frequency.Reference Sade and Fuchs2–Reference Valtonen, Dietz, Qvarnberg and Nuutinen6 One interpretation of these data is that the mastoid air cell system, rather than the eustachian tube, is the primary gas source for the middle ear.Reference Cohen, Raveh, Peleg, Nazarian and Perez17 If this interpretation is valid, then larger mastoid air cell system volumes would be expected to enhance gas diffusion into the mastoid air cell system, protecting the middle ear from significant low pressure episodes.
These and other theories of mastoid air cell function should be explored more fully in future studies.
Acknowledgements
This work was supported in part by a grant from the National Institutes of Health (P50 DC007667). The investigators thank the personnel of the Radiology Department at the Children's Hospital of Pittsburgh for their assistance in performing the X-ray and CT procedures, and Ms Julianne Banks for her assistance with subject recruitment and scheduling.