


1 Introduction
Magnetic reconnection is a process where the magnetic field line topology changes (field lines reconnect) to an energetically more advantageous state. Magnetic energy is converted into heating and particle acceleration. Reconnection occurs throughout the Universe, e.g. in the context of gamma ray bursts, in stellar and especially solar flares or in the Earth’s magnetosphere. Due to its importance and the diversity of the underlying microphysics, it is one of the most studied topics in plasma physics with more than 764 000 entries in a web search. We only mention some major lines of this research. Besides the fundamental studies of Sweet–Parker (Sweet Reference Sweet1956; Parker Reference Parker1957) and Petschek (Reference Petschek1964) (see also Biskamp Reference Biskamp2000) a milestone of reconnection research has been the formulation of the geospace environmental modelling (GEM) challenge (Birn et al. Reference Birn, Drake, Shay, Rogers, Denton, Hesse, Kuznetsova, Ma, Bhattacharjee and Otto2001) where various plasma descriptions such as magnetohydrodynamics (MHD), Hall-MHD and kinetic simulations were compared in order to understand the process of fast reconnection. This started intense studies on how to move from a large scale MHD description to more and more refined models and finally to a full kinetic treatment. Another direction continued with a MHD description focused however on turbulent reconnection (see Lazarian et al. (Reference Lazarian, Eyink, Vishniac and Kowal2015) and references therein) and/or multiple island reconnection (Loureiro, Schekochihin & Cowley Reference Loureiro, Schekochihin and Cowley2007; Bhattacharjee et al. Reference Bhattacharjee, Huang, Yang and Rogers2009). The last reference (Bhattacharjee et al. Reference Bhattacharjee, Huang, Yang and Rogers2009) also contains an overview of the parameter regimes in which Hall-MHD or MHD plasmoid reconnection takes place. In addition, a recent review on the 0.1 reconnection rate problem can be found in Cassak, Liu & Shay (Reference Cassak, Liu and Shay2017).
Plasma phenomena that happen on large time and spatial scales and those where collisions are an important factor can often be described sufficiently with hydrodynamic or fluid models. In many cases, such as collisionless magnetic reconnection and collisionless shocks, these conditions are not fulfilled and thus kinetic effects have to be taken into account. However, kinetic simulations are computationally expensive and problems with large system sizes such as reconnection in the magnetotail or three-dimensional reconnection on larger scales cannot be computed with a fully kinetic model at this point. The fluid equations on the other hand can be orders of magnitude cheaper to compute and can be a good approximation depending on how well the corresponding closure suits the problem.
Thus fluid closures including or mimicking kinetic effects have a long history. An excellent overview is given in Chust & Belmont (Reference Chust and Belmont2006). Our starting point is the closure of Hammett & Perkins (Reference Hammett and Perkins1990) and successive work in this direction (Hammett, Dorland & Perkins Reference Hammett, Dorland and Perkins1992; Passot & Sulem Reference Passot and Sulem2003). An extension providing heat fluxes in the parallel and perpendicular directions (with respect to the magnetic field) was presented in Sharma, Hammett & Quataert (Reference Sharma, Hammett and Quataert2003). All of these closures rely on the Hilbert transform and thus form non-local closures.
Wang et al. (Reference Wang, Hakim, Bhattacharjee and Germaschewski2015) suggested a heat flux closure which approximates a spectrum of wavenumbers by one single wavenumber
 $k_{0}$
. The closure, although simple, gave very good results in fluid simulations of collisionless reconnection. Nevertheless, Wang et al. asserted that further work is needed to improve the closure, e.g. by finding a more suitable
 $k_{0}$
. One way to do this is to compare the closure approximation to the actual heat flux gained from a kinetic simulation. This is difficult with a particle in cell (PIC) code because higher moments like pressure and especially heat flux are very noisy in PIC simulations. We analyse the closure making use of kinetic data from a Vlasov simulation. Dependence of
 $k_{0}$
on plasma parameters is sought as well as other major potential improvements to the closure.
2 Vlasov equation and ten moment fluid equations
A plasma may be described by distribution functions
 $f_{s}(\boldsymbol{x},\boldsymbol{v},t)$
which determine the particle density at point
 $(\boldsymbol{x},\boldsymbol{v})$
in phase space at time
 $t$
for the particle species
 $s$
. Under the assumption that there are no collisions (which is a good approximation e.g. for plasmas in space physics), the evolution of the distribution function is given by the continuity equation
 $$\begin{eqnarray}\frac{\unicode[STIX]{x2202}f_{s}}{\unicode[STIX]{x2202}t}+\unicode[STIX]{x1D735}\boldsymbol{\cdot }(\boldsymbol{v}f_{s})+\unicode[STIX]{x1D735}_{v}\boldsymbol{\cdot }(\boldsymbol{a}f_{s})=0.\end{eqnarray}$$
Inserting Lorentz acceleration
 $\boldsymbol{a}=(q/m)(\boldsymbol{E}+\boldsymbol{v}\times \boldsymbol{B})$
, the equation can be rearranged to give the Vlasov equation
 $$\begin{eqnarray}\frac{\unicode[STIX]{x2202}f_{s}}{\unicode[STIX]{x2202}t}+\boldsymbol{v}\boldsymbol{\cdot }\unicode[STIX]{x1D735}f_{s}+\frac{q_{s}}{m_{s}}(\boldsymbol{E}+\boldsymbol{v}\times \boldsymbol{B})\boldsymbol{\cdot }\unicode[STIX]{x1D735}_{v}\,f_{s}=0.\end{eqnarray}$$
Evolution of electric and magnetic fields is given by Maxwell’s equations
 $\unicode[STIX]{x1D735}\boldsymbol{\cdot }\boldsymbol{E}=\unicode[STIX]{x1D70C}/\unicode[STIX]{x1D716}_{0}$
,
 $\unicode[STIX]{x1D735}\boldsymbol{\cdot }\boldsymbol{B}=0$
,
 $\unicode[STIX]{x1D735}\times \boldsymbol{E}=-\unicode[STIX]{x2202}\boldsymbol{B}/\unicode[STIX]{x2202}t$
and
 $\unicode[STIX]{x1D735}\times \boldsymbol{B}=\unicode[STIX]{x1D707}_{0}\,\boldsymbol{j}+\unicode[STIX]{x1D707}_{0}\unicode[STIX]{x1D716}_{0}(\unicode[STIX]{x2202}\boldsymbol{E}/\unicode[STIX]{x2202}t)$
.
The charge and current densities are defined as
 $\unicode[STIX]{x1D70C}=\sum _{s}q_{s}n_{s}$
and
 $\boldsymbol{j}=\sum _{s}q_{s}n_{s}\boldsymbol{u}_{s}$
. Fluid quantities can be derived by taking moments of the distribution function, i.e. multiplying
 $f_{s}$
by powers of
 $v$
and taking the integral over velocity space. The zeroth moment is the particle density
 $n_{s}(\boldsymbol{x},t)=\int f_{s}(\boldsymbol{x},\boldsymbol{v},t)\,\text{d}\boldsymbol{v}$
. Similarly, the first moment is the mean velocity
 $\boldsymbol{u}_{s}(\boldsymbol{x},t)=(1/(n_{s}(\boldsymbol{x},t)))\int \boldsymbol{v}f_{s}(\boldsymbol{x},\boldsymbol{v},t)\,\text{d}\boldsymbol{v}$
. Higher moments include pressure
 $\unicode[STIX]{x1D617}_{s}=m_{s}\int \boldsymbol{v}^{\prime }\otimes \boldsymbol{v}^{\prime }f_{s}\,\text{d}\boldsymbol{v}$
and heat flux
 $\unicode[STIX]{x1D618}_{s}=m_{s}\int \boldsymbol{v}^{\prime }\otimes \boldsymbol{v}^{\prime }\otimes \boldsymbol{v}^{\prime }f_{s}\,\text{d}\boldsymbol{v}$
, where
 $\boldsymbol{v}^{\prime }=\boldsymbol{v}-\boldsymbol{u}$
.
By taking moments of the whole Vlasov equation, one can obtain the fluid equations. Due to the
 $\boldsymbol{v}\boldsymbol{\cdot }\unicode[STIX]{x1D735}f$
term in the Vlasov equation, however, every moment contains a quantity that is defined by the next higher moment. Therefore, the resulting system of equations needs a closure in order to be self-consistent. Usually this is done by finding an approximation for pressure or heat flux. Two common versions of the fluid equations are the five moment equations (pressure closure) and ten moment equations (heat flux closure).
The following three equations along with Maxwell’s equations and a heat flux closure are the complete set of ten moment equations:
 $$\begin{eqnarray}\displaystyle & \displaystyle \frac{\unicode[STIX]{x2202}n_{s}}{\unicode[STIX]{x2202}t}+\unicode[STIX]{x1D735}\boldsymbol{\cdot }(n_{s}\boldsymbol{u}_{s})=0, & \displaystyle\end{eqnarray}$$
 $$\begin{eqnarray}\displaystyle & \displaystyle m_{s}\frac{\unicode[STIX]{x2202}(n_{s}\boldsymbol{u}_{\boldsymbol{s}})}{\unicode[STIX]{x2202}t}=n_{s}q_{s}(\boldsymbol{E}+\boldsymbol{u}_{\boldsymbol{s}}\times \boldsymbol{B})-\unicode[STIX]{x1D735}\boldsymbol{\cdot }{\mathcal{P}}_{s}, & \displaystyle\end{eqnarray}$$
 $$\begin{eqnarray}\displaystyle & \displaystyle \frac{\unicode[STIX]{x2202}{\mathcal{P}}_{s}}{\unicode[STIX]{x2202}t}-2q_{s}~\text{sym}\left(n_{s}\boldsymbol{u}_{s}\boldsymbol{E}+\frac{1}{m_{s}}{\mathcal{P}}\times \boldsymbol{B}\right)=-\unicode[STIX]{x1D735}\boldsymbol{\cdot }{\mathcal{Q}}_{s}. & \displaystyle\end{eqnarray}$$
 ${\mathcal{P}}_{s}=m_{s}\int \boldsymbol{v}\otimes \boldsymbol{v}f_{s}\,\text{d}\boldsymbol{v}$
and
 ${\mathcal{Q}}_{s}=m_{s}\int \boldsymbol{v}\otimes \boldsymbol{v}\otimes \boldsymbol{v}f_{s}\,\text{d}\boldsymbol{v}$
are the second and third moment of the distribution function and ‘sym’ denotes the symmetrization.
3 Wang et al. physical space fluid closure for Landau damping
Many heat flux closures for collisionless plasmas exist and have been successfully applied, e.g. the Landau damping closures by Hammett & Perkins (Reference Hammett and Perkins1990) or Passot & Sulem (Reference Passot and Sulem2003). An overview is given in Chust & Belmont (Reference Chust and Belmont2006). Most closures are not designed for heat flux and pressure tensors in three dimensions however. Hammett & Perkins (Reference Hammett and Perkins1990) (also: Hammett et al. Reference Hammett, Dorland and Perkins1992) approximated the plasma response function using a Padé series in order to include Landau damping in the fluid equations which is the main damping mechanism – and thus cause of heat flux – in collisionless plasmas. The closure was found to be an excellent approximation in many different cases (see e.g. the study by Sarazin et al. Reference Sarazin, Dif-Pradalier, Zarzoso, Garbet, Ghendrih and Grandgirard2009).
The Hammett–Perkins closure is an approximation of the scalar heat flux
 $q$
in one-dimensional Fourier space:
 $$\begin{eqnarray}\tilde{q}_{k}=-n_{0}\unicode[STIX]{x1D712}_{1}\frac{2^{1/2}v_{t}}{|k|}\text{i}k\tilde{T}_{k},\end{eqnarray}$$
with
 $v_{t}=\sqrt{k_{B}T/m}$
,
 $\unicode[STIX]{x1D712}_{1}=2/\sqrt{\unicode[STIX]{x03C0}}$
and the equilibrium density
 $n_{0}$
. The closure resembles Fick’s second law
 $q=-nD(\unicode[STIX]{x2202}T/\unicode[STIX]{x2202}x)$
.
Equations (2.3)–(2.5) and (3.1) contain two extreme cases: in the limit of vanishing heat flux
 $\unicode[STIX]{x1D618}_{s}=0$
these equations integrate to the Chew, Goldberger & Low (CGL) equations of state where
 $p_{\Vert }\propto n^{3}/B^{2}$
and
 $P_{\bot }\propto nB$
(Chew, Goldberger & Low Reference Chew, Goldberger and Low1956). The other extreme case is when the thermal velocity tends to infinity
 $v_{\text{th}}=\infty$
in (3.1) such that
 $\unicode[STIX]{x1D735}T=0$
, indicative of a Boltzmann plasma with constant temperature.
The Hammett–Perkins closure was derived under the assumption of small deviations from a Maxwellian background. Thus, fine scale structures in velocity space or particle trapping cannot be covered with this closure. A closure for guide field reconnection, including the weakening of the heat flux by particle trapping, is described in Le et al. (Reference Le, Egedal, Daughton, Fox and Katz2009) (see also the review Egedal, Le & Daughton Reference Egedal, Le and Daughton2013). Thus, the Hammett–Perkins closure will not cover all of the physics near the X-point but may well be justified outside this region where the magnetic field lines are nearly straight. For simulations coupling a kinetic treatment near the X-point and a fluid description outside the reconnection zone (see Rieke, Trost & Grauer Reference Rieke, Trost and Grauer2015) this closure can substantially improve and simplify the transition from the fluid to the kinetic description.
It was found by Johnson & Rossmanith (Reference Johnson and Rossmanith2010) that heat flux in collisionless reconnection can be modelled by a relaxation of the pressure tensor to an isotropic equilibrium pressure. This can be motivated with the Hammett–Perkins closure: equation (3.1) was simplified by Wang et al. (Reference Wang, Hakim, Bhattacharjee and Germaschewski2015) in order to be applicable in three-dimensional physical space. Since
 $\unicode[STIX]{x1D735}\boldsymbol{\cdot }\unicode[STIX]{x1D64C}$
will be approximated, the divergence of (3.1) is taken which gives
 $$\begin{eqnarray}\text{LHS}=\text{i}\boldsymbol{k}^{t}\boldsymbol{\cdot }\unicode[STIX]{x1D618}_{s}\end{eqnarray}$$
on one side and
 $$\begin{eqnarray}\text{RHS}=n_{0}\unicode[STIX]{x1D712}_{1}\frac{2^{1/2}v_{t}}{|k|}\boldsymbol{k}^{t}\boldsymbol{\cdot }(\boldsymbol{k}^{t}\boldsymbol{\cdot }\tilde{\text{T}}_{s})\end{eqnarray}$$
on the other side of the equation. Here,
 $\boldsymbol{k}^{t}$
is the transposed wave vector. It becomes obvious that a direct generalization of Fick’s law to tensors is not possible since (3.2) is a second-order tensor and (3.3) is a scalar. Therefore, the vector character of
 $\boldsymbol{k}$
was neglected on the right-hand side (and the constant
 $\unicode[STIX]{x1D712}_{1}\sqrt{2}\approx 1.6$
was dropped), resulting in
 $$\begin{eqnarray}\text{i}k_{m}\unicode[STIX]{x1D618}_{ijm}(k)\approx n_{0}\frac{v_{t}}{|k|}k^{2}\tilde{\text{T}}_{ij}(k)=n_{0}v_{t}|k|\tilde{\text{T}}_{ij}(k).\end{eqnarray}$$
The adjustment done by treating
 $\boldsymbol{k}$
as a scalar is that (in physical space)
 $\unicode[STIX]{x1D735}\boldsymbol{\cdot }(\unicode[STIX]{x1D735}\boldsymbol{\cdot }\text{T}_{s})$
is replaced by
 $\unicode[STIX]{x1D6FB}^{2}\text{T}_{s}$
, i.e. the Laplace operator is used on each component of
 $\text{T}_{s}$
. At the same time regular divergence is taken on the left-hand side. A motivation for this approximation is given in § 7.
The perturbed temperature
 $\tilde{\text{T}}_{ij}$
can be expressed as
 $(\unicode[STIX]{x1D617}_{ij}-p\unicode[STIX]{x1D6FF}_{ij})/n_{0}$
, where
 $p\unicode[STIX]{x1D6FF}_{ij}$
is the isotropic pressure with
 $p=(\unicode[STIX]{x1D617}_{xx}+\unicode[STIX]{x1D617}_{yy}+\unicode[STIX]{x1D617}_{zz})/3$
. Thus
 $$\begin{eqnarray}\text{i}k_{m}\unicode[STIX]{x1D618}_{ijm}(k)\approx v_{t}|k|\,(\unicode[STIX]{x1D617}_{ij}(k)-p(k)\unicode[STIX]{x1D6FF}_{ij}).\end{eqnarray}$$
Finally, the wavenumber field
 $k$
is approximated by one single wavenumber
 $k_{0}$
, so that the closure can be written in physical space as
 $$\begin{eqnarray}\unicode[STIX]{x2202}_{m}\unicode[STIX]{x1D618}_{ijm}\approx v_{t}|k_{0}|\,(\unicode[STIX]{x1D617}_{ij}-p\unicode[STIX]{x1D6FF}_{ij}).\end{eqnarray}$$
We will refer to this closure as the scalar-
 $k$
closure in this paper.
4 Numerical set-up
Fluid and kinetic Vlasov simulations of different reconnection problems are performed. The Vlasov code is described in Schmitz & Grauer (Reference Schmitz and Grauer2006a
,Reference Schmitz and Grauer
b
), the fluid code and its coupling to the Vlasov code is presented in Rieke et al. (Reference Rieke, Trost and Grauer2015). Time is normalized over the inverse ion cyclotron frequency
 $\unicode[STIX]{x1D6FA}_{i,0}^{-1}$
, length over ion inertial length
 $d_{i,0}$
, speed over Alfvén velocity
 $v_{A,0}$
and mass over ion mass
 $m_{i}$
. The electron–ion mass ratio is
 $m_{i}/m_{e}=25$
in all set-ups.
4.1 GEM
The GEM (geospace environmental modelling) reconnection set-up (Birn et al.
Reference Birn, Drake, Shay, Rogers, Denton, Hesse, Kuznetsova, Ma, Bhattacharjee and Otto2001) is a reconnection problem that uses a Harris sheet configuration (Harris Reference Harris1962). The initial magnetic field is given by
 $B_{x}(y)=B_{0}\tanh (y/\unicode[STIX]{x1D706})$
and the particle density by
 $n(y)=n_{0}\operatorname{sech}^{2}(y/\unicode[STIX]{x1D706})+n_{b}$
where
 $\unicode[STIX]{x1D706}=0.5$
,
 $B_{0}=1$
,
 $n_{0}=1$
and the background density
 $n_{b}=0.2$
. Temperature is defined by
 $n_{0}(T_{e}+T_{i})=B_{0}^{2}$
,
 $T_{i}/T_{e}=5$
. Speed of light is set to
 $c=20v_{A,0}$
. The domain is of size
 $L_{x}\times L_{y}=(8\unicode[STIX]{x03C0}\times 4\unicode[STIX]{x03C0})d_{i,0}$
. It is translationally symmetric in the
 $z$
-direction, periodic in the
 $x$
-direction and has conducting walls for fields and reflecting walls for particles in the
 $y$
-direction. In order to start the reconnection process, a perturbation in the magnetic field is applied that takes the form
 $\boldsymbol{B}=\hat{\boldsymbol{z}}\times \unicode[STIX]{x1D735}\unicode[STIX]{x1D713}$
where the perturbation in the magnetic flux is given by
 $\unicode[STIX]{x1D713}(x,y)=0.1\cos (2\unicode[STIX]{x03C0}x/L_{x})\cos (\unicode[STIX]{x03C0}y/L_{y})$
. Because of symmetries, it is sufficient to simulate one fourth of the domain. The time span covered by the Vlasov simulation is
 $40\unicode[STIX]{x1D6FA}_{i,0}^{-1}$
, reconnection rate peaks at
 $t\approx 20\unicode[STIX]{x1D6FA}_{i,0}^{-1}$
. The domain is resolved by
 $256\times 128$
cells.
4.2 Large Harris sheet – WHBG
Reconnection in the Earth’s magnetotail happens on much larger spatial scales than reconnection in the GEM set-up. In order to approach larger scales, Wang et al. (Reference Wang, Hakim, Bhattacharjee and Germaschewski2015) performed kinetic and fluid simulations in a configuration like GEM but with a
 $(100\times 50)d_{i,0}$
domain and
 $c=15v_{A,0}$
. For simple reference, it will be called the WHBG set-up (Wang, Hakim, Bhattacharjee, Germaschewski) in this paper. A study of reconnection in a domain of this size was done before by Daughton, Scudder & Karimabadi (Reference Daughton, Scudder and Karimabadi2006), but with open boundary conditions unlike the WHBG version.
4.3 Island coalescence
The island coalescence reconnection problem has also been studied extensively, e.g. by Karimabadi et al. (Reference Karimabadi, Dorelli, Roytershteyn, Daughton and Chacón2011) (large PIC simulations), Stanier et al. (Reference Stanier, Daughton, Chacón, Karimabadi, Ng, Huang, Hakim and Bhattacharjee2015) (PIC, hybrid and Hall-MHD compared) and Ng et al. (Reference Ng, Huang, Hakim, Bhattacharjee, Stanier, Daughton, Wang and Germaschewski2015) (MHD, Hall-MHD and ten moment fluid simulations). We use the same parameters as the aforementioned studies. The initial configuration is a Fadeev equilibrium (Fadeev, Kvabtskhava & Komarov Reference Fadeev, Kvabtskhava and Komarov1965):
 $A_{z}=-\unicode[STIX]{x1D706}B_{0}\ln (\cosh (y/\unicode[STIX]{x1D706})+\unicode[STIX]{x1D716}\cos (x/\unicode[STIX]{x1D706}))$
and
 $n=n_{0}(1-\unicode[STIX]{x1D716}^{2})/(\cosh (y/\unicode[STIX]{x1D706})+\unicode[STIX]{x1D716}\cos (x/\unicode[STIX]{x1D706}))^{2}+n_{b}$
with
 $\unicode[STIX]{x1D716}=0.4$
,
 $n_{b}=0.2$
and a variable
 $\unicode[STIX]{x1D706}$
. Temperature is
 $T=T_{i}=T_{e}=0.5$
, speed of light
 $c=15v_{A,0}$
and the domain size is proportional to
 $\unicode[STIX]{x1D706}$
according to
 $L_{x}\times L_{y}=(2\unicode[STIX]{x03C0}\unicode[STIX]{x1D706}\times 4\unicode[STIX]{x03C0}\unicode[STIX]{x1D706})d_{i,0}$
. The boundaries are periodic in the
 $y$
-direction and conducting for fields and reflecting for particles in the
 $x$
-direction. The
 $B$
-field perturbation is
 $\unicode[STIX]{x1D6FF}B_{x}=0.1\sin (y/(2\unicode[STIX]{x1D706})-\unicode[STIX]{x03C0})\cos (x/(2\unicode[STIX]{x1D706}))$
and
 $\unicode[STIX]{x1D6FF}B_{y}=-0.1\cos (y/(2\unicode[STIX]{x1D706})-\unicode[STIX]{x03C0})\sin (x/(2\unicode[STIX]{x1D706}))$
(Daughton et al.
Reference Daughton, Roytershteyn, Albright, Karimabadi, Yin and Bowers2009). Time is normalized to the Alfvén time
 $t_{A}=L_{y}/v_{A,0}$
. The normalized reconnection rate
 $E_{R}$
is computed as
 $E_{R}=(\unicode[STIX]{x2202}\unicode[STIX]{x1D6F9}/\unicode[STIX]{x2202}t)/(B^{\prime }v_{A}^{\prime })$
where
 $B^{\prime }$
is the maximum of the absolute value of the magnetic field between the X-point and the O-point at
 $x=0$
and
 $t=0$
and
 $v_{A}^{\prime }=B^{\prime }/\sqrt{\unicode[STIX]{x1D707}_{0}n_{0}m_{i}}$
. The magnetic flux is
 $\unicode[STIX]{x1D6F9}=\int _{\text{O}}^{\text{X}}\,\text{d}yB_{x}$
(integral from the O- to the X-point).
5 Comparison of heat flux data and the scalar-
 $k$
closure

In order to examine how well the actual divergence of heat flux agrees with the closure approximation, both sides of (3.6) have been computed. While Wang et al. chose
 $1/d_{e,0}$
as
 $k_{0}$
for all components, ideally one can find a better
 $k_{0}$
by analysing the plots (cf. § 6) of the kinetic simulations. The comparison is done with simulations of the GEM set-up.
Taking symmetry into account, the heat flux tensor
 $\unicode[STIX]{x1D618}_{s}$
has ten and the pressure tensor
 $\unicode[STIX]{x1D617}_{s}$
has six independent components. Therefore (3.6) results in six separate equations, one for each of the pressure tensor’s components.
 $1/d_{e,0}$
equates to
 $5d_{i,0}^{-1}$
since the electron–ion mass ratio
 $m_{e}/m_{i}$
is
 $1/25$
. For the purpose of comparison, a value of
 $k_{0}=1d_{i,0}^{-1}$
is used to compute the closure. Representative plots are shown in figure 1.
Comparison of actual heat flux change (first row) and scalar-
 $k$
closure (second row). (a)
 $(\unicode[STIX]{x1D735}\boldsymbol{\cdot }\unicode[STIX]{x1D618}_{e})_{xx}$
at
 $t=17.5\unicode[STIX]{x1D6FA}_{i}^{-1}$
, (b)
 $(\unicode[STIX]{x1D735}\boldsymbol{\cdot }\unicode[STIX]{x1D618}_{e})_{xy}$
at
 $t=7.5\unicode[STIX]{x1D6FA}_{i}^{-1}$
, (c)
 $(\unicode[STIX]{x1D735}\boldsymbol{\cdot }\unicode[STIX]{x1D618}_{e})_{zz}$
at
 $t=30\unicode[STIX]{x1D6FA}_{i}^{-1}$
.
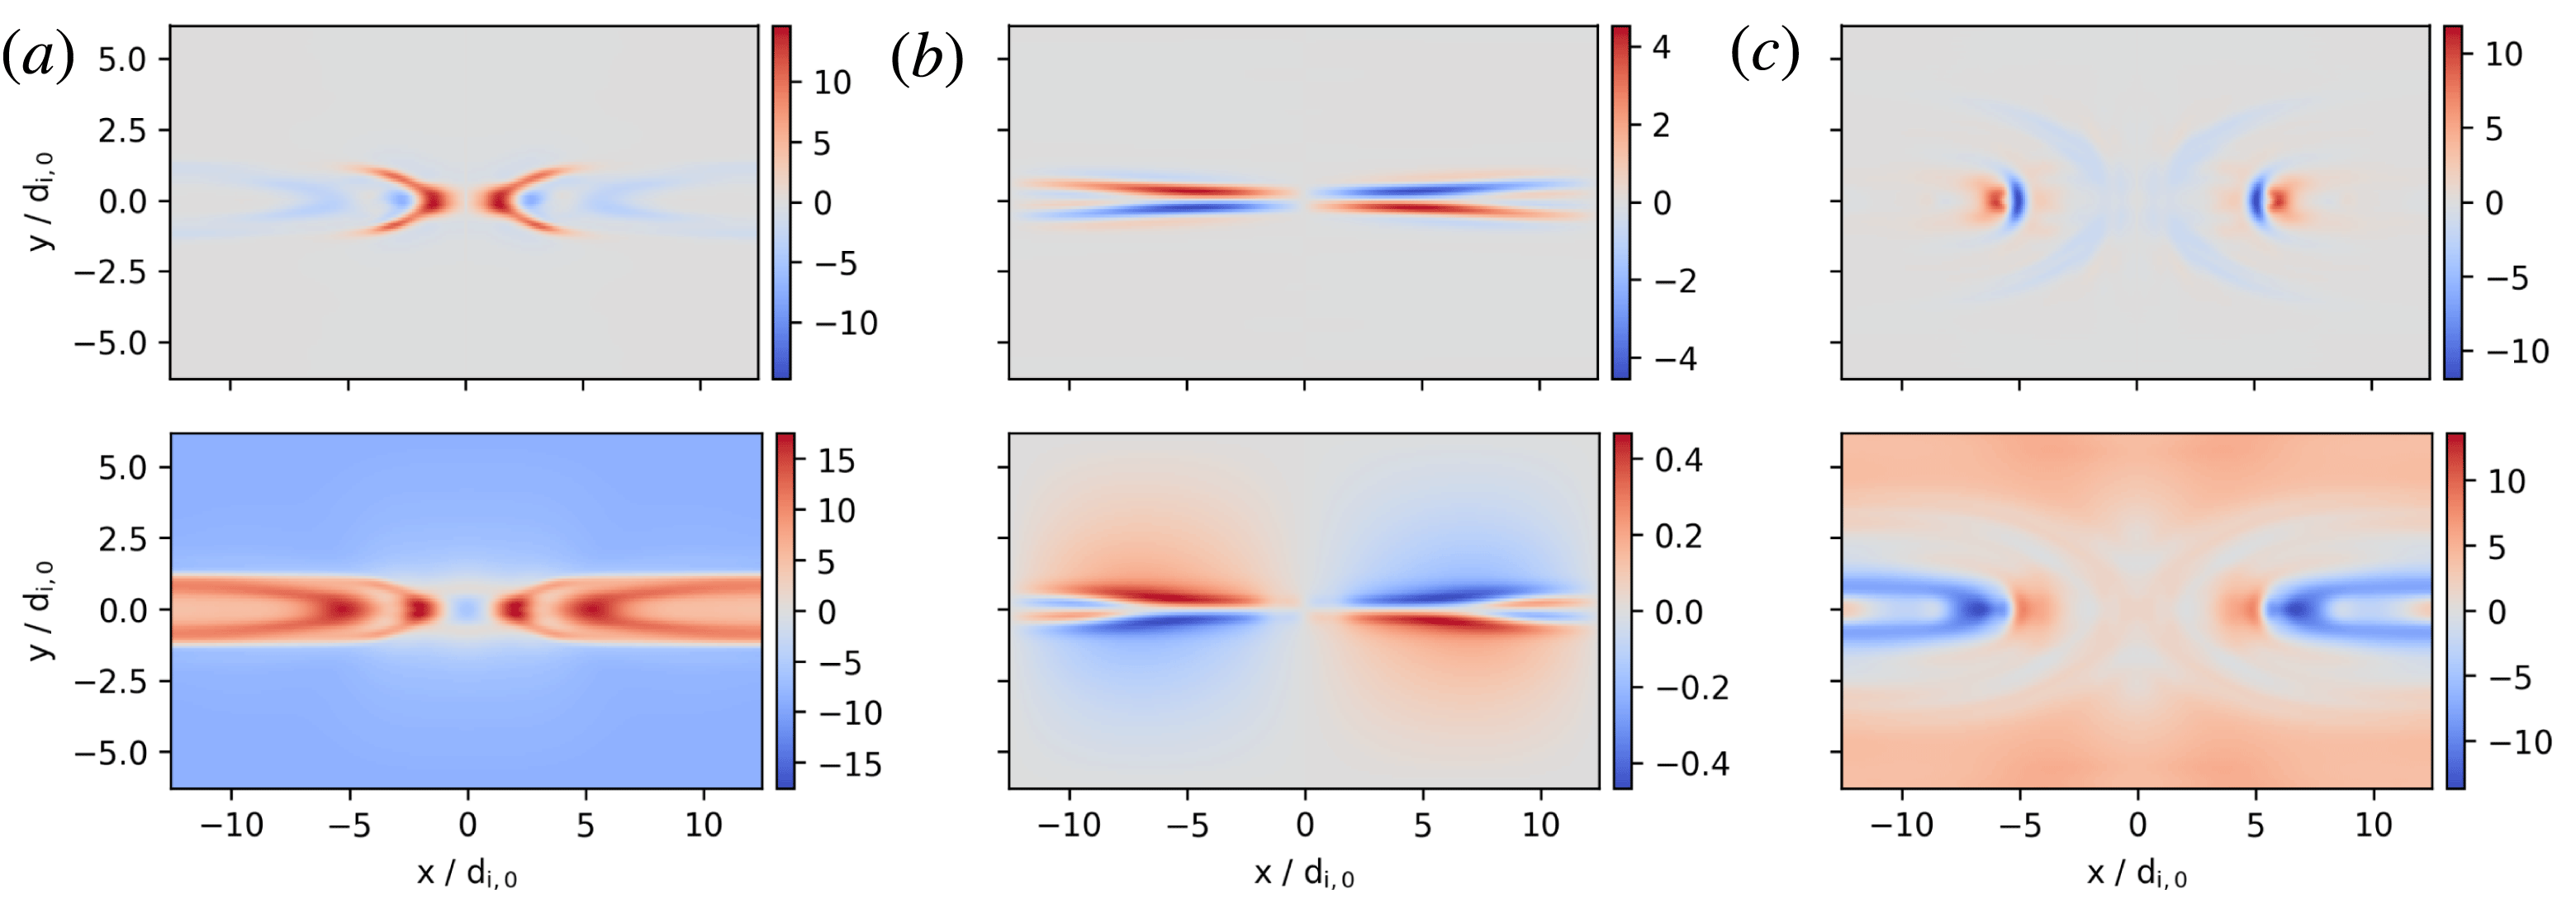
Overall the agreement is decent considering that heat flux often has a complex shape. The approximation is best in the period before and during reconnection. In the beginning of the simulation the magnitude is usually off by a factor of between
 $1/10$
and 10 whereas after reconnection the shape of the heat flux generally becomes very convoluted which is hard to replicate with a closure.
Figure 1(a) shows typical issues insofar as the basic structure is approximated well (the area in the centre of the plot) but other parts of the shape are wrong (here the outer area around the
 $x$
-axis). Another recurring problem is that the whole outer region usually has no heat flux, which is wrongly predicted by the scalar-
 $k$
closure. A major improvement with correct damping in this outer region will be presented in § 7.
A positive example of the scalar-
 $k$
closure is given by figure 1(b), showing how it can even cover details like the changing sign at the left and right borders around the
 $x$
-axis. After reconnection, structures tend to get complicated (figure 1
c) and while the shape is still similar, both the sign and the location of extrema are inaccurate. This holds true for many components towards the end of the simulation (35–
 $40\unicode[STIX]{x1D6FA}_{i,0}^{-1}$
). Concerning a fixed
 $k_{0}$
, the comparison suggests that values between 0.1 and
 $10d_{i,0}^{-1}$
can be reasonable choices for both ions and electrons.
6 Searching for a parameter dependent
$k_{0}$

The field of wavenumbers
 $k$
from (3.1) was replaced with a single fixed number
 $k_{0}$
by Wang et al. (Reference Wang, Hakim, Bhattacharjee and Germaschewski2015). Although this is a massive simplification, it already leads to good results. Nonetheless, there are differences between a kinetic simulation and a ten moment fluid simulation using the scalar-
 $k$
closure. Discrepancies exist e.g. in the pressure tensor which may be attributed to the issue that there is no trivial way to generalize the original Hammett–Perkins closure to three dimensions and that
 $k$
is the same for each component of the pressure tensor.
The idea behind the approximation is that a
 $k_{0}$
represents the average length scales at which Landau damping occurs in the given scenario. Wang et al. (Reference Wang, Hakim, Bhattacharjee and Germaschewski2015) found
 $k_{0}=1/d_{e,0}=5d_{i,0}^{-1}$
to fit well in their
 $(100\times 50)d_{i,0}$
reconnection set-up. Tests showed that in the original GEM reconnection problem, however,
 $k_{0,i}=0.3d_{i,0}^{-1}$
seems to be the optimal value. This is unintuitive as usually a smaller domain size would not require a smaller (indeed much smaller) characteristic wavenumber. That means
 $k_{0}$
seems to be specific to the respective problem. It would be desirable to find a consistent variable
 $k_{0}$
which might depend on local plasma parameters.
Eligible plasma parameters were investigated experimentally by computing the closure with the respective
 $k_{0}$
candidate and comparing it to the actual divergence of heat flux as done in § 5. Promising candidates were additionally tested in a ten moment fluid simulation which was then compared to a run with
 $k_{0}=5d_{i,0}^{-1}$
and a Vlasov run. Dependence of
 $k_{0}$
on plasma parameters and quantities was examined in the GEM set-up, but none of the experiments led to an improvement. It is difficult to find suitable plasma parameters since the closure’s shape is overall decent and differences compared to the actual heat flux are often very complex or vary heavily in time and component. Taking the analysis done in § 5 and in this section into account, it appears that the deficiencies are not solely related to
 $k_{0}$
and its possible dependence on local plasma parameters.
7 Modified, gradient driven closure
The Hammett–Perkins closure was transferred to physical space because a Fourier space representation may be computationally expensive in a physical space code. More important is the issue that it is not clear how to generalize the closure to three-dimensional tensors. A generalization to tensors in Fourier space was proposed by Ng et al. (Reference Ng, Hakim, Bhattacharjee, Stanier and Daughton2017). They started with (3.1) and searched for a total symmetric generalization of the heat flux
 $\unicode[STIX]{x1D618}_{ijm}$
resulting in
 $$\begin{eqnarray}\unicode[STIX]{x1D618}_{ijm}(\boldsymbol{x})=n(\boldsymbol{x})\tilde{\unicode[STIX]{x1D618}}_{ijm}(\boldsymbol{x}),\quad \hat{\tilde{\unicode[STIX]{x1D618}}}_{ijm}(\boldsymbol{k})=-\text{i}\frac{v_{t}}{|k|}\unicode[STIX]{x1D712}k_{[i}\hat{T}_{jk ]},\end{eqnarray}$$
where
 $\hat{\tilde{\unicode[STIX]{x1D618}}}_{ijm}$
and
 $\hat{T}_{jk}$
denote the Fourier transforms of
 $\tilde{\unicode[STIX]{x1D618}}_{ijm}$
and
 $T_{jk}$
.
We take a different approach and focus not on the heat flux directly but on its divergence
 $\unicode[STIX]{x2202}_{m}\unicode[STIX]{x1D618}_{ijm}$
. To attain the symmetry of this divergence tensor, Wang et al. (Reference Wang, Hakim, Bhattacharjee and Germaschewski2015) used
 $-k^{2}\unicode[STIX]{x1D64B}$
in place of the derivative
 $-\boldsymbol{k}^{t}\boldsymbol{\cdot }(\boldsymbol{k}^{t}\boldsymbol{\cdot }\unicode[STIX]{x1D64B})$
and then approximated
 $k$
by
 $k_{0}$
. The physical space equivalent of this is to replace
 $\unicode[STIX]{x1D735}\boldsymbol{\cdot }(\unicode[STIX]{x1D735}\boldsymbol{\cdot }\unicode[STIX]{x1D64B})$
by
 $\unicode[STIX]{x1D6FB}^{2}\unicode[STIX]{x1D64B}$
where now the second approximation (
 $k\approx k_{0}$
) is not needed. This way the dependence on
 $k_{0}$
is reduced and a different relaxation in each component of the pressure tensor is allowed. The resulting expression takes the form of a Fick’s law and thus the damping nature of the Hammett–Perkins closure is clearly retained.
Our candidate for a new collisionless heat flux closure is
 $$\begin{eqnarray}\unicode[STIX]{x2202}_{m}\unicode[STIX]{x1D618}_{ijm}=-\frac{v_{t}}{|k_{0}|}\unicode[STIX]{x1D6FB}^{2}(\unicode[STIX]{x1D617}_{ij}-p\unicode[STIX]{x1D6FF}_{ij}),\end{eqnarray}$$
where the symmetry of the divergence of the heat flux appears naturally. We will call it the gradient closure in this paper.
The motivation as to why
 $-k^{2}~\unicode[STIX]{x1D64B}$
might be a suitable approximation of the derivative has not yet been clarified. In order to do so, assume
 $\boldsymbol{B}=(B_{x},0,0)$
. The wave vector
 $\boldsymbol{k}$
is related to plasma oscillations, therefore
 $\boldsymbol{k}\Vert \boldsymbol{B}$
and
 $\boldsymbol{k}=(k_{x},0,0)$
. The Hammett–Perkins closure in Wang et al.’s three-dimensional version is
 $$\begin{eqnarray}\text{i}k_{m}\unicode[STIX]{x1D618}_{ijm}=\unicode[STIX]{x1D712}_{1}\frac{2^{1/2}v_{t}}{|k|}k^{2}(\unicode[STIX]{x1D617}_{ij}-p\unicode[STIX]{x1D6FF}_{ij})\end{eqnarray}$$
or
 $$\begin{eqnarray}\text{i}k_{x}\unicode[STIX]{x1D618}_{ijx}+\text{i}k_{y}\unicode[STIX]{x1D618}_{ijy}+\text{i}k_{z}\unicode[STIX]{x1D618}_{ijz}=\unicode[STIX]{x1D712}_{1}\frac{2^{1/2}v_{t}}{|k|}(k_{x}^{2}+k_{y}^{2}+k_{z}^{2})(\unicode[STIX]{x1D617}_{ij}-p\unicode[STIX]{x1D6FF}_{ij}).\end{eqnarray}$$
After dividing by
 $\text{i}k_{x}$
and with
 $k_{y}=k_{z}=0$
, the equation has the form of the original Hammett–Perkins closure
 $$\begin{eqnarray}\unicode[STIX]{x1D618}_{ijx}(k)=-\unicode[STIX]{x1D712}_{1}\frac{2^{1/2}v_{t}}{|k_{x}|}\text{i}k_{x}(\unicode[STIX]{x1D617}_{ij}(k)-p(k)\unicode[STIX]{x1D6FF}_{ij}).\end{eqnarray}$$
Hence, equation (3.6) is a plausible generalization to three-dimensional tensors along magnetic field lines. This indicates that, while not exact in all space, the simplification of treating
 $k$
as a scalar is reasonable.
In the outer region of the simulation, field lines are nearly parallel to the
 $x$
-axis. Thus, it is straightforward to use (7.5) to test whether the Hammett–Perkins closure can be applied to the problem of reconnection or, more precisely, how far the issues found are related to the choice of
 $k_{0}$
and the scalar-
 $k$
approximation and in how far the problems are inherent to the original closure. The heat flux according to the closure was calculated by Fourier transforming a one-dimensional section of the pressure data with
 $y=\text{const.}$
, multiplying it by
 $-\text{i}(k/|k|)=-\text{i}\,\text{sgn}(k)$
and then Fourier transforming back to physical space. This corresponds to the Hilbert transform of the perturbed pressure. Data were taken at
 $t=17.5\unicode[STIX]{x1D6FA}_{i}^{-1}$
and
 $y=-4.27d_{i,0}$
. As an example, the results compared to the actual heat flux are plotted in figure 2. The deviation from the heat flux data is different for the various components. Generally, the issues are similar to those of the scalar-
 $k$
closure concerning shape, magnitude and sign, but to a lesser extent.
Hammett–Perkins closure, components from left to right:
 $\unicode[STIX]{x1D618}_{xxz,e},\unicode[STIX]{x1D618}_{xxz,i},\unicode[STIX]{x1D618}_{xyy,e}$
.

Comparison of actual heat flux change (first row), scalar-
 $k$
closure (second row) and gradient closure (third row). (a)
 $(\unicode[STIX]{x1D735}\boldsymbol{\cdot }\unicode[STIX]{x1D618}_{i})_{xx}$
at
 $t=20\unicode[STIX]{x1D6FA}_{i}^{-1}$
, (b)
 $(\unicode[STIX]{x1D735}\boldsymbol{\cdot }\unicode[STIX]{x1D618}_{i})_{xy}$
at
 $t=7\unicode[STIX]{x1D6FA}_{i}^{-1}$
, (c)
 $(\unicode[STIX]{x1D735}\boldsymbol{\cdot }\unicode[STIX]{x1D618}_{e})_{yy}$
at
 $t=17.5\unicode[STIX]{x1D6FA}_{i}^{-1}$
.

As done before with the scalar-
 $k$
closure, we also compare the gradient closure to heat flux data from a Vlasov run. A comparison of magnitude suggests
 $k_{0,s}=3/d_{s,0}$
for the characteristic wavenumber in the new closure. This is also the value that was used for the plots in figure 3. Improvements are recognizable like a better representation of extrema (figure 3
a). It has been asserted before that the scalar-
 $k$
closure sometimes yields bad results in the outer regions which was not the case with the original Hammett–Perkins closure. This issue has indeed been fixed using the Laplacian as can be seen in figure 3(b,c). Recent efforts to couple the Vlasov equation to the ten moment fluid equations (Rieke et al.
Reference Rieke, Trost and Grauer2015; Trost, Lautenbach & Grauer Reference Trost, Lautenbach and Grauer2017) could profit from the improvement in the outer region since that is where the fluid model would be used in a coupling scenario.
8 The pressure gradient closure in reconnection simulations
8.1 GEM
In the GEM set-up the gradient fluid run is compared to both the kinetic Vlasov run and a scalar-
 $k$
fluid run. The respective plots can be seen in figure 4. Snapshots are taken at times where a similar amount of flux has reconnected since fluid simulations of Harris sheet reconnection usually have a longer onset than kinetic ones. The reconnected flux is measured at
 $y=0$
as
 $\unicode[STIX]{x1D6F9}=\int _{X}^{O}B_{y}\,\text{d}x$
where the integral is between the centre and the right border of the domain (X- and O-point).
Vlasov run (first row), scalar-
 $k$
fluid run (second row) and gradient fluid run (third row). (a)
 $j_{z}$
when
 $\unicode[STIX]{x1D6F9}=1.8$
, (b)
 $j_{x}$
when
 $\unicode[STIX]{x1D6F9}=2$
, (c)
 $\unicode[STIX]{x1D617}_{xy,e}$
when
 $\unicode[STIX]{x1D6F9}=2$
.

The scalar-
 $k$
simulation of the GEM set-up that is displayed here was computed with
 $k_{0,i}=0.3d_{i,0}^{-1}$
and
 $k_{0,e}=5d_{i,0}^{-1}$
which gave the best agreement with the Vlasov simulation (cf. § 6). Significant improvement can be observed in the run with the gradient closure throughout all parameters. Also, the time development of the gradient run is closer to the Vlasov run. Figure 4(a) shows that the extremum of the current after reconnection is caught better. Details like the extrema and the changing sign in figure 4(b) in the outer areas around the
 $x$
-axis that the scalar-
 $k$
run misses are now included. This indicates that the new closure provides a better representation of kinetic effects. Heat flux change directly influences the pressure tensor, so it is particularly interesting that the agreement with the kinetic pressure tensor has improved. In figure 4(c) an example is shown where the scalar-
 $k$
closure produces a result significantly different from the Vlasov run while the result from the gradient closure is very similar.
Using a higher resolution of
 $1024\times 512$
cells for the gradient closure simulation further improves agreement with the Vlasov simulation (cf. figure 5). In the GEM configuration, and in the other configurations as well, the ion–electron mass ratio was
 $m_{i}/m_{e}=25$
which makes the simulations computationally cheaper compared to more realistic mass ratios. Figure 5 shows the differences between runs with mass ratios of 25, 400 and the actual ratio 1836. Results are very similar to each other and are in good agreement with the Vlasov simulation. A lower electron mass allows more complex structures to develop with a localized X-point and leads to a higher current peak.
 $j_{z}$
when
 $\unicode[STIX]{x1D6F9}=1.8$
in the GEM set-up for different mass ratios. From left to right:
 $m_{i}/m_{e}=25$
(
 $1024\times 512$
cells),
 $m_{i}/m_{e}=400$
(
 $1024\times 512$
cells) and
 $m_{i}/m_{e}=1836$
(
 $2048\times 1024$
cells).

Le, Egedal & Daughton (Reference Le, Egedal and Daughton2016) (see also: Le et al.
Reference Le, Egedal, Daughton, Fox and Katz2009; Egedal et al.
Reference Egedal, Le and Daughton2013) showed that anisotropy due to particle trapping plays an important role in anti-parallel magnetic reconnection both near the X-point and in the inflow regions. A Hammett–Perkins type closure might be able to imitate this particle trapping by predicting a very low heat flux (CGL limit) in the appropriate regions. Usually,
 $v_{t,e}$
in a Hammett–Perkins closure would cause higher electron heat fluxes with realistic electron masses and therefore lead to a Boltzmann limit for the electrons. However, since
 $k_{0,s}\propto 1/d_{s,0}$
, the amount of heat flux is independent of the mass ratio so that the anisotropy is not underestimated for realistic mass ratios.
Time development of the reconnected flux in the GEM set-up for different simulations. If not specified differently, the electron–ion mass ratio is
 $m_{i}/m_{e}=25$
. The number next to the model is the resolution, e.g. 1024 for a resolution of
 $1024\times 512$
cells.
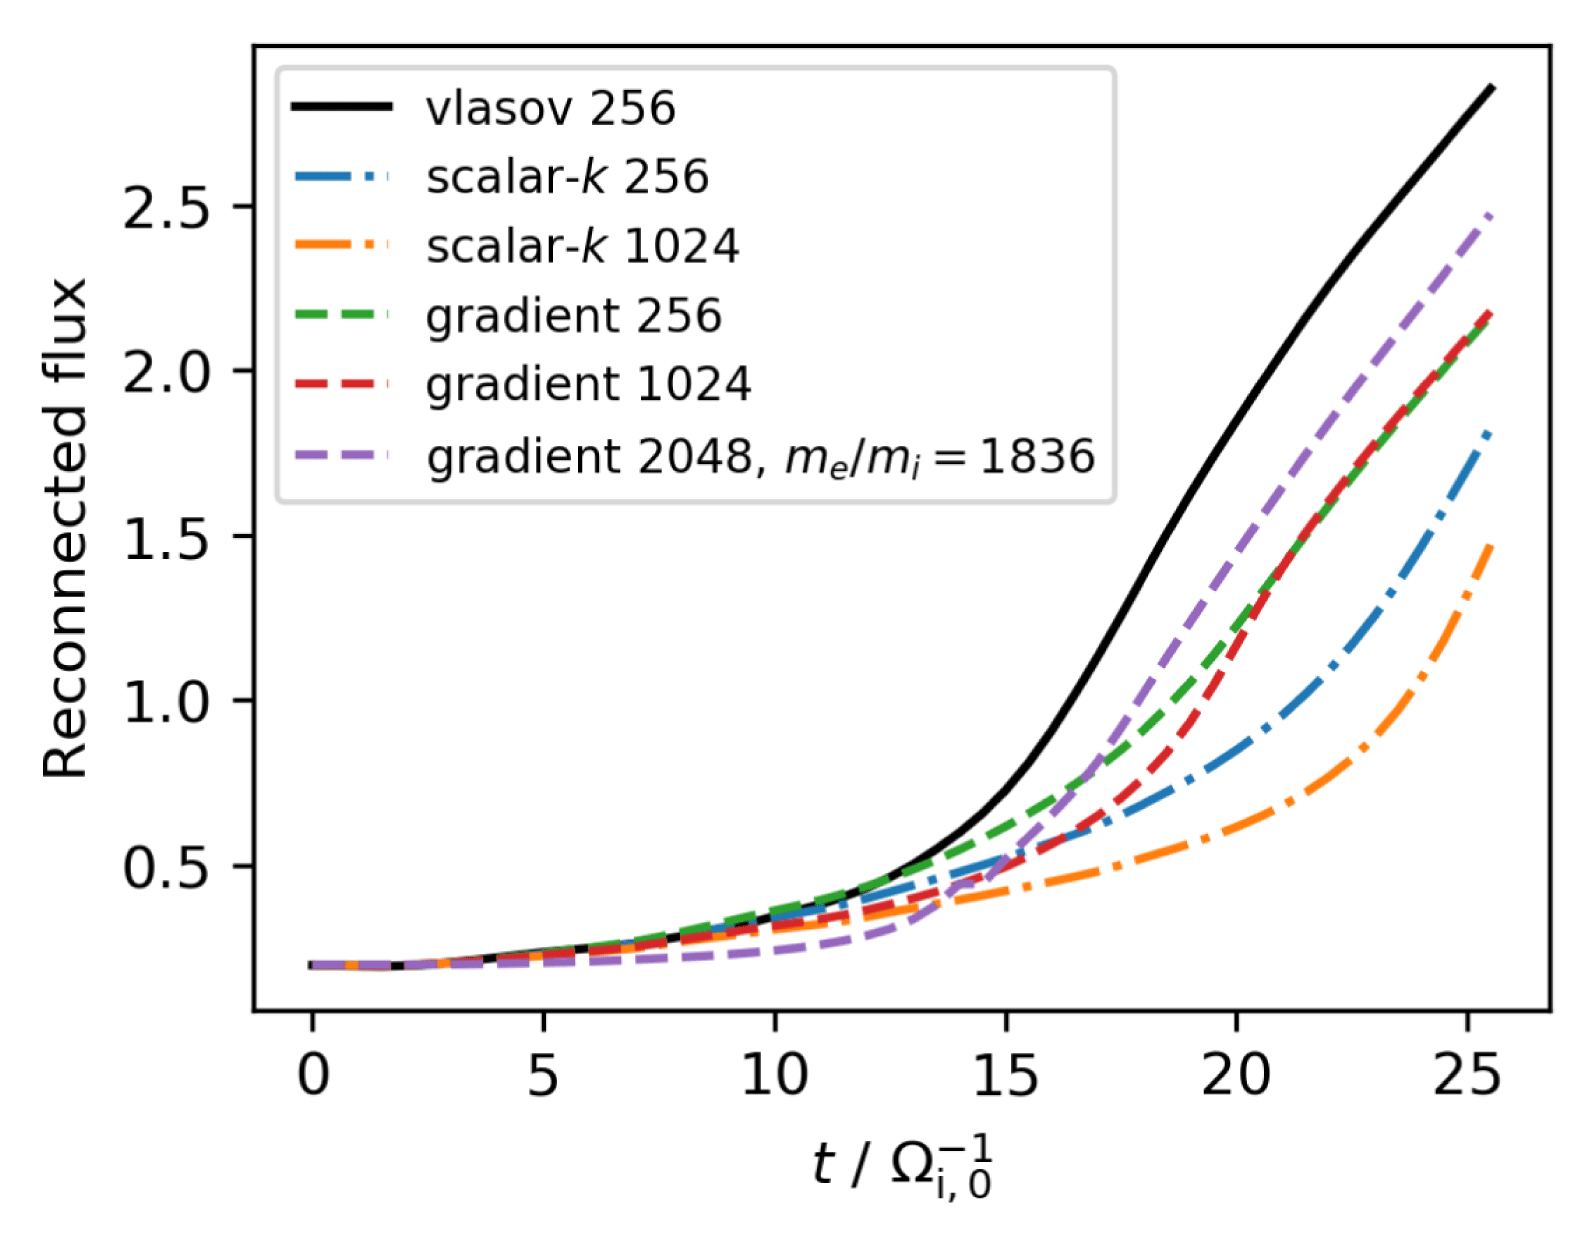
In figure 6 the time development of the reconnected flux in different GEM runs is compared. It can be seen that the low resolution scalar-
 $k$
run has lower reconnection rates than the Vlasov run and the reconnection rate drops further when going to a higher resolution. The high resolution gradient run on the other hand has the same slope as the Vlasov run after a slightly longer onset and the low resolution gradient run has a differing slope but reconnection happens similarly fast overall.
8.2 WHBG
Originally, the scalar-
 $k$
closure was tested by Wang et al. (Reference Wang, Hakim, Bhattacharjee and Germaschewski2015) in the case of reconnection in a larger domain of size
 $(100\times 50)d_{i,0}$
. They compared the ten moment scalar-
 $k$
closure to a kinetic particle in cell (PIC) simulation and found good agreement but some issues as well. Figure 7 shows ten moment runs of the WHBG set-up with the scalar-
 $k$
closure on one hand and the gradient closure on the other hand (resolution
 $4096\times 2048$
cells). The scalar-
 $k$
run is very similar to the one by Wang et al. The gradient run is closer to Wang et al.’s PIC run and has little to no plasmoid formation. The characteristic wavenumbers in the gradient closure were chosen as
 $k_{0,s}=(1/3)d_{s,0}^{-1}$
, although other values of
 $k_{0,s}$
are possible as well.
 $u_{z,e}$
in the WHBG set-up when
 $\unicode[STIX]{x1D6F9}=2.7$
. (a) Scalar-
 $k$
simulation (
 $t=140\unicode[STIX]{x1D6FA}_{i,0}^{-1}$
) and (b) gradient simulation (
 $t=131\unicode[STIX]{x1D6FA}_{i,0}^{-1}$
).
8.3 Island coalescence
The coalescence of islands has been observed in space plasmas and is reported to accelerate electrons to high energies (Song et al.
Reference Song, Chen, Li, Kong and Feng2012). Until now no fluid or MHD model was capable of reproducing the kinetic effects in island coalescence well. Ng et al. (Reference Ng, Huang, Hakim, Bhattacharjee, Stanier, Daughton, Wang and Germaschewski2015) found good agreement of the scalar-
 $k$
ten moment model with PIC runs on small spatial scales with
 $k_{0,e}=5d_{i,0}^{-1}$
,
 $k_{0,i}=0.3d_{i,0}^{-1}$
as the optimal wavenumber values. Going to larger islands, however, average reconnection rates decreased according to
 $(\unicode[STIX]{x1D706}/d_{i,0})^{-0.2}$
whereas there was a stronger scaling of
 $(\unicode[STIX]{x1D706}/d_{i,0})^{-0.8}$
in kinetic PIC simulations (see also Stanier et al.
Reference Stanier, Daughton, Chacón, Karimabadi, Ng, Huang, Hakim and Bhattacharjee2015). There were also further differences from kinetic simulations, e.g. islands did not bounce from each other and secondary islands formed in larger systems.
Ng et al. (Reference Ng, Hakim, Bhattacharjee, Stanier and Daughton2017) proposed a global generalization (see (7.1)) of the Hammett–Perkins closure to tensors and tested it in the island coalescence set-up. The generalization is in Fourier space which is computationally expensive but has the advantage that no
 $k_{0}$
needs to be chosen. It performed better than the scalar-
 $k$
closure concerning the average reconnection rates (
 $\propto (\unicode[STIX]{x1D706}/d_{i,0})^{-0.45}$
) but did not approach the kinetic scaling. Scaling of the maximum reconnection rate did not improve significantly and the other discrepancies mentioned above remained.
We conducted runs of the island coalescence problem with the scalar-
 $k$
and the gradient closure. The results of our scalar-
 $k$
simulations are very similar to those of Ng et al. (Reference Ng, Hakim, Bhattacharjee, Stanier and Daughton2017) with a scaling of the average reconnection rate
 $\propto (\unicode[STIX]{x1D706}/d_{i,0})^{-0.23}$
and also matching values for the maximum reconnection rate. In our simulations no secondary islands formed however.
Fluid simulations with the gradient closure show the characteristics of kinetic simulations, if
 $k_{0}$
is chosen correctly. Here, the optimal value is
 $k_{0,s}=(1/2)/d_{s,0}$
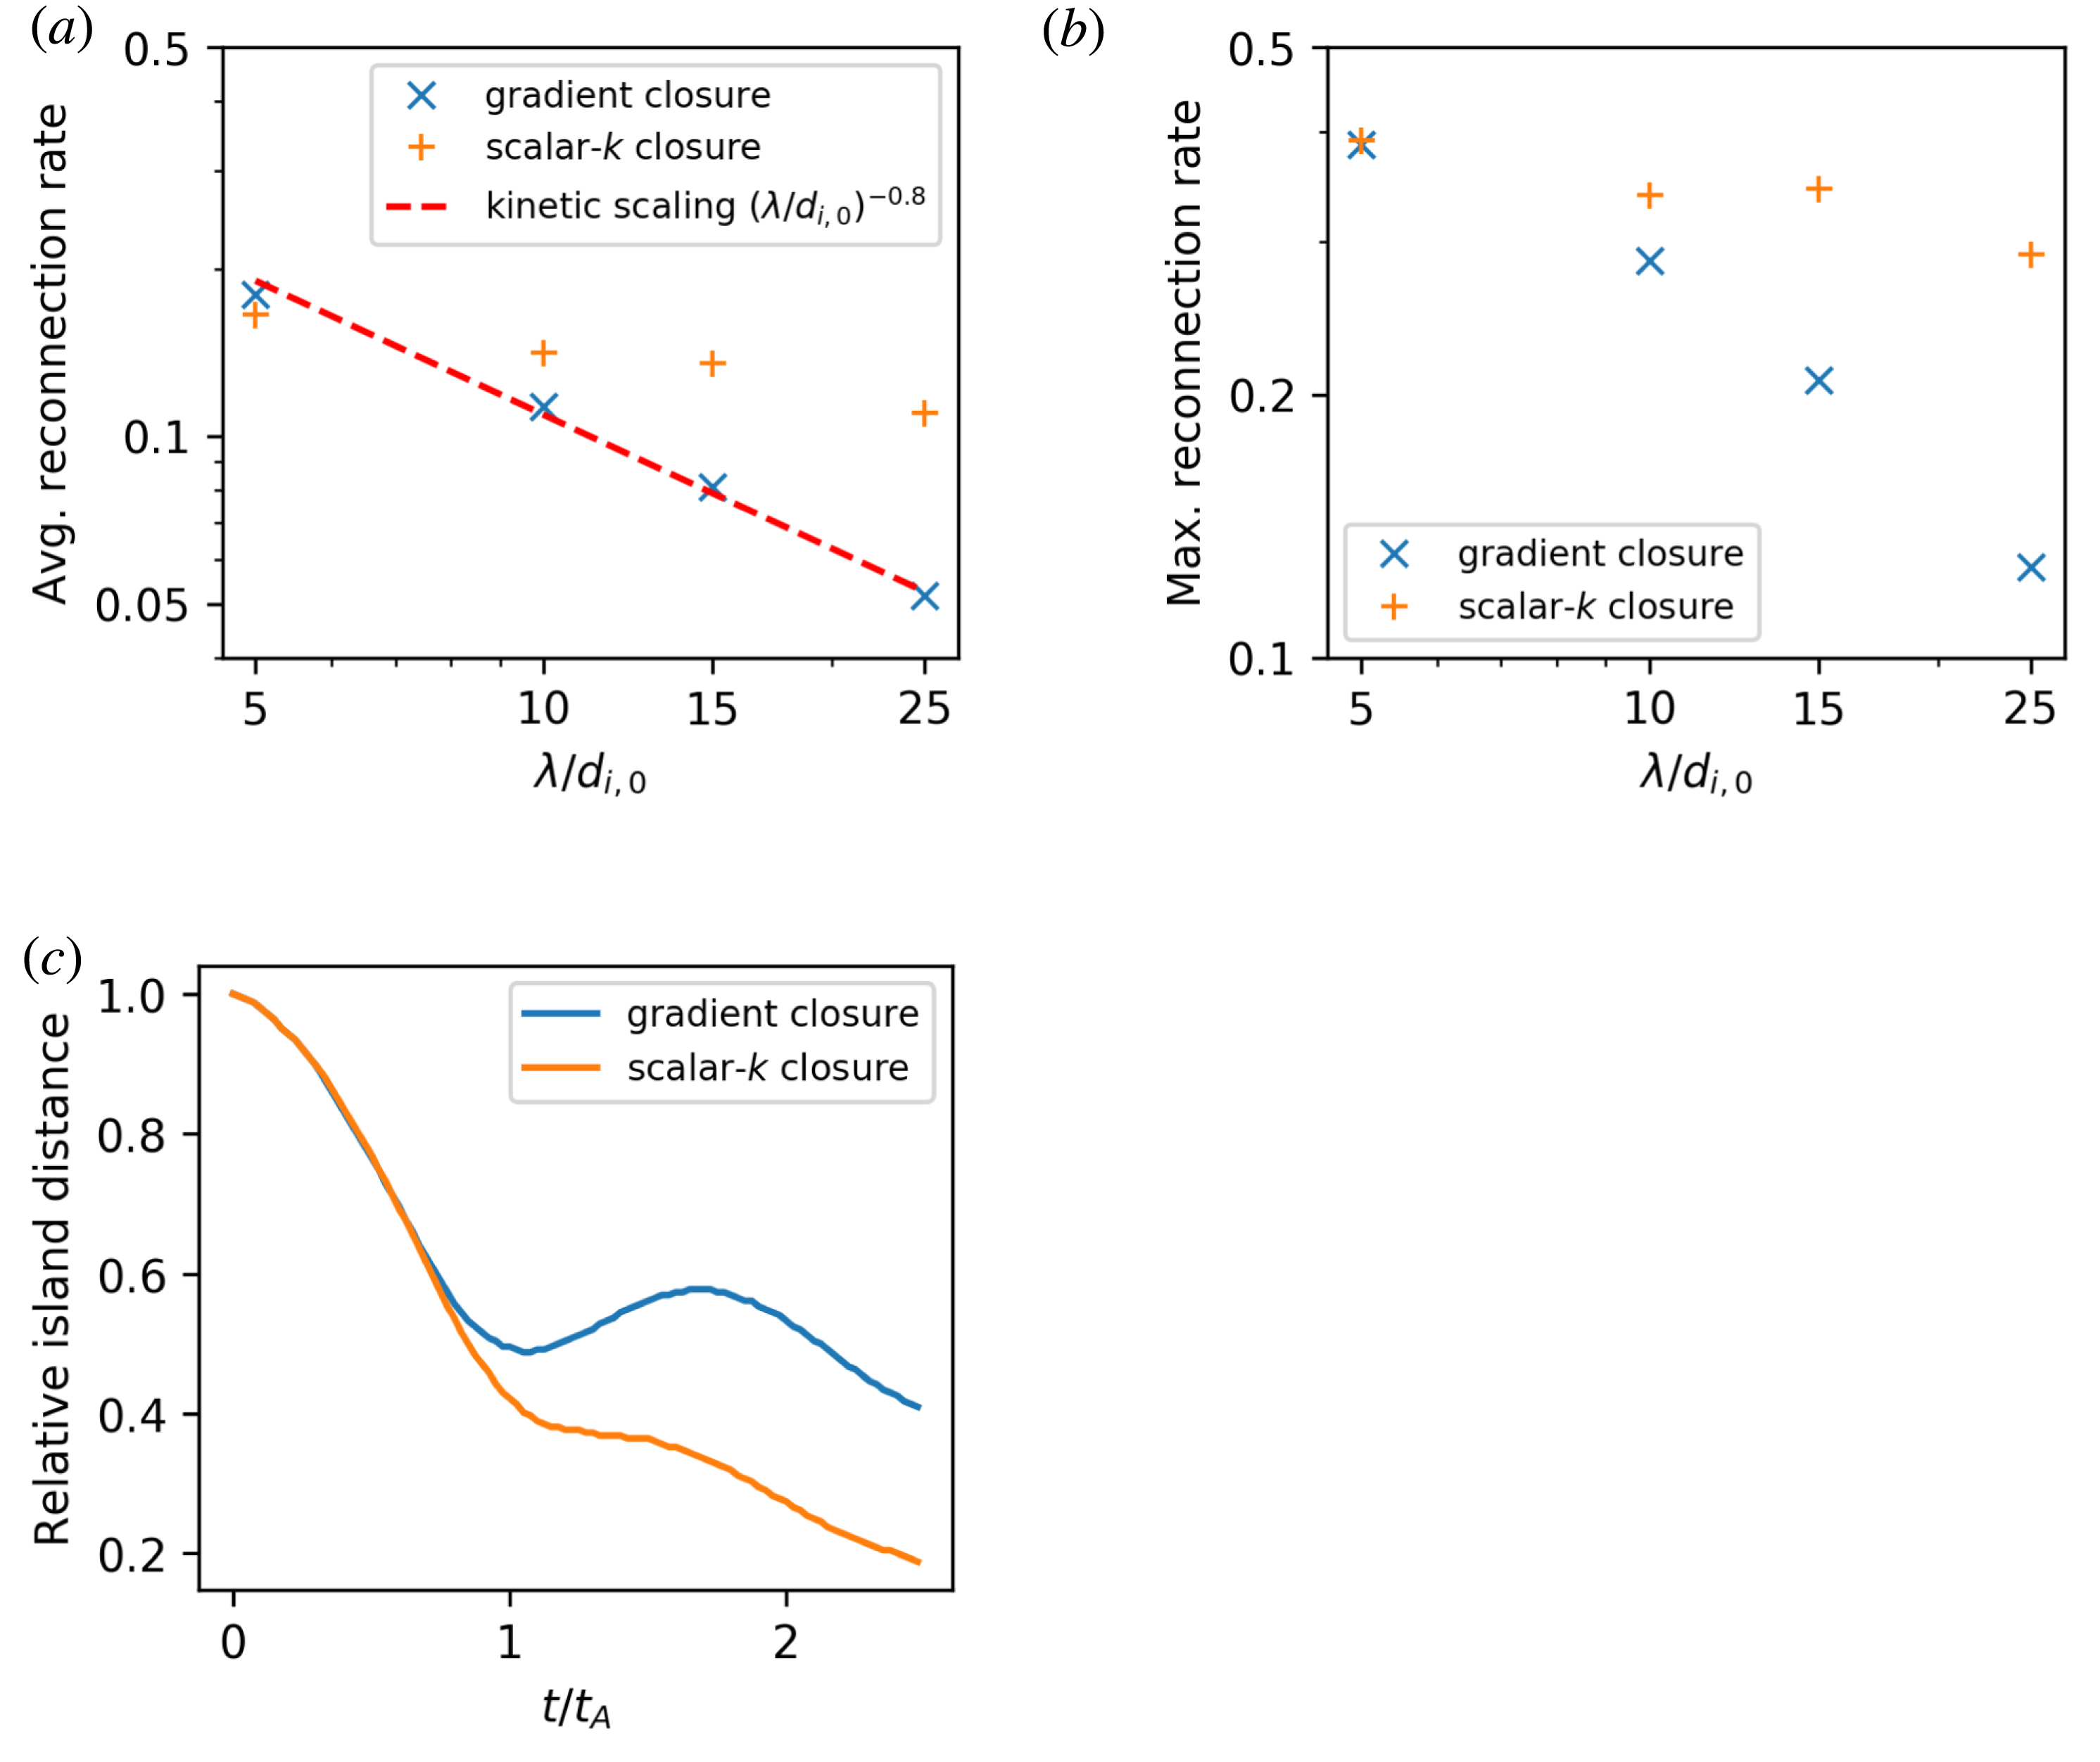
. The average reconnection rate (average taken from 0 to
 $1.5t_{A}$
) is displayed in figure 9(a) and scales as
 $(\unicode[STIX]{x1D706}/d_{i,0})^{-0.73}$
which is almost identical to the kinetic scaling. Scaling of the maximum reconnection rate is much stronger than with the scalar-
 $k$
closure as well (figure 9
b). There is no formation of secondary islands. Due to the lower reconnection rates, islands now bounce, as can be seen in figure 9(c). The out-of-plane current
 $j_{z}$
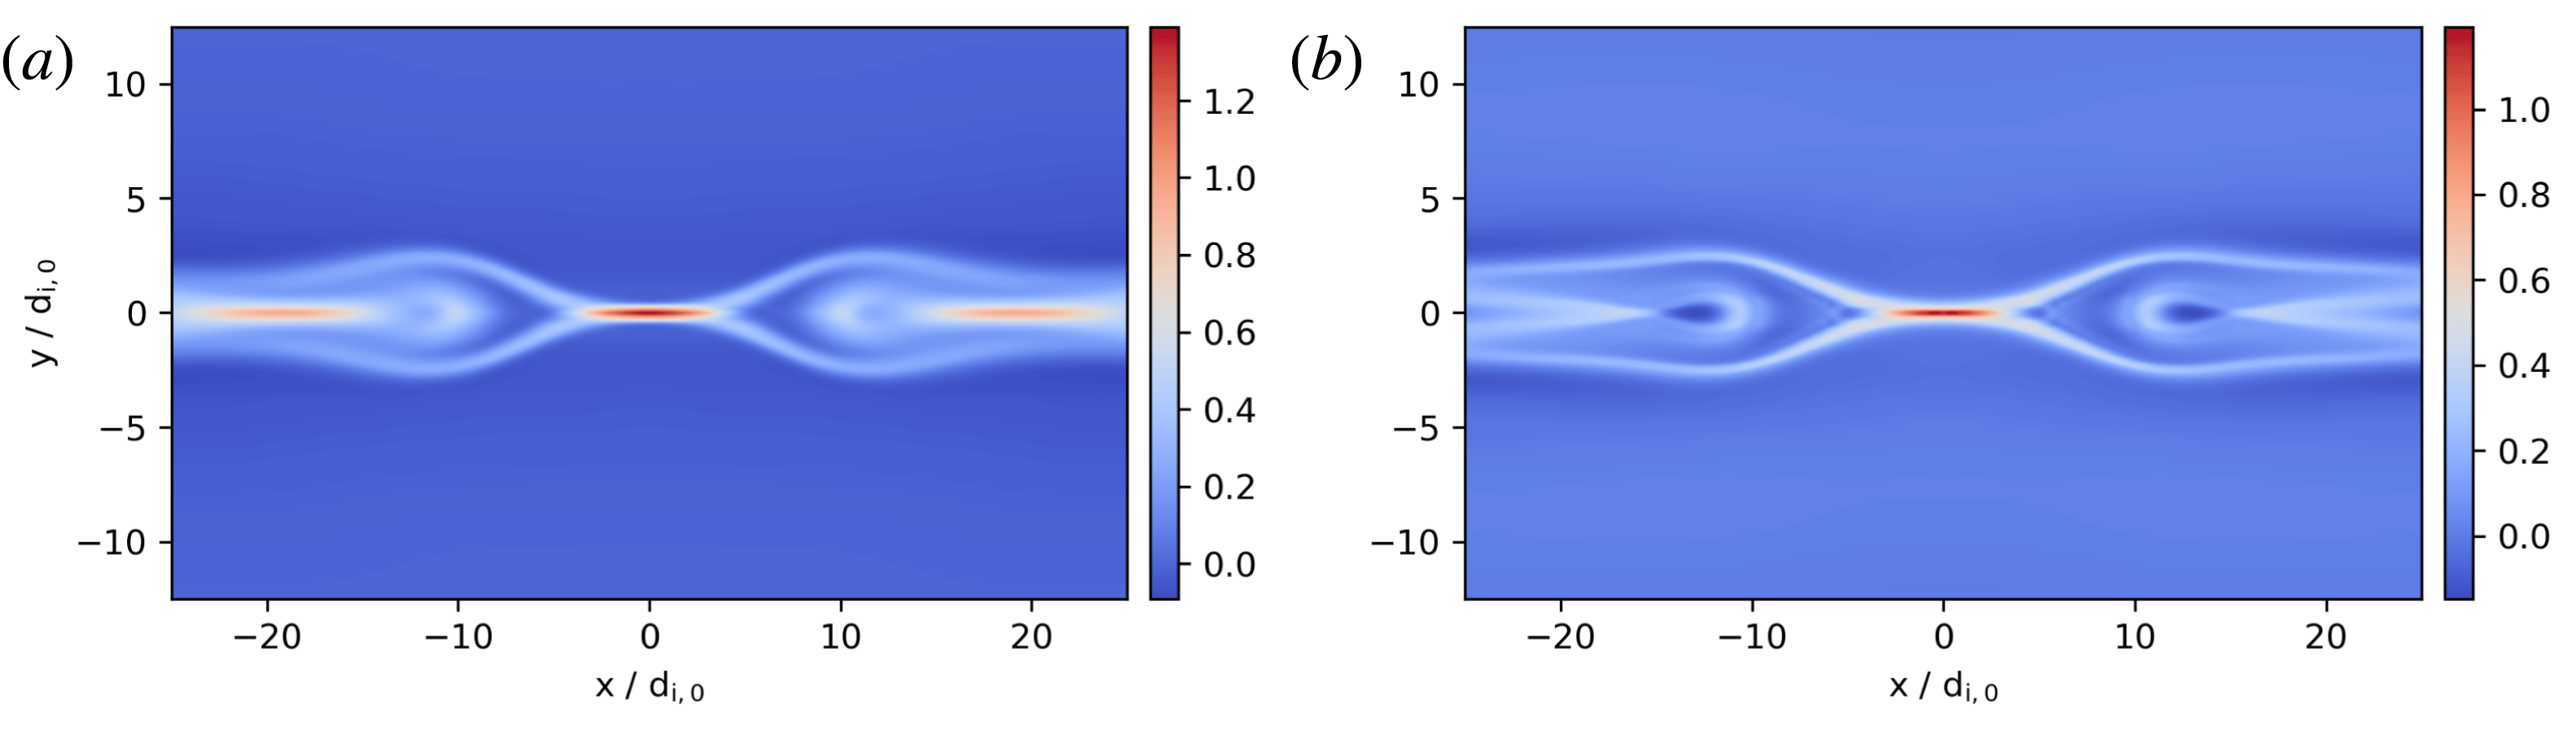
is displayed in figure 8 for both closures. The current sheet and the island’s oval form in the gradient simulation are similar to results from kinetic simulations (see the movie in the supplemental material of Stanier et al.
Reference Stanier, Daughton, Chacón, Karimabadi, Ng, Huang, Hakim and Bhattacharjee2015).
The island coalescence set-up at
 $t=t_{A}$
for
 $\unicode[STIX]{x1D706}=25d_{i,0}$
. Scalar-
 $k$
closure (a) and gradient closure (b).

Coalescence of magnetic islands. (a) Scaling of the average reconnection rate with the size parameter
 $\unicode[STIX]{x1D706}$
for both closures next to the scaling found by Stanier et al. (Reference Stanier, Daughton, Chacón, Karimabadi, Ng, Huang, Hakim and Bhattacharjee2015) in kinetic PIC simulations which was
 $\propto (\unicode[STIX]{x1D706}/d_{i,0})^{-0.8}$
. (b) Scaling of the maximum reconnection rate. (c) Distance of the islands’ O-points relative to their initial distance for
 $\unicode[STIX]{x1D706}=15d_{i,0}$
.
Two different resolution set-ups were employed in order to show that the results do not change as long as the electron inertial length is resolved. Set-up 1 was
 $512\times 256$
cells for
 $\unicode[STIX]{x1D706}=5d_{i,0}$
,
 $1024\times 512$
cells for
 $\unicode[STIX]{x1D706}=10d_{i,0}$
and
 $\unicode[STIX]{x1D706}=15d_{i,0}$
and
 $2048\times 1024$
cells for
 $\unicode[STIX]{x1D706}=25d_{i,0}$
. Set-up 2 had a resolution of
 $2048\times 1024$
cells for all simulations. Both average and maximum reconnection rates of the gradient closure runs were alike for the two set-ups, as can be seen in table 1. There were also no differences concerning the current sheet width and the overall shape of the islands.
Reconnection rates in the island coalescence set-up (gradient closure) using different resolutions. Columns 2 and 3 show the same data as figure 9(a).
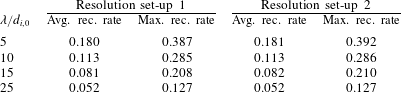
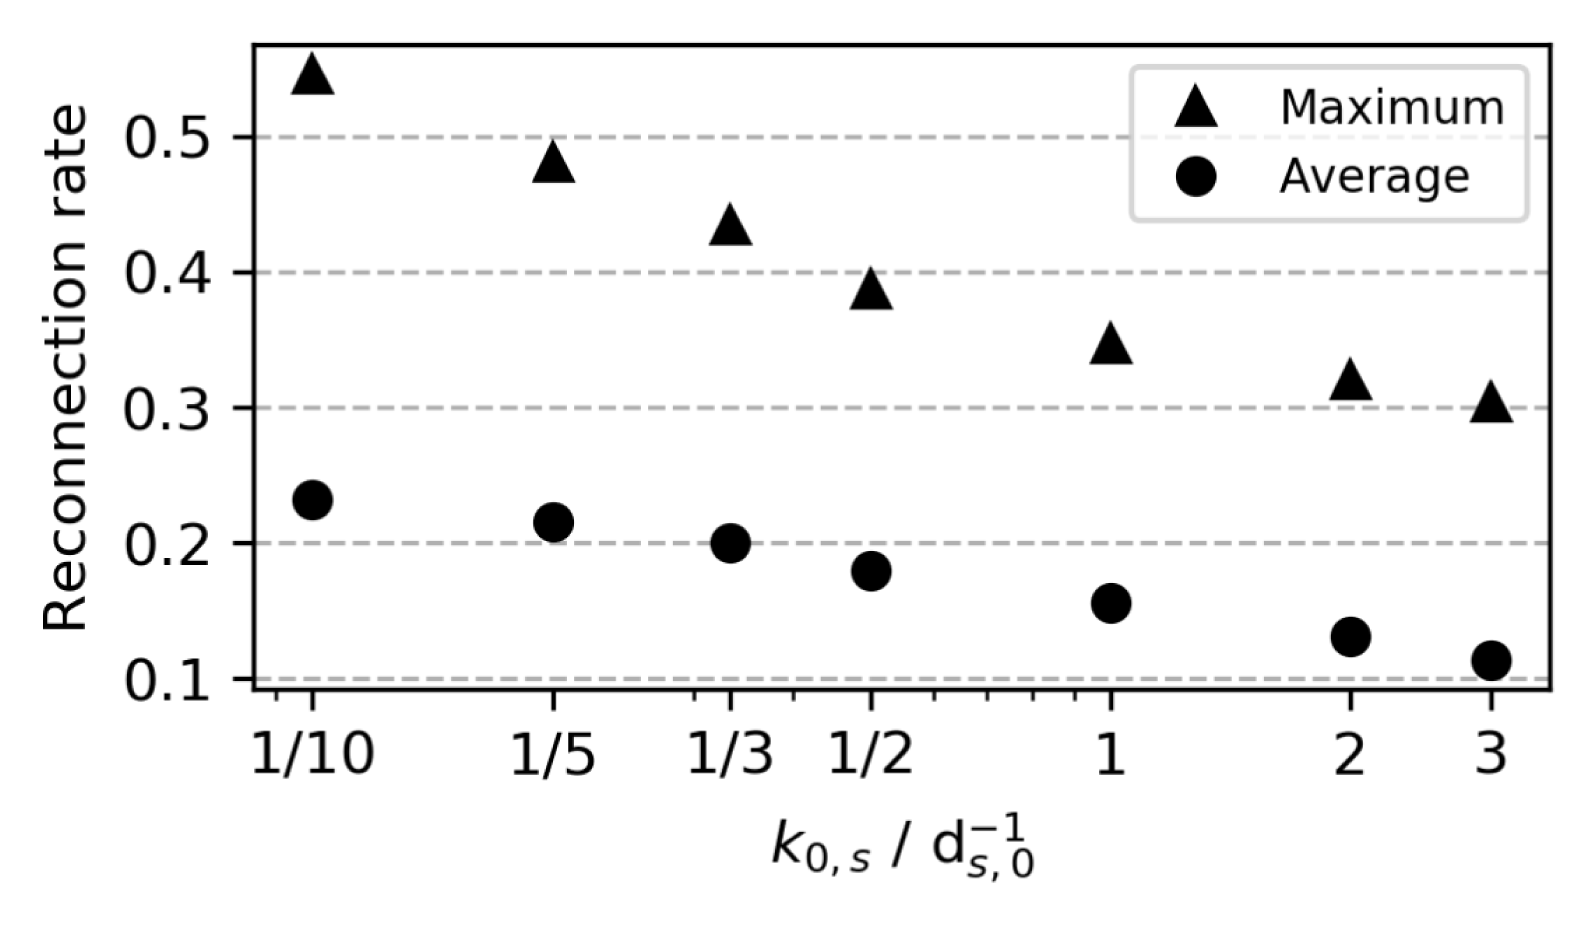
Figure 10 shows how the reconnection rate is affected by the choice of
 $k_{0}$
for
 $\unicode[STIX]{x1D706}=5d_{i,}$
. A higher amount of heat flux (small
 $k_{0}$
) leads to faster reconnection. The scaling of the reconnection rate with
 $\unicode[STIX]{x1D706}$
depends on
 $k_{0}$
as well.
 $k_{0}$
was chosen so that the reconnection rates agree with the kinetic results which automatically implied the correct kinetic scaling concerning the domain size. This indicates that there are kinetic effects that are handled appropriately by the closure.
Island coalescence set-up in gradient closure simulations: reconnection rates dependent on
 $k_{0}$
for a fixed domain size (
 $\unicode[STIX]{x1D706}=5d_{i,0}$
).
8.4 Numerics
The Laplacian in the closure was computed explicitly by means of finite differences. Therefore, instabilities are enhanced and a smaller time step is needed. Time step restrictions increase with higher resolution. For now, this has been circumvented by subcycling the computation of the Laplacian. Since the domain has to be split up into blocks for parallelization, and since boundaries are not exchanged in between the subcycles (for performance reasons), inaccuracies occur at these borders. Furthermore, the velocities and densities needed to compute pressure from the second moment are not updated between the subcycles, which has little influence however. A comparison of a subcycled version of the WHBG set-up with one without subcycling shows that globally there is no difference and that the approximation is acceptable when used thoughtfully. A more sophisticated solution to the time step problem is left to future work.
9 Conclusion
Following an analysis of kinetic heat flux data, a closure to the ten moment fluid equations is presented which approximates the heat flux tensor as
 $$\begin{eqnarray}\unicode[STIX]{x2202}_{m}\unicode[STIX]{x1D618}_{ijm}=-\frac{v_{t}}{|k_{0,s}|}\unicode[STIX]{x1D6FB}^{2}(\unicode[STIX]{x1D617}_{ij}-p\unicode[STIX]{x1D6FF}_{ij}),\end{eqnarray}$$
with the free parameter
 $k_{0,s}$
(a typical wavenumber) and
 $p=(\unicode[STIX]{x1D617}_{xx}+\unicode[STIX]{x1D617}_{yy}+\unicode[STIX]{x1D617}_{zz})/3$
. Suitable values for
 $k_{0,s}$
in magnetic reconnection are
 $3/d_{s,0}$
in the GEM set-up,
 $(1/3)/d_{s,0}$
in the WHBG set-up and
 $(1/2)/d_{s,0}$
in island coalescence.
The derivation of (9.1) used findings of Hammett & Perkins (Reference Hammett and Perkins1990) and Wang et al. (Reference Wang, Hakim, Bhattacharjee and Germaschewski2015). The approximations made were motivated by a test of the original one-dimensional Hammett–Perkins approach along magnetic field lines. The new closure was tested in three different reconnection set-ups and the results agreed well with kinetic Vlasov and PIC simulations in all cases. Good results were achieved in the coalescence of magnetic islands where fluid models were unsuccessful before. Including the pressure gradient is supposed to improve the approximation of kinetic effects like Landau damping so that the fluid equations can replace expensive kinetic computations. This way, simulations of large spatial scales like the Earth’s magnetotail become within reach.
Future work includes further investigation of the free parameter because currently it has to be determined from experiments and a comparison with kinetic simulations. The focus should be on the effect of different set-ups since the free parameter appears to be specific to the specific problem. Another approach would be to couple the fluid code to Vlasov computations in order to adaptively adjust the free parameter. From a technical point of view, more elaborate solutions to the time step restrictions caused by the Laplacian will be needed.
Acknowledgements
We acknowledge helpful suggestions by the referees. F.A.R. appreciated the discussions with S. Lautenbach and J. Dreher. Computations were conducted on the Davinci cluster at TP1 Plasma Research Department and on the JURECA cluster at Jülich Supercomputing Centre under the project number HBO43.



