INTRODUCTION
Jellyfish blooms have become a worldwide environmental concern (Mills, Reference Mills2001; Purcell et al., Reference Purcell, Uye and Lo2007), which can influence ecosystem food webs through either bottom-up or top-down control, or both (Purcell et al., Reference Purcell, Uye and Lo2007). Blooms can also affect the carbon, nitrogen and phosphorus cycling of the ecosystem and have even been related to the phenomenon of hypoxia in some regions (Pitt et al., Reference Pitt, Welsh and Condon2009a; West et al., Reference West, Welsh and Pitt2009; Shoji et al., Reference Shoji, Kudoh, Takatsuji, Kawaguchi and Kasai2010). In the light of their fast ‘coming and going’ and the diversity of the dominant species, understanding the true mechanism driving their lives is really not easy, especially when most of them have complex life histories (Lucas, Reference Lucas2001).
According to Pauly et al. (Reference Pauly, Graham, Libralato, Morissette and Deng Palomares2009), jellyfish species are subject to bottom-up control from their forage base rather than top-down controls from predators, suggesting that study on the foraging behaviour of them is very important. Feeding ecology of jellyfish has been studied using gut content analysis and grazing experiments (Sullivan et al., Reference Sullivan, Garcia and MacPhee1994; Graham & Kroutil, Reference Graham and Kroutil2001; Mutlu, Reference Mutlu2001; Zavolokin et al., Reference Zavolokin, Glebov and Kosenok2008). Zooplanktons (e.g. copepods and amphipods), fish larvae, and larval squids were reported to be potential diet items of jellyfish (Mutlu, Reference Mutlu2001; Zavolokin et al., Reference Zavolokin, Glebov and Kosenok2008). However, gut content analysis can only distinguish items visible and retained in the gut for a longer time, possibly resulting in information loss or even bias. For instance, the contribution of microzooplanktons which did not leave visible remains in the gut was always easily neglected (Sullivan et al., Reference Sullivan, Garcia and MacPhee1994). Furthermore, the results of gut content analysis only suggest the most recent feeding of the predator, so extensive spatial and temporal sampling is required to provide a robust analysis (Pitt et al., Reference Pitt, Connolly and Meziane2009b). Bodies of jellyfish are very delicate, making them difficult to handle in grazing experiments. In addition, there are always large differences between human-controlled conditions and natural conditions that make the results of the grazing experiments questionable (Pitt et al., Reference Pitt, Connolly and Meziane2009b). According to Purcell (Reference Purcell2009), the feeding rate of gelatinous species has often been underestimated by grazing experiments performed in artificial containers.
Stable isotope and fatty acid biomarkers have been used to identify diet sources and the trophic positions of zooplanktons and fishes (Stübing et al., Reference Stübing, Hagen and Schmidt2003; Estrada et al., Reference Estrada, Lutcavage and Thorrold2005), to identify food web structures (Waite et al., Reference Waite, Muhling, Holl, Beckleyb, Montoyac, Strzeleckie, Thompsond and Pesantet2007; Petursdottir et al., Reference Petursdottir, Gislason, Falk-Petersen, Hop and Svavarsson2008), and to trace carbon flow within the marine food web (Budge et al., Reference Budge, Wooller, Springer, Iverson, McRoy and Divokyet2008). However, study involving gelatinous zooplankton using these tracers is relatively rare. Fatty acid composition and specific fatty acids can also help to elucidate trophic relationships in the food web based on the fact that some fatty acids can only be synthesized de novo by special organisms and then transferred to the next trophic level unchanged or changed in an expected way (Iverson, Reference Iverson, M.T., Brett and Kainz2008; Pitt et al., Reference Pitt, Connolly and Meziane2009b). For instance, fatty acids with an odd number of carbon atoms (C15:0 and C17:0) or branched chain were seen as markers of microbes such as bacteria (Iverson, Reference Iverson, M.T., Brett and Kainz2008). Zooplanktons, especially calanoid copepods, were thought to be the only source of C20:1 (n-11 and n-9) and C22:1 (n-11 and n-9) (Kattner & Hagen, Reference Kattner, Hagen, M.T., Brett and Kainz2008).
In China, the Bohai Sea, Yellow Sea and East China Sea are regions where jellyfish blooms occur frequently (Zhang et al., Reference Zhang, Sun and Li2009). Previous researches mainly focused on the distribution, species composition and community characteristics of jellyfishes in Chinese waters (Cheng et al., Reference Cheng, Ding, Li, Yan, Ling, Li and Liu2005; Zhang et al., Reference Zhang, Sun and Yang2005). Only one preliminary study of feeding behaviour of a ctenophore has been reported (Zheng & Qiu, Reference Zheng and Qiu1990). No research on the trophic ecology of the macro jellyfish in China has been reported before. It is urgent to identify the feeding ecology of macro jellyfish in Chinese waters in order to provide more information about the ecological role of this organism in the marine system, which is helpful to predict and monitor the formation of jellyfish blooms in the future.
In this study, we used stable isotope and fatty acid analysis to investigate the potential dietary sources of the jellyfishes and to identify possible shifts in diet during their growth in order to investigate the trophic role of jellyfishes in the Yellow Sea. Furthermore, potential factors influencing the stable carbon and nitrogen isotope values and fatty acid compositions of the jellyfishes were also investigated in this study.
MATERIALS AND METHODS
Sampling
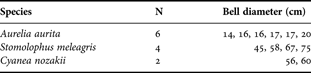
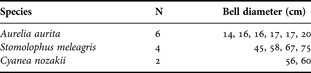
Three dominant jellyfish species present in Chinese waters (Aurelia aurita, Stomolophus meleagris and Cyanea nozakii), were collected from the Yellow Sea (36.0°N–36.5°N 121.5°E–124.5°E) in August 2009. Jellyfish samples were collected by bottom trawl. Bell diameters were measured immediately (Table 1). Bodies of jellyfishes were rinsed carefully with filtered seawater and the guts were removed to reduce bias. The whole specimens of A. aurita and C. nozakii were sealed in plastic bags. Specimens of S. meleagris were divided into bells and oral arms; the two parts were sealed in separate plastic bags. Seston and zooplankton samples were collected at the same cruise. Approximately 3 l of seawater was filtered first through a 200 µm net, and then filtered on a pre-combusted GF/F 47 mm filter (0.7 µm, Whatman, 500°C, 5 hours) to collect seston samples. Zooplanktons were collected by plankton trawl (mesh size 77 µm), and then copepods were separated out. All samples were immediately frozen and stored at –20°C until lyophilized with a freeze-dryer (LOC-1, Christ, Germany). The dry samples were stored at –40°C until further analysis.
Sampled species, numbers and body sizes of jellyfishes in the Yellow Sea. Body size is described as bell diameter. N, number of samples analysed.
Stable carbon and nitrogen isotope analysis
Plankton samples were digested with acid (1 M HCl) to remove carbonates and dried at 60°C for 12 hours. Organic carbon and total nitrogen were analysed by an elemental analyser (Vario EL III, Elementar, Germany). Stable carbon and nitrogen isotopes were measured by an isotope-ratio mass spectrometer (Finnegan Delta plus XP, Thermo, Germany). Lipids were not removed prior to measurements. Results were normalized to PDB for δ13C and air standard for δ15N, and expressed in δ notation as: δX (‰) = ((Rsample/Rstandard) − 1) × 1000, where X = 13C or 15N, and R = 13C:12C or 15N:14N. Precision of δ13C and δ15N analysis was ± 0.1‰.
Lipid extraction and fatty acid composition analysis
Lipids were extracted from the freeze-dried samples with dichloromethane and methanol (2:1, with 0.01% BHT) according to a reduced-solvent Folch method for total lipid determination (Iverson et al., Reference Iverson, Lang and Cooper2001). For jellyfish samples, an approximate 5 ml chloroform and methanol (2:1, with 0.01% BHT) solvent was added to each 1 g sample. The mixture was vortex-mixed, then ultrasonically extracted for 10 minutes, and centrifuged at 3000 rpm for 10 minutes. The upper extract was gathered and the residue was re-extracted twice. All extracts were combined and evaporated to dryness with nitrogen to obtain the total lipid. For seston and zooplankton samples, the entire procedure was similar except the weight of the samples used for analysis was adjusted accordingly.
Transesterification of fatty acids to fatty acid methyl esters (FAMEs) with 5% methanolic hydrochloric acid was carried out at 50°C overnight (Eder, Reference Eder1995). Approximately 2 ml hexane and 4 ml methanol (containing 5% HCl) were added to the extract. The mixture was transferred to a tube, and heated at 50°C for approximately 12 hours. After cooling, 1 ml milli-Q water was added. FAMEs were extracted with hexane (using three repetitions) and analysed on a gas chromatograph (GC, CP3800, Varian, USA) equipped with a DB-FFAP capillary column (30 m length × 0.25 mm i.d. × 0.25 µm film thickness, Agilent, USA). C21:0 was added to the sample as an internal recovery standard. C19:0 methyl ester was added as an internal quantification standard. The GC was programmed from 60°C to 170°C at 30°C min−1, held 5 minutes, followed by 170°C to 220°C at 1°C min−1, and finally held at 220°C for a further 10 minutes. Nitrogen was used as a carrier gas and the flow was 1 ml min−1. Injector and FID temperature were both set at 250°C. FAMEs were identified by comparison of retention times with commercial standards (37 Component FAME Mix, SupelcoTM). GC-MSD (7890A GC with 5975C MSD, Agilent, USA) was used to confirm the identification, operating at 70 eV with mass range acquisition of 50–700 amu. The column and temperature program for GC-MS were same as those used in GC-FID analysis, with helium used as a carrier gas (1 ml min−1) and injector temperature of 250°C. The MS Quad and MS source temperature was set at 150°C and 230°C, respectively.
All of the operations were performed in glassware to avoid contamination. Data regarding fatty acids are expressed as a mass percentage of total fatty acids. The recovery rate of the whole analysis procedure for fatty acids was in the range of 78.1–94.9%. Standard deviations of individual fatty acid proportions of replicate analyses were lower than 0.7%. If more than one sample was analysed, the data were shown in average ± standard deviation (SD). Fatty acids were named using shorthand notation of CA:Bn-X, where A indicates the number of carbon atoms, B is the number of double bonds and X indicates the position of the first double bond relative to the terminal methyl group (Budge et al., Reference Budge, Iverson and Koopman2006). If not stated specifically, concentrations of C20:1 and C22:1 are the sum of their isomers of n-11 and n-9.
Statistical analysis
SPSS17.0 and PRIMER5.0 were used to perform data analysis. Differences of δ13C and δ15N values among the species and between the organs were analysed by one-way analysis of variance with SPSS17.0. Analysis of similarity (ANOSIM) of fatty acid compositions of jellyfishes was performed using PRIMER5.0 (Budge et al., Reference Budge, Wooller, Springer, Iverson, McRoy and Divokyet2008). Then, similarity of percentages (SIMPER) was performed to examine the contribution of fatty acids to the Bray–Curtis dissimilarity between samples. Cluster analysis based on the fatty acid compositions of jellyfishes was also done by PRIMER5.0. Values of fatty acids reported in the form of mass % of total fatty acids were root-square transformed to achieve normalization before being used in multivariate analysis (Iverson, Reference Iverson, M.T., Brett and Kainz2008). Relationships between biomarkers were tested using bivariate correlations analysis with SPSS17.0. In light of the limited sample numbers, spearman correlation coefficients (i.e. rs) and P (two-tailed) were used to evaluate the significance of the correlation.
RESULTS
Stable carbon and nitrogen isotope signatures of jellyfishes
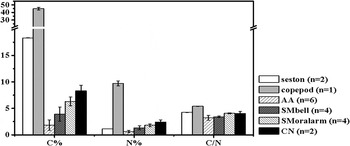
Carbon contents (% of dry weight) of the jellyfishes were much lower than those of the planktons (Figure 1). The C/N ratios of the jellyfishes were in the range of 3.1 to 4.2, a little lower than those of the planktons, which were 4.2 to 5.4. For A. aurita, C/N ratios had a positive relationship with body size (rs = 0.967, P = 0.033). But as far as S. meleagris was concerned, no significant relationship existed between the C/N ratio and body size.
Carbon, nitrogen contents (% of dry weight ±SD) and C/N ratios (±SD) of the samples analysed. AA, Aurelia aurita; SM, Stomolophus meleagris; CN, Cyanea nozakii; n, number of samples used in analysis.

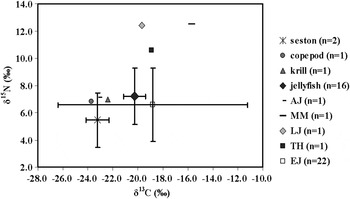
The δ13C and δ15N values of seston and copepod samples were in the range of −23.7‰ to −22.4‰ and 5.5‰ to 7.0‰, respectively. The δ13C and δ15N values of the three jellyfish species were −22.0‰ to −17.4‰ and 4.8‰ to 10.6‰, respectively. Significant differences existed among the organs of S. meleagris and between species. For example, the average δ13C value of bells of S. meleagris was 2.0‰ heavier than that of the oral arms (P < 0.01). The average δ15N value of A. aurita was about 3‰ higher than S. meleagris, a significant difference (P < 0.01). For A. aurita, both δ13C and δ15N values decreased as body size increased. The δ13C values for individuals 14 cm in size were about 0.4‰ higher than that of the 20 cm individuals.
Fatty acid compositions and specific fatty acids of jellyfishes
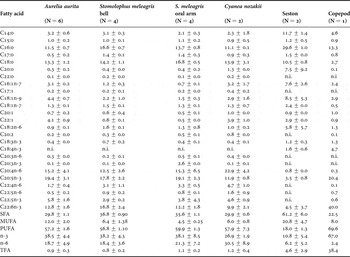
Fatty acid compositions of the samples analysed in this study are presented in Table 2. For jellyfishes, polyunsaturated fatty acids (PUFAs) were the most abundant compounds, accounting for 56.8% to 59.9% of the total fatty acids. Major PUFAs were C20:4n-6 (AA), C20:5n-3 (EPA) and C22:6n-3 (DHA), which accounted for 44.7% to 47.4% of total fatty acids. Monounsaturated fatty acids (MUFAs) consisted mostly of C16:1n-7, C18:1(n-9 and n-7), C20:1 and C22:1. One-way ANOSIM was performed for fatty acid compositions of the three species of jellyfishes. The results (ANOSIM, R = 0.843, P = 0.001) suggested that fatty acid compositions of the three species were significantly different. C20:4n-6, C20:5n-3, C22:6n-3, C22:1, C16:0, C18:0 and C18:1n-9 were the fatty acids that contributed most to the Bray–Curtis dissimilarity among the groups (SIMPER). No significant difference was found between the fatty acid compositions of bells and oral arms of S. meleagris (ANOSIM, R = 0.444, P = 0.100).
Fatty acid compositions of jellyfishes, seston and copepods (mass % total fatty acids). Data are shown in average ±SD (n.i., not identified). Only fatty acids >0.1% are shown. N, number of samples analysed; SFA, saturated fatty acid; MUFA, monounsaturated fatty acid; PUFA, polyunsaturated fatty acid; n-3, sum of unsaturated fatty acids with the first double bond starting after the third carbon atom relative to the terminal methyl group; n-6, sum of unsaturated fatty acids with the first double bond starting after the sixth carbon atom relative to the terminal methyl group; TFA, total fatty acids (unit: mg g−1 dry weight).

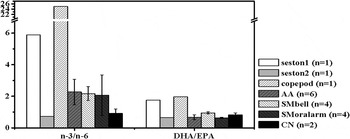
Fatty acids with more than 20 carbon atoms and more than three double bonds were identified as highly unsaturated fatty acids (HUFAs) (Bell & Tocher, Reference Bell, Tocher, M.T., Brett and Kainz2008). Fatty acid compositions of seston samples were characterized by high SFA concentration (61.2 ± 6.0%) and very low HUFA concentration (6.7 ± 3.1%). There were higher levels of C18:2n-6, C18:3n-3 and monounsaturated fatty acids such as C16:1n-7 and C18:1(n-9 and n-7) in the seston samples than in the jellyfishes. Copepods were characterized by high C20:5n-3 and C22:6n-3 concentrations. Compared with seston and copepods, jellyfishes contained moderate amounts of C20:5n-3 and C22:6n-3, but extraordinarily high levels of C20:4n-6. The n-3/n-6 ratio of copepods was as high as 25.0; the ratios for jellyfishes were between 0.9 and 2.3 (Figure 2). The DHA/EPA ratio of copepods was 2.0, also higher than the value of jellyfish (0.6–0.9).
Polyunsaturated fatty acid ratios (n-3/n-6 and DHA/EPA, ±SD) of samples analysed. AA, Aurelia aurita; SM, Stomolophus meleagris-bell; CN, Cyanea nozakii. The values of two seston samples were significantly different, so they were shown independently. n, number of samples used in analysis.

Bivariate correlation analysis was performed to analyse the relationship between some biomarkers in jellyfishes. The δ15N had a significant positive relationship with C20:1 + C22:1 (rs = 0.717, P = 0.020), but a negative relationship with C18:1n-7/n-9 (rs = −0.742, P = 0.014). C15:0 + C17:0 had a significant positive relationship with C18:1n-7/n-9 (rs = 0.745, P = 0.013), and a negative relationship with C20:1 + C22:1 (rs = −0.818, P = 0.004).
DISCUSSION
Trophic levels of jellyfishes
The δ13C and δ15N values of the jellyfishes were compared with those of planktons and fishes to estimate the trophic levels of the jellyfishes (Figure 3). According to Michener & Kaufman (Reference Michener, Kaufman, Michener and Lajtha2007), marine animals are 0.5–1‰ enriched in carbon isotope ratios relative to their diet and 3.2‰ enriched in nitrogen isotope ratios through the food web, independent of habitat. But δ15N values might display more uncertainty in relation to the shift per trophic level (Pitt et al., Reference Pitt, Clement and Connolly2008). Average δ13C values for jellyfishes were about 2.8‰ heavier than copepods, close to what Malej et al. (Reference Malej, Faganeli and Pezdifi1993) reported (~2‰ for zooplankton), indicating the enrichment of the heavy isotopes in the jellyfishes relative to copepods. The stable carbon isotopic ratios of jellyfishes were higher than those of planktons and lower than those of Japanese anchovy and high level carnivorous fishes. Compared with fishes in the Yellow Sea (Cai et al., Reference Cai, Li, Tang and Sun2005; Wan et al., Reference Wan, Wu, Huang, Zhang, Gao and Wang2010), the average δ15N values for jellyfishes were 0.6‰ higher than Japanese anchovy, but about 3‰ to 5‰ lower than those for carnivorous fishes (e.g. Miichthys miiuy, Lateolabrax japonicas and Trichiurus haumela). We expected that the trophic level of the jellyfishes was higher than that of seston, close to those of Japanese anchovy, and lower than those of carnivorous fishes.
The δ13C versus δ15N plot of samples analysed in this study and adapted from the published literature. Data are shown as average tSD; if more than one sample was analysed. Krill, Euphausia pacifica; AJ, Anguilla sp. (juvenile); MM, Miichthys miiuy; LJ, Lateolabrax japonicus; TH, Trichiurus haumela; EJ, Engraulis japonicus. The value for E. pacifica is from unpublished data. Data for the Anguilla sp. juvenile, M. miiuy, L. japonicus and T. haumela are adapted from Cai et al. (2005). Data for E. japonicus are adapted from Wan et al. (2010). n, number of samples used in analysis.

The fatty acids ratio can be also applied to estimate the trophic level of aquatic species. For instance, marine fish have higher n-3/n-6 ratios than freshwater fish and the ratios are higher in carnivorous fish than in herbivorous and omnivorous fish (Olsen, Reference Olsen and Wainman1999; Ahlgren et al., Reference Ahlgren, Vrede, Goedkoop, M.T., Brett and Kainz2009). The n-3/n-6 ratios of the jellyfishes (0.9–2.3) were lower than those of marine fishes (2.7–12.6) (Bayir et al., Reference Bayir, Haliloglu, Sirkecioglu and Aras2006), which indicated that the trophic levels of the jellyfishes were lower than most marine fishes. Although the jellyfishes contained about 90% wet weight water (Larson, Reference Larson1986; Zheng et al., Reference Zheng, Chen and Ni2010), some organisms in the ocean (e.g. turtles) have been reported to feed on scyphozoan jellyfishes (Graham, Reference Graham2009), which indicated that the nutrient of jellyfish can be transferred to higher trophic level.
Potential diet sources of jellyfishes in the Yellow Sea
The C/N ratio of terrestrial plants is normally >20 and those of algae, bacteria and fungi are in the range of 4 to 10 (Meyers, Reference Meyers1997). The C/N ratio (4.3 ± 0.0) and δ13C and δ15N values (−23.2 ± 0.9‰ and 5.5 ± 2.0‰) of seston samples indicated that seston in the study area mainly consisted of marine-origin organisms. Stable isotope analysis has previously been applied to the study of the trophic ecology of jellyfishes (e.g. Pelagia noctiluca and Catostylus mosaicus). Copepods especially emergent demersal zooplanktons were found to be the dominant diet of the jellyfishes (Malej et al., Reference Malej, Faganeli and Pezdifi1993; Pitt et al., Reference Pitt, Clement and Connolly2008). The range of δ13C values for jellyfishes (−22.0‰ to −17.4‰) suggested that they mainly depended on marine-origin carbon even though they were collected at stations near the coast. No significant difference of δ13C was found among these three jellyfish species, indicating no significant differences in their basic carbon source. However, δ15N values for A. aurita were almost 3‰ higher than S. meleagris, indicating that the prey of the two species of jellyfishes had different δ15N values.
Fatty acid composition and specific fatty acids are useful in identifying sources that may share similar stable isotope signatures and can also help to estimate the contributions of microzooplanktons, bacteria or detritus to the diet, which are difficult to discern using traditional methods (Pitt et al., Reference Pitt, Connolly and Meziane2009b). The fatty acid composition of the Artemia-fed Aurelia aurita has been found to reflect the fatty acid composition of the food they ingested, which confirmed the feasibility of fatty acids as trophic markers for jellyfish research (Fukuda & Naganuma, Reference Fukuda and Naganuma2001). The C20:1 + C22:1 concentration in jellyfish was in the range of 1.0% to 4.9%, indicating that copepods were a potential food source for them either through direct predation on copepods or indirect ingestion through feeding on their predators (Nelson et al., Reference Nelson, Phleger, Mooney and Nichols2000; Kattner & Hagen, Reference Kattner, Hagen, M.T., Brett and Kainz2008). High C18:1n-9 content and a low C18:1n-7/n-9 ratio can be used as an indicator of carnivory (Nelson et al., Reference Nelson, Phleger, Mooney and Nichols2000; Brett et al., Reference Brett, Müller-Navarra, Persson, M.T., Brett and Kainz2008). 0.5 was set as threshold to distinguish herbivorous (>0.5) or carnivorous (<0.5) feeding habits of organisms using C18:1n-7/n-9 ratios (Nelson et al., Reference Nelson, Phleger, Mooney and Nichols2000; Brett et al., Reference Brett, Müller-Navarra, Persson, M.T., Brett and Kainz2008). The C18:1n-7/n-9 ratios of A. aurita and C. nozakii were both lower than 0.5, which suggested that these jellyfishes were carnivorous. However, the average ratio of S. meleagris was as high as 0.7 suggesting that they were in a lower carnivorous level than the other species. The positive relationship between the C15:0 + C17:0 and C18:1n-7/n-9 ratio indicated the similar source of C15:0 + C17:0 and C18:1n-7. Besides phytoplankton, bacteria are another potential source of C18:1n-7 through the ingestion of marine snow or sediment (Stowasser et al., Reference Stowasser, McAllen, Pierce, Collins, Moffat, Priede and Pond2009). So, the high C18:1n-7/n-9 ratios and C15:0 + C17:0 concentrations in S. meleagris may indicate the high contribution of bacteria-based detritus food to their diet.
The C18:2n-6, C18:3n-3 and C20:4n-6 were typical fatty acids of primary producers in various ecosystems (Dalsgaard et al., Reference Dalsgaard, St John, Kattner, Müller-Navarra and Hagen2003; Iverson, Reference Iverson, M.T., Brett and Kainz2008). C18:2n-6 + C18:3n-3 concentration has been used as a biomarker of terrestrial input by Budge & Parrish (Reference Budge and Parrish1998). C18:2n-6 + C18:3n-3 concentrations in jellyfishes were in the range of 1.3–2.3%, which suggested that the contribution of terrestrial organic carbon to diet of jellyfishes was limited, because a threshold of 2.5% has been assigned to the indicator, so that values above this level indicate a significant input of terrestrial material (Budge & Parrish, Reference Budge and Parrish1998; Iverson, Reference Iverson, M.T., Brett and Kainz2008). C18:1n-7 and C20:4n-6 have been used as biomarkers of benthos (Copeman & Parrish, Reference Copeman and Parrish2003; Stowasser et al., Reference Stowasser, McAllen, Pierce, Collins, Moffat, Priede and Pond2009). Many benthic organisms contain relatively high concentrations of C20:4n-6, such as echinoderms, crabs and polychaetes (Copeman & Parrish, Reference Copeman and Parrish2003; Hall et al., Reference Hall, Lee and Meziane2006; Würzberg et al., Reference Würzberg, Peters, Schüller and Brandt2011). They may accumulate C20:4n-6 by feeding on the detritus of macrophytes (Fukuda & Naganuma, Reference Fukuda and Naganuma2001). High C20:4n-6 concentrations (>10%) in jellyfishes suggested that the detritus-based benthic food chain also contributed to diet of jellyfishes analysed in this study. A study on diet of the scyphozoan jellyfish Catostylus mosaicus showed that mysid shrimp and emergent copepods contributed 79% to 100% of the carbon to the jellyfish (Pitt et al., Reference Pitt, Clement and Connolly2008). It is possible that the contribution of detritus-based benthic food chain to the jellyfish is transferred by preying on the demersal zooplankton (e.g. mysid shrimp and emergent copepods).
The C20:4n-6 may also originate from the microbial loop (Zhukova & Kharlamenko, Reference Zhukova and Kharlamenko1999), and jellyfish can accumulate this fatty acid through feeding on microzooplanktons (e.g. ciliates) in the microbial loop (Sullivan et al., Reference Sullivan, Garcia and MacPhee1994). Detritus and soft microzooplanktons (e.g. naked ciliates) have been found in diet of jellyfishes (Colin et al., Reference Colin, Costello, Graham and Higgins2005), but the relative importance of these prey in their diet has been little studied (Sullivan et al., Reference Sullivan, Garcia and MacPhee1994). Macro jellyfishes have complex life cycles, comprising an alteration of generations between asexual benthic polyps and sexual pelagic medusae (Lucas, Reference Lucas2001). It takes about six months for the polyps of jellyfish to form into the sexual pelagic phase (Li et al., Reference Li, Ling and Li2010). During this period, the polyps reside on the bottom of the sea. They display low feeding selectivity and feed on both zooplanktons and detritus (Lucas, Reference Lucas2001). C20:4n-6 taken from the benthic detritus food chain may accumulate in bodies of the jellyfishes when they are in the asexual benthic stage. Though feeding ecology of the medusa phases of some jellyfish (e.g. Aurelia aurita) has been studied, little is known about the feeding ecology of the polyps (Mills, Reference Mills2001). More study is needed to elucidate the trophic ecology of them.
The DHA/EPA ratios of jellyfishes were lower than 1. The jellyfishes accumulated more EPA than copepods and marine fish (DHA/EPA ratio: 1.20–5.88) (Bayir et al., Reference Bayir, Haliloglu, Sirkecioglu and Aras2006; Wan et al., Reference Wan, Wu, Huang, Zhang, Gao and Wang2010). The difference in EPA and DHA concentration may be due to variations in metabolic rates of the two PUFAs in jellyfishes.
Ontogenetic diet shifts during growth
Ontogenetic diet shift occurring during growth of A. aurita has been found by gut content analysis (Sullivan et al., Reference Sullivan, Garcia and MacPhee1994; Graham & Kroutil, Reference Graham and Kroutil2001). Aurelia aurita (<12 mm diameter) consumed mostly hydromedusan prey, whereas larger medusae (up to 30 mm diameter) ingested greater numbers of copepod prey (Sullivan et al., Reference Sullivan, Garcia and MacPhee1994). The medusae with sizes smaller than 12 cm targeted fewer types of prey which comprised mostly fish eggs and copepods <1 mm (i.e. slow escaping prey). Only those larger than 21 cm contained more prey items in their guts, comprising mostly small and large copepods (Graham & Kroutil, Reference Graham and Kroutil2001). These changes in prey size and species are caused by increased capture efficiency of larger medusae (Graham & Kroutil, Reference Graham and Kroutil2001). Data of A. aurita in this study were used to discuss the potential ontogenetic diet shift.
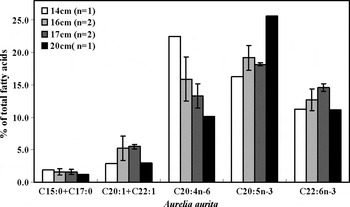
Besides dietary influences, δ13C and δ15N values may also be affected by biochemical processes. Larger animals may be enriched in heavy isotopes by selective respiration of light isotopes and due to a turnover of organic matter related to maintenance metabolism (Malej et al., Reference Malej, Faganeli and Pezdifi1993). However, δ13C and δ15N values of A. aurita both decreased as body size increased. In view of the limited number of samples in body size-groups and the minor difference in the body size, this difference may just be an intra-specific variation. Further study is needed to identify the potential relationship between body size and stable isotopes. C/N and total fatty acid (TFA) contents had a positive relationship with body size, suggesting larger individuals stored more organic carbon in the body as they grew. The fatty acid compositions of A. aurita in different body sizes were clearly distinct (ANOSIM, R = 0.154, P = 0.04). The concentrations of bacteria biomarker (C15:0 + C17:0) and macrophyte detritus biomarker (C20:4n-6) decreased as body size increased, while the copepod biomarker (C20:1 + C22:1) increased (Figure 4). The variations of these biomarkers in different body sizes indicated that the contribution of a detritus-based food chain to the diet of jellyfish decreased as body size increased and the contribution of pelagic copepods in the diet increased in larger individuals. Higher n-3/n-6 ratios (Figure 4) in larger individuals also confirmed the higher contribution of a pelagic food chain to their diet.
Selected specific fatty acids of Aurelia aurita in different body sizes. n, number of samples used in analysis.

Species and spatial variations in the diet of jellyfishes
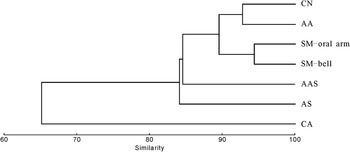
Cluster analysis based on the fatty acid compositions of jellyfishes in different species and from different regions in the same season was performed with PRIMER5.0 to evaluate the species and spatial influences on the fatty acid compositions of jellyfishes. At the 85% Bray–Curtis similarity level, jellyfishes were divided into four groups (Figure 5). The Antarctic ctenophore Callianira antarctica was separated from other jellyfishes (scyphozoan) to form one group alone, indicating that species was an important factor influencing the fatty acid composition of jellyfishes. The fatty acid compositions of the ctenophore C. antarctica, which contained higher C20:1 + C22:1 and C18:1n-9 concentrations (12.8% and 14.4%, respectively) and lower C20:4n-6 concentration (0.5%) (Ju et al., Reference Ju, Scolardi, Daly and Harvey2004), were different from other jellyfishes. Another Arctic ctenophore, Mertensia ovum, also contained low C20:4n-6 concentrations (Graeve et al., Reference Graeve, Lundberg, Böer, Kattner, Hop and Petersen2008). The benthic detritus food chain signal (i.e. C20:4n-6) is not obvious in ctenophores mainly because their entire lives are in the pelagic stage without a benthic asexual stage (Purcell, Reference Purcell2005). The significant difference in the fatty acid compositions of ctenophore and scyphozoan indicated the dietary difference. There also existed a difference among scyphozoan species. Aurelia aurita and C. nozakii seemed to consume more copepods than S. meleagris, indicated by the higher C20:1 + C22:1 concentration in A. aurita and C. nozakii (Table 2). Higher C15:0 + C17:0 concentrations and C18:1n-7/n-9 ratios (0.7 to 0.9) of S. meleagris suggested that a detritus-based food chain may contribute more to their diet. Widely different diets in jellyfish are yielded by differences in their life stage, morphologies, swimming modes, prey capture and composition of nematocysts (Pauly et al., Reference Pauly, Graham, Libralato, Morissette and Deng Palomares2009).
Cluster analysis of the jellyfishes based on fatty acid compositions. AA, Aurelia aurita; SM, Stomolophus meleagris; CN, Cyanea nozakii; AAS, A. aurita in the Seto Island Sea; CA, Callianira antarctica from the Antarctic; AS, Aurelia sp. from Western Australian waters. Data for A. aurita in the Seto Island Sea, C. antarctica and Aurelia sp. were adapted from Fukuda & Naganuma (2001), Ju et al. (2004) and Nichols et al. (2003) respectively.

Jellyfishes may also change their diet seasonally (Fukuda & Naganuma, Reference Fukuda and Naganuma2001; Ju et al., Reference Ju, Scolardi, Daly and Harvey2004). For instance, the diet of the Aurelia aurita in the Seto Inland Sea may shift between a diatom-based food chain and a detritus-based food chain in different seasons (Fukuda & Naganuma, Reference Fukuda and Naganuma2001), which indicated that the diet of jellyfish can be influenced by the food availability in the environment. Aurelia from three regions (western Australian waters (low latitude region), the Seto Inland Sea and the Yellow Sea (middle latitude region)) were separated into three groups (Figure 5), which suggested that habitat may have an effect on the variation of the fatty acid compositions of jellyfishes. Variations in fatty acid compositions of one species from different regions may indicate the diet variation of jellyfishes in various habitats. Total fatty acid content has been used as an indicator of feeding condition. High TFA content seems to be associated with blooms of prey and low TFA content might be associated with hunger from over-competition for food (Fukuda & Naganuma, Reference Fukuda and Naganuma2001). TFA content of the scyphozoan A. aurita collected from the Seto Inland Sea was as low as 0.3 ± 0.1 mg g−1 (Fukuda & Naganuma, Reference Fukuda and Naganuma2001). TFA of jellyfishes from the Yellow Sea was between 0.8 and 1.2 mg g−1 (Table 2). It seems that the feeding condition of A. aurita was worse in specimens from the Seto Inland Sea than in specimens from the Yellow Sea.
CONCLUSIONS
Biomarkers indicated that jellyfishes in this study area were carnivorous and zooplanktons were important diet items. Specific fatty acids indicated that both the pelagic grazing food chain and benthic detritus-based food chain contributed to the diet of jellyfishes. Ontogenetic diet shifts may occur during the growth of the jellyfishes. The detritus-based food chain contributed more to the small individuals. Larger individuals tended to consume more zooplankton. Besides the dietary effect, species were also factors influencing δ13C and δ15N values and the fatty acid compositions of jellyfishes. Organ was also an important factor affecting the δ13C and δ15N values of the jellyfishes. Detailed study of temporal and spatial variation of biomarkers and isotope composition of potential diets (zooplankton, etc) and jellyfishes would greatly facilitate our ability to detect future changes in jellyfish bloom. Compound specific isotopes of fatty acids may be helpful to quantitatively estimate the diet composition of the jellyfish.
ACKNOWLEDGEMENTS
We thank F. Zhang for assistance in species identification and G.S. Zhang for measuring stable isotopes. We greatly appreciate help of the captain and crew of the ‘BeiDou’ investigation ship. This work was supported by the national key programme for basic research (973 program, Grant No.2011CB409801), the natural science foundation of China (40721004, 40776047), and the international cooperation project (2010DFA24590). We are grateful to the three anonymous referees for their critical and constructive comments on the manuscript.