





1. Introduction
Through its oscillatory motion across variable bottom topography, it is estimated that 1 TW of the power of the barotropic tide is converted into internal (baroclinic) tides (Wunsch & Ferrari Reference Wunsch and Ferrari2004). The internal tides consequently transmit energy throughout the oceans until the energy is converted to smaller and smaller scales, ultimately resulting in turbulent mixing (MacKinnon et al. Reference MacKinnon2017). At its generation site, the oscillation of the barotropic tide over sufficiently steep submarine topography launches vertically propagating beams (Balmforth, Ierley & Young Reference Balmforth, Ierley and Young2002; Legg & Adcroft Reference Legg and Adcroft2003). After these beams interact with the near-surface stratification, they are observed to transform into horizontally propagating low-vertical-mode disturbances, dominated primarily by the lowest (mode-1) disturbance. In some regions, notably the South China Sea, the internal tide is observed to transform into a relatively large amplitude train of internal solitary waves (Alford et al. Reference Alford, Lien, Simmons, Klymak, Ramp, Yang, Tang and Chang2010; Li & Farmer Reference Li and Farmer2011). In other locations, the waves are observed to propagate long distances without any such transformation (Alford Reference Alford2003; Alford et al. Reference Alford, MacKinnon, Zhao, Pinkel, Klymak and Peacock2007; MacKinnon et al. Reference MacKinnon, Alford, Sun, Pinkel, Zhao and Klymak2013; Klymak et al. Reference Klymak, Simmons, Braznikov, Kelly, MacKinnon, Alford, Pinkel and Nash2016). The work presented here examines what influences the nonlinear steepening of the internal tide, focusing upon the initial amplitude of the vertical mode-1 internal tide and the latitude at which it propagates. We will show that the potential for steepening is enhanced as the influence of the Coriolis force lessens (near the equator), and that this steepening can be seen to result from the sequential excitation of mode-1 disturbances having progressively higher superharmonic horizontal wavenumbers.
Inspired by observations of the apparent localized generation of solitary waves in the central Bay of Biscay (New & Pingree Reference New and Pingree1990, Reference New and Pingree1992), laboratory and numerical studies showed that successive superharmonics can be excited by an upward-propagating internal wave beam incident upon a pycnocline (Grisouard, Staquet & Gerkema Reference Grisouard, Staquet and Gerkema2011; Wunsch & Brandt Reference Wunsch and Brandt2012; Diamessis et al. Reference Diamessis, Wunsch, Delwiche and Richter2014).
More recent studies have shown that even in the absence of vertically propagating internal wave beams, horizontally propagating two-dimensional (spanwise-invariant) internal modes self-interact to excite superharmonics provided that the background stratification is non-uniform (Sutherland Reference Sutherland2016; Wunsch Reference Wunsch2017; Baker & Sutherland Reference Baker and Sutherland2020). Most of these studies focused upon the steady state co-existence between the internal tide (which we refer to here as the ‘parent wave’) having horizontal wavenumber  $k$, and its superharmonic with double the horizontal wavenumber,
 $2k$. By ‘steady state’, it is meant that the amplitudes of the parent and superharmonic waves are constant in time. However, Baker & Sutherland (Reference Baker and Sutherland2020) showed that ultimately, such a steady state does not evolve from a horizontally periodic internal mode: starting with no superharmonics, the parent wave excites internal waves that grow and decay periodically in amplitude, provided that the amplitude of the parent wave is sufficiently small. In our companion paper (Sutherland & Yassin Reference Sutherland and Yassin2022), we likewise show that ultimately, a steady state does not evolve from horizontally modulated internal modes. This occurs because the natural frequency,
 $\omega _2$, of the superharmonic wave is nearly double the frequency,
 $\omega$, of the parent wave. The mismatch between the
 $\omega _2$ and
 $2\omega$ frequencies initially leads to the constructive growth of the superharmonic followed by its destructive decay. The resulting beat frequency of the superharmonics is set by the degree of mismatch between the frequencies, as represented by the non-dimensional parameter
 $\epsilon = ((2\omega )^2-\omega _2^2)/(2\omega)^2$. Because this parameter is small, the self-interaction of a vertical mode-1 parent wave excites a nearly pure vertical mode-1 superharmonic disturbance.
In the study by Baker & Sutherland (Reference Baker and Sutherland2020), the beat frequency of the  $2k$-superharmonic was predicted to be
 $\epsilon \omega$, and the maximum amplitude of the superharmonic relative to the amplitude parent wave was set by the ratio
 $\alpha /\epsilon$, in which
 $\alpha$ is the ratio of the initial maximum vertical displacement of the parent wave to the characteristic depth of the stratification. That study, which focused exclusively on the interactions between the parent and the
 $2k$-superharmonic alone, was shown to be accurate provided that
 $\alpha /\epsilon \ll 1$. For larger
 $\alpha /\epsilon$, the growth of higher superharmonics cannot be ignored. The main theoretical advance of this paper is to relax the restriction that
 $\alpha /\epsilon$ is small, and so consider interactions between the parent wave and an arbitrary number of its superharmonics.
It is certainly possible for internal tides in the ocean to have sufficiently large amplitude such that  $\alpha /\epsilon \gtrsim 1$. This is particularly true for internal tides near the equator, in which case
 $\omega _2\simeq 2\omega$ (and
 $\epsilon \ll 1$) because the dispersion relation relating
 $\omega$ to
 $k$ is approximately linear for long waves (
 $kH\ll 1$, with
 $H$ being the ocean depth) if the Coriolis parameter is zero. For this reason, the parameter regime of our study is motivated by observations of the internal tide that emanates south-west of Hawaii towards the equator.
In § 2 we review the far-field observations of the internal tide south-west of Hawaii. These are used to motivate the parameter regimes explored in our study. We then present, in § 3, the theory leading to a coupled system of nonlinear ordinary differential equations describing the growth (and possible decay) of successive superharmonics. Solutions as they depend upon the parent wave amplitude and latitude of propagation are given therein. Section 4 describes the fully nonlinear code used to simulate the evolution of the internal tide. Therein it is shown that the predictions in § 3 well represent the fully nonlinear results. Observing that the model predicts that the internal tide transforms into an internal solitary wave train if  $\alpha /\epsilon$ is large, § 5 reviews models based on shallow-water theory that likewise produce solitary wave trains. Their predictions are then compared to our model. Discussion and conclusions are presented in § 6.
2. Parameter regime
For the parameters explored in this study, we focus on the ‘Farfield’ observations of the internal tide that propagated south-west of the Hawaiian Islands (Rainville & Pinkel Reference Rainville and Pinkel2006). These observations, taken over 40 days in the autumn of 2001, were made  $430$ km south-west of Oahu at a latitude of 18.39
 $^\circ$N. The Coriolis parameter at that latitude was
 $0.0000459\ \mbox {s}^{-1}$, in which here, and throughout this paper, we write
 $\mbox {s}^{-1}$ to represent radians per second. The ocean depth at the Farfield location was
 $H\simeq 5200$ m.
Measurements of temperature and conductivity (salinity) taken between the surface and  $800$ m depth showed that the background density profile decreased approximately exponentially with depth below a
 $100$ m deep surface mixed layer. In particular, the buoyancy frequencies at
 $100$ m and
 $800$ m depth were approximately
 $10$ and
 $2$ cycles per hour (c.p.h.), respectively. From these data, we estimate the background squared buoyancy frequency profile below
 $z_0=-100$ m to be
 $N^2(z) \simeq N_0^2\,{\rm e}^{(z-z_0)/d}$, with
 $N_0\simeq 0.017\ \mbox {s}^{-1}$ (
 $\simeq 9.7$ c.p.h.) and
 $d\simeq 218$ m.
From measurements of both the isopycnal displacements and baroclinic energy flux, the dominant disturbances to the background took the form of vertical mode-1 internal tides at the semi-diurnal frequency of the lunar ( $M_2$) tide,
 $\omega \simeq 0.000141\ \mbox {s}^{-1}$. Satellite altimetry and numerical modelling determined the horizontal wavelength of the
 $M_2$ internal tide to be approximately
 $150$ km (Rainville et al. Reference Rainville, Johnston, Carter, Merrifield, Pinkel, Worcester and Dushaw2010). The corresponding horizontal wavenumber is
 $k\simeq 4.2\times 10^{-5}\ \mbox {m}^{-1}$.
The root-mean-square isopycnal displacements of the semi-diurnal tide was largest between  $400$ and
 $700$ m depth, with values
 $\gtrsim 25$ m at the spring tides, and
 $\lesssim 5$ m at the neap tides (Rainville & Pinkel Reference Rainville and Pinkel2006). From this we estimate the half peak-to-peak displacement to be
 $A_0\simeq 15\ (\pm 10)$ m.
We use these data to cast the key variables of our study as non-dimensional parameters that will guide approximations used in the following theory section as well as setting variables used in numerical simulations. The e-folding depth of the stratification relative to the ocean depth is  $d/H \simeq 0.04$. The relative Coriolis and internal tide frequencies are
 $f/N_0\simeq 0.003$ and
 $\omega /N_0\simeq 0.008$, respectively. The relative horizontal wavenumber is
 $kH \simeq 0.2$. The half peak-to-peak amplitude relative to the ocean depth is
 $A_0/H \simeq 0.003\ (\pm 0.002)$. Taken relative to the e-folding depth of the stratification, we have
 $\alpha \equiv A_0/d \simeq 0.075 (\pm 0.050)$.
We are particularly interested in the behaviour of the internal tide as it travels south towards the equator, where  ${f=0}$. Thus we neglect variations in bottom depth and assume that
 $kH\simeq 0.2$ is fixed. For simplicity, the equations are solved on the
 $f$-plane, with the evolution of the internal tide examined separately at different fixed values of
 $f$ between
 $0.003N_0$ and
 $0$.
3. Theory
Here, we present the theory for superharmonic excitation induced by a horizontally propagating, vertical mode-1 internal wave. After presenting the equations of motion, the vertical structure equation and polarization relations for small-amplitude internal waves are presented. Evolution equations are then derived for superharmonics excited by triad interactions between internal modes. In this work, we ignore the self-interaction of waves leading to an induced Eulerian flow (Bühler Reference Bühler2014; van den Bremer, Yassin & Sutherland Reference van den Bremer, Yassin and Sutherland2019). This is because, as is shown in our companion paper (Sutherland & Yassin Reference Sutherland and Yassin2022), superharmonics are near-resonant with the parent wave, whereas the induced Eulerian flow is not. Hence this flow has negligible influence upon the parent wave and its superharmonics.
3.1. Equations of motion
We consider the motion of inviscid, non-diffusive, incompressible Boussinesq fluid on the  $f$-plane in a horizontally periodic channel bounded above and below by free-slip boundary conditions. The waves in this domain are taken to be two-dimensional, having structure in the along-wave (
 $x$) and vertical (
 $z$) directions. Although there can be motion in the spanwise (
 $y$) direction, the fields of interest are independent of
 $y$.
The momentum equations are
 \begin{equation} \frac{{\rm D}u}{{\rm D}t} -fv ={-}\frac{1}{\rho_0}\, \frac{\partial p}{\partial x},\quad \frac{{\rm D}v}{{\rm D}t} +fu = 0,\quad \frac{{\rm D}w}{{\rm D}t} ={-}\frac{1}{\rho_0}\, \frac{\partial p}{\partial z} + b,\end{equation}
in which  ${\rm D}/{\rm D}t\equiv \partial _t + u\partial _x + w\partial _z$ is the material derivative,
 $u$,
 $v$ and
 $w$ are the components of velocity in the
 $x$,
 $y$ and
 $z$ directions, respectively,
 $b=-g\rho /\rho _0$ is the buoyancy,
 $p$ and
 $\rho$ are the pressure and density fluctuations, respectively, and
 $\rho _0$ is the characteristic density. In these expressions, gravity (
 $g$) and the Coriolis parameter (
 $f$) are assumed to be constant. From internal energy conservation, we have
 \begin{equation} \frac{{\rm D}b}{{\rm D}t} ={-}N^2 w,\end{equation}
in which  $N^2(z) = -(g/\rho _0) \, {\rm d} \bar {\rho }/{\rm d} z$ is the squared buoyancy frequency, and
 $\bar {\rho }(z)$ is the background density. In a uniformly stratified fluid,
 $\bar {\rho }$ increases linearly with depth and
 $N^2$ is constant. In this study,
 $N^2$ is taken to be
 $z$-dependent, as is necessary for the excitation of superharmonics.
By assuming that the fluid is incompressible, the  $x$- and
 $z$-velocity components can be written in terms of the streamfunction
 $\psi$:
 \begin{equation} u ={-}\frac{\partial\psi}{\partial z}, \quad w = \frac{\partial\psi}{\partial x}.\end{equation}
Taking the curl of the  $x$- and
 $z$-momentum equations gives an equation for the evolution of the spanwise vorticity,
 $\zeta \equiv \partial _z u - \partial _x w$:
 \begin{equation} \frac{{\rm D}\zeta}{{\rm D}t} ={-}\frac{\partial b}{\partial x} + f\,\frac{\partial v}{\partial z}.\end{equation}
These nonlinear equations can be manipulated to be written as a linear operator acting on the streamfunction  $\psi$, being forced by nonlinear terms (Wunsch Reference Wunsch2017; Baker & Sutherland Reference Baker and Sutherland2020):
 \begin{equation} \mathcal{L}\psi = \boldsymbol{\nabla}\boldsymbol{\cdot}\boldsymbol{F},\end{equation}
in which
 \begin{equation} \mathcal{L} \equiv\partial_{tt}\nabla^2 + N^2 \partial_{xx} + f^2 \partial_{zz}\end{equation}
and
 \begin{equation} \boldsymbol{F} \equiv\partial_t(\boldsymbol{u}\zeta) - \partial_x (\boldsymbol{u}b) + f\,\partial_z(\boldsymbol{u}v).\end{equation}
Here,  $\nabla ^2 = \partial _{xx}+\partial _{zz}$ is the Laplacian, and
 $t$,
 $x$ and
 $z$ subscripts denote the corresponding partial derivatives. In solving the above equations, the domain is taken to be bounded above and below by free-slip horizontal boundaries at
 $z=0$ and
 $z=-H$.
3.2. Small-amplitude waves
Laying the groundwork for the nonlinear studies that follow, here we describe the initial structure of the internal tide, which we refer to hereafter as the ‘parent wave’, and then generalize this to describe the structure and polarization relations associated with the parent wave and its superharmonics.
The parent wave has a prescribed horizontal wavenumber  $k$, and vertical displacement amplitude
 $A_0$. Although in reality the internal tide is modulated spatially, it is unnecessary to include these dynamics in the consideration of superharmonic excitation. The streamfunction characterizing the parent wave is given by
 \begin{equation} \psi^{(1)} = \frac{1}{2}\,\frac{\omega d}{k}\,\alpha\,a_1(T)\,\hat{\psi}_1(z) \, {\rm e}^{\mathrm{i}(kx- \omega t)} + \text{c.c.},\end{equation}
in which  $\text {c.c.}$ denotes the complex conjugate, and
 $a_1(T)$ represents the slow time (
 $T$) evolution of amplitude, to be discussed in detail below. Somewhat arbitrarily, we have introduced
 $d$ to be the characteristic vertical scale of variation of
 $N^2(z)$, so that
 $\alpha \equiv A_0/d$ is the non-dimensional initial amplitude of the parent wave, expressed as the maximum vertical displacement relative to
 $d$. Substituting (3.8) into
 $\mathcal {L}\psi ^{(1)} =0$ gives an eigenvalue problem for the vertical structure
 $\hat {\psi }_1$ and its associated frequency
 $\omega$:
 \begin{equation} \hat{\psi}_1^{\prime\prime} + k^2\,\frac{N^2-\omega^2}{\omega^2-f^2}\,\hat{\psi}_1 =0, \quad \hat{\psi}_1({-}H)=\hat{\psi}_1(0)=0.\end{equation}
As justified below (see also Baker & Sutherland Reference Baker and Sutherland2020), we consider only superharmonics having the vertical structure of mode-1 waves for which  $\hat {\psi }_1(z)>0$ for
 $-H< z<0$. These eigenfunctions are normalized so that
 $\max \{\hat {\psi }_1\}=1$. The vertical structure is plotted in figure 1 as computed for waves in exponential stratification,
 \begin{equation} N^2(z) = N_0^2\,{\rm e}^{(z-z_0)/d} \quad\text{for }{-H}\leq z\leq 0,\end{equation}
and in exponential stratification that includes a surface mixed layer
 \begin{equation} N^2(z) = \left\{\begin{array}{@{}ll} 0 & z_0< z\leq 0, \\ N_0^2\,{\rm e}^{(z-z_0)/d} & -H\leq z\leq z_0. \end{array}\right. \end{equation}
In both cases, we set  $d=0.04H$ and
 $z_0=-0.019H$, equivalent to a 100 m deep mixed layer in an ocean of depth
 $H=5200$ m. These plots demonstrate that the vertical structure is not particularly sensitive to the presence of a mixed layer. The peak in the vertical structure occurs at depth
 $-0.14H$ (approximately
 $700$ m depth), which is comparable to the maximum isopycnal displacements observed at the Farfield site south-west of Hawaii (Rainville & Pinkel Reference Rainville and Pinkel2006).
(a) Profiles of exponential stratification with  $d=0.04H$ and
 $N=N_0$ at
 $z_0=-0.019H$ (thick black line) and of the same exponential stratification but with
 $N=0$ above
 $z=-0.019H$ (red line). (b) The corresponding vertical structure functions of mode-1 waves. The structure was computed for
 $k=0.2H$ and
 $f=0.003N_0$. In both cases, only the top 30 % of the full domain height is plotted.

The evolution of the parent wave is given by  $a_1(T)$, in which
 $T=\epsilon t$ describes the slow time variation (
 $\epsilon \ll 1$) of the parent wave due to interactions with the superharmonics that it excites. With the streamfunction defined by (3.8), the initial non-dimensional amplitude of the parent wave is
 $a_1(0)=1$. As in Baker & Sutherland (Reference Baker and Sutherland2020), we will show that the small parameter
 $\epsilon$ is determined by the degree to which the forcing of the
 $2k$-superharmonic by the parent wave at frequency
 $2\omega$ is off-resonant with the natural frequency
 $\omega _2$ of the mode-1 superharmonic.
The parent wave self-interacts through the nonlinear terms in (3.7) to excite a superharmonic with wavenumber  $2k$. The parent wave and its
 $2k$-superharmonic can then interact creating higher superharmonics, modifying the amplitude of the parent wave and superharmonics in time.
For convenience, we write the streamfunction for each of the parent ( $n=1$) and its superharmonics (
 $n=2,3,\ldots$) as
 \begin{equation} \psi^{(n)}= \frac{1}{2}\,\alpha\,\frac{\omega d}{k}\,\psi_n \, {\rm e}^{\mathrm{i} n(kx-\omega t)} + \text{c.c.},\end{equation}
in which
 \begin{equation} \psi_n = a_n(T)\,\hat{\psi}_n(z), \quad n=1,2,3,\ldots.\end{equation}
The vertical structure is given by the solution to the eigenvalue problem
 \begin{equation} \hat{\psi}_n^{\prime\prime} + (nk)^2\,\frac{N^2-\omega_n^2}{\omega_n^2-f^2}\,\hat{\psi}_n =0,\quad \hat{\psi}_n({-}H)=\hat{\psi}_n(0)=0,\quad n=1,2,3,\ldots,\end{equation}
in which  $\omega _n$ is the natural frequency of a vertical mode-1 wave having wavenumber
 $nk$. As in (3.8), the amplitude
 $a_n(T)$ of the waves is assumed to depend upon a slow time scale
 $T=\epsilon t$.
The expression for  $\psi ^{(n)}$ supposes that the frequency of the wave with wavenumber
 $nk$ is
 $n\omega$. This assumption is made because integer multiples of the parent wave frequency result from wave–wave interactions in the nonlinear terms. However, for
 $n>1$, the frequency
 $n\omega$ is not equal to the natural frequency
 $\omega _n$ of the mode-1 wave with wavenumber
 $nk$, although the difference in frequencies may be close, as demonstrated in the next subsection. It is this slight mismatch that leads to off-resonant forcing of successive superharmonics.
Given the streamfunction of the parent wave and its superharmonics, the other fields appearing in the nonlinear terms of  $\boldsymbol {F}$ in (3.7) can be found from the polarization relations. These expressions are listed in table 1.
Expressions for the polarization relations of the fields with horizontal wavenumber  $nk$,
 $n=1,2,\ldots$. The actual fields are found by multiplying by
 $\alpha (\omega d/k)\,\exp [\mathrm {i}n(kx-\omega t)]/2$ and adding the complex conjugate. In these expressions, primes on
 $\hat {\psi }_n$ denote
 $z$-derivatives.

3.3. Superharmonic cascade
Now consider the triad interaction in which a wave having wavenumber  $lk$ interacts with a wave having wavenumber
 $mk$ to force a disturbance with wavenumber
 $nk$, in which
 $n=l+m$. Here,
 $l$,
 $m$ and
 $n$ can be negative as well as positive integers, with negative numbers arising from the complex conjugate terms in the polarization relations. From (3.7), the nonlinear forcing of
 $nk$-waves by
 $mk$- and
 $lk$-waves is given by
 \begin{equation} \boldsymbol{\nabla}\boldsymbol{\cdot}\boldsymbol{F}_{ml} = \boldsymbol{\nabla}\boldsymbol{\cdot}[\partial_t(\boldsymbol{u}_m\zeta_l) - \partial_x(\boldsymbol{u}_m b_l) + f\,\partial_z(\boldsymbol{u}_mv_l)], \quad |m|,|l|\geq 1,\end{equation}
in which  $n=m+l$.
To find the response to the forcing, we use (3.6) to expand  ${\mathcal {L}}\psi ^{(n)}$, with time derivatives acting upon
 $a_n(T)$ as well as the complex exponential. However, assuming that
 $\epsilon$ is small, the term
 $\epsilon ^2\,{\rm d}^2a_n/{\rm d}T^2$ can be neglected. Thus we find, for
 $n=1,2,3,\ldots$,
 \begin{equation} {\mathcal{L}}\psi^{(n)} \simeq \frac{1}{2}\,\alpha\,\frac{\omega d}{k}\, (nk)^2\,\frac{N^2-f^2}{\omega_n^2-f^2} \left[2\mathrm{i} n\omega \epsilon\,\frac{{\rm d}a_n}{{\rm d}T} + [(n\omega)^2 -\omega_n^2] a_n\right] \hat{\psi}_n \, {\rm e}^{\mathrm{i}n(kx-\omega t)}.\end{equation}
As in Baker & Sutherland (Reference Baker and Sutherland2020), we recognize that  $\omega _2 \simeq 2\omega$, and so define the slow time evolution parameter
 $\epsilon$ to be
 \begin{equation} \epsilon \equiv \frac{4\omega^2 - \omega_2^2}{4\omega^2}.\end{equation}
For convenience, we make the following definition:
 \begin{equation} B_1=0, \quad B_n = \frac{2}{n (n-1)}\,\frac{n^2\omega^2 - \omega_n^2}{4\omega^2-\omega_2^2}, \quad n=2,3,\ldots. \end{equation}
In particular,  $B_2=1$ and empirical calculations show that
 $B_n \sim 1$ for sufficiently small
 $n\geq 2$ and
 $f/N_0$ not negligibly small. Explicit approximate analytical expressions for
 $B_n$ are given in Appendix A.
With these definitions, (3.16) becomes
 \begin{equation} {\mathcal{L}}\psi^{(n)} \simeq \alpha\,\frac{\omega d}{k}\, (\mathrm{i} n^3k^2\omega \epsilon )\, \frac{N^2-f^2}{\omega_n^2-f^2} \left[\frac{{\rm d}a_n}{{\rm d}T} - \mathrm{i}(n-1) \omega B_n a_n\right] \hat{\psi}_n \, {\rm e}^{\mathrm{i}n(kx-\omega t)}.\end{equation}
Equating (3.15) and (3.19), we get the following equation for the forcing of waves having wavenumber  $nk$:
 \begin{equation} \left[\frac{{\rm d}a_n}{{\rm d}T} - \mathrm{i}(n-1) \omega B_n a_n\right] (N^2-f^2) \hat{\psi}_n ={-}\frac{\mathrm{i}}{\epsilon}\, \frac{\omega_n^2-f^2}{n^3k\omega^2 d} \, {\rm e}^{-\mathrm{i}n(kx-\omega t)}\, \alpha^{{-}1} \sum_{m+l=n} \boldsymbol{\nabla}\boldsymbol{\cdot}\boldsymbol{F}_{ml}.\end{equation}
In the sum,  $n\geq 1$,
 $m\geq l$, and both
 $m$ and
 $l$ are non-zero integers, since here we are neglecting the generation of and interactions with the induced Eulerian flow. By construction, the complex exponentials in front of and (implicitly) within the sum cancel out.
While the vertical structure of the forcing on the right-hand side can be seen as a superposition of vertical modes, the response to this forcing is dominantly a mode-1 disturbance (Baker & Sutherland Reference Baker and Sutherland2020). The forcing of the mode-1 wave is found using the orthogonality of modes under the weight  $N^2-f^2$. Thus multiplying both sides of (3.20) by
 $\hat {\psi }_n$ and integrating in
 $z$ from
 $-H$ to
 $0$ gives the ordinary differential equation governing the time evolution of
 $a_n(T)$. The result is a hierarchy of equations written explicitly in terms of the amplitude functions
 $a_n$:
 \begin{equation} \frac{{\rm d}a_n}{{\rm d}T} - \mathrm{i}(n-1) \omega B_n a_n ={-}\mathrm{i}\alpha\,\frac{\omega}{\epsilon} \sum_{m+l=n, m\geq l} E_{ml} a_m a_l,\quad n=1,2,3,\ldots,\end{equation}
in which  $l$ is non-zero and
 $a_{-l} = a_l^\star$, the complex conjugate of
 $a_l$. The coefficients
 $E_{ml}$ are real and positive constants. Explicitly, for
 $m=l$ (and
 $n=2m$) these are
 \begin{align} E_{mm} &=\frac{1}{8n}\,d\,\frac{\omega_n^2-f^2}{\omega^2} \left[\int_{{-}H}^0 (N^2-f^2) \hat{\psi}_n^2\,{\rm d}z\right]^{{-}1}\nonumber\\ &\quad \times \left\{ \left(1+\frac{1}{2}\,\frac{nm\omega^2+f^2}{\omega_m^2-f^2}\right) \int_{{-}H}^0 \frac{{\rm d}N^2}{{\rm d}z}\,\hat{\psi}_m^2 \hat{\psi}_n\,{\rm d}z \right\},\end{align}
and for  $m>l$ (and
 $n=m+l$),
 \begin{align} E_{ml} & =\frac{1}{4n}\,d\,\frac{\omega_n^2-f^2}{\omega^2} \left[\int_{{-}H}^0 (N^2-f^2) \hat{\psi}_n^2\,{\rm d} z\right]^{{-}1} \nonumber\\ & \quad \times \left\{ \left[1+\frac{ml}{n^2} \left(\frac{nl\omega^2+f^2}{\omega_l^2-f^2} + \frac{nm\omega^2+f^2}{\omega_m^2-f^2} \right) \right]\int_{{-}H}^0 \frac{{\rm d}N^2}{{\rm d}z}\, \hat{\psi}_m\hat{\psi}_l\hat{\psi}_n\,{\rm d} z \right. \nonumber\\ & \quad + \frac{\omega^2}{n} \left(\frac{m^2}{\omega_m^2-f^2} - \frac{l^2}{\omega_l^2-f^2} \right) \int_{{-}H}^0 (N^2-f^2) (l\hat{\psi}_m^\prime \hat{\psi}_l\hat{\psi}_n - m\hat{\psi}_m\hat{\psi}_l^\prime\hat{\psi}_n)\,{\rm d} z \nonumber\\ & \quad + f^2\,\frac{1}{n^2} \int_{{-}H}^0 l(m-2l)\,\frac{N^2-\omega_l^2}{\omega_l^2-f^2}\, \hat{\psi}_m^\prime \hat{\psi}_l\hat{\psi}_n + m(l-2m)\,\frac{N^2-\omega_m^2}{\omega_m^2-f^2}\, \hat{\psi}_m\hat{\psi}_l^\prime\hat{\psi}_n\,{\rm d} z \nonumber\\ &\quad + \left. f^2\,\frac{ml}{n^2} \int_{{-}H}^0 \frac{N^2-\omega_l^2}{\omega_l^2-f^2}\, \hat{\psi}_m\hat{\psi}_l^\prime\hat{\psi}_n + \frac{N^2-\omega_m^2}{\omega_m^2-f^2}\, \hat{\psi}_m^\prime\hat{\psi}_l\hat{\psi}_n\,{\rm d} z\right\}, \end{align}
in which  $\omega _{-l} = \omega _l$ and
 $\hat {\psi }_{-l} = \hat {\psi }_l$.
The expressions for the interaction coefficients simplify significantly if we assume that the primary wave and the most significant excited superharmonics ( $n\leq n_\star$) can all be treated as long waves, with
 $(n_\star k) H\ll 1$. Their derivations are given in Appendix A. In particular, this analysis shows that, independent of
 $f$, the dominant contribution to
 $E_{ml}$ comes from the term involving
 ${\rm d}N^2/{\rm d} z$, and that
 $E_{ml}\simeq 2E_{jj}$ if
 $m>l$ and
 $m+l=2j$.
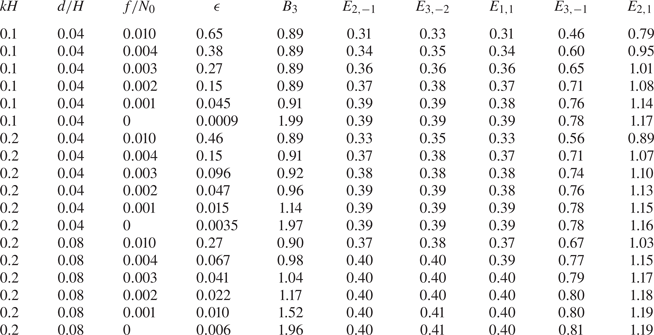
Table 2 lists values of these coefficients as they depend upon the characteristic wavenumber of the internal tide, the e-folding depth of the stratification and the relative Coriolis parameter. The coefficients  $E_{ml}$ change little with the variations in
 $kH$,
 $d/H$ and
 $f/N_0$, which is consistent with the long-wave approximations (A2) and (A3). The most significant changes occur for
 $\epsilon$, which decreases rapidly as
 $f/N_0$ goes to zero. Consistent with (A7), the coefficient
 $B_3$ is close to
 $8/9$ for sufficiently large
 $f$, but
 $B_3\simeq 2$ if
 ${f=0}$.
Non-dimensional coefficients used to compute the evolution of the parent wave with horizontal wavenumber  $k$ and its first two superharmonics,
 $2k$ and
 $3k$ (
 $n_\star =3$). The background
 $N^2$ profile is exponential, given by (3.10). In all cases,
 $z_0=-0.019H$ and the e-folding depth of the stratification is
 $d=0.04H$ or
 $0.08H$, as indicated. The Coriolis parameter, given relative to
 $N_0\simeq 0.017\ \mbox {s}^{-1}$, ranges from values near Hawaii to
 ${f=0}$ at the equator as well as the case
 $f/N_0=0.01$.
The coefficients  $\epsilon$,
 $B_n$ and
 $E_{ml}$ were also computed for stratification having a surface mixed layer given approximately by (3.11), though to avoid the singularity in
 ${\rm d}N^2/{\rm d} z$, a hyperbolic tangent function was used to connect the uniform-density layer to the exponential stratification over a distance
 $0.1 z_0$. The values were found to differ by less than 3 % of the values in the table, consistent with a surface mixed layer having little effect upon the vertical structure function, as shown in figure 1. The coefficients were more sensitive to changing the stratification at depth by weakening the exponential decay at depth of the buoyancy frequency to be more representative of that in the abyss. A detailed exploration of the influence of the structure of the stratification upon the interaction coefficients goes beyond the scope of our present study.
In the special case of the self-interaction of the parent, as determined by the coupling coefficient  $E_{11}$, (3.22) shows that this leads to superharmonics only if the fluid is non-uniformly stratified, as has been noted previously (Wunsch Reference Wunsch2015, Reference Wunsch2017; Sutherland Reference Sutherland2016; Varma & Mathur Reference Varma and Mathur2017; Baker & Sutherland Reference Baker and Sutherland2020).
Baker & Sutherland (Reference Baker and Sutherland2020) examined the truncated system of equations involving only the parent self-interaction creating a  $2k$-superharmonic, and the
 $2k$-superharmonic interacting with the parent so as to modify the parent. Respectively, these are given explicitly by
 \begin{equation} \frac{{\rm d}a_2}{{\rm d}T} - \mathrm{i} \omega a_2 ={-}\mathrm{i}\alpha\,\frac{\omega}{\epsilon}\,E_{11} a_1^2,\quad \frac{{\rm d}a_1}{{\rm d}T} ={-}\mathrm{i}\alpha\, \frac{\omega}{\epsilon}\,E_{2,-1} a_2 a_1^\star.\end{equation}
If the parent wave amplitude is sufficiently small, then the influence of the superharmonic upon the parent can be neglected, in which case  $a_1(T)=1$, and the first equation gives
 $a_2(T)=E_{11}(\alpha /\epsilon ) [1-\exp (\mathrm {i}\omega T)]$. Recalling that
 $T=\epsilon t$, this shows that the superharmonic grows and decays periodically with frequency
 $\epsilon \omega$. Also, the
 $2k$-superharmonic grows to amplitude
 $\propto \alpha /\epsilon$ with respect to the parent. So the truncation of equations leading to (3.24a,b) is valid provided that
 $\alpha /\epsilon \ll 1$ (Baker & Sutherland Reference Baker and Sutherland2020).
If  $\alpha /\epsilon \gtrsim 1$, then the
 $2k$-superharmonic can grow to non-negligible amplitude with respect to the parent. If the relative amplitude is fixed, but
 $\alpha /\epsilon$ is large due to
 $\epsilon$ being small, then the
 $2k$-superharmonic would remain large for longer times owing to the smaller beat frequency
 $\epsilon \omega$. Thus, in this circumstance, it is anticipated that the parent and
 $2k$-superharmonic should excite higher superharmonics.
Such considerations are not just a theoretical exercise. Although realistic internal tides have small amplitude, circumstances can exist where  $\alpha /\epsilon \gg 1$ as a consequence of
 $\epsilon$ being smaller than
 $\alpha$. This is particularly likely near the equator where the cut-off frequency
 $f$ in the dispersion relation goes to zero so that, approaching the limit of very long waves (
 $kH\rightarrow 0$),
 $\omega \propto k$. Hence
 $2\omega (k)=\omega _2\equiv \omega (2k)$, in which case
 $\epsilon =0$. This is illustrated in figure 2, for which the dispersion relation is computed for mode-1 waves in exponential stratification with e-folding depth
 $d=0.04H$. At latitudes where
 $f/N_0=0.008$,
 $\omega _2$ is moderately offset from
 $2\omega$ so that
 $\epsilon \simeq 0.18$ for
 $kH=0.2$. However, at the equator there is near perfect resonance between the parent mode forcing frequency at
 $2\omega$ and the natural frequency of the
 $2k$-superharmonic, as indicated by the low value of
 $\epsilon \simeq 0.007$. Even for a parent tide with a relatively small vertical displacement amplitude
 $A_0=5$ m in an ocean of depth
 $H\simeq 5$ km and stratification with e-folding depth
 $d\simeq 200$ m, the non-dimensional amplitude
 $\alpha \simeq A_0/d=0.025$ is larger than
 $\epsilon$. This implies that progressively higher superharmonics may be excited as internal tides approach the equator.
For mode-1 waves in stratification given by (3.10) with  $d=0.04H$ and
 $z_0=-0.019H$, plots of the dispersion relation and comparison of
 $2\omega$ with
 $\omega _2$, with (a)
 $f=0.003N_0$, and (b)
 ${f=0}$. Plots of the corresponding values of
 $\epsilon$ are shown in (c) for
 $f=0.003N_0$ and
 ${f=0}$.

For given stratification, Coriolis parameter and parent wave horizontal wavenumber, the coefficients in (3.21) can be evaluated up to some truncation level  $n\leq n_\star$. There are then
 $n_\star$ coupled equations involving terms with both
 $m\leq n_\star$ and
 $|l|< n_\star$. For
 $\alpha /\epsilon \ll 1$, it is sufficient to choose
 $n_\star =2$, leading to the pair of equations given by (3.24a,b). For the studies below of the internal tide approaching the equator,
 $\alpha /\epsilon$ can be much larger than
 $1$. In these cases, convergence of solutions is found by including superharmonics up to
 $n_\star =20$.
The system of ordinary differential equations was solved by straightforward time integration with equally spaced time steps  ${\rm \Delta} T$. With
 ${\rm \Delta} T=0.001$ and
 $n_\star =20$, Matlab integrated the equations over the time of one beat period
 $2{\rm \pi} /(\epsilon \omega )$ in
 $\simeq 10$ s of real time on a single 2.7 GHz core. After the solutions were found, the results were rescaled to time
 $t=T/\epsilon$. The results are shown in figure 3 for cases in which the Coriolis parameter is representative of that near Hawaii and at the equator. Amplitudes are based upon observations of the tide between the neap and spring cycles.
Time evolution of the amplitudes  $a_n$, shown for the parent (
 $n=1$, solid black lines) and the first five superharmonics (
 $n=2$, dark blue;
 $n=3$, medium blue;
 $n=4$, light blue;
 $n=5$, dashed green;
 $n=6$, dashed pale green), computed for (a–c)
 $f=0.003N_0$ (
 $\epsilon \simeq 0.096$), and (d–f)
 ${f=0}$, (
 $\epsilon \simeq 0.0035$), and for amplitudes (a,d)
 $\alpha =0.025$, (b,e)
 $\alpha =0.075$, and (c, f)
 $\alpha =0.125$. In all cases,
 $k=0.2H$ and the background stratification is exponential with
 $N=N_0$ at
 $z_0=-0.019H$ and
 $d=0.04H$, and the solutions of (3.21) were found by setting a truncation level of
 $n_\star =20$.

For the smallest amplitude case with  $f=0.003N_0$, only superharmonics with
 $n\lesssim 3$ grow to significant amplitude, as expected from the small value of
 $\alpha /\epsilon \simeq 0.26$. These grow and decay in amplitude with the predicted beat period
 $2{\rm \pi} /(\epsilon \omega ) \simeq 7700/N_0$. The parent wave amplitude barely deviates from its initial value in this case. In all the other cases considered, successive superharmonics are excited, with these growing to significant amplitude while the parent wave amplitude decreases substantially. Notably, the cascade is not monotonic with energy progressively passing to higher superharmonics. Particularly in cases with
 ${f=0}$, high-order superharmonics rapidly grow to amplitudes larger than
 $a_2$, but the
 $2k$-superharmonic can then dominate once more (for example, at time
 $N_0t\simeq 40\ 000$ if
 $\alpha =0.025$, as shown in figure 3(d), and at time
 $N_0t\simeq 23\ 000$ if
 $\alpha =0.075$, as shown in figure 3e).
It may seem that the competing superharmonics would manifest as a form of wave turbulence. However, as shown below, the superposition of superharmonics in cases with  $\alpha /\epsilon \gtrsim 1$ results in the manifestation of a coherent, though not steady, solitary wave train. Finally, we note that the truncated system of equations leads to an energy conservation relation, at least for
 $n_\star \leq 3$. As shown in Appendix B, even as superharmonics grow at the expense of the parent wave, the sum of the squared amplitudes of all the waves remains close to
 $|a_1(T=0)|^2=1$.
4. Fully nonlinear solutions
For the purposes of testing the above prediction for the evolution of the internal tide, we performed fully nonlinear numerical simulations and ran diagnostics to compare the evolution of the primary wave amplitude and the amplitudes of each superharmonic.
The fully nonlinear equations were solved using the code described in detail in Sutherland (Reference Sutherland2016). The two-dimensional rotating Boussinesq equations were solved in a rectangular domain with horizontally periodic boundary conditions, and free-slip conditions at the top and bottom of the domain. Explicitly, the code solved the time evolution equations for spanwise vorticity ( $\zeta$), spanwise velocity (
 $v$), and the buoyancy
 $b$:
 $$\begin{gather} \zeta_t ={-} u\zeta_x - w\zeta_z - b_x + f v_z + {{Re}}^{{-}1}\,{\mathcal{D}} \zeta, \end{gather}$$
 $$\begin{gather}v_t ={-} u v_x - w v_z - fu + {{Re}}^{{-}1}\,{\mathcal{D}} v, \end{gather}$$
 $$\begin{gather}b_t ={-} u b_x - w b_z - N^2 b + {{Re\,Pr}}^{{-}1}\,{\mathcal{D}} b, \end{gather}$$
which are extensions, respectively, of (3.4), (3.1b) and (3.2) to include viscous and diffusive terms. The fields were discretized vertically on an evenly spaced grid, and horizontally in terms of their horizontal Fourier components. The diffusion operator  ${\mathcal {D}}$ is a Laplacian operator acting only upon horizontal Fourier components with horizontal wavenumbers greater than
 $32 k$, in which
 $k$ is the prescribed horizontal wavenumber of the parent wave. The Reynolds number
 ${Re}=H^2 N_0/\nu$ was set to
 $10^5$, and the Prandtl number
 ${Pr}$ was set to
 $1$. Although these values are smaller than realistic oceanographic values, they serve to damp numerical noise. Because no diffusivity was applied to disturbances with wavenumbers smaller than
 $32k$, the parent wave and superharmonics that grow to significant amplitude were not attenuated. At any time, the streamfunction was found by solving
 $\zeta =-\nabla ^2\psi$ and, from this,
 $u$ and
 $w$ were found using (3.3a,b).
The background squared buoyancy frequency in all simulations presented here was exponential, given by (3.10) with  $d/H=0.04$ and
 $z_0=-0.019H$. The code worked in non-dimensional variables, with length and time scales set effectively by prescribing
 $H=1$ and
 $N_0=1$. However, for clarity, all variables below are given in units of
 $H$ and
 $N_0$.
In the simulations presented here, the horizontal wavenumber was prescribed by  ${kH=0.2}$, and the Coriolis parameter was given by either
 $f=0.003N_0$ or
 ${f=0}$. For given
 $k$ and
 $f$, the vertical structure of the primary wave and its frequency was found by using a Galerkin method to solve (3.9), extracting the lowest frequency solution that corresponds to a mode-1 wave. The polarization relations were then used to initialize the code with the corresponding spanwise vorticity, spanwise velocity and buoyancy fields for one wavelength of the parent wave. In the simulations presented here the maximum vertical displacement amplitude,
 $A_0$, was set to be
 $A_0=0.001H$,
 $0.003H$ and
 $0.005H$, corresponding to
 $\alpha =0.025$,
 $0.075$ and
 $0.125$, respectively.
We begin by examining the evolution of a relatively small amplitude internal tide with  $A_0=0.001H$ in background rotation representative of that near Hawaii, for which
 $f=0.003N_0$ (for dimensional units, see § 2). For the primary wave with
 $kH=0.2$, its frequency is
 $\omega \simeq 0.0085N_0$, and from the frequency of the
 $2k$-superharmonic, we have
 ${\epsilon =0.096}$. Because
 $\alpha /\epsilon \sim 0.26$ is somewhat smaller than
 $1$, only the lowest superharmonics are expected to grow to significant amplitude, and they are anticipated to beat with a period
 $2{\rm \pi} /(\epsilon \omega ) \simeq 7.7\times 10^3/N_0$. With
 $N_0=0.017\ \mbox {s}^{-1}$, this corresponds to a time of
 $5.2$ days.
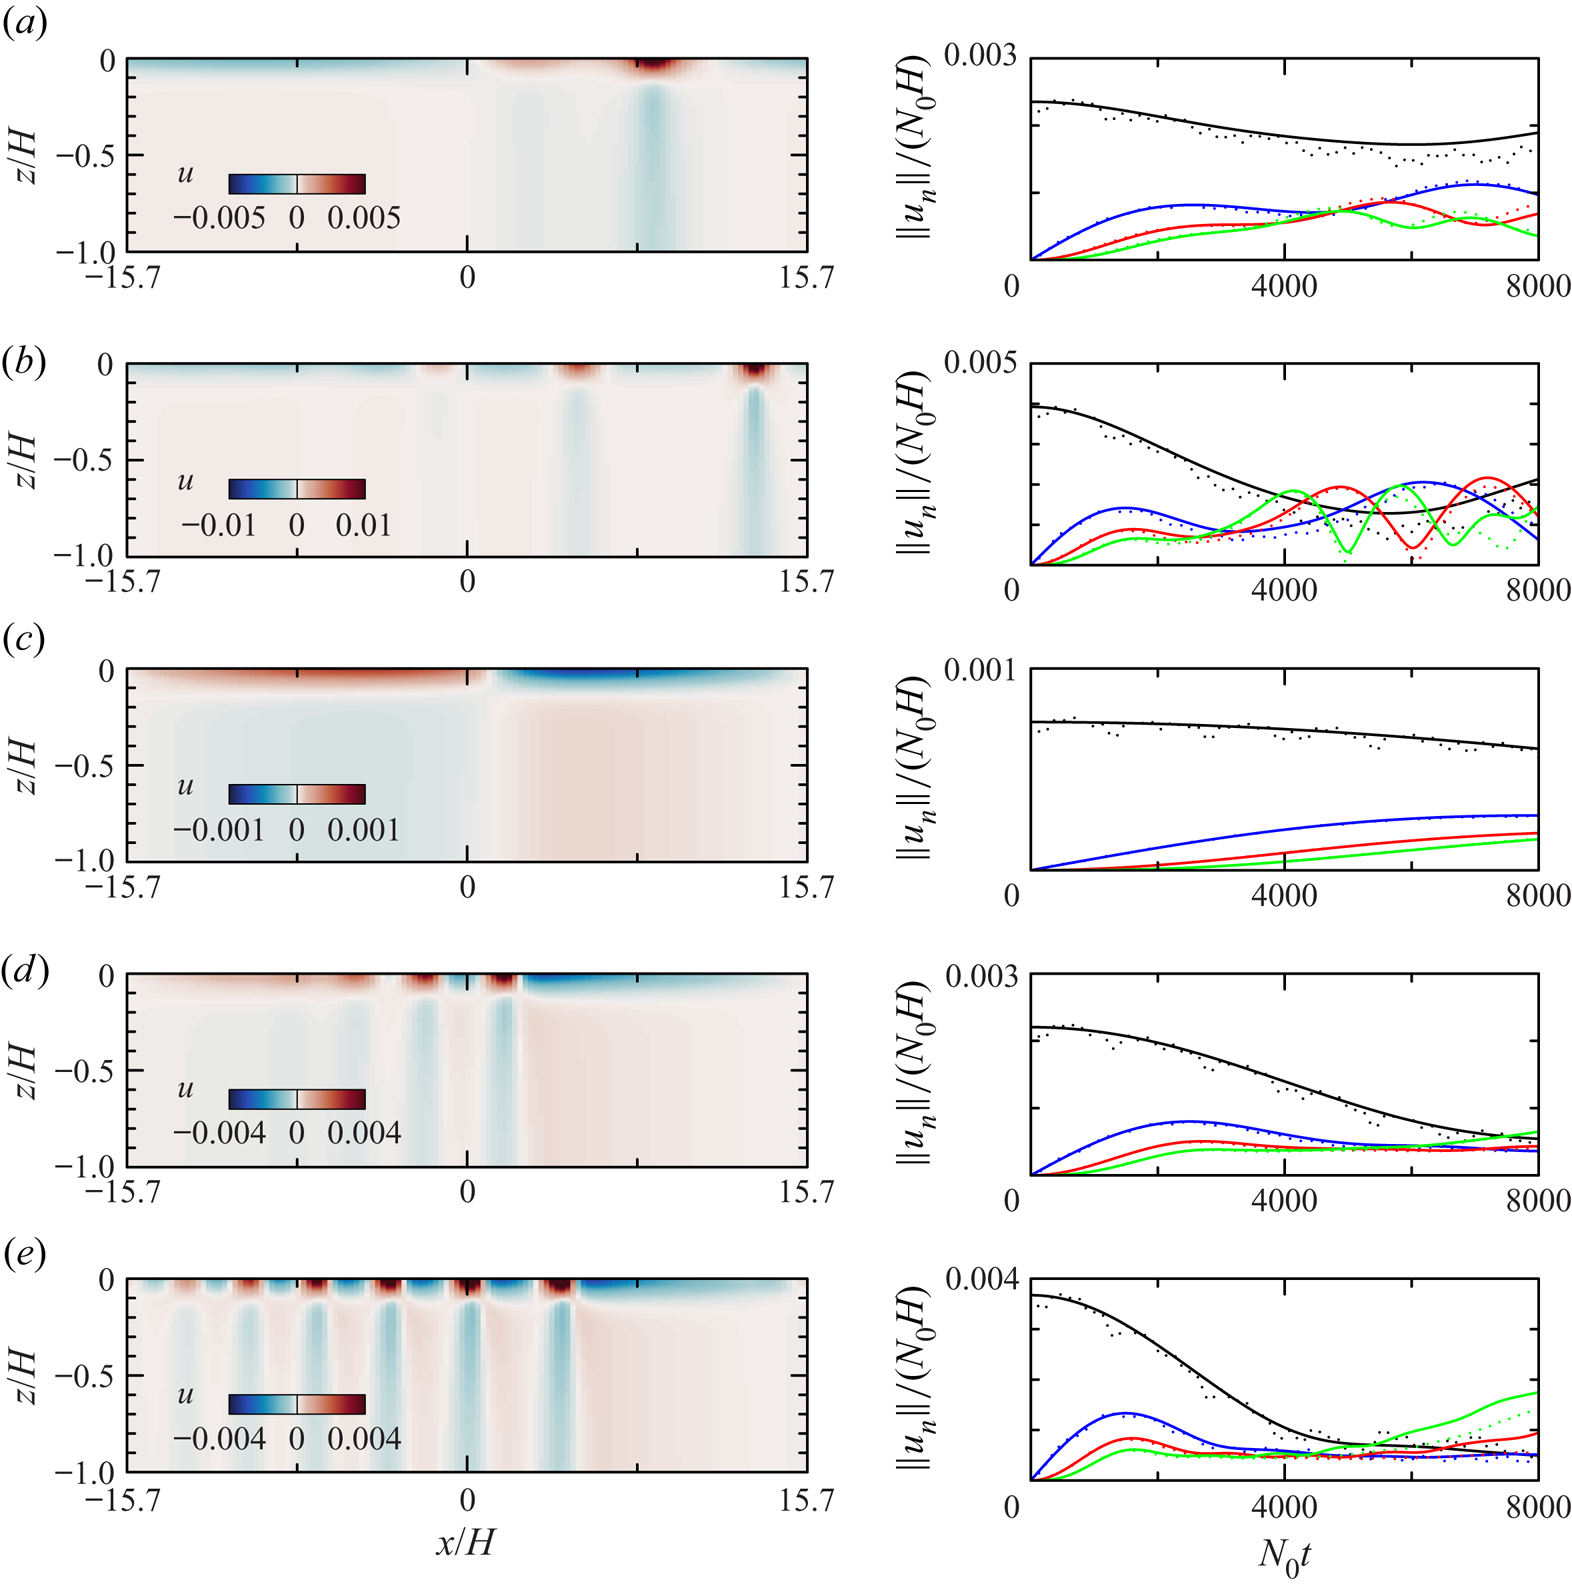
The results of the simulation and comparisons with theory are shown in figure 4. Here we choose to represent the results in terms of the horizontal velocity. A snapshot of the total horizontal velocity is shown at time  $N_0t=4000$, corresponding to
 $2.7$ days (figure 4a). This time is approximately half the predicted beat period of the superharmonics. To reveal more clearly the superharmonics, figure 4(b) plots the horizontal velocity field after subtracting the signal from the primary wave. The snapshots show that the horizontally periodic structure of the parent wave is slightly modulated by the growth of superharmonics. At the surface, the positive (waveward) flow of the total horizontal velocity (figure 4a) extends over a shorter horizontal extent than the negative flow, and it is larger in magnitude than the negative flow. Primarily, this is a consequence of the positive flow of the
 $2k$-superharmonic interfering constructively with the positive flow of the parent wave, and interfering destructively with its negative flow.
Supplementary movies are available at https://doi.org/10.1017/jfm.2022.689. From a simulation with  $f=0.003N_0$ and
 $A_0 = 0.001 H$ (
 $\alpha =0.025$), snapshots at
 $N_0t=4000$ of (a) the total horizontal velocity field and (b) the horizontal velocity field with the parent wave removed. (c) The simulated (dotted lines) and predicted (solid lines) peak horizontal velocity at
 $z=0$ associated with the parent wave (black) and superharmonics with
 $n=2$ (blue),
 $n=3$ (red) and
 $n=4$ (green). In all cases,
 $kH=0.2$ and the background stratification is exponential with
 $N=N_0$ at
 $z_0=-0.019H$ and
 $d=0.04H$.

By Fourier decomposing the horizontal flow at the surface at each time, we compare the time evolutions of the simulated amplitude of the primary wave and its superharmonics with those predicted by theory. Explicitly, from the predicted amplitudes,  $a_n(T) =a_n(\epsilon t)$, the magnitude of the surface flow associated with disturbances of horizontal wavenumber
 $nk$ is
 $\Vert u_n\Vert = \alpha (\omega d/k)\,|\hat {\psi }^\prime (0)|\,a_n$. Figure 4(c) shows excellent agreement between the simulated and predicted amplitudes of the primary wave and its first two superharmonics. Unlike the theory, the simulations exhibited small-scale oscillations about the predicted parent wave amplitude. These were due predominantly to weak interactions between the parent wave and the induced Eulerian flow, which has a mixed mode-1/mode-2 structure (Sutherland & Yassin Reference Sutherland and Yassin2022). The results show that for the moderately small value of
 $\alpha /\epsilon$ in this simulation, only the
 $2k$- and
 $3k$-superharmonics grow to significant amplitude, and the amplitude of the parent wave decreases only slightly by the time the superharmonics have grown to their largest amplitude at
 $N_0t\simeq 4000$.
By increasing the parent wave amplitude or by considering the wave evolution at lower latitudes, hence smaller  $f$ and larger
 $\epsilon$, higher superharmonics grow to significant amplitude and the parent wave amplitude decreases non-negligibly. This is shown in the results of five simulations plotted in figure 5. Here, only the total horizontal velocity field is shown in the left-hand snapshots. The right-hand plots show the time evolution of the peak horizontal velocity at
 $z=0$ for the parent wave and for the
 $2k$-,
 $3k$- and
 $4k$-superharmonics. Higher superharmonics also grow to significant amplitude, but these are not plotted. Focusing on the right-hand plots, we see that the prediction of theory agrees well with the results of numerical simulations. For
 $\alpha /\epsilon \gtrsim 1$, a superharmonic cascade becomes more evident with higher superharmonics being excited and the parent wave amplitude decreasing significantly. In the cases with
 ${f=0}$,
 $\omega \simeq 0.0080$ and
 $\epsilon \simeq 0.0035$, the predicted beat period resulting from interactions between the parent wave and the
 $2k$-superharmonic alone is
 $2{\rm \pi} /(\epsilon \omega )\simeq 2\times 10^5/N_0$ (equivalent to
 $\simeq 136$ days). Although the range of times examined in figures 5(c–e) is much smaller than the beat period, the superharmonics are observed to grow to substantial amplitude owing to the large values of
 $\alpha /\epsilon$.
(There are supplementary movies for (b,e).) As in figures 4(a,b), showing (left) snapshots of the total horizontal velocity field at  $N_0t=4000$ and (right) the simulated (dotted) and predicted (solid) time evolutions of the peak surface horizontal velocity for the parent and first three superharmonics for five different cases, with: (a)
 $f=0.003N_0$,
 $A_0 = 0.003 H$,
 $\alpha / \epsilon \simeq 0.78$; (b)
 $f=0.003N_0$,
 $A_0 = 0.005 H$,
 $\alpha / \epsilon \simeq 1.30$; (c)
 ${f=0}$,
 $A_0 = 0.001 H$,
 $\alpha / \epsilon \simeq 7.1$; (d)
 ${f=0}$,
 $A_0 = 0.003 H$,
 $\alpha / \epsilon \simeq 21$; and (e)
 ${f=0}$,
 $A_0 = 0.005 H$,
 $\alpha / \epsilon \simeq 36$.
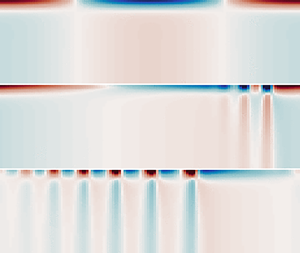
In all cases with  $\alpha /\epsilon \gtrsim 1$, the superposition of superharmonics upon the parent wave eventually results in the formation of a solitary wave train. This is characterized by a sequence of localized disturbances with enhanced positive flow near the surface. As shown in the next section, each localized disturbance is associated with a wave of depression, where the isopycnal displacement has maximum downward extent. More waves in the wave train occur and develop more rapidly if
 $\alpha /\epsilon$ is larger. Thus although multiple superharmonics are excited, their phase relationship results in a coherent wave pattern rather than devolving into a random wave field. Such patterns have also been produced through separate models based upon extensions of shallow-water theory. The comparison between our theory and the shallow-water models is presented next.
5. Comparison with shallow-water theory
Several studies have examined the nonlinear evolution of the internal tide through extensions of shallow-water theory. Here, we compare the predictions of our model with two models, namely the Ostrovsky (hereafter KdV-f) equation (Ostrovsky & Stepanyants Reference Ostrovsky and Stepanyants1989) and the Miyata–Choi–Camassa equations (Miyata Reference Miyata1988; Choi & Camassa Reference Choi and Camassa1999), adapted to include the influence of rotation (Helfrich & Grimshaw Reference Helfrich and Grimshaw2008). The latter model we refer to hereafter as the MCC-f equations.
The KdV-f equation is an extension of the Korteweg–de Vries (KdV) equation that includes the influence of background rotation. Following the notation used above, it is assumed that the vertical displacement field associated with the waves is separable, so  $\xi (x,z,t) = \eta (x,t)\,\hat {\psi }(z)$, in which
 $\eta$ satisfies (Ostrovsky & Stepanyants Reference Ostrovsky and Stepanyants1989)
 \begin{equation} \frac{\partial}{\partial x} \left[\frac{\partial\eta}{\partial t} + c_0\, \frac{\partial\eta}{\partial x} + \alpha_k \eta\,\frac{\partial\eta}{\partial x} + \beta_k\,\frac{\partial^3\eta}{\partial x^3} \right]=\frac{f^2}{2c_0}\,\eta.\end{equation}
Here,  $c_0$ is the long-wave speed found in a system with zero background rotation, and
 $\alpha _k$ and
 $\beta _k$ are parameters respectively representing the importance of nonlinearity and non-hydrostatic effects. These are determined explicitly in terms of the vertical structure function
 $\hat {\psi }$ (Benney Reference Benney1966; Grimshaw & Helfrich Reference Grimshaw and Helfrich2012). Explicitly, in the Boussinesq approximation, we have
 \begin{equation} \alpha_k =\frac{3}{2}\,c_0\,\frac{\displaystyle \int {(\hat{\psi}^\prime)}^3 \,{\rm d} z}{\displaystyle \int {(\hat{\psi}^\prime)}^2\,{\rm d} z},\quad \beta_k = \frac{1}{2}\,c_0\,\frac{\displaystyle \int \hat{\psi}^2\,{\rm d} z}{\displaystyle \int {(\hat{\psi}^\prime)}^2\,{\rm d} z}.\end{equation}
Given that the scale of  $\eta$ is
 $A_0=\alpha d$, the scale of the nonlinear term relative to the advection term is
 $d \alpha \alpha _k/c_0 \sim \alpha$, and the scale of the non-hydrostatic term relative to the advection term is
 $\beta _k k^2/c_0 \sim d^2 k^2$. In these approximations, it is assumed that
 $\hat {\psi }^\prime$ scales as
 $1/d$, the inverse characteristic depth of the stratification. The scale of the term representing the influence of rotation relative to advection is
 $f^2/(c_0 k)^2 \sim (f/\omega )^2$. The approximations leading to (5.1) assume that these three scales are in balance and small:
 $\alpha \sim (dk)^2 \sim (f/\omega )^2\ll 1$.
The MCC-f equations have been formulated for a two-layer system, in which the upper layer has depth  $h_1$, and the density jump between the lower and upper layer is represented by the reduced gravity
 $g^\prime$. The coupled equations are cast in terms of the upper-layer depth in the presence of an interfacial wave,
 $h=h_1-\eta$, the horizontal velocity differences between the lower and upper layers in the along-wave direction,
 $U=u_2-u_1$, and across-wave direction,
 $V=v_2-v_1$, and in terms of the barotropic transport in the across-wave direction,
 $Q = v_1 h + v_2 (H-h)$. The barotropic transport in the along-wave direction is assumed to be zero:
 $u_1 h + u_2 (H-h)=0$. Explicitly, the MCC-f equations are (Helfrich & Grimshaw Reference Helfrich and Grimshaw2008)
 $$\begin{gather} \frac{\partial h}{\partial t} =\frac{\partial}{\partial x} \left[ Uh\left(1-\frac{h}{H}\right)\right], \end{gather}$$
 $$\begin{gather}\frac{\partial U}{\partial t} =\frac{\partial}{\partial x} \left[ \frac{1}{2}\,U^2 \left(1-2\,\frac{h}{H}\right) + g'h\right] + f V + (D_2-D_1), \end{gather}$$
 $$\begin{gather}\frac{\partial V}{\partial t} ={-} U \left[ V\,\frac{1}{H}\,\frac{\partial h}{\partial x} - \frac{\partial V}{\partial x} \left(1-2\,\frac{h}{H}\right) + \frac{\partial Q}{\partial x} + f \right], \end{gather}$$
 $$\begin{gather}\frac{\partial Q}{\partial t} ={-}\frac{\partial}{\partial x} \left[ U Vh \left(1-\frac{h}{H}\right)\right]. \end{gather}$$
Here, the non-hydrostatic terms are represented by  $D_1$ and
 $D_2$:
 \begin{equation} D_i = \frac{1}{h_i}\,\frac{\partial}{\partial x} \left[ \frac{1}{3}\,h_i^3 \left( \frac{\partial^2 u_i}{\partial x\,\partial t} + u_i\,\frac{\partial^2 u_i}{\partial x^2} - \left(\frac{\partial u_i}{\partial x}\right)^2 \right) \right],\quad i=1,2, \end{equation}
in which  $h_2 = H-h_1$.
In order to compare our model results, for which the background stratification is continuous, to this two-layer model, we use (5.2a,b), in which the vertical structure function is that for a two-layer stratification. Thus we find
 \begin{equation} c_0 = \sqrt{g^\prime \bar{H}},\quad \alpha_k ={-}\frac{3}{2}\,c_0\,\frac{1}{\bar{H}} \left(1-2\,\frac{h_1}{H_{2L}}\right),\quad \beta_k = \frac{1}{6}\,c_0 H_{2L} \bar{H}, \end{equation}
in which  $\bar {H} = h_1 (H_{2L}-h_1)/H_{2L}$, and
 $H_{2L}$ is the total equivalent depth. These equations can be inverted so that, for given
 $c_0$,
 $\alpha _k$ and
 $\beta _k$ (determined from a system with continuous stratification), we determine the equivalent total depth and upper-layer depth, given respectively by
 $$\begin{gather} H_{2L} = 4\,\frac{\alpha_k\beta_k}{c_0^2} \left[1 +\sqrt{1+\frac{3c_0^3}{2\alpha_k^2\beta_k}}\right], \end{gather}$$
 $$\begin{gather}h_1 = 2\,\frac{\alpha_k\beta_k}{c_0^2} + H_{2L}/2. \end{gather}$$
For proper comparison with our theory and the KdV-f equation, the equivalent reduced gravity should be defined based upon the shallow-water speed  $c_f$, determined from the dispersion relation that includes the influence of background rotation. Explicitly,
 $c_f = (\omega ^2-f^2)^{1/2}/k$ and
 $g' = c_f^2/\bar {H}$.
We solved the KdV-f equation by Fourier transforming  $\eta$ in
 $x$, and then time-evolving the Fourier amplitudes. The MCC-f model was discretized in space with
 $x$-derivatives approximated by centred second-order finite differences. Both models were advanced in time using a fourth-order Adams–Bashforth–Moulton predictor–corrector scheme. The corrector step was iterated until the magnitude of the relative difference between successive fields was less than a tolerance of
 $10^{-6}$. These equations were solved in Matlab. Integrating in time up to
 $N_0t=5000$ was accomplished in seconds using our equations, in minutes for the KdV-f equation, and in about an hour for the MCC-f equations.
We compare the predictions of our theory with the KdV-f and MCC-f predictions for the two cases considered in figures 5(a,d), for which  $A_0=0.003H$, and
 $f=0.003N_0$ and
 ${f=0}$. For the exponential stratification prescribed for those cases, the corresponding vertical structure functions give the coefficients of the KdV-f equation to be
 $c_0\simeq 0.040 N_0H$,
 $\alpha _k\simeq -0.80 N_0$,
 $\beta _k\simeq 0.00060 N_0H^3$ and
 $f^2/(2c_0)\simeq 0.00011 N_0$ in the case
 $f=0.003N_0$. The equivalent parameters for the two-layer system of the MCC-f equations are
 $H_{2L}\simeq 1.31H$,
 $h_1\simeq 0.073H$ and
 $g^\prime \simeq 0.023 N_0^2H$.
The predictions of the three models are shown in figure 6. For both cases with  $f=0.003N_0$ and
 ${f=0}$, there is good qualitative agreement between the three models. All show the emergence of a single localized wave of depression in the case with
 $f=0.003N_0$, and a solitary wave train in the case with
 ${f=0}$. Quantitatively, the MCC-f model gives the poorest agreement, predicting that the waves are narrower with more waves in the wave train.
Comparison of vertical displacement predicted by (a,d) the superharmonic cascade (SHC) model, (b,e) the KdV-f equation, and (c, f) the MCC-f model, in cases with  $kH=0.2$,
 $A_0=0.003$ and (a–c)
 $f=0.003N_0$, and (d–f)
 ${f=0}$. For SHC and KdV-f, the background stratification is exponential with
 $N=N_0$ at
 $z_0=-0.019H$ and
 $d=0.04H$. For MCC-f, the equivalent parameters of the two-layer system are computed from the corresponding coefficients computed for the KdV-f equation. In all cases, the displacement is plotted at evenly spaced times, as indicated in (d), with successive times being vertically offset. The plots are given in a frame of reference moving with the phase speed
 $c_p$ of the parent wave.

Despite these minor discrepancies, it is reassuring that our superharmonic cascade model reproduces the results of the well-established shallow-water models when the parameters governing the amplitude and the importance of non-hydrostatic effects are in the appropriate regime.
6. Conclusion
We have extended the model of Baker & Sutherland (Reference Baker and Sutherland2020) to include resonances between a vertical mode-1 internal tide and an arbitrary number of its mode-1 superharmonics. The key parameter determining how many superharmonics contribute to the nonlinear evolution of the tide is given by  $\alpha /\epsilon$, which measures the relative amplitude of the parent wave to the relative beat frequency of the parent wave and its
 $2k$-superharmonic. If
 $\alpha /\epsilon \gtrsim 0.1$, then superharmonics greater than
 $2k$ play a non-negligible role in the evolution of the tide. A periodic growth and decay of low superharmonics occurs if
 $\alpha /\epsilon \lesssim 1$. For larger
 $\alpha /\epsilon$, a superharmonic cascade occurs, resulting in the internal tide transforming into a internal solitary wave train. The structure of this wave train is consistent with the predictions of well-established shallow models, KdV-f and MCC-f, that include weak non-hydrostatic effects and the influence of rotation.
Our model provides new physical insight into the processes leading to internal solitary wave trains. Generally, with the main assumption being that the parent wave and all superharmonics have a vertical mode-1 structure, the system of coupled ordinary differential equations predicts the fully nonlinear evolution of the internal tide with no restrictions on the degree to which the initial wave is non-hydrostatic (through the parameter  $\beta _k k^2/c_0 \sim (kd)^2$), large-amplitude (through the parameter
 $\alpha = A_0 k$) or influenced by rotation (through the parameter
 $f^2/(c_0k)^2\sim (f/\omega )^2$). The solution of the coupled equations agrees very well with the results of fully nonlinear numerical simulations, demonstrating that it is reasonable to restrict superharmonic disturbances to have vertical mode-1 structure. Furthermore, being a system of coupled ordinary differential equations, not involving spatial derivatives, solutions can be found quickly on a single processor in comparison with the KdV-f and MCC-f models.
Our study was focused upon examining a parameter regime consistent with observations of the  $M_2$ internal tide that emanates south-westward from Hawaii toward the equator. Though we could also have applied to the model to study the well-documented formation of internal solitary wave trains in the South China Sea (e.g. see Alford et al. Reference Alford, Lien, Simmons, Klymak, Ramp, Yang, Tang and Chang2010; Li & Farmer Reference Li and Farmer2011), our interest here is in the increasing influence of nonlinear effects upon the evolution of the internal tide as it approaches the equator. Using parameters based upon observations, we predict that the internal tide near Hawaii would be only weakly perturbed by superharmonics during the neap tide, but a solitary wave would develop during the spring tide. This would develop in a time of the order of
 $4000/N_0\simeq 3$ days. In that time, the tide would have propagated at the group velocity
 $c_g\simeq 0.037HN_0 \simeq 3.3\ \mbox {m}\ \mbox {s}^{-1}$, a distance of
 $\simeq 780$ km. This distance is sufficiently small to justify the approximation used in theory and simulations to predict the emergence of solitary waves on the
 $f$-plane.
Of course, other than the assumption that the disturbances have a mode-1 vertical structure, there are several other simplifying assumptions of the model: it is restricted to two dimensions (being spanwise-invariant), it ignores background currents, the domain depth and Coriolis parameter are assumed to be constant, and the parent wave is periodic. Future theoretical work will relax the assumption of constant  $H$ and
 $f$ using the Wentzel–Kramers–Brillouin (WKB) approximation, and the influence of the finite spanwise extent of internal tide beams will also be considered. In a companion paper, we relax the assumption of periodicity of the internal tide to examine a spatially modulated internal tide both in theory and simulations (Sutherland & Yassin Reference Sutherland and Yassin2022). Therein it is shown that the self-interaction of the internal tide and its superharmonics leads to a near-steady forcing of an induced Eulerian flow whose magnitude remains sufficiently small to have negligible influence upon the evolution of the internal tide and its superharmonics.
Supplementary movies
Supplementary movies are available at https://doi.org/10.1017/jfm.2022.689.
Funding
This research was funded in part by Natural Sciences and Engineering Research Council (NSERC) of Canada. Simulations were made possible through a resource allocation from Compute Canada applied to the supercomputers ‘graham’ and ‘cedar’.
Declaration of interests
The authors report no conflict of interest.
Appendix A. Long-wave approximation
In developing the theory in § 3 for the excitation of superharmonics and their interactions, the only approximation made was that the primary wave and superharmonics all had a mode-1 vertical structure. No restriction was put on the frequency of the waves relative to  $f$ or
 $N_0$. Because our motivation is to examine the evolution of an internal tide, for which
 $kH\ll 1$ and
 $\omega \ll N_0$, we may further simplify the expressions for the interaction coefficients (3.22) and (3.23) as well as the slow phase-shift coefficients
 $B_n$ given by (3.18a,b).
If  ${f=0}$, then the vertical structure
 $\bar {\psi }$ of long waves is given by the solution for mode-1 waves of the eigenvalue problem
 $\bar {\psi }^{\prime \prime } = - (1/c^2) N^2 \bar {\psi }$ in which the eigenvalue is the long-wave speed
 $c$. This follows by taking
 ${f=0}$ in (3.9) and assuming
 $\omega \ll N_0$. The corresponding dispersion relation is
 \begin{equation} \omega^2 \simeq c^2 k^2,\end{equation}
for  $kH\ll 1$. Putting
 ${f=0}$ in (3.22) and using
 $\omega _n=c (nk)$, we find
 \begin{equation} E_{mm} \simeq \frac{n}{4}\,d \left[\int_{{-}H}^0 N^2 \bar{\psi}^2\,{\rm d} z\right]^{{-}1} \left[ \int_{{-}H}^0 \frac{{\rm d}N^2}{{\rm d}z}\,\bar{\psi}^3\,{\rm d} z \right], \end{equation}
in which  $n=2m$. Similarly for
 $m>l$, using the approximate dispersion relation in (3.23) and using
 $n=m+l$, we find
 \begin{equation} E_{ml} \simeq \frac{n}{2}\,d \left[\int_{{-}H}^0 N^2 \bar{\psi}^2\,{\rm d} z\right]^{{-}1} \left[ \int_{{-}H}^0 \frac{{\rm d}N^2}{{\rm d}z}\,\bar{\psi}^3\,{\rm d} z \right]. \end{equation}
This is just twice the value of  $E_{mm}$ for the same value of
 $n$.
If  $|f|>0$, then the vertical structure of long waves satisfies
 $\bar {\psi }^{\prime \prime } = - \kappa ^2 (N^2/f^2 -1) \bar {\psi }$, and the dispersion relation is
 \begin{equation} \omega^2 \simeq f^2 (1 + k^2/\kappa^2),\end{equation}
in which  $\kappa$ is the eigenvalue. We can then simplify (3.22) by writing
 $\omega _n^2-f^2 \simeq f^2 (nk)^2/\kappa ^2$. If we further assume
 $\Vert N\Vert \gg f$, then the self-interaction coupling coefficients simplify to
 \begin{equation} E_{mm} \simeq \frac{n}{4}\,d\,\frac{1}{1+k^2/\kappa^2} \left[\int_{{-}H}^0 N^2 \bar{\psi}^2\,{\rm d} z\right]^{{-}1} \left\{\left(\frac{k^2}{\kappa^2} + \frac{n^2+2}{2n^2}\right) \left[ \int_{{-}H}^0 \frac{{\rm d}N^2}{{\rm d}z}\, \bar{\psi}^3\,{\rm d} z \right]\right\}. \end{equation}
To estimate the  $E_{ml}$ interaction coefficients, we further assume that
 $\omega _n\ll N_0$ for the
 $nk$-superharmonics of interest. Hence we can write
 $(N^2-\omega _n^2)/(\omega _n^2-f^2) \simeq (N^2/f^2) (nk)^2/\kappa ^2$. The expression in (3.23) thus simplifies to
 \begin{equation} E_{ml} \simeq \frac{n}{2}\,d\,\frac{1}{1+k^2/\kappa^2} \left[\!\int_{{-}H}^0 N^2 \bar{\psi}^2\,{\rm d} z\!\right]^{{-}1} \left\{\left(\frac{k^2}{\kappa^2} + \frac{n^2ml + m^2+l^2}{2n^2ml}\right) \left[\! \int_{{-}H}^0 \frac{{\rm d}N^2}{{\rm d} z}\,\bar{\psi}^3\, {\rm d} z \! \right]\right\}.\end{equation}
For the exponential stratification given by (3.10) with  $d=0.04H$ and
 $z_0=-0.019H$, the empirical solution of the eigenvalue problem gives
 $\kappa H\simeq 25\,f/N_0$ for
 $f\lesssim 0.003N_0$. Hence at these low latitudes,
 $(k/\kappa )^2\simeq 7.1 \gg 1$ for a primary wave with
 $kH=0.2$. This allows us to approximate further (A5) and (A6), resulting in the expressions found for
 ${f=0}$ given respectively by (A2) and (A3).
In the case with  $|f|>0$, we can use the dispersion relation (A4) to find approximate expressions for the time phase-shift coefficients
 $B_n$ in (3.18a,b). Explicitly,
 \begin{equation} B_n \simeq \frac{2}{3}\,\frac{n+1}{n}, \quad n=2,3,\ldots. \end{equation}
This decreases from  $1$ to
 $2/3$ as
 $n$ increases from
 $2$.
Appendix B. Energy conservation
As shown by Baker & Sutherland (Reference Baker and Sutherland2020), the coupled pair of equations given by (3.24a,b) leads to an energy conservation relation
 \begin{equation} |a_1|^2 + \frac{E_{2,-1}}{E_{1,1}}\,|a_2|^2 = \mbox{const.}\end{equation}
Similarly, the system of equations truncated at  $n_\star =3$ leads to the following conservation law:
 \begin{equation} |a_1|^2+ \frac{E_{2,-1}}{E_{1,1}}\,|a_2|^2 + \left(\frac{E_{3,-2}}{E_{2,1}} + \frac{E_{3,-1}}{E_{2,1}}\,\frac{E_{2,-1}}{E_{1,1}} \right) |a_3|^2= \mbox{const.}\end{equation}
These relations may be simplified further using the approximate formulae for the interaction coefficients given by (A2) and (A3). The integrals in these expressions cancel upon taking the ratio of the interaction coefficients, so that
 \begin{equation} \frac{E_{ml}}{E_{pq}} \simeq \left\{ \begin{array}{@{}ll} (m+l)/(p+q) & m\neq l, p\neq q, \\[2pt] (m+l)/p & m\neq l, p=q. \\ \end{array} \right.\end{equation}
In particular,  $E_{2,-1}/E_{1,1} \simeq 1$,
 $E_{3,-2}/E_{2,1} \simeq 1/3$ and
 $E_{3,-1}/E_{2,1} \simeq 2/3$. Hence in (B1) and (B2), we have, respectively,
 $|a_1|^2 + |a_2|^2 \simeq 1$ and
 $|a_1|^2 + |a_2|^2 + |a_3|^2 \simeq 1$, in which we have used the initial conditions
 $a_1(0)=1$ and
 $a_n(0)=0$ for
 $n\geq 2$.


 Open access

