Introduction
Portugal, like many European countries, has registered a steep increase in overweight and obesity prevalence over the last 30 years. These increases tend to be related to social disparities in which more deprived groups tend to show higher levels of overweight and obesity (Padez et al., Reference Padez, Fernandes, Mourão, Moreira and Rosado2004, Reference Padez, Mourão, Moreira and Rosado2005, Reference Padez, Mourao, Moreira and Rosado2009; Carvalhal et al., Reference Carvalhal, Padez, Moreira and Rosado2007; Valente et al., Reference Valente, Padez, Mourão, Rosado and Moreira2010). In the last National Study of Childhood Obesity in 2008 (Rito et al., Reference Rito, Wijnhoven, Rutter, Carvalho, Paixão and Ramos2012) Portuguese school children aged 6–8 years showed an obesity prevalence of 16.8% for boys and 13.7% for girls when using World Health Organization (WHO) reference standards (de Onis et al., Reference de Onis, Onyango, Borghi, Siyam, Nishidaa and Siekmann2007). These values place Portuguese children as having one of the highest rates of obesity in Europe, with the WHO European Childhood Obesity Surveillance Initiative revealing an obesity prevalence range for the whole of Europe of 6.0–26.6% for boys and 4.6–17.3% for girls (Wijnhoven et al., Reference Wijnhoven, Van Raaij, Spinelli, Rito, Hovengen and Kunesova2012).
Concomitantly, Portugal is still home to a considerable number of African migrants and their Portuguese-born offspring, mainly from Cape Verde, Angola and Mozambique. These communities live in adverse socioeconomic environments. Based on existing literature focusing on similar groups in other parts of the world, adverse living conditions tend to exacerbate poor health outcomes and predispose disadvantaged groups to specific health conditions such as circulatory diseases, coronary heart disease and stroke (Harding et al., Reference Harding, Teyhan, Rosato and Santana2008). The Cape Verdeans, as the second most numerous ethnic minority community in Portugal, are also the most affected by social inequalities and low educational levels (Gama, Reference Gama2002; INE, 2011). According to the last census this group accounts for a third of the foreign citizens living in Portugal. Research has shown an increase in obesity among marginalized ethnic groups in other settings (Cole et al., Reference Cole, Bellizzi, Flegal and Dietz2000; Hui & Bell, Reference Hui and Bell2003; Moore et al., Reference Moore, Gao and Bradlee2003; Ulijaszek, Reference Ulijaszek2003). Data from 1983 showed growth impairment or prolonged moderate nutritional deficiency in Cape Verdean children attending pre-school in Cape Verde even with regional variations (Wennberg, Reference Wennberg1988). However, more recent data, especially from Cape Verdean’s most rural island, Fogo, suggest a nutritional transition is already underway (Abreu, Reference Abreu2011). Other research also supports the fact that Cape Verde is well into nutritional transition (Abrahams et al., Reference Abrahams, McHiza and Steyn2011; Bosu, Reference Bosu2014) and that overweight and chronic malnutrition co-exist in Cape Verde (UNICEF & ICCA, 2011). Data from an enquiry into the prevalence of anaemia and associated factors (IPAC) in Cape Verdean children in 2009 showed that 5% of under-5-year-olds were above normal weight (Ministério da Saúde Cabo Verde, 2009).
In Portugal, a study conducted in 1991 with low/medium socioeconomic status (SES) Portuguese and Cape Verdean children aged 7–10 years in the Greater Lisbon Metro Area showed that there were no differences in height, even though Cape Verdeans were born lighter (Gama, Reference Gama1993). Cape Verdean children living in Portugal were taller than their counterparts from the islands but thinner and shorter than the US references (Frisancho, Reference Frisancho1990; Gama, Reference Gama2002). Biosocial factors influenced these children’s growth, as shown by the positive effect of birth order and parental educational level (Varela-Silva, Reference Varela-Silva2004) on children’s weight and height, respectively. In 2002 Gama revealed that Cape Verdean children living in Portugal were thinner than Portuguese children aged 6–11 years living in Lisbon (Gama, Reference Gama2002). In comparison with Cape Verdean children from the islands, Cape Verdean children living in Portugal were taller and heavier, which might have been due to favourable living conditions. Later on, in 2004, the same trend was observed by Varela-Silva, who compared Portuguese children, Cape Verdean children born in Portugal and Cape Verdean children living in Cape Verde in 1993, 1999 and 2001 (Varela-Silva, Reference Varela-Silva2004).
The aim of the present study was to assess the health and nutritional status indicators of Cape Verdean children aged 6–12 years living in the Greater Lisbon Metro Area (urban setting) of Portugal using three databases from different time periods (1992, 2009, 2013), and to compare these with the health and nutritional status of a sample of Portuguese children (2009) of a similar age. This paper covers a period during which a European economic crisis occurred and fills an important gap in the literature over this time period in growth studies among ethnic minorities living in Portugal, enabling a comparison of the anthropometric status of Cape Verdean children living in Portugal with their Portuguese-origin counterparts.
Methods
Study population
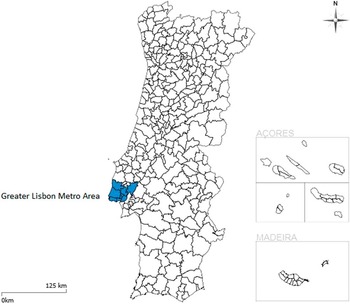
This paper focuses on the Cape Verdean community living in the Cova da Moura neighbourhood of the Greater Lisbon Metro Area (Fig. 1). Cape Verdean children aged 6–12 years with Cape Verdean ancestry and attending public schools within the neighbourhood were recruited. Ancestry was assessed by semi-structured interview, and those with one Cape Verde grandparent on the paternal or maternal side and parents who were born in Cape Verde were assigned Cape Verdean ancestry. The majority of the children were born in Portugal (70–80%). Portuguese ancestry was assessed by a questionnaire mailed to parents. Portuguese ancestry children were those with parents who were both Portuguese.
Geographical position of Greater Lisbon Metro Area in Portugal (map from www.pordata.pt).

Study design and setting
The first dataset (CVPT92) was collected between 1992 and 1993 for a doctoral thesis and had a sample size of 164 Cape Verdean children (96 boys and 68 girls with mean age of 8.27±1.41 years). Part of this dataset has been published previously (Garcia-Ruiz & Marrodán, Reference Garcia-Ruiz and Marrodán2000). The second dataset (CVPT09) was collected between December 2008 and March 2009 and its sample size was 170 children (70 boys and 100 girls with mean age of 8.59±1.65 years). A more recent database (CVPT13) was collected in 2013/14. This sample comprised 89 children (41 boys and 48 girls with mean age of 8.61±1.4 3years). All projects on the Cape Verdean community were conducted in almost the same schools in Cova da Moura neighbourhood, meaning they covered the same area over time. The numbers are not known for the first dataset (CVPT92) but for the 2009 study all children from the schools were recruited (226) and 221 were measured, giving a 98% participation rate. Also for the later dataset (2013), 107 children were recruited and 101 were measured, which gives a 94% participation rate.
These Cape Verdean samples were compared with a nationally representative database (PT09) of 10,619 Portuguese children with Portuguese parents (5153 boys and 5466 girls) measured between 2009 and 2010. For this paper only data from children residing in the Portuguese territory of Lisbon district and in an urban setting (n=1648, 817 boys and 831 girls with mean age 7.85±1.28 years) were analysed from the national database to ensure that children from the same area of Portugal were compared. With this national study (PT09) a final sample of 17,509 children were observed and the final participation rate was over 60% for school children (63.6%).
Cova da Moura neighbourhood
This neighbourhood is one of the oldest areas for Cape Verdean migrants in Lisbon dating from the 1970s. The neighbourhood had an estimated population of approximately 4800 in 2008 (INE, 2002). Recent data from the local socio-cultural association Moinho da Juventude estimates that about 6000 people now live in the neighbourhood (Associação Cultural Moinho da Juventude, 2012). Sixty per cent of these are of African origin, mainly Cape Verdean, with half being under the age of 20 years. The neighbourhood tends to suffer from social and ethnic discrimination that is reinforced by a poor public image portrayed by the media. There are small shops within the physical space of the neighbourhood. Some children do not have many opportunities to leave the neighbourhood during their early years because of the long working hours of their parents and because they are looked after by relatives and friends living in the neighbourhood (fieldwork observations). There are daily sellers that stop by the neighbourhood to sell fresh fish and fruit, and many even sell ingredients used to prepare traditional Cape Verdean dishes. Local associations working in the neighbourhood have developed several support programmes for local child-minders, professional development and help with documentation or revenue issues (Associação Cultural Moinho da Juventude, 2012).
Ethical approval
The first database on Cape Verdeans dates from 1992 and was approved by the ethics committee of San Carlos Clinical Hospital of Complutense University. Cape Verdean databases from 2009 and 2013 were firstly approved by Loughborough University’s advisory sub-committee with research proposal Ref. No. R13-P56. The 2013 database was also approved by the ethics council of Instituto de Higiene e Medicina Tropical, Universidade Nova de Lisboa, Lisbon, Portugal. The study protocol and informed consent for the Portuguese national database 2009 (Bingham et al., Reference Bingham, Varela-Silva, Ferrão, Gama, Mourao and Nogueira2013) was approved by the Direcção Geral de Inovação e Desenvolvimento Curricular (DGIDC).
Variables
The anthropometric profile of each child included: height (cm), weight (kg), sitting height (cm), triceps, subscapular and biceps skinfolds (mm) and abdominal, arm and waist circumferences (cm). Participants were measured lightly dressed and barefoot or with light socks. All measurements were performed following standardized procedures (Lohman, Reference Lohman, Roche and Martorell1988).
Subsequently other parameters were calculated: normal weight and over-nutrition categories of overweight and obesity were matched with the International Obesity Task Force (IOTF) references (Wijnhoven et al., Reference Wijnhoven, Van Raaij, Spinelli, Rito, Hovengen and Kunesova2012). Stunting, defined as low height-for-age, was classified as below −2 standard deviations for WHO (Frisancho, Reference Frisancho2008). A semi-structured interview was conducted with children’s parents/guardians in order to assess maternal and parental ages, child’s age, educational levels, occupational status and neighbourhood resources. When comparing the three databases common variables available in all databases were used for child anthropometry: height, weight, sitting height, arm circumference, and triceps and subscapular skinfolds. For sociodemographic variables, parental education, occupation, ancestry, birth weight and breast-feeding data were available in the PT09 and CVPT13 databases (see Table 1).
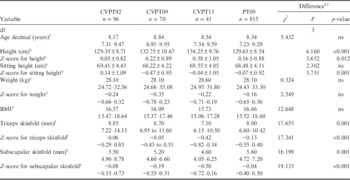
Descriptive characteristics (mean/median±SD/IQRFootnote a and ANOVAFootnote a ) of Portuguese and Cape Verdean boys

a Mean/SD are presented where the data were normally distributed and ANOVA was applied (x). Median/IQR (interquartile range) are presented where the data were non-normally distributed and the Kruskal–Wallis rank sum test was applied (y); ns: non-significant values; df: degrees of freedom from ANOVA test.
Statistical procedures
Data were analysed with SPSS version 22.0. Descriptive statistics included a chi-squared analysis to compare the prevalence of under- and over-nutrition between the samples. Analysis of variance (ANOVA) allowed the comparison of anthropometric scale measures between the samples. Appropriate post hoc statistics were calculated to identify which differences were significant. The Portuguese (PT09) and Cape Verdean databases (CVPT13) were used in subsequent analysis because they shared common variables like parental education, occupation and breast-feeding duration, which allowed factors associated with overweight and obesity to be identified. The CVPT09 and CVPT92 databases did not include the same level of detail regarding socio-demographic factors so they were excluded from the analysis of the factors associated with overweight and obesity. Logistic regression was performed between PT09 and CVPT13 for comparison and this permitted determination of the biological (birth weight and breast-feeding status) and socio-demographic (maternal education and occupation) factors associated with overweight and obesity to assess differences in nutritional status between the two ethnic groups. Only models for overweight and obesity are presented because of the low prevalence of under-nutrition across all of the samples. Odds ratios and 95% CIs are presented. Model fit was demonstrated using Hosmer–Lemeshow statistics. Models were built by entering age, sex and ancestry with Portuguese as reference at Step 1. Subsequently at Step 2 significant socio-demographic variables from an unadjusted analysis were included. This strategy allowed the identification of differences between the samples explained by the biological and socio-demographic factors entered into this step of the model-building process.
Results
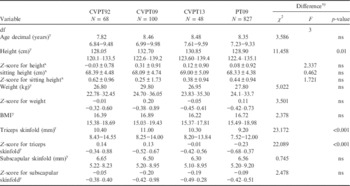
Table 1 shows that there were significant differences for height and height Z-scores, Z-scores for sitting height, triceps and subscapular skinfolds and Z-scores for these measures between Cape Verdean and Portuguese boys aged 6–12 years between the four databases. There were fewer differences for Cape Verdean girls (Table 2), with only height and triceps skinfolds/triceps Z-scores revealing significant differences compared with the Portuguese sample (p<0.05).
Descriptive characteristics (mean/median±SD/IQRFootnote a and ANOVAFootnote a ) of Portuguese and Cape Verdean girls
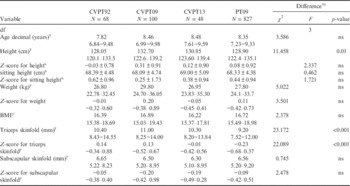
a Mean/SD are presented where the data were normally distributed and ANOVA was applied (x). Median/IQR (interquartile range) are presented where the data were non-normally distributed and the Kruskal–Wallis rank sum test was applied (y); ns: non-significant values; df: degrees of freedom from ANOVA test.
An analysis of variance showed that there were differences in height among boys F(3)=6.160, p=0.007. Gabriel’s post hoc test (ANOVA) used for unequal group sizes showed that there were significant differences between Portuguese (PT09) (mean=129.63, SD=8.54) and two of the Cape Verdean datasets (CVPT09: mean=132.75, SD=10.67; CVPT13: mean=134.25, SD=9.76). The Z-score for height (F(3)=3.652, p=0.012) was significantly higher for Cape Verdean boys measured in 2013 (CVPT13: mean=0.58, SD=1.05) than for the Portuguese (mean=0.16, SD=0.88) and the Cape Verdean boys measured in 1992 (CVPT92: mean=0.05, SD=0.82). On the other hand, Cape Verdean boys measured in 2009 had a lower Z-score for sitting height (mean=−0.47, SD=0.95) compared with the Portuguese (mean=−0.07, SD=0.92) and the 1992 Cape Verdean database (CVPT92: mean=0.14, SD=1.09; F(3)=5.751, p=0.001).
A Kruskal–Wallis rank sum test using a chi-squared statistic of independence was performed to determine the association between variables with a non-parametric distribution. Subsequently, Mann–Whitney tests were performed for associations given as significant by the Kruskal–Wallis test to determine which groups were significantly different. The results are shown accounting for Bonferroni adjustment for the final p-value. For boys the Z-score for triceps skinfold (χ 2 (3, 1020)=17.341, p≤0.01) was significantly lower for CVPT13 (median=−0.42, IQR (25–75%)=−0.82–0.34) compared with the Portuguese (median=−0.13, IQR=−0.55–0.40) and the Cape Verdean 1992 databases (CVPT92: median=0.06, IQR=−0.29–0.85). For the subscapular Z-score (χ 2 (3, 1020)=19.133, p≤0.01), CVPT92 (median=−0.08, IQR=−0.33–0.73) had significantly higher medians than the CVPT13 (median=−0.50, IQR=−0.72–0.16) and PT databases (median=−0.04, IQR=−0.40–0.50).
The girls’ height from the CVPT09 database (median=132.7, IQR=122.6–139.2) was significantly higher (χ 2 (3, 1041)=11.458, p≤0.01) compared with the Portuguese (median=128.9, IQR=122.4–135.1) and their counterparts measured in 1992 (CVPT92: median=128.1, IQR=120.1–133.5). However, no significant differences were found in Z-scores for height for girls suggesting that age differences in the sample may have been responsible for the significant differences in the raw height data observed. For the skinfolds, the triceps Z-score (χ 2 (3, 1041)=22.089, p≤0.01) was higher for CVPT09 (median=0.13, IQR=−0.52–0.67) compared with the Portuguese (median=−0.23, IQR=−0.68–0.37) and lower than the CVPT92 databases (median=−0.01, IQR=−0.43–0.56).
Cape Verdean children’s nutritional status
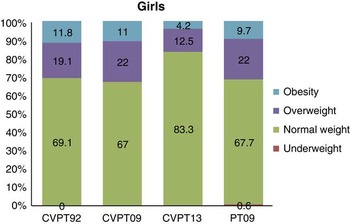
Nutritional status was assessed using under- and overweight prevalence. No significant differences were found in nutritional status between Cape Verdean ancestry children from the three different databases. Overweight prevalence was lower in the 2013 sample compared with the 1992 sample for boys (22.9% in 1992 and 9.8% in 2013) and girls (19.1% in 1992 and 12.5% in 2013). None of the Cape Verdean boys measured in 2013 was considered obese while 4.2% of the girls were. In 1992 the scenario was different and there were 11.5% obese boys and 11.8% obese girls.
Comparing the nutritional status of Cape Verdean and Portuguese children in Lisbon
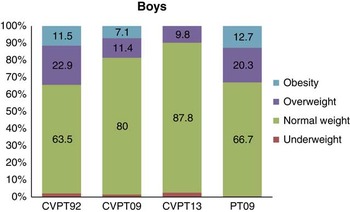
When comparing Cape Verdean children with the Portuguese national study (Fig. 2), significant differences were found only for over-nutrition among boys (χ 2(3)=16.827, n=1022, p≤0.001) (data not shown). There was more overweight and obesity among Portuguese boys (20.3% and 12.7%, respectively) when compared with Cape Verdean boys in 2013 (9.8% and 0%, respectively, for the 2013 database; p≤0.001) and even when compared with Cape Verdean children in the same year 2009 (11.4% overweight, 7.1% obesity; p<0.05). However, more stunting was also observed in Portuguese boys even if the percentage was small (four cases) and non-significant.
Over- and under-nutrition rates for boys using IOTF and WHO cut-off points on Cape Verdean ancestry and Portuguese databases.

For girls no statistically significant differences in overweight and obesity or under-nutrition were found for any of the references used between the samples (Fig. 3). However some trends could be observed. For example, more Portuguese girls were classified as overweight (22%) or obese (9.7%) in comparison with Cape Verdean girls (12.5% and 4.2%, respectively, non-significant).
Over- and under-nutrition rates for girls using IOTF and WHO cut-off points on Cape Verdean ancestry and Portuguese databases.

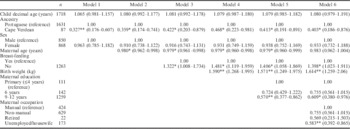
The results of the logistic regression using the Hosmer–Lemeshow test revealed that the model fitted the data well (Model 6: χ 2=1.440, p=0.994) (Table 3). Breast-feeding (yes/no), birth weight (kg), maternal education and occupation were significantly associated with overweight and obesity. However, age and sex were not statistically significantly associated with overweight and obesity in these Portuguese children. The variables entered in the model did not fully explain the difference between the Portuguese and the Cape Verdean samples. A lower risk of overweight and obesity was identified for the Cape Verdean sample compared with the Portuguese children with an odds ratio of 0.403 (95% CI 0.186–0.876) in the last model, which adjusted for the potentially confounding effects of age, sex, maternal age, maternal education, maternal occupation, birth weight and whether the child was breast-fed on this association (Model 6). Further, in addition to being Cape Verdean, other significant protective factors for overweight and obesity were identified in the final step of the model: being breast-fed, lower birth weight, having a mother with more years of education, and having a mother with an occupation that resulted in her spending more time at home, such as being unemployed or a housewife. Maternal occupation was also related with lower risk when the mother stayed at home.
Odds ratios (95% CIs) from logistic regression model of socio-demographic and biological predictors of overweight and obesity for children of Portuguese and Cape Verdean ancestryFootnote a
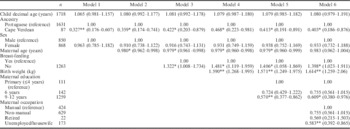
Data sources: Portuguese children, PT09; Cape Verde ancestry children, CVPT13.
a Odds ratios and 95% confidence intervals for the significant predictors of children being overweight and obese (by IOTF standards) vs normal weight; the model excludes 546 cases because of missing data.
Probability of being overweight and obese in Portuguese database is significantly different from that in the reference category at the following levels: *p<0.05; **p<0.01.
Discussion
On comparing the Cape Verdean ancestry populations with the nationally representative Portuguese dataset during the economic crisis in 2008 it was found that linear growth (height) among Cape Verdean children samples increased over time, especially for boys. In contrast there were no significant increases in weight over the same period for the Cape Verdean samples. This has resulted in good outcomes for BMI and adiposity indicators (subscapular and triceps skinfolds) for this population during this difficult period. This pattern of change in height was only statistically significant for the male sample, although the direction of the trend was similar but not statistically significant for females, with an increase in height between the 1992 and 2009/2013 samples. The findings further reveal a lower risk of overweight and obesity of Cape Verdean ancestry children compared with the Portuguese, even after adjusting for potentially confounding factors (age, sex, maternal age, birth weight, whether the child was breast-fed, maternal education and maternal occupation). In addition to being Cape Verdean other significant protective factors for overweight and obesity identified in the model were being breast-fed, being of lower birth weight, having a mother with more years of education and having a mother who spends more time at home, such as being unemployed or a housewife.
Favourable changes might be observed in linear growth following the fast development of some countries’ economies (Martorell & Zongrone, Reference Martorell and Zongrone2012), and this seems to have happened to the Cape Verdean children living in Portugal. Even though living in a ‘deprived’ neighbourhood in the Portuguese context they seem to have benefited from the positive environmental conditions Portugal has experienced over the past 40 years compared with their country of origin. Entrance to the EU in 1986 brought rising wages, better infrastructure and higher household incomes. Moreover, there were important improvements in Portuguese society in, for example, health care services, educational levels and socioeconomic status (Veiga et al., Reference Veiga, Moreira and Fernandes2004; OECD, 2011). Cape Verdeans living in Portugal currently have better access to health services and school nutritional programmes than they would have had in Cape Verde (UNICEF, 2015). This finding is not unique to this population: for example the American-Maya children after migrating from Mexico to Florida experienced an improvement in their growth and living conditions (Smith et al., Reference Smith, Bogin, Varela-Silva, Orden and Loucky2002; Bogin, Reference Bogin2012). Moreover, there is also the ‘healthy migrant effect’ in which the population that migrates is usually in better health condition due to younger age and being at work (DesMeules et al., Reference DesMeules, Gold, Kazanjian, Manuel, Payne, Vissandjee, McDermott and Mao2004; Ronellenfitsch & Razum, Reference Ronellenfitsch and Razum2004; Buron et al., Reference Buron, Cots, Garcia, Vall and Castells2008; Garcia-Gomez & Oliva, Reference Garcia-Gomez and Oliva2009).
However, in earlier studies conducted in 1989 and 1992 no differences in height were found between Portuguese and Cape Verdean children (Garcia-Ruiz & Marrodán, Reference Garcia-Ruiz and Marrodán2000; Gama, Reference Gama2002). On the other hand, Varela-Silva (Reference Varela-Silva2004) found a negative trend in height and weight for Portuguese and Cape Verdean for boys between 1993, 1999 and 2001. This is consistent with the present results, as the author explained it might be because boys are more susceptible to adverse environmental conditions. This was studied by Stinson (Reference Stinson1985), who found that differences in growth among boys and girls were reflected first in boys’ physical growth and development. The same author (Varela-Silva, Reference Varela-Silva2004) suggested that it might also be that the pace of the developmental process makes boys more vulnerable to environmental inequalities. Girls have been shown to experience the effects of nutritional transition in other societies as well. For example, South African adolescent girls experience nutrition transition earlier than boys and show more risk for over- than under-nutrition, whilst boys still show a higher risk of under- than over-nutrition (Pradeilles et al., Reference Pradeilles, Griffiths, Norris, Feeley and Rousham2015). Furthermore, sub-Saharan African boys have been shown to be more affected by stunting related to socioeconomic deprivation (Wamani et al., Reference Wamani, Astrøm, Peterson, Tumwine and Tylleskär2007).
Furthermore, living conditions in Portugal have been translated into height increases for Cape Verdeans compared with those born in Cape Verde (Gama, Reference Gama2002). The current findings show that Cape Verdean children are not disadvantaged in linear growth compared with other Portuguese children of similar age living in a similar environment or compared with the international growth references. It appears there have been further improvements in the linear growth of Cape Verdean children since 2002 despite the difficult economic climate in Portugal in the later part of this period. Further, there is an almost absence of stunting (low height-for-age) among this population.
Consequently the fact that 2013 Cape Verdean ancestry children are protected from overweight and obesity in comparison to Portuguese children living in similar environments suggests that, even after controlling for a range of socio-demographic and biological factors, this Cape Verdean community have experienced the positive aspects of nutritional transition in relation to linear growth without the negative aspects associated with becoming overweight or obese. Despite relative deprivation compared with the Portuguese, this Cape Verdean community appears to have reaped the benefits of the Portuguese social system as it settled. This is much like the Maya experience in Florida (Bogin, Reference Bogin2012). It is possible that cultural factors might explain improvements in linear growth without associated changes in weight. In Portugal 40% of the babies are breast-fed (OECD, 2009) while in Cape Verde 60% are exclusively breast-fed until 6 months (UNICEF, 2015). There is mixed evidence in the literature surrounding the association between breast-feeding and risk of overweight and obesity, although others do document a similar relationship to that found in this study in Portugal. For example, a study of Portuguese mothers showed that breast-feeding a child for 3–6 months or more than 6 months was associated with a decreased risk of overweight (Padez et al., Reference Padez, Mourão, Moreira and Rosado2005). The logistic regression analysis revealed that breast-feeding behaviour explains some of the difference in risk for overweight and obesity between Cape Verdean ancestry and other Portuguese children. After including the breast-feeding variable in the model there was a change in the ancestry parameter effect of close to 18%. This could therefore be an important cultural factor influencing the risk for overweight and obesity. Observations from fieldwork show that this community is still following a fairly traditional diet assured by the local businesses that supply food and a wide range of services. Moreover, the neighbourhood’s social support systems have helped protect children from Westernizing influences by keeping them in the physical space and also watching out for them. Children can safely ‘play’ outside despite the sometimes unsafe episodes that happen in this space. This might result in more physically active children when compared with the Portuguese whose screen viewing time, for example, has been linked to higher obesity rates (Carvalhal et al., Reference Carvalhal, Padez, Moreira and Rosado2007).
The limitations of the study are the small sample size of the Cape Verdean samples, which could limit the representation of these samples at the different time points. Moreover, the Portuguese sample was restricted to the Lisbon district and might mask people of different socioeconomic status. Furthermore, missing information from the 1992 dataset might have affected the representation of the sample. Nevertheless one of the authors (VR) was present at data collection for all the datasets referred to in this paper, and he can give assurance that similar strategies were followed for the recruitment of participants and data collection.
In conclusion, Cape Verdean children seem to have benefited from the better living conditions they experienced in Portugal. This trend is more pronounced for the 2013 sample, and is positive and significant for boys for height. Even though coming from a deprived neighbourhood, these children have better nutritional status than Portuguese children. The next task for policymakers should be to improve the socioeconomic status of these households while preserving their cultural practices and protecting against Westernized influences. Subsequent studies should focus on more objective measurements of environmental variables (Harding et al., Reference Harding, Boroujerdi, Santana and Cruickshank2006) such as diet, social support, physical activity and disease among ethnic minorities like the Cape Verdean (Nogueira & Santana, Reference Nogueira and Santana2005).
Acknowledgments
The authors would like to thank to all participants and institutions involved in this project. They especially want to thank Carmen Garcia-Ruiz, Maria Dolores Marrodán and Joelma Almeida for sharing data from previous studies with Cape Verdean children, and V. Rosado-Marques for providing support for fieldwork and insight into the study community. The 2013 project was part-funded by a studentship awarded by Loughborough University. The authors declare that they have no competing interests.