Introduction
The magnetic effects of nanoparticles are especially complex because of their reduced dimensions. In particular, the reduced atomic coordination at the surface leads to a reduction in the Curie temperature and significant deviation of the temperature dependence of the magnetization from that in the thermodynamic limit. Reference Binder and Heermann1 Another important surface property is the surface anisotropy. This arises from the fact, as shown by ab initio calculations, Reference Gambardella, Rusponi, Veronese, Dhesi, Grazioli, Dallmeyer, Cabria, Zeller, Dederichs, Kern, Carbone and Brune2,Reference Lazarovits, Szunyogh and Weinberger3 that the electronic structure is significantly different at the surface when compared to that for a bulk crystal. This is also supported by experimental results on clusters Reference Jamet, Wernsdorfer, Thirion, Dupuis, Mélinon, Pérez and Mailly4,Reference Eastham and Kirkman5 demonstrating a significant change in magnetic properties for surface atoms. The specifics of surface anisotropy depend on the material at the surface, for example a non-magnetic metal coating could give very different results than an organic coating or vacuum.
The properties of magnetic nanoparticles are also strongly dependent on the presence of interfaces. The archetypal example is the phenomenon of exchange bias, which is a shift of the hysteresis loop in a magnetization versus magnetic field plot. Exchange bias was first discovered in 1956 by Meiklejohn and Bean, Reference Meiklejohn and Bean6 who found that oxidized cobalt nanoparticles exhibited such a shift under field cooling of the sample. This was the first example of a core–shell system, the shifted loops arising from interaction between the ferromagnetic cobalt core and antiferromagnetic cobalt oxide shell. Exchange biased systems are still an active area of research, partly due to their intrinsic complexity Reference O’Grady, Fernandez-Outon and Vallejo-Fernandez7 and technological applications in magnetic read heads and potential future applications in magnetic random access memory. Reference Parkin, Roche, Samant, Rice, Beyers, Scheuerlein, O’Sullivan, Brown, Bucchigano, Abraham, Lu, Rooks, Trouilloud, Wanner and Gallagher8 Renewed interest has recently been shown in core–shell exchange bias systems due to their potential application in increasing the superparamagnetic limit of small magnetic nanoparticles used in data storage systems. Reference Skumryev, Stoyanov, Zhang, Hadjipanayis, Givord and Nogués9,Reference Evans, Yanes, Mryasov, Chantrell and Chubykalo-Fesenko10 We will discuss the origin of the exchange bias effect later in this article.
Magnetic nanoparticles are an important example of a multiscale problem. Atomistic spin models are used to calculate thermodynamic properties and interface effects. Reference Evans, Bate, Chantrell, Yanes and Chubykalo-Fesenko11–Reference Eftaxias and Trohidou13 At the same time, assemblies of nanoparticles will be subject to the effects of interparticle magnetostatic interactions. The magnetostatic interaction is very long-ranged (extending over micrometer length scales), and modeling its effects at the atomic level requires its own specialized computational technique. The effect of magnetostatic interactions can have a profound and complex effect on the properties of magnetic nanoparticle systems. Reference Burrows, Parker, Evans, Hancock, Hovorka and Chantrell14,Reference Haase and Nowak15 However, this is beyond the scope of the current article.
In this article, we concentrate on the intrinsic properties of individual nanoparticles and focus on theoretically simulating the atomistic level. The link between electronic structure calculations and macroscopic magnetic properties is difficult to establish in general. Currently available approaches generally involve mapping ab initio information onto an atomistic spin model. Reference Mryasov, Nowak, Guslienko and Chantrell16,Reference Nowak, Wieser, Mryasov, Guslienko and Chantrell17 Here, we present an outline of the physical phenomena in magnetic nanoparticles arising from surfaces and interfaces, with particular reference to models at the atomistic level.
Atomistic model
Here, we outline the basis of a classical atomistic spin model to describe the magnetic properties of the system. In order to allow the treatment of core–shell ferromagnetic-antiferromagnetic (FM-AFM) nanoparticles, we have used a Heisenberg spin Hamiltonian that describes the energetics of a FM core and AFM shell given by, respectively,
 $${\cal H} = {{\cal H}_{{\rm{fm}}}} + {{\cal H}_{{\rm{afm}}}}$$
 $${\cal H}_{{\rm{fm}}} = \sum\limits_{i,j} {J_{{\rm{fm}}} {\rm{S}}_i \cdot {\rm{S}}_j } + \sum\limits_{i,v} {J_{{\rm{fm}} - {\rm{afm}}} {\rm{S}}_i \cdot {\rm{S}}_v } - K_{{\rm{fm}}} \Sigma _i \left( {S_i^z } \right)^2 - \mu _{{\rm{fm}}} \Sigma _i H_{{\rm{app}}} \cdot {\rm{S}}_i $$
 $${\cal H}_{afm} = \sum\limits_{v,\delta } {J_{afm} {\rm{S}}_v \cdot {\rm{S}}_\delta } + \sum\limits_{v,j} {J_{fm - afm} {\rm{S}}_v \cdot {\rm{S}}_j } - K_{afm} \Sigma _v \left( {S_v^2 } \right)^2 - \mu _{afm} \Sigma _v {\rm{H}}_{app} \cdot {\rm{S}}_v ,$$
where S is unit vectors describing the direction of an atomic site magnetic moment; i, j are label ferromagnetic sites with moment μfm; and ν, δ are label antiferromagnetic sites with moment μafm. J fm, J afm, and J fm−afm are the nearest neighbor exchange interactions for the FM core, AFM shell, and the interfacial exchange between them, respectively. A uniaxial anisotropy is applied to both the core and shell with an easy axis along the z-direction. The magnitude of the anisotropy is different for the ferromagnet and antiferromagnet, given by the constants K fm and K afm, respectively. The Néel surface anisotropy model Reference Néel18,Reference Jamet, Wernsdorfer, Thirion, Dupuis, Melinon, Perez and Mailly19 is used for surface spins with less than the full coordination number, which approximates the effect of missing neighbors on the local magneto-elastic strain and results in a local anisotropy. The dynamic response of the atomistic spin system is modeled using the Landau–Lifshitz–Gilbert equation with Langevin dynamics, Reference Evans, Yanes, Mryasov, Chantrell and Chubykalo-Fesenko10,Reference Evans, Bate, Chantrell, Yanes and Chubykalo-Fesenko11 enabling the simulation of temperature effects, including the phase transition.
Surface anisotropy
Magnetic surface effects manifest themselves in multiple ways, including, but not limited to, the lack of crystallographic symmetry on the surface, Reference Jamet, Wernsdorfer, Thirion, Dupuis, Mélinon, Pérez and Mailly4 expansion or contraction of the lattice structure, Reference Dorfbauer, Evans, Kirschner, Chubykalo-Fesenko, Chantrell and Schrefl20,Reference Evans, Dorfbauer, Chubykalo-Fesenko, Schrefl and Chantrell21 reduction in coordination number, roughness, unquenched orbital moment Reference Bruno22 and anisotropic exchange interactions, Reference Szunyogh and Udvardi23 and charge transfer phenomena. Reference Luis, Bartolomé, Petroff, Bartolomé, García, Deranlot, Jaffrès, Martínez, Bencok, Wilhelm, Rogalev and Brookes24,Reference Binns, Baker, Edmonds, Finetti, Maher, Louch, Dhesi and Brookes25 In practice, it is impossible to separate these effects: All of them contribute to the phenomenological surface anisotropy. Experimentally, it is customary to characterize the surface anisotropy via size-dependent measurements of the relevant energy barrier. The surface anisotropy is then calculated from a formula, Reference Bodker, Mörup and Linderoth26 which has become a central feature in the study of magnetic nanoparticles: Reference Fiorani27–Reference Pérez, Guardia, Roca, Morales, Serna, Iglesias, Bartolomé, García, Batlle and Labarta32
 $${K_{eff}} = {\textstyle{{\Delta E} \over V}} = {K_V} + {\textstyle{{{K_{{\rm{surf}}}}} \over D}},$$
where K eff is the effective anisotropy of the system, D is the nanoparticle diameter, V is the particle volume, and K surf is the (“effective”) surface anisotropy. ΔE is the relevant energy barrier, determined, for example, using ac-susceptibility measurements, and K V is the volume anisotropy. The relationship to the energy barrier depends on the anisotropy. If K C is the core magnetocrystalline anisotropy, then K V = K C for uniaxial and K V = K C/4 for cubic anisotropy. The value of K surf is normally extracted experimentally via the linear plot of K eff as a function of 1/D.
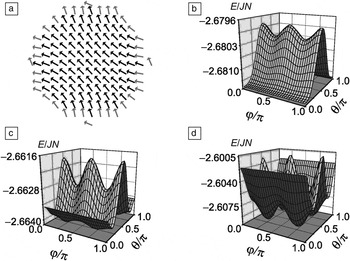
The complexity of the effects of surface anisotropy is illustrated by the calculations shown in Figure 1 . Figure 1a shows the calculation by Garanin and Kachkachi Reference Garanin and Kachkachi33 of the magnetization configuration of a nanoparticle with strong surface anisotropy. The surface anisotropy induces a strongly non-uniform magnetic state. Importantly, this induces a significant cubic component to the anisotropy. This is confirmed by calculations of the energy landscape shown in Figure 1b–d, which demonstrates an increasing cubic contribution with increasing surface anisotropy. The cubic components of the anisotropy are especially important due to their strong temperature dependence. Reference Yanes, Chubykalo-Fesenko, Evans and Chantrell34
(a) Atomic magnetization structure under the influence of surface anisotropy (after Garanin and Kachkachi). Reference Garanin and Kachkachi33 The arrows indicate the direction of the atomic moments, with the surface spins highlighted in gray. (b–d) Orientation dependence of the total particle energy E for different values of the surface anisotropy constant, K s, normalized to the whole-particle exchange energy JN. The orientation of the magnetization is given in spherical polar coordinates in terms of rotational (φ) and azimuthal angles θ. The normalized surface anisotropy constants are (b) 0.1, (c) 0.175, and (d) 0.375 as fractions of the interatomic exchange energy, J ij , between sites i and j. The particle contains N = 1264 spins on a face-centered-cubic lattice. As the surface anisotropy is increased, the energy surface develops a cubic character, visible from the number of local energy minima. This demonstrates the complex influence of surface anisotropy on the energy landscape of the particle.

Yanes et al. Reference Yanes, Chubykalo-Fesenko, Kachkachi, Garanin, Evans and Chantrell35 described an extensive theoretical investigation of surface anisotropy effects, and they explored the applicability of Equation 4. It was found to be consistent only for elongated particles and never for spherical or truncated octahedral particles. If a nanoparticle system consists of roughly spherical shapes, this finding demonstrates that the use of Equation 4 to describe the size dependence of the anisotropy in these systems is incorrect. Another problem is that the surface and volume contributions in Equation 4 in general have different temperature dependences. Reference Yanes, Chubykalo-Fesenko, Evans and Chantrell34 There is clearly a need for further studies at the ab initio and atomistic levels for comparison with experiments.
Magnetic effects arising from structural properties
Nanoparticles can possess a significantly different atomic structure from bulk crystals or thin films, Reference Dorfbauer, Schrefl, Kirschner, Hrkac, Suess, Ertl and Fidler36 and this structural difference can also have an important effect on other magnetic properties such as core magneto-crystalline anisotropy Reference Dorfbauer, Evans, Kirschner, Chubykalo-Fesenko, Chantrell and Schrefl20,Reference Evans, Dorfbauer, Chubykalo-Fesenko, Schrefl and Chantrell21 and the Curie temperature. Reference Evans, Nowak, Dorfbauer, Shrefl, Mryasov, Chantrell and Grochola37 Molecular dynamics is an established method for simulating atomic structural dynamics in a wide range of materials by considering an interatomic potential between pairs of atoms and is a useful method for investigating the structures of realistic nanoparticles. In combination with magnetic atomistic modeling, the links between atomic structure and magnetic properties can be investigated.
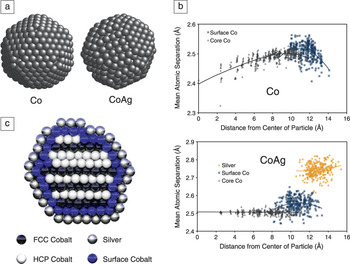
Atomic structures are first obtained through simulated annealing, where a system of atoms is gradually cooled through the melting point to a low temperature, generating realistic particle shapes, Reference Evans, Dorfbauer, Chubykalo-Fesenko, Schrefl and Chantrell21 for example as shown in Figure 2 a for Co (left) and CoAg (right). The pure Co nanoparticle has a characteristic icosahedral-type structure, while the addition of Ag dramatically changes the morphology to a close-packed structure. Due to the lower surface energy of Ag, the Ag atoms segregate from the Co core to form a monolayer coating. Reference Dorfbauer, Schrefl, Kirschner, Hrkac, Suess, Ertl and Fidler36 With a realistic particle structure, the interatomic spacing varies radially unlike in the bulk, as shown in Figure 2b. Due to the strong distance dependence of the exchange interaction (which gives rise to magnetic order), the reduction in interatomic spacing at the surface of the pure Co particle leads to a 10% increase in the Curie temperature. Reference Evans, Nowak, Dorfbauer, Shrefl, Mryasov, Chantrell and Grochola37 However, for the CoAg particle, the addition of Ag alleviates the surface compression, and so the Curie temperature does not increase appreciably. The main contributory factor for anisotropy in Co nanoparticles is usually assumed to be surface anisotropy, since in the face-centered-cubic phase, the bulk anisotropy of Co is very small. However, the simulated CoAg particle is actually a mixed hexagonal (HCP) and face-centered (FCC) close-packed phase, as shown in Figure 2c. This is significant since the HCP phase has much higher anisotropy in the bulk, and thus the mixed phase is another potential source of high anisotropy in Co nanoparticles. Indeed, recent ab initio calculations of stacking faults in Co suggest a dominant effect of such faults on the local anisotropy. Reference Aas, Szunyogh, Evans and Chantrell38
(a) Visualization of simulated-annealed nanostructures for Co (left) and CoAg nanoparticle (right) obtained using molecular dynamics. (b) Scatter plots of the interatomic radius as a function of distance from the center of the particle for Co (top) and CoAg (bottom) nanoparticles. The plots show the dramatic effect of the coating on the interatomic spacing, which then determines the microstructure of the particle core. (c) Cross-sectional visualization of the CoAg nanoparticle showing alternate planar face-centered-cubic and hexagonal close-packed (FCC/HCP) ordering, suggesting the existence of a mixture of high and low anisotropy crystal phases. Adapted from Reference 21.

The Co and CoAg simulations demonstrate the importance of realistic atomic structures for nanoparticles in determining magnetic properties. Recent advances in combined molecular dynamics and magnetic simulations Reference Wang, Ma and Woo39 also suggest the exciting possibility of magnetodynamic simulations of dynamic properties such as magnetovolume effects.
Exchange anisotropy in core–shell nanoparticles
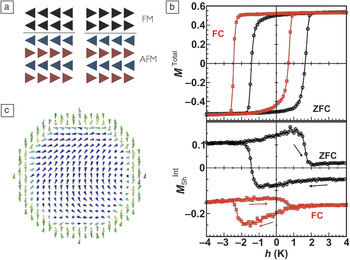
Core–shell nanoparticles are a classic example of interface engineering, where two or more materials are combined to optimize the properties of the system. However, due to the complexities of atomic interfaces, the effects are often complex and unpredictable. Meiklejohn and Bean studied the properties of oxidized cobalt nanoparticles and found a completely new type of magnetic anisotropy: exchange anisotropy. Reference Meiklejohn and Bean6 The origin of this anisotropy lies in the antiferromagnetic order of the oxidized shell. Due to the high anisotropy of CoO at low temperatures, the shell does not change its state during a hysteresis loop, as shown schematically in Figure 3 a. Since the Co core and CoO shell are coupled by the exchange interaction, this leads to a unidirectional anisotropy in the system, which is seen experimentally as a horizontal shift of the hysteresis loop. Physically, this is equivalent to applying a constant bias field, hence the name “exchange bias.”
(a) Schematic of the atomic spin configurations of an exchange biased system during hysteresis. For different orientations of the ferromagnet (FM, black arrows), the antiferromagnet (AFM, blue and red arrows indicating different magnetic sublattices) does not move. Due to the exchange energy at the interface, this leads to unidirectional exchange anisotropy. (b) Simulated hysteresis loops for the total magnetization, M Total, (top panel) and the net interfacial moment M sh Int in the antiferromagnet shell (bottom panel) for a core–shell nanoparticle as a function of the reduced external applied field, h(k B T). The zero-field cooling (ZFC) leads to no exchange bias, while field cooling (FC) induces significant exchange bias seen as a shift of the loop relative to zero field. (c) Typical snapshot of the spin configuration during the hysteresis loop. Core spins are indicated in dark blue, interfacial FM spins in light blue, and each of the two AFM sublattices are indicated in green and yellow. The strong anisotropy induces non-collinear spin states, leading to a complicated reversal process, which explains the asymmetry in the calculated hysteresis loops. Adapted from Reference 12.

The interfacial origin of exchange anisotropy means that it is difficult to predict the magnetic behavior, even in thin-film samples. Reference O’Grady, Fernandez-Outon and Vallejo-Fernandez7 Core–shell nanoparticles with exchange bias are even more challenging to model theoretically due to the large interface-to-volume ratio and the importance of the atomic structure at the interface. Monte Carlo studies of the properties of ferromagnetic/antiferromagnetic core–shell particles have demonstrated that in order to have an exchange bias, a net magnetic moment in the interface of the antiferromagnet is required. Reference Iglesias, Batlle and Labarta12,Reference Eftaxias and Trohidou13 Typical calculated hysteresis loops are shown in Figure 3b for two cases: zero-field cooled and field-cooled. Field cooling is particularly important for exchange biased systems, since the cooling process determines the ordering of the interface. By applying a strong field during the cooling process, the exchange bias is “set” since the orientation of the ferromagnetic core is determined by the field. The exchange field from the core then in turn determines the orientation of the antiferromagnetic shell during the cooling process. Without the field, the exchange bias of individual particles has a random orientation, and so no net exchange bias is present. The complex nature of the interface can also lead to complicated magnetic states, as shown in Figure 3c.
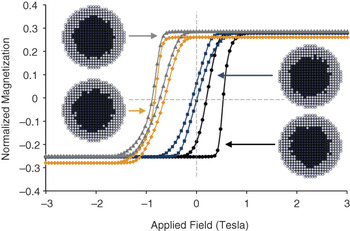
Although the underlying mechanisms of exchange bias can be studied in model systems with smooth interfaces, real systems are more likely to include imperfections and defects. Due to the random nature of such defects, experimental exchange bias systems always contain inherent statistical distributions. Reference Evans, Bate, Chantrell, Yanes and Chubykalo-Fesenko11 Of particular importance is the distribution of the interfacial magnetic moment, which is the origin of exchange bias in core–shell nanoparticles. Reference Iglesias, Batlle and Labarta12 Atomistic calculations of the effects of interfacial roughness demonstrated the correlation of the calculated exchange bias field and the net interfacial magnetic moment. Typical hysteresis loops for core–shell nanoparticles are shown in Figure 4 . The individual particles exhibit very different hysteresis properties and exchange bias according to the particular interfacial structure. A sample containing many such particles will therefore exhibit only an “average” exchange bias, but it is important to note that in reality, there is an underlying distribution of properties. Such a distribution has important consequences for potential applications such as data storage. Reference Skumryev, Stoyanov, Zhang, Hadjipanayis, Givord and Nogués9,Reference Evans, Yanes, Mryasov, Chantrell and Chubykalo-Fesenko10
Simulated hysteresis loops for core–shell nanoparticles with different random interfaces, each having a unique atomic structure. The easy axis is along the field direction in both cases. Cutaway visualizations showing the different interfaces are shown in the inset, with black spheres indicating core ferromagnetic atoms and white spheres indicating shell antiferromagnetic atoms. Adapted from Reference 11.

Summary and perspectives
The continuing need for developments in magnetic nanoparticles for biomedical and data storage applications, and a deeper understanding of the physics of their microscopic and macroscopic properties, sustains an active area of research. The wide variety of phenomena and the general complexity of their properties leave many challenges for models present and future, where multiscale and multiphysics approaches are likely needed.
Unlike micromagnetic formalisms, where the magnetization is treated as a continuous variable, atomistic models are inherently suited to modeling magnetic nanoparticles due to the intrinsic treatment of atomic-scale effects, such as reduced coordination number, interfacial roughness, atomic magnetic order, and localized bulk and surface anisotropies. Although this review primarily focused on low-temperature magnetic properties, atomistic models also allow a concrete treatment of the thermodynamic properties of nanoparticles and are particularly suited to modeling phase transitions necessary of magnetocaloric and heat-assisted recording applications. Demystifying the microscopic processes of magnetic nanoparticles is challenging due to the difficultly in separating multiple competing physical effects, but modeling can be a significant aid to understanding, and therefore controlling, some of the properties as well as predicting the macroscopic behavior of a composite of particles.
Further improvements and optimizations will ultimately require more detailed multiscale approaches combining ab initio information, such as exchange interactions and anisotropies; positional information, including defects, stacking faults, and impurities; and dynamic atomistic models to calculate the macroscopic properties of a complete nanoparticle. These improved models should also have an intrinsic predictive power, enabling simulation-led development of new systems (e.g., new coatings). Reference Antoniak, Gruner, Spasova, Trunova, Romer, Warland, Krumme, Fauth, Sun, Entel, Farle and Wende40