


1 Introduction
Long-term fluctuations in the mass balance of the Antarctic ice sheet are of considerable interest because of the possible contributions to future sea-level rise resulting from green-house-induced warming and melting. Warming of the oceans will contribute to an increase in sea level via thermal expansion, but it is not clear whether long-term changes in the amount of grounded ice (and therefore contributions to sea level) will be positive or negative. The problem involves quantifying the competing effects ofincreased net accumulation of snow over the surface vs increased ice loss at the margins due to ice discharge and melting. A major difficulty lies in the fact that due to sparse observations, area-averaged values for these terms are still not precisely known. As a result, recent estimates of the current mass balance have not been adequate to indicate whether the ice sheet is presently gaining or losing mass overall. These uncertainties plague estimates of the sensitivity of the ice sheet to any pos-tulated warming. Reference Warrick, le Provost, Meier, Oerlemans, Wood-worth, Houghton, Filho, Callander, Harris, Kallenberg and MaskellWarrick and others (1996) summarised a number of estimates based on different methods, but although these were all of the same sign, the magnitudes varied by a factor of 2-3. The problem becomes more difficult when the different time-scales for these processes are taken into account. It is expected that a future temperature rise will affect the net accumulation of snow almost immediately, while the effects due to increased discharge and melting will take much longer (Budd and others, 1994).
There is mounting evidence that temperatures over Antarctica have warmed in recent times (e.g. Reference Raper, Wigley, Mayes, Jones and SalingerRaper and others, 1984) and, since warmer air is capable of holding more moisture, it is thought that this has led to greater moisture convergence, precipitation and therefore an increasingly negative contribution to global sea-level change. Recent observations indicate that global sea level has risen by about 90 mm over the past 50 years (a rate of approximately 1.8 mm a−1; Reference NeremNerem, 1997), but according to Warrick and others (1996) the contribution by Antarctica could have ranged from -70 to +70 mm. Warrick and others (1996) also quoted several estimates of the sea-level sensitivity term which range from -0.2 to 0.7 mm a−1 per degree of warming.
One method for estimating the sensitivity is to analyze the results from global climate models (GCMs) which are forced with known boundary conditions. For example, Ohmura and others (1996) used a very high-resolution model to study the effects of doubling CO2. in this study, we analyze the results of climate simulations with a relatively high-resolution GCM forced with observed and reconstructed sea-surface temperatures (SSTs) for the recent past.
2. Model and SST Data
The GCM used in this study is theT63 version of CSIR09 which comprises nine levels in the vertical and has a horizontal resolution of 1.875° by 1.875° (see Reference McGregor, Gordon, Watterson, Dix and RotstaynMcGregor and others, 1993; Reference Dix and HuntDix and Hunt, 1995; Smith and others, 1997). The Hadlcy Centre of the U.K. Meteorological Office created, and is revising, globally complete data for SSTs and sea ice, for the purposes of analyzing climatic variations (Reference Parker, Folland, Bevan, Ward, Jackson, Maskell and MartinsonParker and others, 1995). We deal here with the results obtained with the GCM forced with an early version of the data, referred to as GISST 1.1 (global sea-ice and sea surface temperature), which comprises monthly mean values from 1871 to 1991. Points identified with sub-freezing SSTs are masked as sea-ice points. The model assumes that, with in the boundaries defined by these points, the sea ice has a uniform thickness of 2 m and contains no leads. It is acknowledged that high southern-latitude winter SSTs and sea-ice extents in the GISST data may not be reliable prior to the availability of satellite observations. in this study we do not aim to represent conditions in any one year, but are more interested in long-term means and long-term trends. Consequently, we focus on the period 1950-91, when SSTdata are regarded as reliable over large regions for most of the year, and when significant trends are evident.
3. Results
Reference GenthonGenthon (1994) analyzed the performance of two GCMs and demonstrated the importance of correctly specifying the topography of the ice sheet. Figure 1 shows the topography of the Antarctic ice sheet as represented by theT63 version of the model. The relatively high horizontal resolution enables most of the major features to be captured, but, even so, the maximum elevation of 3940 m a.s.l. is less than the known summit elevation of 4270 m a.s.l. The area of grounded ice according to the model is slightly overestimated, because of the problem of resolving the discontinuity between the ice-sheet surface and the ocean surface.
Topography (m a.s.l.) of the Antarctic ice sheet as represented by the model.

figures 2 and 3 show the simulated annual mean distributions of surface temperature (T) and accumulation rate (A) where A is defined as the difference between precipitation and evaporation and is expressed in units of water equivalent.
As could be expected, temperature closely follows the topography, a feature noted by Reference ComisoComiso (1994) who derived surface temperatures from satellite-based radiometer measurements. The model values increase from a minimum of 227 Κ (-46°C) near the summit to about 266 Κ (-7°C) near the Antarctic Peninsula. Both the remotely sensed data of Comiso (1994) and the compilation of borehole data and surface observations presented by Reference Giovinetto, Waters and BentleyGiovinetto and others (1990) indicate that temperatures approaching -60°C occur near the summit, suggesting that the model values for the interior are not cold enough. This can be partly attributed to the underestimation of the ice-sheet height, but the major reason for the overestimate is the inability of the model to fully represent temperature inversions. These are prominent features of the climate of the ice sheet and can result in temperature differences of up to 20 Κ between the surface and the lowest levels of the atmosphere (Reference Parish and BromwichParish and Bromwich, 1991). The vertical resolution of the model is such that the boundary layer is not well resolved, and as a result the model surface temperatures tend to be too closely linked to temperatures at the first level.
Long-term annual mean surface temperature (A) simulated by the model.

Long-term annual mean accumulation rate (mm a−1) simulated by the model.

Accumulation rates are dominated by precipitation. Minimum values of 11-16mma−1 occur over the summit region in East Antarctica, while maximum values of over 1000 mm a−1 (not indicated) occur in the vicinity of the Peninsula region. A local maximum is evident at the head of the Ross Ice Shelf.
Zonally averaged accumulation rates (filled circles, solid line) compared with estimates of Budd and Simmonds (1991) (open circles, dashed line) and estimates from atmospheric analyses (Budd and others, 1995) (bars).
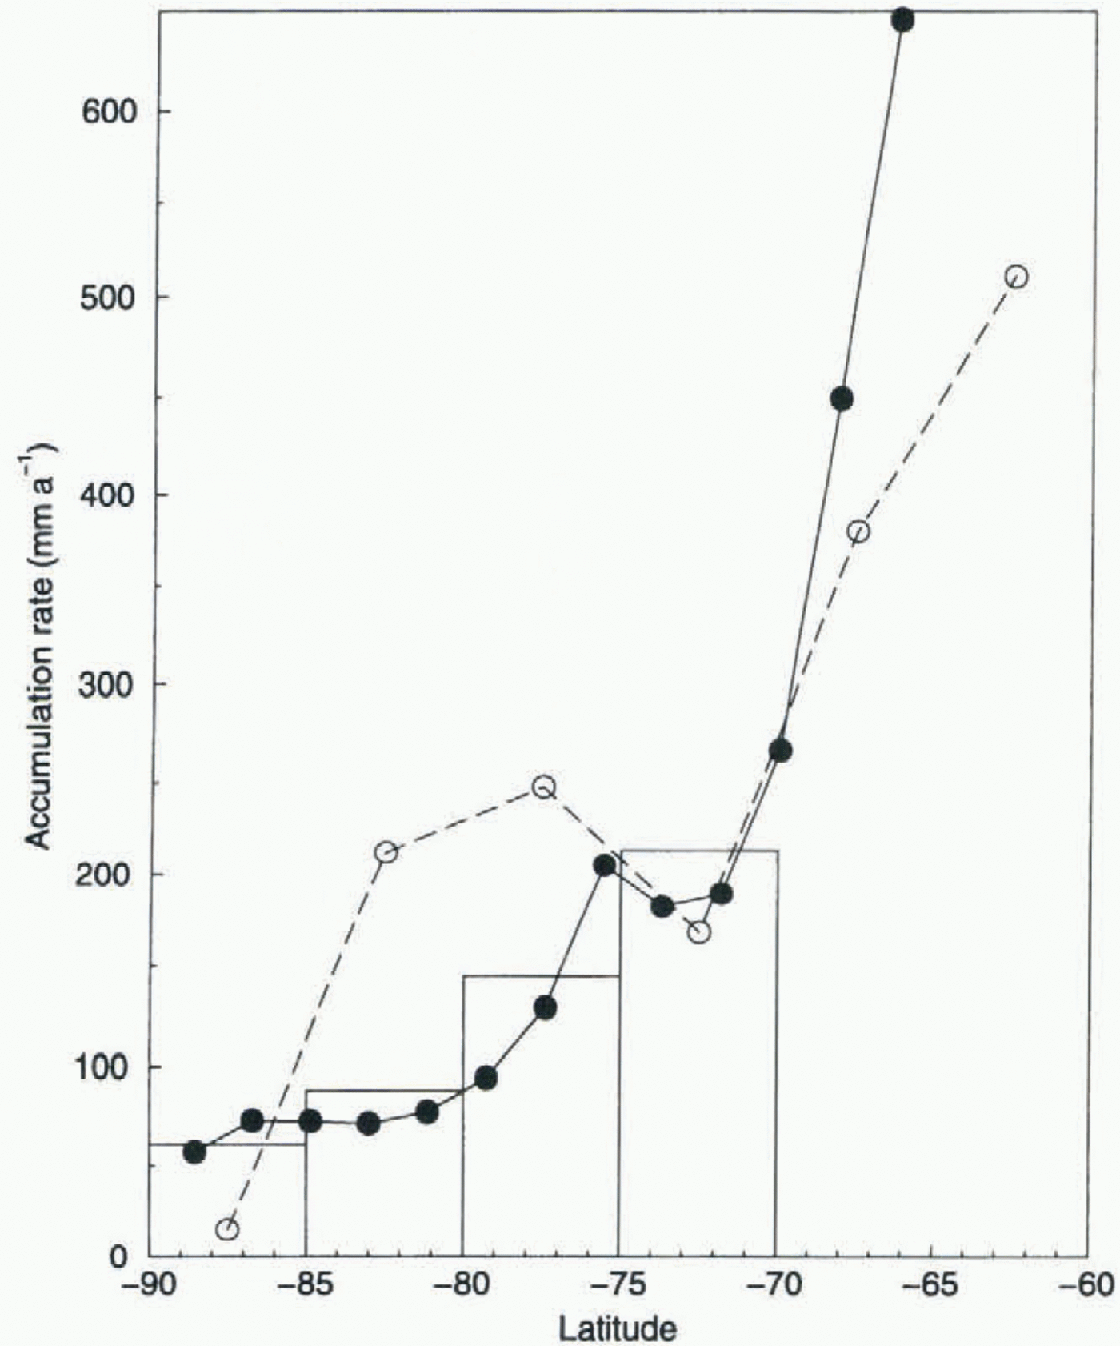
Figure 4 compares the zonally averaged model results for annual accumulation with those from the GCM simulations by Budd and Simmonds (1991) and the more recent estimates by Budd and others (1995) based on moisture fluxes derived from atmospheric analyses. The apparent improvement in the comparison between the model-based values and the flux-derived values is most likely due to the higher resolution employed in the current model and the consequently improved reprt- sentation of topography. However, the mean value (183 mm) is higher than that derived from the atmospheric analyses (157 mm) and it is clear from Figure 4 that this overestimate is due to the high values that occur near the coast. Since the model overestimates (by about 12%) the area of grounded ice, we can estimate a mean value which would be appropriate to the smaller area. This estimate is about 160 mm, but, without actually running a version of the climate model which better represents the true area of grounded ice, the best estimate remains uncertain. We conclude that the model results indicate a mean value of 160-180 mm.
4. Trends in Accumulation
In deriving a map of simulated trends in annual accumulation, we have individually calculated the trend at each grid-point from each ensemble member. The average of the five trend “maps” is shown in Figure 5 and, although the data span only 42 years, the values are expressed in units of mm per 100 years. This figure indicates that the overall trend is towards increased accumulation but is not uniform across the ice sheet. The largest and statistically most significant increases are found towards the coastal zones, including the north and east Antarctic Peninsula. Trends in the coastal Wilkes Land region agree with measurements by Reference Morgan, Goodwin, Etheridge and WookeyMorgan and others (1991). in the central regions proper, the trends are small and variable, while over most of West and East Antarctica the trends are positive. Negative trends are simulated for regions including MaC. Robertson Land, Kemp Land, Dronning Maud Land and small regions bordering the Bellingshausen Sea.
Trends in accumulation rate, 1950-91 (mm a−1 per 100 years). Negatine values are stippled.

An analysis by Reference JacobsJacobs (1992) of ice-core measurements from more widely separated locations showed that, although some decreases were evident, increases may have been common over a large part of the continent. Bromwich and Robasky (1993) combined the glaciological data with the results from atmospheric analyses and estimated that, overall, precipitation appears to have increased by about 5% over recent decades. They also noted that the database was not perfect and so this estimate may not be robust. in general, it appears that much of East Antarctica has experienced increases in recent times, sites on the Antarctic Peninsula and the Ross Ice Shelf have experienced increases, while coastal sites near the Filehner Ice Shelf and further east in Dronning Maud Land have experienced decreases. Trends in the vicinity of the South Pole were unclear, while no significant trends were apparent at single sites in West Antarctica and Enderby Eand. More recently, Reference Isaksson, Karlén, Gundestrup, Mayewski, Whitlow and TwicklerIsaksson and others (1996) analyzed ice cores from sites in Dronning Maud Land and found evidence of a significant decrease in accumulation rate from a site near the coast, but no evidence of any significant change at a second site further inland.
Despite a number of differences with the observational-based data, the results for East Antarctica and Dronning Maud Land appear consistent. Although realistic trends are simulated for the Antarctic Peninsula, they may not be significant since they contrast with trends of the opposite sign simulated for nearby regions bordering the Bellingshausen Sea. More importantly, for the continent as a whole, both increases and decreases are simulated yet the large-scale average results are dominated by those for East Antarctica. The results support the suggestion that an overall increase in annual accumulation has indeed taken place. This can be confirmed as more and more data from ice cores are analyzed.
5. Accumulation and Surface Temperature
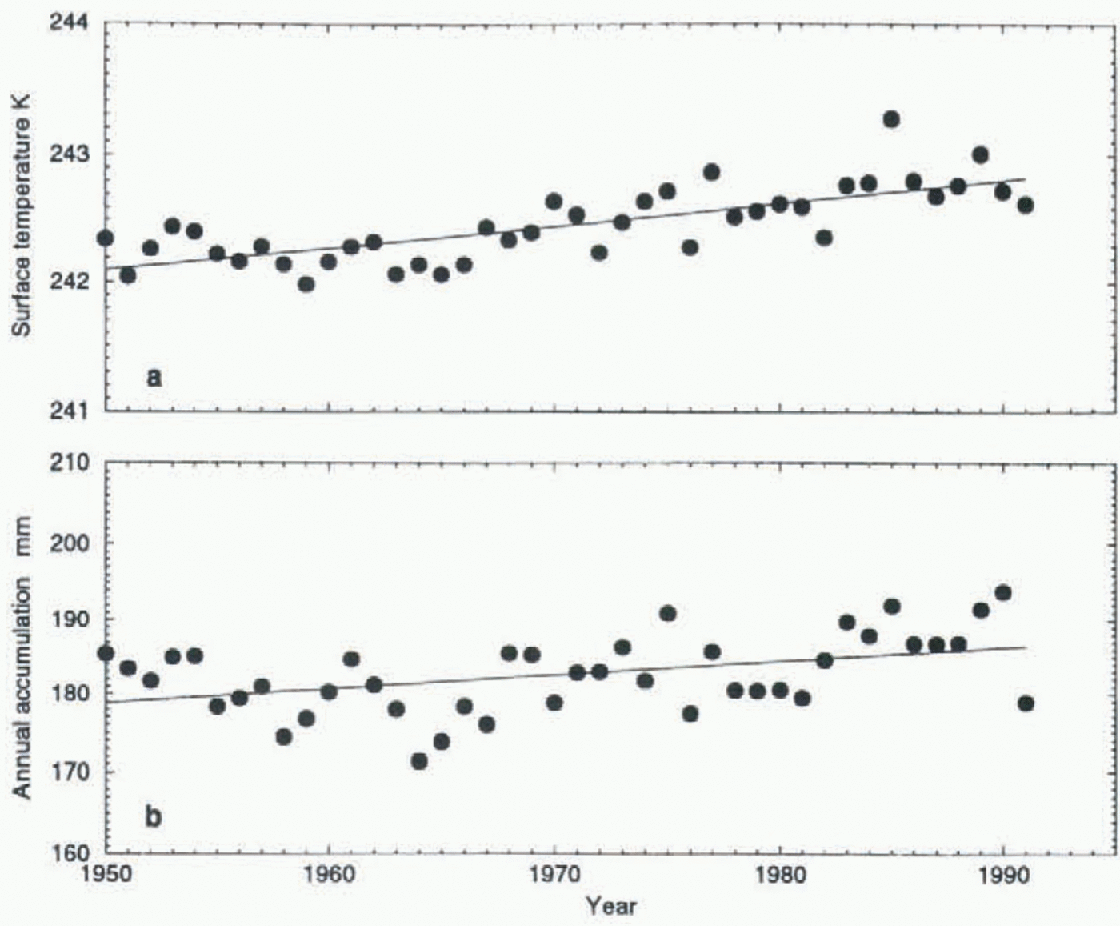
figure 6a shows the ensemble mean time series for annual mean surface temperature and includes a line of best fit to the data.The warming trend over the period 1950-91 corresponds to 0.18°C per decade. We draw no conclusions from the interannual fluctuations and make no attempt to compare these with any observations, mainly because we recognise the limitations of both the SST forcing and the model employed. However, we do note that the trend is a robust feature of the results and reflects a warming of the surrounding oceans over this time. The rate of warming is less than the +0.29°C per decade estimated by Raper and others (1984), but is not necessarily inconsistent, bearing in mind that their analysis was based on data from only 16 observing stations and referred to the shorter period 1957-82.
figure 6b shows the results for annual accumulation and reveals that the overall trend amounts to +1.9 mm a−1 per decade. A linear regression of accumulation against temperature yields a sensitivity value of +12.5mmw.e. per degree of warming. The correlation coefficient (r = 0.70) is highly significant, and so the model results indicate that a simple temperature increase can explain much of the increase in precipitation.
Annual mean surface temperature (a) and accumulation rate (b) as simulatedfor the period 1950-91.
The derived value for sensitivity corresponds to +6.8% of the unadjusted long-term mean annual accumulation. Bromwich and Robasky (1993) noted that an estimated overall increase of 5% in precipitation (1955-65 to 1965-75), when compared with a temperature increase of +0.74°C over the period 1957-82 reported by Raper and others (1984), yields a sensitivity value of +18%. This is not comparable with the model-derived value, because of the different time periods involved and the considerable uncertainty associated with the observational-based estimates. Giovinetto and Zwally (1996) suggested a value of +14% based on an estimate of the sensitivity of accumulation to sea-ice area and the sensitivity of sea-ice area to temperature. However, Ohmura and others (1996), in a 1 x and 2 x CO2 GCM study in which sea ice was allowed to vary, estimated a value of only +4%, comparable with the model results presented here.
Given that 20mm of water deposited over the entire area of grounded ice represents close to 6 mm of global sea-level change, a change of +6.8% implies a sensitivity of about -0.4 mm of sea level per degree of warming.
6. Conclusions
Climate-model simulations forced by reconstructed SSTs over the period 1950-91 yield results for both annual mean surface temperature and accumulation. The simulated temperatures, although strongly dependent on the topography, are not as cold as observed. The simulated accumulation is comparable with observations, and yields an estimate for the area-averaged value over the region of grounded ice of 160-180 mm. The spatial pattern of trends in annual accumulation shows some similarities with the evidence from ice cores and indicates that increases, mainly over East Antarctica, dominate the overall changes. The results yield an estimate for the sensitivity of accumulation to temperature of +12.5 mm a−1 (or +4% of the long-term mean value) per degree of warming. This estimate is less than other estimates based on limited observational data, but consistent with that indicated by at least one other model study. It indicates that any changes in accumulation over the past several decades may not have contributed significantly to global sea-level change and that future contributions may also not be significant. However, future changes in the extent of sea ice may be important, in which case the results from coupled atmosphere/ocean/sea-icc models (e.g. Reference Gordon and O'FarrellGordon and O'Farrell, 1997; O'Farrell and others, 1997) should provide more realistic estimates.
Acknowledgements
The authors gratefully acknowledge the U.K. Meteorological Office for making the GISSTdata available, and B. Hunt for making the results from the GCM experiments available for analysis. We also appreciate the constructive comments of two anonymous referees, D. Etheridgc, I. Goodwin, B. Hunt, B. Pittock and B. Sawford.



