Environmental validation of Legionella control programs by culturing water samples is now required in certain Veterans Health Administration (VHA) facilities. 1 The cost to ship water samples overnight for analysis, the effect on accuracy of sample holding time during transit, and the time required to obtain results from cultures are significant issues.Reference McCoy, Downes, Lasko, Neville and Cains 2 – Reference McCoy and Rosenblatt 4 Furthermore, no specifications are given in the standardized protocols for (1) sample volume, (2) sample concentration, and (3) necessary limit of detection (LOD). 5 – 7
Our study addresses many questions about Legionella testing, for which the published research provides insufficient basis for scientifically defensible decisions. We sought to answer the following questions: (1) Is it necessary to filter 1-L water samples for validation of Legionella control in our building water systems? (2) What is the meaningful, scientifically defensible detection limit that should be used? (3) Can the time required to obtain reliable culture results be significantly reduced? (4) Are results from the polymerase chain reaction (PCR) for Legionella useful? (5) Does the total heterotrophic aerobic bacteria water quality parameter correlate to Legionella test results?
METHODS
Building Water Sample Collection Protocol and Shipment to the Laboratory
The study was conducted at the Central Texas Veterans Health Care System in Temple, Texas, at the Waco campus, where prior testing of numerous environmental samples yielded detections of Legionella pneumophila serogroup 2–14 and other Legionella species. The study was conducted in March 2015.
In total, 50 water samples were obtained from 40 sinks and 10 showers in daily-occupied high-use hospital rooms served by copper plumbing. Both hot-water samples (n=26) and cold-water samples (n=24) were collected. Faucets and taps were flushed for 1–3 minutes before collecting the samples. Two 1-L sample bottles containing sodium thiosulfate (Microtech Scientific, Orange, CA) were filled at each sample location. For the 1,000-mL sample, ~500 mL from each of the two 1-L bottles was combined. The water remaining in the two 1-L sample bottles was combined and was used for the other samples (500, 250, and 100 mL), and 100 mL was poured off into a sterile water-sample vial (approved by the Environmental Protection Agency [EPA], Fisher Scientific, Lenexa, KS) to the 100-mL fill line for the on-site inoculation of PVT (Phigenics Validation Test) dipslides.Reference McCoy, Downes, Lasko, Neville and Cains 2 – Reference McCoy and Rosenblatt 4 , Reference Castellino, Gamage and Hoffman 16 All bottles were immediately capped to protect the remaining water sample from contamination.
In the field and within 15 minutes after the water samples were drawn, a sterile PVT dipslide-format sampler (Phigenics, Naperville, IL) was aseptically removed from its vial, dipped into the 100-mL volume of sample in the EPA-approved vial, held for 3 seconds, and then returned immediately to the sterile dipslide vial. The contents of a pH adjustment capsule (Phigenics) were added to the 100-mL water sample to treat the sample at pH 2.2–2.5 for 5 minutes. After this acid treatment, a second sterile PVT dipslide-format sampler was then aseptically removed from its vial, dipped into 100 mL water, held for 3 seconds, and returned to the sterile dipslide vial.
Chain-of-custody and security labels were affixed to all sample bottles and to the outside of the PVT dipslide vials. All components of the test (bottles and dipslides) were shipped overnight to the laboratory in an insulated box. In every case, samples were received and processed in the laboratory the next day. Of the fifty 100-mL samples, 2 were of insufficient volume for membrane filtration.
Spread Plates
Spread-plate cultures to detect and enumerate Legionella were performed in compliance with the International Standards Organization (ISO) 11731 method. 7 Samples were concentrated by filtering the 100-, 250-, 500-, or 1,000-mL water samples through a 0.2-µm Nuclepore polycarbonate filter (Whatman, Florham Park, NJ), suspending filters in 10 mL filtered sample and then spread plating 0.1 mL aliquots. Accordingly, the theoretical calculated limits of detection were 1.0, 0.4, 0.2, and 0.1 CFU/mL for the 100-, 250-, 500-, and 1,000-mL water samples, respectively.
Field Cultures
The PVT culture dipslide-format sampler (Phigenics) is a plastic paddle with culture media on both sides. On one side of the paddle is a layer of buffered charcoal yeast extract agar with Legionella growth supplement (Edelstein buffered charcoal yeast extract agar, BYCE), and on the other side of the paddle is a layer of BCYE + inhibitors (glycine, vancomycin, polymyxin B, and cycloheximide), BYCE+GVPC (glycine vancomycin polymyxin cycloheximide, Oxoid Media, Fisher Scientific). It was necessary to ship water samples to the laboratory. Dipslides were incubated at 35°C for 2 days then analyzed. Colonies on the agar surfaces were tested for cysteine auxotrophy; Legionella colonies were confirmed and typed with specific antibody latex-agglutination reagents (Oxoid). Digital photographic images were recorded for every surface of every growth culture analyzed. Legionella were reported as colony-forming units (CFU) count; CFU per milliliter (CFU/mL) values were reported by calibrating CFU recovered to CFU per milliliter results from standard working curves using pure culture cell suspensions of Legionella. Total heterotrophic aerobic bacteria (THAB) were determined as previously described by comparing growth to standard curves with standard plate counts and other commercial dipslide tests.Reference McCoy, Downes, Lasko, Neville and Cains 2 – Reference McCoy and Rosenblatt 4
Polymerase Chain Reaction Assay for Legionella
Samples (100 mL) were filtered through 0.2-µm Nuclepore polycarbonate filters (Whatman); the membrane filters were then suspended in 10 mL filtered-sterilized sample water. The filtrate was resuspended by mixing in a vortex mixer for 30 seconds, and 2 mL was then centrifuged at 14,000 ×g for 3 minutes to obtain a pellet. The QIAamp DNA Mini kit was used to extract the genetic material (Qiagen, Valencia, CA). The extracted nucleic acid was purified using the ZR Genomic DNA-Tissue MiniPrep kit (Zymo Research, Irvine, CA). A 2-µL portion of the purified nucleic acid, 10 µL Fast SYBR Green Master Mix (Applied Biosystems, Foster City, CA), and 1 µL forward and reverse primers were used to perform the PCR assay. The primer set is specific for a segment of the 16S rRNA region of the Legionella genome. The selected template is highly conserved within the genus Legionella. Species and serogroups detected include but are not limited to L. pneumophila serogroups 1–14 and 16, L. longbeachae, L. dumoffii, L. bozemanii, and L. gormanii. The PCR assay was implemented using the 7500 Fast Real-Time PCR System (Applied Biosystems), which began with a 20-second denaturation at 95°C. The following cycle was repeated 40 times: denaturation at 95°C for 1 second and annealing of primers at 60°C for 20 seconds. A melt curve was performed to confirm the amplification of a single product.
Statistical Analyses
Descriptive statistics of recovery rates and CFU per milliliter with varying water-sample sizes for ISO spread plates and with PVT dipslides were calculated. The McNemar test was employed to test the null hypothesis of marginal homogeneity to compare detections from 1,000 mL to smaller volumes. Comparing recovery from hot-water versus cold-water samples was assessed using χ2 analyses or the Fisher exact test for small expected cell counts. Generalized linear regression assumed a negative binomial distribution with robust standard errors of varying water sample sizes (100, 250, and 500 mL vs 1,000 mL reference). Incidence rate ratios (IRR) and 95% confidence intervals (CI) were then determined.
The McNemar test was similarly used to assess improved detection with either the PVT or the ISO technique to determine whether one approach was superior to the other. Samples of 100, 250, 500, and 1,000 mL from the same source for the ISO method were compared to those for the PVT method. A type I error of α=0.05 was assumed throughout. All analyses were performed using SAS version 9.2 software (SAS Institute, Cary, NC).
RESULTS
Legionella was detected in every sample by the PCR screen (data not shown). The total heterotrophic aerobic bacteria (THAB) concentrations were ≤103 CFU/mL in all but 1 sample; there was no correlation between THAB results with Legionella detections (data not shown). Legionella pneumophila serogroup 1 was not recovered from any of the samples.
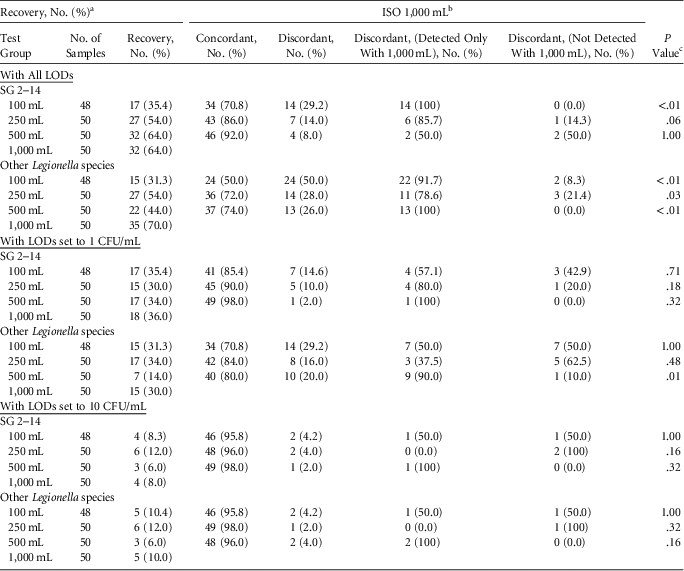
Legionella pneumophila serogroups 2–14 were detected in 35%, 54%, 64% and 64% of samples analyzed for volumes of 100, 250, 500, and 1,000 mL, respectively. Other Legionella species were detected in 31%, 54%, 44%, and 70% of 100-, 250-, 500-, and 1,000-mL sample volumes, respectively (Table 1). These results show that concentrating larger volumes of sample resulted in more detections.
Recovery of Legionella pneumophila Serogroups 2–14 and Other Legionella Species

NOTE. LOD, limit of detection; CFU, colony-forming units.
a Recovery for 1,000 mL with reduced sample of 48 is 31 (64.6%) for serogroups 2–14 and 35 (72.9%) for other Legionella species. Assuming that >1 CFU/mL is significant, recovery for 1,000 mL is 18 (36.0%) and 18 (37.5%) for reduced samples for serogroups 2–14, and 15 (30.0%) and 15 (31.3%) for reduced samples for other Legionella species. Assuming that >10 CFU/mL is significant, recovery for 1,000 mL is 4 (8.0%) and 4 (8.3%) for reduced samples for serogroups 2–14, and 5 (10.0%) and 5 (10.4%) for reduced samples for other Legionella species.
b Serogroups 2–14, 32 (64.0%); other Legionella species, 35 (70.0%).
c The McNemar test was used.
For results ≥1 CFU/mL and ≥10 CFU/mL, recovery rates were not significantly different regardless of the volume filtered (Table 1).
Nondetection (ND) results were compared. Of 31 ND results from 100-mL filtrations, 14 (45.2%) were detected with the 1,000 mL filtrations. Compared to the 250 mL filtrations, 6 of 23 ND results were detected with 1,000-mL filtrations (26.1%), while 1 of the 18 ND results with 1,000-mL filtrations was detected with the 250-mL sample (5.6%). For 500-mL sample volumes, 2 of 18 ND results were detected with 1,000 mL filtrations (11.1%), while 2 of 18 ND results with 1,000-mL filtrations were detected with 500-mL filtrations (11.1%).
To compare detection in 1,000-mL samples (lowest LOD samples) to the smaller water-volume samples (higher LOD samples), the McNemar test was employed to test the null hypothesis of marginal homogeneity. Evidence supporting the alternative hypothesis suggests that one water-sample size detected significantly more than the other. Samples of 100, 250, and 500 mL were compared to 1,000-mL samples from the same source (Table 1). Significantly more detections of serogroups 2–14 were observed with ISO 1,000-mL versus ISO 100-mL samples (35% 100 mL, 64% 1,000 mL; P<.01), with a trend toward significantly higher detection with ISO 1,000-mL sample versus the ISO 250-mL sample (54% 250 mL, 64% 1,000 mL; P=.06). However, this was not observed for the 500-mL samples (64% 500 mL, 64% 1,000 mL; P=1.00). More detections with larger sample-volume filtrations were not observed with detection limits set at ≥1 CFU/mL or ≥10 CFU/mL (Table 1).
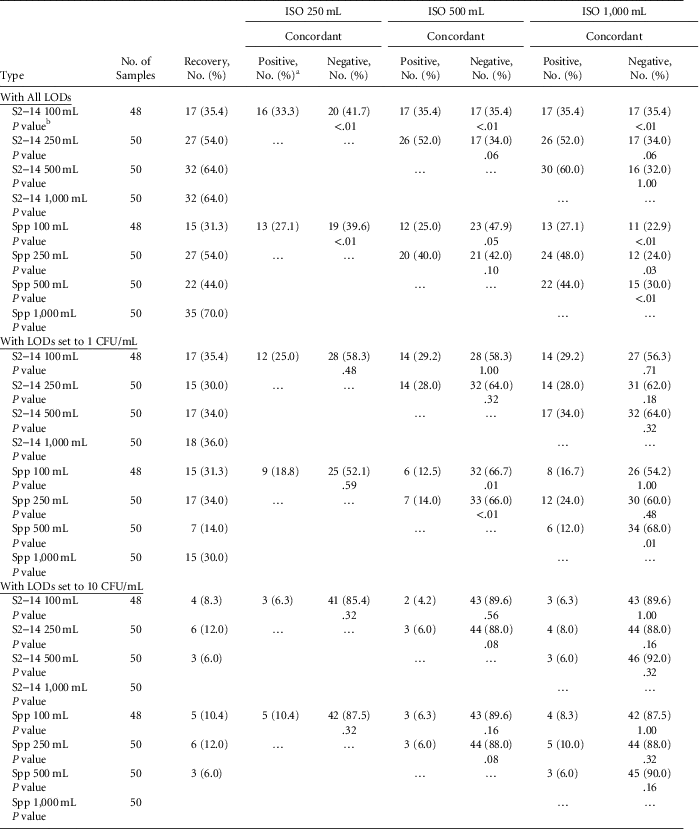
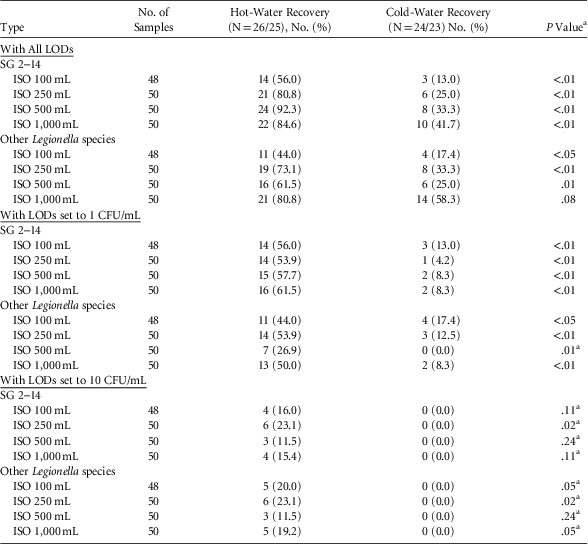
All samples were compared pairwise: 100 mL versus 250 mL; 100 mL versus 500 mL; 250 mL versus 500 mL. With detection limits set at ≥1 and ≥10 CFU/mL, there was no statistically significant difference in the recovery of Legionella regardless of the sample volume filtered. At the <1 CFU/mL detection limit, more Legionella were recovered from larger sample volumes filtered (Table 2). Table 3 shows that detections of Legionella from hot-water sample recovery were significantly higher than from cold-water samples. No cold-water sample returned Legionella detections ≥10 CFU/mL.
Pairwise Comparison of ISO Spread-Plate Detection Results by Sample Volume

NOTE. S2–24, serogroups 2–24; Spp, other Legionella species.
a Positive indicates detection; negative indicates not detected.
b The McNemar test was employed.
Recovery of Legionella From Hot-Water and Cold-Water Samples

NOTE. LOD, limit of detection; CFU, colony-forming units.
a χ2 analyses was employed; otherwise, the Fisher exact test was used.
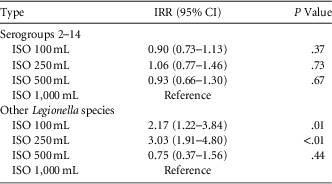
Negative binomial regression with robust standard errors was used to compare CFU per milliliter results among the various water sample sizes (NDs were replaced with zeros). No statistically significant differences in CFU per milliliter results were observed between water-sample sizes for Legionella pneumophila serogroups 2–14. Smaller samples of 100 mL and 250 mL compared to 1,000 mL were expected to return approximately double and triple (CFU/mL) for other Legionella species, respectively; however, the differences between 500 mL and 1,000 mL were not statistically significant (Table 4).
Generalized Linear Regression Model Results Assuming a Negative Binomial Distribution With Robust Standard Errors Modeling CFU/mL for Legionella Serogroups 2–14 and Other Legionella species

NOTE. CFU, colony-forming units; IRR, incidence rate ratio; CI, confidence interval.
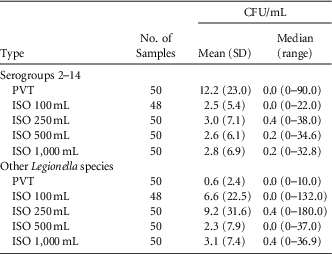
Descriptive Statistics for Legionella Serogroups 2–14 and Other Legionella Species With the PVT and ISO Methods and Varying Water-Sample Size

NOTE. CFU, colony-forming units; SD, standard deviation; PVT, Phigenics validation test (dipslide technique); ISO, International Standards Organization method (spread-plate technique).
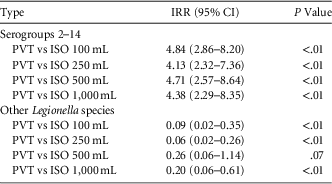
Generalized Linear Regression Model Results Assuming a Negative Binomial Distribution With Robust Standard Errors Modeling Colony-Forming Units per Milliliter (CFU/mL) for Legionella Serogroups 2–14 and Other Legionella Species

NOTE. IRR, incidence rate ratio; CI, confidence interval; PVT, Phigenics validation test (dipslide technique); ISO, International Standards Organization method (spread-plate technique).
The McNemar test was employed to test the null hypothesis of marginal homogeneity to assess differences in detection with either PVT or ISO of varying water sample sizes; statistical evidence supporting the alternative hypothesis would suggest that one approach (PVT or ISO) was superior to the other for detection of Legionella in water samples. The ISO results from samples of 100, 250, 500, and 1,000 mL from the same source were compared to PVT results.
There was no statistically significant difference in Legionella pneumophila detection between the PVT dipslides and the 100-mL sample volume (1 CFU/mL LOD) ISO spread plates. This finding indicates that results from the PVT field inoculations were equivalent to ISO spread plates at the 1 CFU/mL limit of detection. With an LOD of 1 CFU/mL, few differences were observed regardless of water sample volume, further indicating that a practical limit of detection relative to ISO spread plates was ~1 CFU/mL for the PVT field inoculations. With an LOD of 10 CFU/mL, field inoculations with the PVT method detected more Legionella than the ISO method for water samples of different sizes. With an LOD <1 CFU/mL, more detections of Legionella serogroups 2–14 and other Legionella species were often observed for ISO samples of 250 mL or larger compared to PVT dipslides. These results indicate that the LOD of field inoculations with PVT was not <1 CFU/mL.
The PVT dipslides returned values ~4–5 times higher for serogroups 2–14 compared to ISO spread plates of various water-sample sizes, but the reverse relationship was observed for other Legionella species (Tables 5 and 6).
DISCUSSION
As expected in our study, the 1,000-mL filtration concentrations with LOD of 0.1 CFU/mL yielded more detections than the lower-volume filtration concentrations with higher LODs. Indeed, we are certain that a 10-L sample filtered and concentrated to an even lower LOD would have yielded even more detections. However, the detection differences were not relevant to validate control measures. Furthermore, at the ≥1 and ≥10 CFU/mL detection limits, the differences were not statistically significant.
Disease outbreak investigators from the Centers for Disease Control and Prevention in the United States collect 1-L water samples, ship them overnight to the laboratory, filter concentrate them 200×, and then plate 0.1-mL aliquots to achieve a calculated theoretical LOD of 0.05 CFU/mL. The objective during an outbreak investigation is to find the source (from highly concentrated samples) of Legionella in building water systems that have already been epidemiologically linked to legionellosis cases.
For environmental validation of control programs, sample volume and concentration factors are not specified in the VHA directive 1 ; however, a 250-mL sample volume and a detection limit ≤10 CFU/mL has been recommended by VHA scientists. The concentration and plating factors used by commercial labs varies considerably. Many commercial laboratories recommend 100-mL sample volumes because anecdotal evidence suggests that the results are reliable and because the costs to ship and process samples are significantly lower. Our results indicate that 100-mL sample volumes were adequate for validation at this facility.
It is prudent to consider exposure to even a single viable Legionella cell as potentially infective, even though there is no scientifically defensible evidence to support such a conservative risk assessment for the most vulnerable people, such as persons who have received soft-organ transplants, for example. Using this ultraconservative criterion, we then considered the question of what LOD for environmental validation should be considered adequate.
Legionella is principally an aerosol-inhalation and liquid-aspiration hazard. Therefore, the concentration of viable Legionella bacteria in a physically relevant volume of water that is inhaled as aerosol or aspirated into the lungs as liquid must be considered.
Showering in hot water can be regarded as a worst-case scenario for exposure to microbial inhalation hazards such as Legionella. In simulations of relevant conditions for showering, the volume of water droplets inhaled during a 10-minute shower was ~0.0125 mL of shower water in the worst-case simulations; furthermore, alveolar deposition of the inhaled droplets was only 6%–10% of the total droplets inhaled assuming oral breathing and/or 0.9% of the total droplets inhaled assuming nasal breathing.Reference Zhou, Benson, Irvin, Irshad and Cheng 8 Assuming that the infective dose of Legionella is a single viable bacterium (the infective dose is not known but is very likely higher than 1 CFU), a 10 CFU/mL limit of detection for building water samples is very conservative because the volume of water from showering required to deliver 1 viable Legionella bacterium is a hundred times greater than the observed volume inhaled during simulations of hot-water showering. In other words, the volume of water inhaled during showering is so small that, at <10 CFU/mL Legionella, delivery into the lungs of even a single Legionella bacterium is very unlikely. Therefore, even for high-risk patients (eg, such as those undergoing organ transplant, chemotherapy or dialysis), a 10 CFU/mL LOD appears to be adequate.
There is no established dose–response relationship for Legionella infectivity. The concentration necessary to result in disease is not known. 9 In animal models, the infective dose of Legionella was at least many thousands or hundreds of thousands of viable cells.Reference Fitzgeorge, Baskerville, Broster, Hambleton and Dennis 10 , Reference Berendt, Young, Allen and Knutsen 11 The concentration of Legionella above which an increased risk of Pontiac fever from showering in retirement homes could be documented was 10 CFU/mL.Reference Bauer, Mathieu and Deloge-Abarkan 12 By quantitative microbial risk assessment modeling (QMRA), calculated infective doses were certainly many more than 10 viable cells.Reference Armstrong and Haas 13 , Reference Buse, Schoen and Ashbolt 14 From extensive modeling of exposure to shower water, an infective Legionella concentration range was calculated as 3.5×10³ to 3.5×10⁵ CFU/mL.Reference Schoen and Ashbolt 15
For environmental validation of Legionella control in building water, it is not necessary, in our opinion, to test for lower concentrations or to filter concentrate >100 mL of sample. Legionella recovery with in-field, on-site inoculation from a location that was negative using spread-plate culture has been recently published.Reference Castellino, Gamage and Hoffman 16 The practical LOD using the spread-plate method (regardless of sample volume) is ~10 CFU/mL.Reference Lucas, Taylor and Fields 17
Aspiration pneumonia is a serious problem, especially for people suffering from dysphagia such as those persons recovering from stroke. We have been unable to find documented data regarding volume of aspiration that would be comparable to systematic studies of inhalation volumes during showering. Therefore, in our opinion, patients at risk of aspiration pneumonia should be given sterile or bottled water for drinking and attention to maintenance and cleanliness of ice machines should be a priority in the healthcare setting.
This study has several limitations. We studied one building, at one point in time, and only 50 samples were taken. We did not detect the L. pneumophila serogroup 1 in this study. A high percentage of samples from this building water system (significantly >30%) yielded detections of Legionella; this is both a limitation and strength of the study because it represents a case of relatively high sample positivity. No cooling towers were included in the study, and a comprehensive water management program should include the utility water (nonpotable) system.Reference Garrison, Kunz and Cooley 18 , 19 No ice machines, humidifiers, or redundant (ie, unused) lengths of plumbing pipe were included in this study. Overall, therefore, further study is warranted.
ACKNOWLEDGMENTS
The authors thank Lesley Leonidas for analytical microbiology and Raye Ann Griffin and her team for assisting with sample collection. For review of the manuscript resulting in many improvements, the authors thank Aaron Rosenblatt, Shantini Gamage, and Claressa Lucas. The views expressed in this article are those of the authors and do not necessarily represent the views of the US Department of Veterans Affairs.
Financial support: Funding for this research was provided by Central Texas Veterans Health Care System.
Potential conflicts of interest: At the time of the research, all authors were employed by the Central Texas Department of Veterans Affairs and by Phigenics.