



1. Introduction
Turbulence is essentially a multi-scale phenomenon, in which eddies of various forms over a wide range of length and time scales nonlinearly and non-locally interact with one another. The Richardson–Kolmogorov energy cascade is perhaps the best-known multi-scale feature of turbulence (Kolmogorov Reference Kolmogorov1941) – turbulent kinetic energy (TKE) produced at the (large) integral length scale is transferred to the smallest possible length scale (i.e. the Kolmogorov length scale), at which dissipation primarily takes place. Turbulent flow over a wall is not an exception to the energy cascade. However, in this case, even the integral length scale itself varies with the distance from the wall  $y$. Therefore, the size of the smallest energy-containing eddies in wall-bounded flows scales in inner units (i.e.
 $\delta _\nu =\nu /u_\tau$, where
 $\nu$ is the kinematic viscosity of the fluid and
 $u_\tau$ is the friction velocity), whereas the size of the largest eddies scales in outer units determined by the flow geometry (say
 $h$; for example, the half-height of a channel, the radius of a pipe or the thickness of a boundary layer). The friction Reynolds number is defined to be the ratio of the outer to the inner length scale (
 $Re_\tau =h/\delta _\nu$), which characterises the separation between the largest and smallest length scales. There is also a large number of energy-containing eddies whose size lies in between the inner and outer units. The size of these eddies is approximately proportional to the distance between their centre and the wall (Townsend Reference Townsend1980), the central feature associated with the formation of the logarithmic mean velocity profile (von Kármán Reference von Kármán1930).
The continuum of integral length scales from inner to outer units is well described by the so-called attached eddy hypothesis, which asserts the existence of a hierarchy of self-similar energy-containing eddies throughout the logarithmic region (Townsend Reference Townsend1980). This concept can be generalised to include the near-wall and outer regions, and there has been a growing body of experimental, numerical and theoretical evidence presented over the past two decades: for example, the logarithmic growth of the near-wall streamwise turbulence intensity with Reynolds number (Marusic & Kunkel Reference Marusic and Kunkel2003), the linear growth of the spanwise characteristic length scale (Tomkins & Adrian Reference Tomkins and Adrian2003), the logarithmic wall-normal dependence of the turbulence intensities of the wall-parallel velocity components (Jimenez & Hoyas Reference Jimenez and Hoyas2008; Marusic et al. Reference Marusic, Monty, Hultmark and Smits2013), experimental and numerical evidence of the existence of self-similar energy-containing structures (del Álamo et al. Reference del Álamo, Jimenez, Zandonade and Moser2006; Hwang & Cossu Reference Hwang and Cossu2010b, Reference Hwang and Cossu2011; Lozano-Durán & Jiménez Reference Lozano-Durán and Jiménez2014; Hwang Reference Hwang2015; Hellström, Marusic & Smits Reference Hellström, Marusic and Smits2016; Hwang & Sung Reference Hwang and Sung2018; Cheng et al. Reference Cheng, Li, Lozano-Durán and Liu2019; Baars & Marusic Reference Baars and MarusicReference Baars and Marusic2020a,), the linearly growing eddy-turnover time (Lozano-Durán & Jiménez Reference Lozano-Durán and Jiménez2014; Hwang & Bengana Reference Hwang and Bengana2016), the self-similar invariant form of the mean transport equation (Klewicki Reference Klewicki2013), self-similar responses and modes of the linearised Navier–Stokes operator and their nonlinear coupling (del Alamo & Jimenez Reference del Alamo and Jimenez2006; Hwang & Cossu Reference Hwang and Cossu2010a; Moarref et al. Reference Moarref, Sharma, Tropp and McKeon2013; Hwang & Bengana Reference Hwang and Bengana2016; McKeon Reference McKeon2019; Vadarevu et al. Reference Vadarevu, Symon, Illingworth and Marusic2019), self-similar wall-attached invariant solutions of the Navier–Stokes equations (Eckhardt & Zammert Reference Eckhardt and Zammert2018; Doohan, Willis & Hwang Reference Doohan, Willis and Hwang2019; Yang, Willis & Hwang Reference Yang, Willis and Hwang2019) and much more.
The distinguishing feature of the temporal dynamics of the energy-containing eddies at each length scale is the existence of a self-sustaining mechanism that appears to be independent of that at the other scales (Hwang & Cossu Reference Hwang and Cossu2010b, Reference Hwang and Cossu2011; Hwang Reference Hwang2015; Hwang & Bengana Reference Hwang and Bengana2016). This mechanism is often called the ‘self-sustaining process’ (SSP) (Hamilton, Kim & Waleffe Reference Hamilton, Kim and Waleffe1995; Waleffe Reference Waleffe1997) and it describes the interactive dynamics of long wavy streamwise velocity structures (streaks) and relatively short isotropic vortex packets, statistically in the form of quasi-streamwise vortices. The SSP is understood to consist of three sub-stages: (i) the amplification of streaks by quasi-streamwise vortices via the ‘lift-up effect’ (Butler & Farrell Reference Butler and Farrell1993; del Alamo & Jimenez Reference del Alamo and Jimenez2006; Pujals et al. Reference Pujals, García-Villalba, Cossu and Depardon2009; Hwang & Cossu Reference Hwang and Cossu2010a; McKeon & Sharma Reference McKeon and Sharma2010); (ii) the subcritical instability of the amplified streaks (Hamilton et al. Reference Hamilton, Kim and Waleffe1995; Schoppa & Hussain Reference Schoppa and Hussain2002; Park, Hwang & Cossu Reference Park, Hwang and Cossu2011; Alizard Reference Alizard2015; Cassinelli, de Giovanetti & Hwang Reference Cassinelli, de Giovanetti and Hwang2017; de Giovanetti, Sung & Hwang Reference de Giovanetti, Sung and Hwang2017); and (iii) the nonlinear regeneration of quasi-streamwise vortices (Hamilton et al. Reference Hamilton, Kim and Waleffe1995; Schoppa & Hussain Reference Schoppa and Hussain2002; Hwang & Bengana Reference Hwang and Bengana2016). The early observations of this process were made in transitional Couette flow (Hamilton et al. Reference Hamilton, Kim and Waleffe1995) and the near-wall region of low-Reynolds-number channel flow (Schoppa & Hussain Reference Schoppa and Hussain2002). However, more recently, it has been shown that this process is responsible for the sustainment of energy-containing eddies in the outer region, i.e. very-large-scale and large-scale motion (Hwang & Cossu Reference Hwang and Cossu2010b; Hwang & Bengana Reference Hwang and Bengana2016), as well as for those in the form of the attached eddies of Townsend (Reference Townsend1980) in the logarithmic region (Hwang & Cossu Reference Hwang and Cossu2011; Hwang & Bengana Reference Hwang and Bengana2016).
The energy-containing eddies of various integral length scales evidently play the main role in momentum transfer (de Giovanetti, Hwang & Choi Reference de Giovanetti, Hwang and Choi2016), as they carry most of the TKE. However, if the energetics of turbulence is concerned, the turbulent dissipation must also be taken into account. Indeed, the production and dissipation of turbulence are the two key pillars of the energy balance, and they should be perfectly equal when integrated over the flow domain of interest. Given that the integral length scale in wall turbulence depends on the wall-normal location, the Kolmogorov length scale ( $\eta =(\nu ^3/\epsilon )^{1/4}$, where
 $\epsilon$ is the dissipation rate) should also vary accordingly, as summarised in table 1. Furthermore, emerging evidence primarily from other flow configurations suggests that the balance between production and dissipation is not in equilibrium, in the sense that there exists a dynamic interplay between the two processes (see the recent review by Vassilicos (Reference Vassilicos2015) and the references therein). Indeed, in spatially developing flows such as jets and wakes, such non-equilibrium spatio-temporal energetics have been found to play an important role in the downstream evolution of turbulence (e.g. Nedić, Vassilicos & Ganapathisubramani Reference Nedić, Vassilicos and Ganapathisubramani2013; Cafiero & Vassilicos Reference Cafiero and Vassilicos2019).
Length scales in wall-bounded turbulence. Here,  $l$ is the integral length scale at which production takes place,
 $\epsilon$ is the dissipation rate and
 $\eta$ is the Kolmogorov micro-length scale.

These recent observations of the SSP at each integral length scale and the non-equilibrium turbulent dissipation dynamics suggest that wall-bounded turbulence is a complicated entanglement of these dynamical processes involving the wide range of length scales shown in table 1. Earlier studies demonstrated the existence of scale interaction in the near-wall region, specifically between the self-sustaining inner structures and the near-wall penetrating outer structures (e.g. Hutchins & Marusic Reference Hutchins and Marusic2007; Mathis, Hutchins & Marusic Reference Mathis, Hutchins and Marusic2009; Duvvuri & McKeon Reference Duvvuri and McKeon2015; Agostini & Leschziner Reference Agostini and Leschziner2016; Zhang & Chernyshenko Reference Zhang and Chernyshenko2016). However, more recent works, mainly based on the visualisation of the statistical structure of such interactions, have shown that the scale interaction processes in wall-bounded turbulence are actually dauntingly complex (Cimarelli et al. Reference Cimarelli, De Angelis, Jimenez and Casciola2016; Cho, Hwang & Choi Reference Cho, Hwang and Choi2018; Kawata & Alfredsson Reference Kawata and Alfredsson2018; Lee & Moser Reference Lee and Moser2019). In particular, Cho et al. (Reference Cho, Hwang and Choi2018) found two new types of scale interaction processes that are highly active in the near-wall region and the lower part of the logarithmic region, i.e. the mesolayer (Long & Chen Reference Long and Chen1981; Afzal Reference Afzal1984; Wei et al. Reference Wei, Fife, Klewicki and McMurtry2005), namely the involvement of larger eddies in the energy cascade of smaller eddies and energy transfer from small- to large-scale structures in the near-wall region. The former process appears to be involved in skin-friction generation (de Giovanetti et al. Reference de Giovanetti, Hwang and Choi2016; Cho et al. Reference Cho, Hwang and Choi2018) and the latter has been shown to be responsible for the inner scaling of the wall-reaching part of energy-containing eddies residing in the logarithmic and outer regions (Hwang Reference Hwang2016; Cho et al. Reference Cho, Hwang and Choi2018).
Despite this recent progress, the presence of eddies over a wide range of integral and dissipation length scales in wall-bounded turbulence has impeded the precise understanding of the aforementioned scale interaction processes. In particular, the interactive temporal dynamics of eddies at multiple scales are not well understood. In order to address this issue, the objective of the present work is to analyse the minimal unit of multi-scale near-wall turbulence, i.e. a flow domain just large enough to sustain motion at two integral length scales, with spanwise wavelengths  $\lambda _z^+\approx 110$ (Jiménez & Moin Reference Jiménez and Moin1991) and
 $\lambda _z^+\approx 220$ (the superscript
 $^+$ denotes inner scaling). For this purpose, the ideal flow configuration is the shear stress-driven flow model (Doohan et al. Reference Doohan, Willis and Hwang2019), which has been introduced recently. This model describes the dynamics of the inner-scaling part of near-wall turbulence (i.e. the mesolayer) in the absence of outer flow, as the friction Reynolds number
 $Re_\tau \rightarrow \infty$. Given a logarithmic mean velocity profile, it can be shown that the inner-scaled wall-normal location of maximum Reynolds stress scales as
 $y^+ \sim \sqrt {Re_\tau }$ (e.g. Long & Chen Reference Long and Chen1981; Wei et al. Reference Wei, Fife, Klewicki and McMurtry2005), below which point the viscous wall effects cannot be neglected. Therefore, as
 $Re_\tau \rightarrow \infty$, the extent of the mesolayer increases and it encompasses a hierarchy of scales, not just the self-sustaining near-wall structures (Jiménez & Pinelli Reference Jiménez and Pinelli1999). Hence, arbitrary values of the domain dimensions
 $(L_x^+,L_y^+,L_z^+)$ can be fixed in the high-
 $Re_\tau$ limit, under the assumption that
 $L_x^+,L_y^+,L_z^+ \ll \sqrt {Re_\tau }$, and the near-wall contribution of structures larger than the flow domain will be excluded. Another benefit of using the shear stress-driven model is that it is applicable to the near-wall region and lower logarithmic region of turbulent Couette, Poiseuille and Hagen–Poiseuille flow, since as
 $Re_\tau \rightarrow \infty$, the effects of the flow geometry or curvature are not felt. Therefore, the model allows for the most general analysis of multi-scale turbulence near the wall.
In this study, shear stress-driven flow in the minimal unit of multi-scale turbulence is considered. The velocity field is decomposed into large- and small-scale components, and the momentum and energy balance equations at each scale are derived. The statistics and dynamics of the nonlinear turbulent transport terms are analysed, and the corresponding scale interaction processes are identified and related to the SSPs at each scale. Specifically, it is shown that the temporal dynamics of the energy cascade are determined by the large-scale SSP, both in the timing of the energy transfer from large to small scales and the characteristic time scales of its subsequent dissipation (§ 4). Furthermore, wall-normal turbulent transport from large to small scales drives small-scale turbulent production, indicative of a new scale interaction process (§ 5). Finally, it appears that the energy transfer or ‘feeding’ from small to large scales is impelled by the small-scale SSP and its streak instability stage in particular (§ 6). The aforementioned scale interaction processes are analysed in detail in order to understand the general dynamics of two-scale near-wall turbulence.
2. Problem formulation
2.1. Shear stress-driven flow model
The flow considered is that of an incompressible fluid in a rectangular domain over a smooth wall, as described by the shear stress-driven flow model of Doohan et al. (Reference Doohan, Willis and Hwang2019). The model is formulated in inner units, denoted by the superscript  $^+$, where
 $t^+$ is time,
 $\boldsymbol {x}^+=(x^+,y^+,z^+)$ are the streamwise, wall-normal and spanwise coordinates,
 $(L_x^+,L_y^+,L_z^+)$ the domain dimensions and
 $\boldsymbol {u}^+=(u^+,v^+,w^+)$ the corresponding velocity components. The wall is located at the lower boundary of the domain at
 $y^+=0$. The flow geometry is shown in figure 1. The velocity field can be expressed in terms of the mean and fluctuating components
 \begin{equation} \boldsymbol{u}^+(\boldsymbol{x}^+,t^+)=\boldsymbol{U}^+(y^+,t^+)+ \boldsymbol{u}^{'+}(\boldsymbol{x}^+,t^+), \end{equation}
where  $\boldsymbol {U}^+=(U^+,V^+,W^+)=\langle \boldsymbol {u}^+ \rangle _{x^+,z^+}, \boldsymbol {u}^{'+}=(u^{'+},v^{'+},w^{'+})$ and
 $\langle \cdot \rangle _{x^+,z^+}$ denotes the average in the streamwise and spanwise directions. Within the mesolayer, the wall-normal coordinate satisfies the relation
 $y^+ \lesssim \sqrt {Re_\tau }$ (e.g. Long & Chen Reference Long and Chen1981; Wei et al. Reference Wei, Fife, Klewicki and McMurtry2005) and as
 $Re_\tau \rightarrow \infty$, the turbulent mean velocity component satisfies the mean momentum equation
 \begin{equation} \frac{\overline{\textrm{d}U}^+}{{\textrm{d} y}^+} - \overline{\langle u^{'+}v^{'+}\rangle}_{x^+,z^+} = 1, \end{equation}
where  $\bar {\cdot }$ denotes the average in time while the flow remains turbulent. For example, in Poiseuille flow, the
 $-y^+/Re_\tau$ term that derives from the pressure gradient (e.g. Townsend Reference Townsend1980) will vanish in this limit, provided that
 $L_y^+ \lesssim \sqrt {Re_\tau }$. Hence, the right-hand side of the mean momentum equation reduces to unity for all parallel wall-bounded flows, including Couette and Hagen–Poiseuille flows. The fluctuating velocity components are then governed by the momentum equation
 \begin{align} \boldsymbol{u}^{'+}_{t^+} +(\boldsymbol{U}^+\boldsymbol{\cdot} \boldsymbol{\nabla} )\boldsymbol{u}^{'+} &={-}(\boldsymbol{u}^{'+}\boldsymbol{\cdot} \boldsymbol{\nabla} )\boldsymbol{U}^+{-}\boldsymbol{\nabla} p^{'+} -((\boldsymbol{u}^{'+}\boldsymbol{\cdot} \boldsymbol{\nabla} )\boldsymbol{u}^{'+}\nonumber\\ & \quad -\langle(\boldsymbol{u}^{'+}\boldsymbol{\cdot} \boldsymbol{\nabla} )\boldsymbol{u}^{'+}\rangle_{x^+,z^+}) +\nabla^2 \boldsymbol{u}^{'+}, \end{align}
where  $p^{'+}$ is the pressure fluctuation.
Geometry of the shear stress-driven flow model.

The no-slip condition  $\boldsymbol {u}^+|_{y^+=0} = \boldsymbol {0}$ is imposed at the lower boundary of the domain to represent the stationary wall. At the upper boundary, a horizontally uniform shear stress is applied such that a prescribed bulk flow rate is maintained during the simulation. Introducing the instantaneous bulk velocity
 $U_b^+(t^+) = \langle u^+(x^+,y^+,z^+,t^+) \rangle _{x^+,y^+,z^+}$ and the corresponding laminar bulk velocity
 $U_0^+$, the streamwise boundary condition can be written as
 \begin{equation} \left.\frac{\partial u^+}{\partial y^+}\right|_{y^+{=}L_y^+}(t^+) = \left\langle\left.\frac{\partial u^+}{\partial y^+}\right|_{y^+{=}0}\right\rangle_{x^+,z^+}(t^+) + C^+(U_0^+{-}U_b^+(t^+)),\end{equation}
where  $C^+$ is a constant that maintains
 $U_b^+(t^+)$ close to
 $U_0^+$ during the simulation. Since the fluctuation of
 $U_b^+(t^+)$ about
 $U_0^+$ is kept to a minimum, the flow is largely independent of
 $C^+$; indeed, the independence of the simulation results has been demonstrated previously by considering a wide range of values of
 $C^+$. In the present study, its value is fixed at
 $C^+ \approx 0.14$, which is identical to that in Doohan et al. (Reference Doohan, Willis and Hwang2019) when normalised by the size of the computational domain in any direction. The impermeability and stress-free conditions
 \begin{equation} v^+|_{y^+{=}L_y^+} = 0 \quad \mathrm{and} \quad \left.\frac{\partial w^+}{\partial y^+}\right|_{y^+{=}L_y^+} = 0 \end{equation}
are imposed on the wall-normal and spanwise velocity components, respectively, at the upper boundary of the domain. Given boundary condition (2.5a) and that  $\overline {U_b^+(t^+)}=U_0^+$, (2.4) implies that the time-averaged total shear stress is uniform across the wall-normal domain, ensuring that the mean momentum equation (2.2) is satisfied. Periodic boundary conditions are imposed in both the streamwise and spanwise directions. Further details about the model and its validation are discussed in Doohan et al. (Reference Doohan, Willis and Hwang2019). The numerical simulations in this study were carried out with the Diablo Navier–Stokes solver (Bewley Reference Bewley2014), which has been verified extensively (e.g. Hwang Reference Hwang2013). This code employs the Fourier–Galerkin method in the streamwise and spanwise directions with a
 $2/3$ dealiasing rule, and a second-order finite difference scheme in the wall-normal direction. The temporal discretisation is based on the fractional-step algorithm (Kim & Moin Reference Kim and Moin1985), with implicit treatment of wall-normal derivatives using the Crank–Nicolson scheme and explicit treatment of the remaining terms using a low-storage third-order Runge–Kutta scheme.
Given its formulation in inner units, the shear stress-driven model is governed by the unit-Reynolds-number Navier–Stokes equations (2.3) and the inner-scaled domain dimensions  $(L_x^+,L_y^+,L_z^+)$ take on the role of control parameters. In particular, due to the periodic boundary conditions in the streamwise and spanwise directions, the domain size can be used to determine the expected number of levels in the hierarchy of scales of motion. As a first step in the study of the temporal dynamics of multi-scale near-wall turbulence, the number of integral length scales is restricted to two. To this end, the domain size is fixed at
 $(L_x^+=640,L_y^+=180,L_z^+=220)$ and only the energy-containing eddies with spanwise length scales
 $\lambda _z^+\approx 110$ (Jiménez & Moin Reference Jiménez and Moin1991) and
 $\lambda _z^+\approx 220$ will be resolved, since the structures with larger wavelengths will be removed. In this way, the model allows for the analysis of the temporal dynamics of near-wall turbulence sustained at two integral length scales. The simulation parameters of the minimal unit of multi-scale turbulence are displayed in table 2 and its spectral energetics are discussed in appendix A.
Simulation parameters of the minimal unit of multi-scale near-wall turbulence. Here,  $N_x, N_y$ and
 $N_z$ denote the number of grid points in the streamwise, wall-normal and spanwise directions, respectively, and
 $T^+$ is the duration of the flow simulation.

2.2. Multi-scale governing equations
Having introduced the shear stress-driven flow model, the task at hand is to describe the temporal dynamics of minimal multi-scale near-wall turbulence. In a number of previous studies, the characteristics of statistically steady multi-scale turbulence have been explored through the spectral energy balance equation (e.g. Mizuno Reference Mizuno2016; Cho et al. Reference Cho, Hwang and Choi2018; Lee & Moser Reference Lee and Moser2019). However, such an analysis involves a large number of length scales, too many to consider simultaneously even in the present highly simplified system (see appendix A). Therefore, a simpler approach is required. In this study, a binary decomposition of the fluctuating velocity field is considered in order to separate the energy-containing eddies at each integral length scale, namely  $\boldsymbol {u}^{'+}=\boldsymbol {u}_l^++\boldsymbol {u}_s^+$, where
 $\boldsymbol {u}_l^+=(u_l^+,v_l^+,w_l^+)$ denotes the large-scale structures and
 $\boldsymbol {u}_s^+=(u_s^+,v_s^+,w_s^+)$ the small-scale structures. For this purpose,
 $\boldsymbol {u}_l^+$ and
 $\boldsymbol {u}_s^+$ are hereby defined as
 \begin{gather} \boldsymbol{u}_l^+{=}\sum_{|m|\leq m_x}\sum_{|n|\leq 1} \widehat{\boldsymbol{u}^{'+}}\, \textrm{e}^{\textrm{i}(mk_{x0}^+x^+{+}nk_{z0}^+z^+)}; \quad |m|+|n|\neq0, \end{gather}
 \begin{gather}\boldsymbol{u}_s^+{=}\sum_{|m|\leq m_x}\sum_{2 \leq|n|\leq n_z}\widehat{\boldsymbol{u}^{'+}}\, \textrm{e}^{\textrm{i}(mk_{x0}^+x^+{+}nk_{z0}^+z^+)}, \end{gather}
where  $\hat {\cdot }$ denotes the Fourier transform defined over the finite spatial domain considered,
 $k_{x0}^+$ and
 $k_{z0}^+$ are the fundamental streamwise and spanwise wavenumbers, and
 $m_x$ and
 $n_z$ are the number of harmonics in the streamwise and spanwise directions. This decomposition is based entirely on the spanwise wavelength and all streamwise wavelengths are included (apart from the spatial mean), since the size of energy-containing eddies in wall-bounded turbulence is well characterised by the spanwise length scale and they are comprised of structures of various streamwise length scales, i.e. elongated streaks and short quasi-streamwise vortices (Hwang Reference Hwang2015). The root mean squared velocity profiles and their large- and small-scale components are shown in figure 2. The large-scale structures are relatively uniform across the wall-normal domain (dashed lines) while the small-scale structures are much more pronounced near the wall (dash–dotted lines), consistent with Townsend's hypothesis (Townsend Reference Townsend1980). Note that these results (and those in subsequent sections) are plotted over the interval
 $y^+\in [0,120]$ so as to exclude the flow region immediately below the upper boundary (see Doohan et al. Reference Doohan, Willis and Hwang2019).
Root mean squared velocity profiles (a)  $u^+_{rms}, (b)$
 $v^+_{rms}$ and (c)
 $w^+_{rms}$ (solid lines), decomposed into their large-scale components
 $\overline {\langle (u_l^+)^2 \rangle }_{x^+,z^+}/u^+_{rms}, \overline {\langle (v_l^+)^2 \rangle }_{x^+,z^+}/v^+_{rms}$ and
 $\overline {\langle (w_l^+)^2 \rangle }_{x^+,z^+}/w^+_{rms}$ (dashed lines), and small-scale components
 $\overline {\langle (u_s^+)^2 \rangle }_{x^+,z^+}/u^+_{rms}, \overline {\langle (v_s^+)^2 \rangle }_{x^+,z^+}/v^+_{rms}$ and
 $\overline {\langle (w_s^+)^2 \rangle }_{x^+,z^+}/w^+_{rms}$ (dash–dotted lines).

Though defined precisely in (2.6a) and (2.6b), the following analysis will hold for alternative velocity field decompositions provided that  $\boldsymbol {u}_l^+$ and
 $\boldsymbol {u}_s^+$ are disjoint sets. Substitution of
 $\boldsymbol {u}_l^+$ and
 $\boldsymbol {u}_s^+$ into (2.3) yields the large- and small-scale momentum equations
 \begin{align} &\frac{\partial \boldsymbol{u}^+_l}{\partial t^+} +(\boldsymbol{U}^+\boldsymbol{\cdot} \boldsymbol{\nabla} )\boldsymbol{u}^+_l={-}(\boldsymbol{u}^+_l\boldsymbol{\cdot} \boldsymbol{\nabla} )\boldsymbol{U}^+{-}\boldsymbol{\nabla} p^+_l +\nabla^2\boldsymbol{u}^+_l \nonumber\\ & \quad -\mathcal{P}_l\{ (\boldsymbol{u}^+_l\boldsymbol{\cdot} \boldsymbol{\nabla} )\boldsymbol{u}^+_l +(\boldsymbol{u}^+_l\boldsymbol{\cdot} \boldsymbol{\nabla} )\boldsymbol{u}^+_s +(\boldsymbol{u}^+_s\boldsymbol{\cdot} \boldsymbol{\nabla} )\boldsymbol{u}^+_l +(\boldsymbol{u}^+_s\boldsymbol{\cdot} \boldsymbol{\nabla} )\boldsymbol{u}^+_s\}, \end{align}
and
 \begin{align} &\frac{\partial \boldsymbol{u}^+_s}{\partial t^+} +(\boldsymbol{U}^+\boldsymbol{\cdot} \boldsymbol{\nabla} )\boldsymbol{u}^+_s={-}(\boldsymbol{u}^+_s\boldsymbol{\cdot} \boldsymbol{\nabla} )\boldsymbol{U}^+{-}\boldsymbol{\nabla} p^+_s +\nabla^2\boldsymbol{u}^+_s \nonumber\\ & \quad -\mathcal{P}_s\{ (\boldsymbol{u}^+_s\boldsymbol{\cdot} \boldsymbol{\nabla} )\boldsymbol{u}^+_s +(\boldsymbol{u}^+_s\boldsymbol{\cdot} \boldsymbol{\nabla} )\boldsymbol{u}^+_l +(\boldsymbol{u}^+_l\boldsymbol{\cdot} \boldsymbol{\nabla} )\boldsymbol{u}^+_s +(\boldsymbol{u}^+_l\boldsymbol{\cdot} \boldsymbol{\nabla} )\boldsymbol{u}^+_l\}, \end{align}
where  $p^{'+}=p_l^++p_s^+$ are the large- and small-scale pressure fluctuations, and
 $\mathcal {P}_l\{\cdot \}$ and
 $\mathcal {P}_s\{\cdot \}$ denote projection onto large and small scales, respectively. Multiplying equation (2.7) by
 $\boldsymbol {u}_l^+$ and averaging in the streamwise and spanwise directions yields the large-scale energy balance equation, which can be written in component form as
 \begin{gather} \frac{\partial E^+_{ul}}{\partial t^+}= P^+_{ul}+T^+_{ul}+\varPi^+_{ul}+T^+_{\nu,ul}+\epsilon^+_{ul}, \end{gather}
 \begin{gather}\frac{\partial E^+_{vl}}{\partial t^+}= T^+_{p,vl}+T^+_{vl}+\varPi^+_{vl}+T^+_{\nu,vl}+\epsilon^+_{vl}, \end{gather}
 \begin{gather}\frac{\partial E^+_{wl}}{\partial t^+}= T^+_{wl}+\varPi^+_{wl}+T^+_{\nu,wl}+\epsilon^+_{wl}, \end{gather}
where
 \begin{equation} E^+_{ul}=\tfrac{1}{2}\langle (u_l^+)^2 \rangle_{x^+,z^+}, \quad E^+_{vl}=\tfrac{1}{2}\langle (v_l^+)^2 \rangle_{x^+,z^+} \quad \mathrm{and} \quad E^+_{wl}=\tfrac{1}{2}\langle (w_l^+)^2 \rangle_{x^+,z^+} \end{equation}
are large-scale streamwise, wall-normal and spanwise kinetic energy,  $P^+_{ul}$ is large-scale turbulent production,
 \begin{gather} T^+_{ul}={-}\langle u_l^+ (\boldsymbol{u}^+_l\boldsymbol{\cdot} \boldsymbol{\nabla} u_l^+{+} \boldsymbol{u}^+_l\boldsymbol{\cdot} \boldsymbol{\nabla} u_s^+{+} \boldsymbol{u}^+_s\boldsymbol{\cdot} \boldsymbol{\nabla} u_l^+{+} \boldsymbol{u}^+_s\boldsymbol{\cdot} \boldsymbol{\nabla} u_s^+)\rangle_{x^+,z^+}, \end{gather}
 \begin{gather}T^+_{vl}={-}\langle v_l^+ (\boldsymbol{u}^+_l\boldsymbol{\cdot} \boldsymbol{\nabla} v_l^+{+} \boldsymbol{u}^+_l\boldsymbol{\cdot} \boldsymbol{\nabla} v_s^+{+} \boldsymbol{u}^+_s\boldsymbol{\cdot} \boldsymbol{\nabla} v_l^+{+} \boldsymbol{u}^+_s\boldsymbol{\cdot} \boldsymbol{\nabla} v_s^+)\rangle_{x^+,z^+}, \end{gather}
 \begin{gather}T^+_{wl}={-}\langle w_l^+ (\boldsymbol{u}^+_l\boldsymbol{\cdot} \boldsymbol{\nabla} w_l^+{+} \boldsymbol{u}^+_l\boldsymbol{\cdot} \boldsymbol{\nabla} w_s^+{+} \boldsymbol{u}^+_s\boldsymbol{\cdot} \boldsymbol{\nabla} w_l^+{+} \boldsymbol{u}^+_s\boldsymbol{\cdot} \boldsymbol{\nabla} w_s^+)\rangle_{x^+,z^+} \end{gather}
are large-scale streamwise, wall-normal and spanwise turbulent transport,  $\varPi ^+_{ul}, \varPi ^+_{vl}$ and
 $\varPi ^+_{wl}$ are large-scale streamwise, wall-normal and spanwise pressure strain,
 $T^+_{p,vl}$ is large-scale pressure transport,
 $T^+_{\nu ,ul}, T^+_{\nu ,vl}$ and
 $T^+_{\nu ,wl}$ are large-scale streamwise, wall-normal and spanwise viscous transport, and
 $\epsilon ^+_{ul}, \epsilon ^+_{vl}$ and
 $\epsilon ^+_{wl}$ are large-scale streamwise, wall-normal and spanwise dissipation. In a similar manner, multiplying equation (2.8) by
 $\boldsymbol {u}_s^+$ and averaging in the streamwise and spanwise directions yields the small-scale energy balance equation, in which
 $E^+_{us}, E^+_{vs}$ and
 $E^+_{ws}$ are small-scale streamwise, wall-normal and spanwise kinetic energy,
 $P^+_{us}$ is small-scale turbulent production,
 \begin{gather} T^+_{us}={-}\langle u_s^+ (\boldsymbol{u}^+_s\boldsymbol{\cdot} \boldsymbol{\nabla} u_s^+{+} \boldsymbol{u}^+_s\boldsymbol{\cdot} \boldsymbol{\nabla} u_l^+{+} \boldsymbol{u}^+_l\boldsymbol{\cdot} \boldsymbol{\nabla} u_s^+{+} \boldsymbol{u}^+_l\boldsymbol{\cdot} \boldsymbol{\nabla} u_l^+)\rangle_{x^+,z^+}, \end{gather}
 \begin{gather}T^+_{vs}={-}\langle v_s^+ (\boldsymbol{u}^+_s\boldsymbol{\cdot} \boldsymbol{\nabla} v_s^+{+} \boldsymbol{u}^+_s\boldsymbol{\cdot} \boldsymbol{\nabla} v_l^+{+} \boldsymbol{u}^+_l\boldsymbol{\cdot} \boldsymbol{\nabla} v_s^+{+} \boldsymbol{u}^+_l\boldsymbol{\cdot} \boldsymbol{\nabla} v_l^+)\rangle_{x^+,z^+}, \end{gather}
 \begin{gather}T^+_{ws}={-}\langle w_s^+ (\boldsymbol{u}^+_s\boldsymbol{\cdot} \boldsymbol{\nabla} w_s^+{+} \boldsymbol{u}^+_s\boldsymbol{\cdot} \boldsymbol{\nabla} w_l^+{+} \boldsymbol{u}^+_l\boldsymbol{\cdot} \boldsymbol{\nabla} w_s^+{+} \boldsymbol{u}^+_l\boldsymbol{\cdot} \boldsymbol{\nabla} w_l^+)\rangle_{x^+,z^+} \end{gather}
are small-scale streamwise, wall-normal and spanwise turbulent transport,  $\varPi ^+_{us}, \varPi ^+_{vs}$ and
 $\varPi ^+_{ws}$ are small-scale streamwise, wall-normal and spanwise pressure strain,
 $T^+_{p,vs}$ is small-scale pressure transport,
 $T^+_{\nu ,us}, T^+_{\nu ,vs}$ and
 $T^+_{\nu ,ws}$ are small-scale streamwise, wall-normal and spanwise viscous transport, and
 $\epsilon ^+_{us}, \epsilon ^+_{vs}$ and
 $\epsilon ^+_{ws}$ are small-scale streamwise, wall-normal and spanwise dissipation. The definitions of the terms in the large- and small-scale energy balance equations are given in full in appendix B.
The large- and small-scale energy balance equations contain both linear and nonlinear terms. Turbulent production is the linear mechanism through which the large- and small-scale velocity fluctuations extract energy from the mean velocity, and  $P^+_{ul}$ and
 $P^+_{us}$ are the only terms in the energy balance equations that depend on
 $U^+$. The turbulent dynamics at each scale are dominated by the interplay between production and dissipation, which is also a linear mechanism. On the other hand, the pressure strain, pressure transport and turbulent transport terms are all inherently nonlinear. The nonlinearity of the pressure strain and pressure transport terms is implicit, originating from the ‘slow’ nonlinear term that drives the pressure Poisson equation (Kim Reference Kim1989). Though the pressure fluctuations are indeed nonlinear, the energy flux through the pressure strain terms is linear since they are linked by the continuity equation at each scale as
 $-\varPi ^+_{ul}=\varPi ^+_{vl}+\varPi ^+_{wl}$ and
 $-\varPi ^+_{us}=\varPi ^+_{vs}+\varPi ^+_{ws}$. Furthermore, it has been argued that the redistribution of streamwise TKE to the wall-normal and spanwise components at the integral length scale by the pressure strain terms is the signature of the SSP at each scale (Cho et al. Reference Cho, Hwang and Choi2018), since the spectra of turbulent production and pressure strain are well aligned (Mizuno Reference Mizuno2016; Cho et al. Reference Cho, Hwang and Choi2018; Lee & Moser Reference Lee and Moser2019). In § 3, it will be demonstrated that this is indeed the case. Finally, the turbulent transport terms are explicitly nonlinear and their role is to facilitate the transfer of TKE between structures of different scales through their nonlinear interaction.
Following a similar approach to Kawata & Alfredsson (Reference Kawata and Alfredsson2019), the turbulent transport terms can be further decomposed into spatial transport and inter-scale transport terms. Rewriting the first component of each term in (2.11c) and (2.12c), the intra-scale spatial turbulent transport terms are defined as
 \begin{gather} T^+_{ul,-}={-}\langle u_l^+ (\boldsymbol{u}^+_l\boldsymbol{\cdot} \boldsymbol{\nabla} u_l^+)\rangle_{x^+,z^+} ={-}\boldsymbol{\nabla} \boldsymbol{\cdot} \langle\tfrac{1}{2}(u_l^+)^2\boldsymbol{u}_l^+\rangle_{x^+,z^+}, \end{gather}
 \begin{gather}T^+_{vl,-}={-}\langle v_l^+ (\boldsymbol{u}^+_l\boldsymbol{\cdot} \boldsymbol{\nabla} v_l^+)\rangle_{x^+,z^+} ={-}\boldsymbol{\nabla} \boldsymbol{\cdot} \langle\tfrac{1}{2}(v_l^+)^2\boldsymbol{u}_l^+\rangle_{x^+,z^+}, \end{gather}
 \begin{gather}T^+_{wl,-}={-}\langle w_l^+ (\boldsymbol{u}^+_l\boldsymbol{\cdot} \boldsymbol{\nabla} w_l^+)\rangle_{x^+,z^+} ={-}\boldsymbol{\nabla} \boldsymbol{\cdot} \langle\tfrac{1}{2}(w_l^+)^2\boldsymbol{u}_l^+\rangle_{x^+,z^+}, \end{gather}
 \begin{gather}T^+_{us,-}={-}\langle u_s^+ (\boldsymbol{u}^+_s\boldsymbol{\cdot} \boldsymbol{\nabla} u_s^+)\rangle_{x^+,z^+} ={-}\boldsymbol{\nabla} \boldsymbol{\cdot} \langle\tfrac{1}{2}(u_s^+)^2\boldsymbol{u}_s^+\rangle_{x^+,z^+}, \end{gather}
 \begin{gather}T^+_{vs,-}={-}\langle v_s^+ (\boldsymbol{u}^+_s\boldsymbol{\cdot} \boldsymbol{\nabla} v_s^+)\rangle_{x^+,z^+} ={-}\boldsymbol{\nabla} \boldsymbol{\cdot} \langle\tfrac{1}{2}(v_s^+)^2\boldsymbol{u}_s^+\rangle_{x^+,z^+}, \end{gather}
 \begin{gather}T^+_{ws,-}={-}\langle w_s^+ (\boldsymbol{u}^+_s\boldsymbol{\cdot} \boldsymbol{\nabla} w_s^+)\rangle_{x^+,z^+}={-}\boldsymbol{\nabla} \boldsymbol{\cdot} \langle\tfrac{1}{2}(w_s^+)^2\boldsymbol{u}_s^+\rangle_{x^+,z^+}, \end{gather}
with subscript  $_{-}$. Each of the above terms is written as the divergence of a vector field, the elements of which are functions of the velocity components at the same scale, i.e. large scale or small scale. Therefore, the terms in (2.13f) can be interpreted as the energy gain or loss resulting from the spatial transport of TKE induced by structures of the same scale and so they do not represent scale interaction processes. In a similar manner, rewriting the third and fourth components of each term in (2.11c) and (2.12c), the inter-scale spatial turbulent transport terms are defined as
 \begin{gather} T^+_{ul,\#}={-}\boldsymbol{\nabla} \boldsymbol{\cdot} \langle\tfrac{1}{2}(u_l^+)^2\boldsymbol{u}_s^+\rangle_{x^+,z^+} - \boldsymbol{\nabla} \boldsymbol{\cdot} \langle u_l^+u_s^+\boldsymbol{u}_s^+\rangle_{x^+,z^+}, \end{gather}
 \begin{gather}T^+_{vl,\#}={-}\boldsymbol{\nabla} \boldsymbol{\cdot} \langle\tfrac{1}{2}(v_l^+)^2\boldsymbol{u}_s^+\rangle_{x^+,z^+} - \boldsymbol{\nabla} \boldsymbol{\cdot} \langle v_l^+v_s^+\boldsymbol{u}_s^+\rangle_{x^+,z^+}, \end{gather}
 \begin{gather}T^+_{wl,\#}={-}\boldsymbol{\nabla} \boldsymbol{\cdot} \langle\tfrac{1}{2}(w_l^+)^2\boldsymbol{u}_s^+\rangle_{x^+,z^+} - \boldsymbol{\nabla} \boldsymbol{\cdot} \langle w_l^+w_s^+\boldsymbol{u}_s^+\rangle_{x^+,z^+}, \end{gather}
 \begin{gather}T^+_{us,\#}={-}\boldsymbol{\nabla} \boldsymbol{\cdot} \langle\tfrac{1}{2}(u_s^+)^2\boldsymbol{u}_l^+\rangle_{x^+,z^+} - \boldsymbol{\nabla} \boldsymbol{\cdot} \langle u_l^+u_s^+\boldsymbol{u}_l^+\rangle_{x^+,z^+}, \end{gather}
 \begin{gather}T^+_{vs,\#}={-}\boldsymbol{\nabla} \boldsymbol{\cdot} \langle\tfrac{1}{2}(v_s^+)^2\boldsymbol{u}_l^+\rangle_{x^+,z^+} - \boldsymbol{\nabla} \boldsymbol{\cdot} \langle v_l^+v_s^+\boldsymbol{u}_l^+\rangle_{x^+,z^+}, \end{gather}
 \begin{gather}T^+_{ws,\#}={-}\boldsymbol{\nabla} \boldsymbol{\cdot} \langle\tfrac{1}{2}(w_s^+)^2\boldsymbol{u}_l^+\rangle_{x^+,z^+} - \boldsymbol{\nabla} \boldsymbol{\cdot} \langle w_l^+w_s^+\boldsymbol{u}_l^+\rangle_{x^+,z^+}, \end{gather}
with subscript  $_{\#}$. Again, each of the above terms is written as the divergence of a vector field; however, its elements are now functions of the velocity components at both large and small scales. Therefore, the terms in (2.14f) can be interpreted as the energy gain or loss resulting from the spatial transport of TKE induced by the interaction of large- and small-scale structures. Finally, the remaining components of each term in (2.11c) and (2.12c) appear at large- and small-scales with opposite sign, and these inter-scale turbulent transport terms are defined as
 \begin{gather} T^+_{u,\updownarrow}= \langle u_l^+(\boldsymbol{u}^+_l\boldsymbol{\cdot} \boldsymbol{\nabla} u_s^+)\rangle_{x^+,z^+} - \langle u_s^+(\boldsymbol{u}^+_s\boldsymbol{\cdot} \boldsymbol{\nabla} u_l^+) \rangle_{x^+,z^+}, \end{gather}
 \begin{gather}T^+_{v,\updownarrow}= \langle v_l^+(\boldsymbol{u}^+_l\boldsymbol{\cdot} \boldsymbol{\nabla} v_s^+)\rangle_{x^+,z^+} - \langle v_s^+(\boldsymbol{u}^+_s\boldsymbol{\cdot} \boldsymbol{\nabla} v_l^+) \rangle_{x^+,z^+}, \end{gather}
 \begin{gather}T^+_{w,\updownarrow}= \langle w_l^+(\boldsymbol{u}^+_l\boldsymbol{\cdot} \boldsymbol{\nabla} w_s^+)\rangle_{x^+,z^+} - \langle w_s^+(\boldsymbol{u}^+_s\boldsymbol{\cdot} \boldsymbol{\nabla} w_l^+) \rangle_{x^+,z^+}, \end{gather}
with subscript  $_{\updownarrow }$. Here,
 $T^+_{u,\updownarrow }, T^+_{v,\updownarrow }$ and
 $T^+_{w,\updownarrow }$ appear in the small-scale energy balance equations, while their negations appear in the large-scale energy balance equations (see (2.16) below). Therefore, the terms in (2.15) can be interpreted as the energy gain or loss resulting from the same-component inter-scale transport of TKE between large and small scales defined in (2.6a) and (2.6b), i.e. between
 $u^+_l$ and
 $u^+_s, v^+_l$ and
 $v^+_s$, and
 $w^+_l$ and
 $w^+_s$. It is apparent that the interaction of large- and small-scale structures results in both spatial turbulent transport and inter-scale turbulent transport through the terms in (2.14f) and (2.15), respectively. The large- and small-scale energy balance equations are written in full as
 \begin{align} \frac{\partial E^+_{ul}}{\partial t^+}&= P^+_{ul}\ \ \ {-}T^+_{u,\updownarrow}+T^+_{ul,-}+T^+_{ul,\#} +\varPi^+_{ul}+T^+_{\nu,ul}+\epsilon^+_{ul}, \end{align}
 \begin{align}\frac{\partial E^+_{vl}}{\partial t^+}&= T^+_{p,vl}\, {-}T^+_{v,\updownarrow}+T^+_{vl,-}+T^+_{vl,\#} +\varPi^+_{vl}+T^+_{\nu,vl}+\epsilon^+_{vl}, \end{align}
 \begin{align}\frac{\partial E^+_{wl}}{\partial t^+}&=\qquad -T^+_{w,\updownarrow}+T^+_{wl,-}+T^+_{wl,\#} +\varPi^+_{wl}+T^+_{\nu,wl}+\epsilon^+_{wl}, \end{align}
 \begin{align}\frac{\partial E^+_{us}}{\partial t^+}&= P^+_{us}\ \ \ {+}T^+_{u,\updownarrow}+T^+_{us,-}+T^+_{us,\#} +\varPi^+_{us}+T^+_{\nu,us}+\epsilon^+_{us}, \end{align}
 \begin{align}\frac{\partial E^+_{vs}}{\partial t^+}&= T^+_{p,vs}\ {+}T^+_{v,\updownarrow}+T^+_{vs,-}+T^+_{vs,\#} +\varPi^+_{vs}+T^+_{\nu,vs}+\epsilon^+_{vs}, \end{align}
 \begin{align}\frac{\partial E^+_{ws}}{\partial t^+}&= \qquad\quad T^+_{w,\updownarrow}+T^+_{ws,-}+T^+_{ws,\#} +\varPi^+_{ws}+T^+_{\nu,ws}+\epsilon^+_{ws}, \end{align}
and the definitions of the terms are given in appendix B.
2.3. Mean multi-scale energetics
The governing equations derived in § 2.2 allow for the analysis of the temporal dynamics of multi-scale near-wall turbulence; however, a few issues need to be addressed. Firstly, the particular velocity field decomposition introduced in (2.6) must be investigated in order to identify the processes that are likely to take place at each scale (e.g. the SSP) and the transfers of energy that are expected to occur between the large and small scales (e.g. the energy cascade). Secondly, the terms in the energy balance equations (2.16) are functions of both wall-normal height  $y^+$ and time
 $t^+$, since homogeneity allows for averaging in the streamwise and spanwise directions. But averaging in the wall-normal direction is also required in order to study the temporal dynamics; hence, any wall-normal anisotropy of the terms in (2.16) must be identified to allow for the selection of appropriate integration limits. To this end, the statistics of the terms on the right-hand side of the energy balance equations are analysed, which balance each other in a statistically steady flow, and the results are shown in figure 3 as a function of the wall-normal height
 $y^+$.
Time-averaged, wall-normal profiles of the terms on the right-hand side of (2.16): turbulent production (red), turbulent transport (black), pressure strain (light green), pressure transport (dark green), viscous transport (cyan) and dissipation (blue) of (a)  $E^+_{ul}$ (
 $P^+_{ul},T^+_{ul},\varPi ^+_{ul},T^+_{\nu ,ul},\epsilon ^+_{ul}$), (b)
 $E^+_{us}$ (
 $P^+_{us},T^+_{us},\varPi ^+_{us},T^+_{\nu ,us},\epsilon ^+_{us}$), (c)
 $E^+_{vl}$ (
 $T^+_{vl},\varPi ^+_{vl},T^+_{p,vl},T^+_{\nu ,vl},\epsilon ^+_{vl}$), (d)
 $E^+_{vs}$ (
 $T^+_{vs},\varPi ^+_{vs},T^+_{p,vs},T^+_{\nu ,vs},\epsilon ^+_{vs}$), (e)
 $E^+_{wl}$ (
 $T^+_{wl},\varPi ^+_{wl},T^+_{\nu ,wl},\epsilon ^+_{wl}$) and (f)
 $E^+_{ws}$ (
 $T^+_{ws},\varPi ^+_{ws},T^+_{\nu ,ws},\epsilon ^+_{ws}$).

The large-scale production term  $P^+_{ul}$ is almost uniform across the wall-normal domain in figure 3(a) (red), while the small-scale production term
 $P^+_{us}$ exhibits an intense near-wall peak at
 $y^+\approx 12$ in figure 3(b) (red). This is the effect of the no-slip boundary condition, which mathematically constrains the peak to be located in the near-wall region, as discussed in detail by Yang, Willis & Hwang (Reference Yang, Willis and Hwang2018) (§ 3.2 of that work). At this point, the magnitude of
 $P^+_{us}$ is almost five times greater than that of
 $P^+_{ul}$ (see also figure 28(a) in appendix A). The streamwise pressure strain terms
 $\varPi ^+_{ul}$ and
 $\varPi ^+_{us}$ are negative across the entire wall-normal domain in figure 3(a,b) (light green), while the wall-normal terms
 $\varPi ^+_{vl}$ and
 $\varPi ^+_{vs}$ in figure 3(c,d), and spanwise terms
 $\varPi ^+_{wl}$ and
 $\varPi ^+_{ws}$ in figure 3(e,f) are (mostly) positive, confirming that the pressure strain terms redistribute streamwise TKE to the wall-normal and spanwise components. The wall-normal pressure strain terms
 $\varPi ^+_{vl}$ and
 $\varPi ^+_{vs}$ are only negative below
 $y^+\approx 15$, a manifestation of the so-called ‘splat effect’ in which fluid moving towards the wall is forced to move parallel to the wall (e.g. Lee & Moser Reference Lee and Moser2019). Apart from the splat effect in
 $\varPi ^+_{vl}$, the large-scale pressure strain terms are more uniform across the wall-normal domain, while the small-scale pressure strain terms exhibit peaks closer to the wall. While the small-scale production and pressure strain terms are inhomogeneous near the wall, all terms in the small-scale energy balance equation are more homogeneous above
 $y^+\approx 60$ with minimal variation over
 $y^+$. The characteristics of turbulent production and pressure strain shown in figure 3 indicate that the velocity field decomposition (2.6) indeed captures the energy-containing eddies and SSPs at both large and small scales.
Turning to the turbulent transport terms (black), it appears that the wall-normal position of minimum  $T^+_{ul}$ and
 $T^+_{us}$ almost coincides with the wall-normal position of maximum
 $P^+_{ul}$ and
 $P^+_{us}$ in figure 3(a,b), indicating that turbulent transport removes energy at the same wall-normal locations where the generation of the energy-containing eddies at each scale is most active. At large scale, the turbulent transport terms are mostly negative above
 $y^+\approx 25$, except for the streamwise term which is close to zero (figure 3a,c,e). However, the streamwise and spanwise turbulent transport terms are positive very close to the wall in figure 3(a,e), consistent with the observations of previous studies of the turbulent transport spectra (e.g. Cho et al. Reference Cho, Hwang and Choi2018; Lee & Moser Reference Lee and Moser2019) (see also figure 28(c,e) in appendix A). It is also important to note that the peak in the streamwise turbulent transport term has similar magnitude to the large-scale production term
 $P^+_{ul}$. This positive streamwise and spanwise turbulent transport seems to be balanced by the corresponding dissipation and viscous transport terms, as has been shown in the case of turbulent Poiseuille flow at
 $Re_\tau \simeq 1700$ (Cho et al. Reference Cho, Hwang and Choi2018). At small scale, the turbulent transport terms for all three components are positive above
 $y^+\approx 30$ in figure 3(b,d,f). In particular, above
 $y^+\approx 60$, the streamwise turbulent transport term
 $T^+_{us}$ has similar magnitude to the (relatively weak) small-scale production term
 $P^+_{us}$ in figure 3(b), and the same can be said for the wall-normal and spanwise turbulent transport and pressure strain terms in figure 3(e,f). For all three small-scale components, the positive terms in the energy balance equations are primarily balanced by the corresponding dissipation terms (see also figure 28(c,d,e,f) in appendix A). The small-scale dissipation terms also exhibit greater magnitude than the large-scale counterparts, implying the cascade of energy through the turbulent transport terms.
As described in § 2.2, the turbulent transport terms (2.11c) and (2.12c) can be decomposed into the intra-scale spatial, inter-scale spatial and inter-scale turbulent transport terms in (2.13f), (2.14f) and (2.15), respectively. In particular, the inter-scale spatial and inter-scale turbulent transport terms depend on both large- and small-scale velocity components, and so they represent scale interaction processes. Further to the above analysis, the statistics of the intra-scale spatial turbulent transport terms (solid grey lines), inter-scale spatial turbulent transport terms (dash–dotted black lines) and inter-scale turbulent transport terms (solid black lines) at both large and small scales are shown in figure 4. The streamwise and spanwise inter-scale turbulent transport terms  $T^+_{u,\updownarrow }$ and
 $T^+_{w,\updownarrow }$ are negative at large scale and positive at small scale above
 $y^+\approx 25$ (figure 4a,b,e,f), while the wall-normal inter-scale turbulent transport term
 $T^+_{v,\updownarrow }$ is negative at large scale and positive at small scale across the wall-normal domain (figure 4c,d). This indicates that there is same-component energy transfer from large to small scales, i.e. from
 $u^+_l$ to
 $u^+_s, v^+_l$ to
 $v^+_s$, and
 $w^+_l$ to
 $w^+_s$, reaffirming the classical role of turbulent transport in the streamwise, wall-normal and spanwise energy cascades. Below
 $y^+\approx 25$ however, the streamwise and spanwise inter-scale turbulent transport terms
 $T^+_{u,\updownarrow }$ and
 $T^+_{w,\updownarrow }$ are negative at small scale and positive at large scale, with prominent troughs/peaks at
 $y^+\approx 12$ and
 $y^+\approx 10$, respectively (figure 4a,b,e,f). This indicates that there is same-component energy transfer from small to large scales very close to the wall, i.e. from
 $u^+_s$ to
 $u^+_l$ and
 $w^+_s$ to
 $w^+_l$. In particular, these observations are consistent with those of Cho et al. (Reference Cho, Hwang and Choi2018), who demonstrated that positive turbulent transport in the near-wall region is the manifestation of the transfer of energy from small to large scales.
Time-averaged, wall-normal profiles of the intra-scale spatial turbulent transport (solid grey lines), inter-scale spatial turbulent transport (dash–dotted black lines) and inter-scale turbulent transport (solid black lines) terms of (a)  $E^+_{ul}$ (
 $T^+_{ul,-},T^+_{ul,\#},-T^+_{u,\updownarrow }$), (b)
 $E^+_{us}$ (
 $T^+_{us,-},T^+_{us,\#},T^+_{u,\updownarrow }$), (c)
 $E^+_{vl}$ (
 $T^+_{vl,-},T^+_{vl,\#},-T^+_{v,\updownarrow }$), (d)
 $E^+_{vs}$ (
 $T^+_{vs,-},T^+_{vs,\#},T^+_{v,\updownarrow }$), (e)
 $E^+_{wl}$ (
 $T^+_{wl,-},T^+_{wl,\#},-T^+_{w,\updownarrow }$) and (f)
 $E^+_{ws}$ (
 $T^+_{ws,-},T^+_{ws,\#},T^+_{w,\updownarrow }$).

On the other hand, the intra-scale spatial turbulent transport terms represent the wall-normal transport of TKE resulting from the nonlinear self-interaction of structures of the same scale and their volume average is zero. The large-scale terms  $T^+_{ul,-}, T^+_{vl,-}$ and
 $T^+_{wl,-}$ are very weak in magnitude (figure 4a,c,e) but there are deep troughs in the small-scale streamwise and spanwise terms
 $T^+_{us,-}$ and
 $T^+_{ws,-}$ at
 $y^+=11$ and
 $y^+=8$, respectively (figure 4b,f). This is likely due to the velocity field decomposition in (2.6), in which the small-scale energy-containing eddies and the small-scale eddies associated with the energy cascade from both large and small integral length scales would be included in the definition of
 $\boldsymbol {u}_s^+$, and so the resulting intra-scale energy flux in the wall-normal direction is more pronounced. Furthermore, the small-scale intra-scale terms decay above
 $y^+\approx 45$ and the inter-scale terms are dominant above this point (figure 4b,d,f). Finally, the inter-scale spatial turbulent transport terms represent the wall-normal transport of TKE resulting from the interaction of structures of different scales and their volume average is also zero. It is apparent that the interaction of large- and small-scale structures can produce significant wall-normal energy fluxes, especially those of streamwise TKE (figure 4a,b), and the inter-scale spatial turbulent transport terms are highly sophisticated.
2.4. Temporal dynamics
Following the statistical analysis of the two-scale energetics in § 2.3, the temporal dynamics of minimal multi-scale near-wall turbulence can now be investigated. The terms in the large- and small-scale energy balance equations (2.16) are averaged in the wall-normal direction and studied as functions of time  $t^+$. However, given that some of the processes described in the previous section vary considerably across the wall-normal domain, the limits of integration in
 $y^+$ must be chosen carefully. In subsequent sections, the same notation is used to denote the
 $y^+$-averaged terms but the corresponding limits of integration are also indicated: for example,
 $T^+_{u,\updownarrow }|_{45}^{120}$ is the streamwise inter-scale turbulent transport term averaged over the interval
 $y^+\in [45,120]$, i.e. the streamwise energy cascade. In order to establish relationships between the various terms, the temporal cross-correlation function
 $C(\tau ^+)$ is introduced, where
 \begin{equation} C(\tau^+)=\frac{\overline{P^+_{ul}|_{0}^{120}(t^+{+}\tau^+) \epsilon^+_{ul}|_{0}^{120}(t^+)}}{\sqrt{\overline{(P^+_{ul}|_{0}^{120}(t^+))^2}} \sqrt{\overline{(\epsilon^+_{ul}|_{0}^{120}(t^+))^2}}},\end{equation}
for example, is the cross-correlation of large-scale turbulent production and streamwise dissipation as a function of the time lag  $\tau ^+$.
Given the scope of the present study, the properties of turbulent transport described in § 2.3 are examined under three general categories, with a particular emphasis on the inter-scale processes: (i) the energy cascade from large to small scales over the interval  $y^+\in [45,120]$, mediated by the inter-scale turbulent transport terms
 $T^+_{u,\updownarrow }|_{45}^{120}, T^+_{v,\updownarrow }|_{45}^{120}$ and
 $T^+_{w,\updownarrow }|_{45}^{120}$; (ii) the energy transfer from large to small scales over the interval
 $y^+\in [0,45]$ that results in increased small-scale turbulent production, mediated by the inter-scale turbulent transport term
 $T^+_{v,\updownarrow }|_{45}^{120}$; (iii) the energy transfer from small to large scales over the interval
 $y^+\in [0,25]$, mediated by the inter-scale turbulent transport terms
 $T^+_{u,\updownarrow }|_{5}^{25}$ and
 $T^+_{w,\updownarrow }|_{0}^{25}$. In particular, the second process will be called the ‘driving’ of small-scale turbulent production and the third process will be called the ‘feeding’ from small to large scales, to distinguish from the classical energy cascade from large to small scales.
Finally, it must be mentioned that the inter-scale turbulent transport terms  $T^+_{u,\updownarrow }, T^+_{v,\updownarrow }$ and
 $T^+_{w,\updownarrow }$ are derived from the horizontally averaged turbulent transport terms (2.11c) and (2.12c), in which the projections
 $\mathcal {P}_l\{\cdot \}$ and
 $\mathcal {P}_s\{\cdot \}$ can be dropped. However, in order to plot three-dimensional spatial visualisations of inter-scale turbulent transport, the terms
 \begin{gather} T^+_{us,c}={-}u_s^+\mathcal{P}_s\{\boldsymbol{u}^+_s\boldsymbol{\cdot} \boldsymbol{\nabla} u_l^+{+} \boldsymbol{u}^+_l\boldsymbol{\cdot} \boldsymbol{\nabla} u_s^+{+} \boldsymbol{u}^+_l\boldsymbol{\cdot} \boldsymbol{\nabla} u_l^+\}, \end{gather}
 \begin{gather}T^+_{vs,d}={-}v_s^+\mathcal{P}_s\{\boldsymbol{u}^+_s\boldsymbol{\cdot} \boldsymbol{\nabla} v_l^+\}, \end{gather}
 \begin{gather}T^+_{ul,f}={-}u_l^+\mathcal{P}_l\{\boldsymbol{u}^+_l\boldsymbol{\cdot} \boldsymbol{\nabla} u_s^+{+} \boldsymbol{u}^+_s\boldsymbol{\cdot} \boldsymbol{\nabla} u_l^+{+} \boldsymbol{u}^+_s\boldsymbol{\cdot} \boldsymbol{\nabla} u_s^+\} \end{gather}
are introduced as proxies for the transfer of streamwise TKE from large to small scales in § 4, the transfer of wall-normal TKE from large to small scales in § 5 and the transfer of streamwise TKE from small to large scales in § 6, respectively. In particular, it will be shown in § 5 that one component of the wall-normal inter-scale turbulent transport term is particularly relevant to the driving of small-scale turbulent production. For all other terms, the subscript  $_{\square }$ indicates that the corresponding observable is defined before the
 $\langle \cdot \rangle _{x^+,z^+}$ averaging operation for visualisation purposes, specifically the small-scale streamwise dissipation and turbulent production terms
 \begin{equation} \epsilon^+_{us,\square}={-}\boldsymbol{\nabla} u_s^+\boldsymbol{\cdot} \boldsymbol{\nabla} u_s^+ \quad \mathrm{and} \quad P^+_{us,\square}={-}U^+_{y^+}u_s^+v_s^+, \end{equation}
3. Self-sustaining processes
In this section, the dynamics of the large- and small-scale structures are studied separately, whereas the interactions between the two scales are discussed in subsequent sections. The decomposition of the velocity field into  $\boldsymbol {u}_l^+$ and
 $\boldsymbol {u}_s^+$ in (2.6) was introduced under the premise that there are energy-containing eddies at each scale, which is confirmed in the statistical analysis in § 2.3. Given that the SSP is understood to govern the dynamics at integral scales (Hwang & Bengana Reference Hwang and Bengana2016), here it will be briefly characterised at both large and small scales in order to establish its energy transfer dynamics. For this purpose, the velocity components are further decomposed into their
 $x^+$-independent and
 $x^+$-dependent parts, and the kinetic energies of large-scale straight streaks (ss), wavy streaks (ws), straight rolls (sr) and wavy rolls (wr) are defined as
 \begin{gather} E^+_{ss,l}(t^+)= \tfrac{1}{2}\langle \langle u_l^+ \rangle_{x^+}^2 \rangle_{z^+}|_{0}^{120}, \end{gather}
 \begin{gather}E^+_{ws,l}(t^+)= \tfrac{1}{2}\langle (u_l^+{-} \langle u_l^+ \rangle_{x^+})^2 \rangle_{x^+,z^+}|_{0}^{120}, \end{gather}
 \begin{gather}E^+_{sr,l}(t^+)= \tfrac{1}{2}\langle \langle v_l^+ \rangle_{x^+}^2 + \langle w_l^+ \rangle_{x^+}^2 \rangle_{z^+}|_{0}^{120}, \end{gather}
 \begin{gather}E^+_{wr,l}(t^+)= \tfrac{1}{2}\langle (v_l^+{-} \langle v_l^+ \rangle_{x^+})^2 + (w_l^+{-} \langle w_l^+ \rangle_{x^+})^2 \rangle_{x^+,z^+}|_{0}^{120}, \end{gather}
respectively, while the kinetic energies of small-scale straight streaks, wavy streaks, straight rolls and wavy rolls are defined as
 \begin{gather} E^+_{ss,s}(t^+)= \tfrac{1}{2}\langle \langle u_s^+ \rangle_{x^+}^2 \rangle_{z^+}|_{0}^{45}, \end{gather}
 \begin{gather}E^+_{ws,s}(t^+)= \tfrac{1}{2}\langle (u_s^+{-} \langle u_s^+ \rangle_{x^+})^2 \rangle_{x^+,z^+}|_{0}^{45}, \end{gather}
 \begin{gather}E^+_{sr,s}(t^+)= \tfrac{1}{2}\langle \langle v_s^+ \rangle_{x^+}^2 + \langle w_s^+ \rangle_{x^+}^2 \rangle_{z^+}|_{0}^{45}, \end{gather}
 \begin{gather}E^+_{wr,s}(t^+)= \tfrac{1}{2}\langle (v_s^+{-} \langle v_s^+ \rangle_{x^+})^2 + (w_s^+{-} \langle w_s^+ \rangle_{x^+})^2 \rangle_{x^+,z^+}|_{0}^{45}, \end{gather}
respectively. The small-scale kinetic energy terms are averaged over the interval  $y^+\in [0,45]$ in accordance with the turbulent production profile in figure 3(b) (red), since
 $P^+_{us}$ exhibits a large peak close to the wall. Descriptions of the observables associated with the large- and small-scale SSPs and their energetics are provided in table 3. Here, it should be noted that these observables are introduced to describe the dynamics of the structural elements of the SSP (e.g. streaks and rolls) and the corresponding energetics at each ‘integral’ length scale, i.e. large and small. In particular, at small scale, it is conveniently assumed that production and dissipation take place at the same scale (i.e.
 $\lambda _z^+\lesssim 110$), although in practice there is some separation between the two length scales (see figure 28(a,f) in appendix A).
Descriptions of the observables associated with the large- and small-scale SSPs.

The cross-correlation functions of a selection of the large- and small-scale kinetic energy terms are shown in figures 5(a) and 5(b), respectively. The correlations of straight rolls and straight streaks (brown), straight streaks and wavy streaks (orange), and wavy streaks and wavy rolls (purple) are left-shifted at both large and small scales, indicating that the observables occur in the order  $E^+_{sr,l} \rightarrow E^+_{ss,l} \rightarrow E^+_{ws,l} \rightarrow E^+_{wr,l}$ and
 $E^+_{sr,s} \rightarrow E^+_{ss,s} \rightarrow E^+_{ws,s} \rightarrow E^+_{wr,s}$, consistent with the SSP (Hamilton et al. Reference Hamilton, Kim and Waleffe1995; Hwang & Bengana Reference Hwang and Bengana2016). The large-scale kinetic energy terms remain correlated over longer time scales and have ‘wider’ cross-correlation functions, reflecting that the large-scale SSP is expected to occur over a longer time scale than its small-scale counterpart (Hwang & Bengana Reference Hwang and Bengana2016). To investigate the characteristic time scales of these subprocesses in more detail, the temporal auto-correlation functions of the large- and small-scale kinetic energy terms are shown in figures 5(c) and 5(d), respectively. At large scale, the straight roll
 $E^+_{sr,l}$ (brown) and straight streak
 $E^+_{ss,l}$ (orange) auto-correlations are wider than the wavy streak
 $E^+_{ws,l}$ (purple) and wavy roll
 $E^+_{wr,l}$ (pink) auto-correlations, indicating that the ‘straight’ subprocesses occur over a significantly longer time scale than the ‘wavy’ subprocesses. At small scale, the straight roll
 $E^+_{sr,s}$ (brown) and straight streak
 $E^+_{ss,s}$ (orange) auto-correlations are much narrower than those of the equivalent large-scale terms, indicating that the large-scale SSP is indeed active over longer time scales. However, it is immediately obvious that there is little separation between the time scales of the straight and wavy subprocesses at the small scale, and the auto-correlation function of the wavy rolls
 $E^+_{wr,s}$ (pink) actually matches that of the wavy rolls at the large scale. This somewhat unexpected behaviour, which is related to non-equilibrium turbulent dissipation, is further discussed in § 4.
Temporal cross-correlation functions of (a)  $E^+_{sr,l}$ vs.
 $E^+_{ss,l}$ (brown),
 $E^+_{ss,l}$ vs.
 $E^+_{ws,l}$ (orange) and
 $E^+_{ws,l}$ vs.
 $E^+_{wr,l}$ (purple), and (b)
 $E^+_{sr,s}$ vs.
 $E^+_{ss,s}$ (brown),
 $E^+_{ss,s}$ vs.
 $E^+_{ws,s}$ (orange) and
 $E^+_{ws,s}$ vs.
 $E^+_{wr,s}$ (purple). Temporal auto-correlation functions of (c)
 $E^+_{sr,l}$ (brown),
 $E^+_{ss,l}$ (orange),
 $E^+_{ws,l}$ (purple) and
 $E^+_{wr,l}$ (pink), and (d)
 $E^+_{sr,s}$ (brown),
 $E^+_{ss,s}$ (orange),
 $E^+_{ws,s}$ (purple) and
 $E^+_{wr,s}$ (pink).

Next, the temporal dynamics of the terms in the large- and small-scale energy balance equations (2.16) are investigated. Since this section is limited to the energetics of turbulence at each scale, only the turbulent production, pressure strain and turbulent dissipation terms are considered. The time series of turbulent production (red), streamwise pressure strain (green) and streamwise dissipation (blue) are shown in figure 6 at both (a) large and (b) small scales. Again, the large-scale terms are integrated over the interval  $y^+\in [0,120]$ and the small-scale terms over
 $y^+\in [0,45]$. The turbulent production terms
 $P^+_{ul}|_{0}^{120}$ and
 $P^+_{us}|_{0}^{45}$ fuel the SSPs at each scale by injecting energy into the streamwise velocity components. As expected, the streamwise pressure strain terms
 $\varPi ^+_{ul}|_{0}^{120}$ and
 $\varPi ^+_{us}|_{0}^{45}$ increase in magnitude in response to the production terms, redistributing streamwise TKE to the wall-normal and spanwise components at each scale. The same behaviour is observed in the streamwise dissipation terms
 $\epsilon _{ul}|_{0}^{120}$ and
 $\epsilon _{us}|_{0}^{45}$ at each scale. The small-scale production term
 $P^+_{us}|_{0}^{45}$ exhibits more rapid fluctuation in figure 6(b) than its large-scale counterpart
 $P^+_{ul}|_{0}^{120}$ in figure 6(a), consistent with the shorter characteristic time scales observed in the small-scale auto-correlation functions in figure 5(d).
Time series of (a)  $P^+_{ul}|_{0}^{120}$ (red),
 $\varPi ^+_{ul}|_{0}^{120}$ (green) and
 $\epsilon ^+_{ul}|_{0}^{120}$ (blue), and (b)
 $P^+_{us}|_{0}^{45}$ (red),
 $\varPi ^+_{us}|_{0}^{45}$ (green) and
 $\epsilon ^+_{us}|_{0}^{45}$ (blue).

However, it is the timing of the turbulent energetics in relation to the SSP at each scale that is of most interest, requiring cross-correlation with the kinetic energy terms defined in (3.1) and (3.2) above. The cross-correlation functions of large-scale production  $P^+_{ul}|_{0}^{120}$ versus straight streaks
 $E^+_{ss,l}$ (red) and large-scale wavy streaks
 $E^+_{ws,l}$ versus streamwise dissipation
 $-\epsilon ^+_{ul}|_{0}^{120}$ (blue) are shown in figure 7(a). Note that the sign of the dissipation term (and subsequent dissipation terms) has been flipped, representing an increase in dissipation in this case. The positively correlated left-shifted peaks indicate that large-scale production drives the growth of straight streaks in line with the lift-up effect (red), while the large-scale streamwise dissipation reaches its maximum just after the kinetic energy of wavy streaks (blue). The equivalent small-scale observables occur in the same order within the small-scale SSP as those at large scale, as seen in figure 7(b). However, the cross-correlation function of small-scale production
 $P^+_{us}|_{0}^{45}$ versus straight streaks
 $E^+_{ss,s}$ (red) has noticeably lower magnitude than its large-scale equivalent in figure 7(a), the precise reasons for which are discussed in § 5. The cross-correlation functions of large-scale wavy streaks
 $E^+_{ws,l}$ versus streamwise pressure strain
 $-\varPi ^+_{ul}|_{0}^{120}$ (green) and small-scale wavy streaks
 $E^+_{ws,s}$ versus streamwise pressure strain
 $-\varPi ^+_{us}|_{0}^{45}$ (green) are shown in figures 7(c) and 7(d), respectively. Note that the signs of the streamwise pressure strain terms have also been flipped, representing increased redistribution of energy to the wall-normal and spanwise components in this case. Both correlation functions peak at
 $\tau ^+\approx 0$, indicating that streamwise pressure strain and the kinetic energy of wavy streaks increase/decrease simultaneously, consistent with the dependence of
 $\varPi ^+_{ul}$ and
 $\varPi ^+_{us}$ on
 $(u_l^+)_{x^+}$ and
 $(u_s^+)_{x^+}$, respectively (see appendix B). The cross-correlation functions of large-scale wavy rolls
 $E^+_{wr,l}$ versus wall-normal and spanwise dissipation
 $-\epsilon ^+_{vl}|_{0}^{120}-\epsilon ^+_{wl}|_{0}^{120}$ (blue) and small-scale wavy rolls
 $E^+_{wr,s}$ versus wall-normal and spanwise dissipation
 $-\epsilon ^+_{vs}|_{0}^{45}-\epsilon ^+_{ws}|_{0}^{45}$ (blue) are also shown in figures 7(c) and 7(d), respectively. The left-shifted peaks indicate that wall-normal and spanwise dissipation occurs just after the kinetic energy of wavy rolls at each scale, in the late stages of streak breakdown. The timing of each of the above terms is shown in the schematic diagram in figure 8.
Temporal cross-correlation functions of (a)  $P^+_{ul}|_{0}^{120}$ vs.
 $E^+_{ss,l}$ (red) and
 $E^+_{ws,l}$ vs.
 $-\epsilon ^+_{ul}|_{0}^{120}$ (blue), (b)
 $P^+_{us}|_{0}^{45}$ vs.
 $E^+_{ss,s}$ (red) and
 $E^+_{ws,s}$ vs.
 $-\epsilon ^+_{us}|_{0}^{45}$ (blue), (c)
 $E^+_{ws,l}$ vs.
 $-\varPi ^+_{ul}|_{0}^{120}$ (green) and
 $E^+_{wr,l}$ vs.
 $-\epsilon ^+_{vl}|_{0}^{120}-\epsilon ^+_{wl}|_{0}^{120}$ (blue), and (d)
 $E^+_{ws,s}$ vs.
 $-\varPi ^+_{us}|_{0}^{45}$ (green) and
 $E^+_{wr,s}$ vs.
 $-\epsilon ^+_{vs}|_{0}^{45}-\epsilon ^+_{ws}|_{0}^{45}$ (blue).

Schematic diagram of the large- and small-scale SSPs.

4. Energy cascade dynamics
In the statistical analysis of the two-scale energetics in § 2.3, the first scale interaction process identified is the cascade of energy from large to small scales (figure 4), given their definition in (2.6). This manifests as negative inter-scale turbulent transport at large scale (figure 4a,c,e) and positive inter-scale turbulent transport at small scale (figure 4b,d,f) above  $y^+\approx 25$ in the streamwise and spanwise terms, and across the wall-normal domain in the wall-normal term (see also figure 28(c–e) in appendix A). The inter-scale turbulent transport terms
 $T^+_{u,\updownarrow }, T^+_{v,\updownarrow }$ and
 $T^+_{w,\updownarrow }$ are subsequently averaged over the interval
 $y^+\in [45,120]$ in order to study the temporal dynamics of the energy cascade and descriptions of the associated observables are provided in table 4. In this study, the small-scale eddies associated with the energy cascade are called ‘detached’ eddies, as opposed to the energy-containing eddies that are attached to the wall (Townsend Reference Townsend1980).
Descriptions of the observables associated with the energy cascade from large to small scales.

The time series of the streamwise, wall-normal and spanwise inter-scale turbulent transport terms  $T^+_{u,\updownarrow }|_{45}^{120}, T^+_{v,\updownarrow }|_{45}^{120}$ and
 $T^+_{w,\updownarrow }|_{45}^{120}$ are shown in figures 9(a)–9(c), respectively (black), along with the corresponding small-scale detached-eddy dissipation terms
 $\epsilon ^+_{us}|_{45}^{120}, \epsilon ^+_{vs}|_{45}^{120}$ and
 $\epsilon ^+_{ws}|_{45}^{120}$ (blue). It is immediately obvious that the small-scale dissipation terms increase in magnitude in response to the corresponding turbulent transport terms, which is the expected behaviour of the energy cascade. Given that the inter-scale turbulent transport terms are sinks in the large-scale energy balance (figure 4a,c,e), it is of interest to relate
 $T^+_{u,\updownarrow }|_{45}^{120}, T^+_{v,\updownarrow }|_{45}^{120}$ and
 $T^+_{w,\updownarrow }|_{45}^{120}$ to the energy sources at large scale. The large-scale turbulent production term
 $P^+_{ul}|_{0}^{120}$ (red), and the wall-normal and spanwise pressure strain terms
 $\varPi ^+_{vl}|_{0}^{120}$ and
 $\varPi ^+_{wl}|_{0}^{120}$ (green) are also plotted in figures 9(a)–9(c), respectively, since these are the primary energy sources for the large-scale streamwise, wall-normal and spanwise velocity components. In figure 9(a), the streamwise inter-scale turbulent transport
 $T^+_{u,\updownarrow }|_{45}^{120}$ appears to increase in response to large-scale turbulent production
 $P^+_{ul}|_{0}^{120}$, resulting in the transfer of streamwise TKE from large to small scales. The same behaviour is observed in
 $T^+_{v,\updownarrow }|_{45}^{120}$ and
 $T^+_{w,\updownarrow }|_{45}^{120}$ in response to
 $\varPi ^+_{vl}|_{0}^{120}$ and
 $\varPi ^+_{wl}|_{0}^{120}$, respectively, in figure 9(b,c). However, as seen in § 3, the large-scale turbulent production and pressure strain terms are intimately linked to the large-scale SSP; hence, the relationship between the energy cascade and the large-scale SSP requires further investigation.
Time series of (a)  $P^+_{ul}|_{0}^{120}$ (red),
 $T^+_{u,\updownarrow }|_{45}^{120}$ (black) and
 $\epsilon ^+_{us}|_{45}^{120}$ (blue), (b)
 $\varPi ^+_{vl}|_{0}^{120}$ (green),
 $T^+_{v,\updownarrow }|_{45}^{120}$ (black) and
 $\epsilon ^+_{vs}|_{45}^{120}$ (blue), and (c)
 $\varPi ^+_{wl}|_{0}^{120}$ (green),
 $T^+_{w,\updownarrow }|_{45}^{120}$ (black) and
 $\epsilon ^+_{ws}|_{45}^{120}$ (blue).

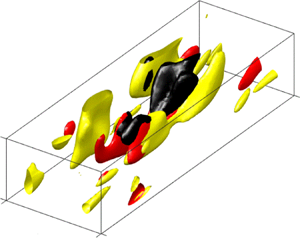
In order to investigate the spatio-temporal dynamics of the energy cascade, an intense streamwise TKE cascade event is identified in the time series in figure 9(a) (grey box) and snapshots of the velocity field during this event are shown in figure 10. The magnification of figure 9(a) for  $t^+\in [3530,3780]$ is shown in figure 10(a). A peak in large-scale turbulent production (red) appears to result in a large increase in streamwise inter-scale turbulent transport (black) and a subsequent increase in the magnitude of small-scale streamwise detached-eddy dissipation (blue). Figure 10(b–f) are snapshots of the velocity field at times
 $t^+= 3573$, 3622, 3650, 3666 and 3683, respectively, indicated by the dots in (a). The isosurfaces of high- and low-speed large-scale streaks
 $u_l^+=\pm 3.1$ are shown in pink and cyan, respectively, along with small-scale streamwise turbulent transport
 $T^+_{us,f}=0.24$ in black and small-scale streamwise dissipation
 $\epsilon ^+_{us,\square }=-0.05$ in blue. Note that the wall-normal range is
 $y^+\in [45,120]$. Well before the cascade event, at
 $t^+= 3573$ (figure 10b), the large-scale streaks are not particularly prominent and the velocity field exhibits some weak turbulent transport and detached-eddy dissipation, the isosurfaces of which appear to be isotropic in shape. By
 $t^+= 3622$ (figure 10c), the peak in turbulent production has fuelled the growth of the large-scale streaks, which are elongated in shape (see § 3). At this point, the isosurfaces of turbulent transport have begun to increase in size but appear to form alongside the low-speed streak only (cyan). The turbulent transport reaches its maximum around
 $t^+= 3650$ (figure 10d), when the large-scale streaks appear to meander in the streamwise direction, i.e. the streak instability stage of the SSP. The turbulent transport isosurfaces precede the formation of the detached-eddy dissipation isosurfaces, which have increased considerably in size, and both appear to be very closely entwined. At the later times
 $t^+= 3666$ and 3683 (figure 10e,f), there is a substantial increase in the magnitude of dissipation during the late stages of large-scale streak breakdown and the velocity field is dominated by the dissipation of the detached eddies. Throughout this event, the isosurfaces of turbulent transport and dissipation remain aligned with the low-speed streak rather than the high-speed streak.
Streamwise energy cascade: (a) magnification of figure 9(a) for  $t^+\in [3530,3780]$; (b,c,d,e,f) isosurfaces of
 $u_l^+=\pm 3.1$ (pink/cyan),
 $T^+_{us,c}=0.24$ (black) and
 $\epsilon ^+_{us,\square }=-0.05$ (blue) at
 $t^+= 3573$, 3622, 3650, 3666 and 3683, respectively.

In figure 9, it was shown that streamwise, wall-normal and spanwise inter-scale turbulent transport increases in response to large-scale turbulent production, wall-normal pressure strain and spanwise pressure strain, respectively. Furthermore, the streamwise TKE cascade observed in figure 10 reached its maximum as the large-scale streaks began to meander in the streamwise direction. This suggests that the energy cascade is related to the large-scale SSP and its streak instability stage in particular. To investigate the precise timing of the cascade of energy from large to small scales, the temporal cross-correlation functions of the inter-scale turbulent transport terms  $T^+_{u,\updownarrow }|_{45}^{120}, T^+_{v,\updownarrow }|_{45}^{120}$ and
 $T^+_{w,\updownarrow }|_{45}^{120}$ with the large-scale kinetic energy terms in (3.1) are analysed. The cross-correlation functions of large-scale turbulent production
 $P^+_{ul}|_{0}^{120}$ versus
 $T^+_{u,\updownarrow }|_{45}^{120}$ (red) and the kinetic energy of wavy streaks
 $E^+_{ws,l}$ versus
 $T^+_{u,\updownarrow }|_{45}^{120}$ (purple) are shown in figure 11(a). Both correlations are very clearly left-shifted, indicating that streamwise inter-scale turbulent transport increases just after the kinetic energy of large-scale wavy streaks, i.e. as the streaks begin to meander due to instability and/or transient growth. The cross-correlation functions of the kinetic energy of wavy streaks
 $E^+_{ws,l}$ versus
 $T^+_{v,\updownarrow }|_{45}^{120}$ (purple) and large-scale wall-normal pressure strain
 $\varPi ^+_{vl}|_{0}^{120}$ versus
 $T^+_{v,\updownarrow }|_{45}^{120}$ (green) are shown in figure 11(b). Both of these correlations are also left-shifted, indicating that wall-normal inter-scale turbulent transport increases in response to the kinetic energy of large-scale wavy streaks and wall-normal pressure strain (the timing of which was studied in § 3), again during the streak instability stage of the large-scale SSP. A similar picture emerges for the spanwise energy cascade. The cross-correlation functions of large-scale spanwise pressure strain
 $\varPi ^+_{wl}|_{0}^{120}$ versus
 $T^+_{w,\updownarrow }|_{45}^{120}$ (green) and the kinetic energy of wavy rolls
 $E^+_{wr,l}$ versus
 $T^+_{w,\updownarrow }|_{45}^{120}$ (pink) are shown in figure 11(c), and their left-shifted peaks indicate that spanwise inter-scale turbulent transport increases in response to the kinetic energy of wavy rolls during the late stages of large-scale streak breakdown. In any case, it is clear that the cascade of energy from large to small scales fluctuates in line with the large-scale SSP. It is also important to note that the timing of this energy transfer does not seem to depend on the small-scale self-staining process, even though the inter-scale turbulent transport terms
 $T^+_{u,\updownarrow }, T^+_{v,\updownarrow }$ and
 $T^+_{w,\updownarrow }$ in (2.15) depend on both the large- and small-scale velocity components, and their dynamics show no correlation. However, the small-scale energy-containing eddies are concentrated below
 $y^+\approx 45$ (figure 3a); hence, it seems that only the large-scale SSP determines the timing of the energy cascade above
 $y^+\approx 45$.
Temporal cross-correlation functions of (a)  $P^+_{ul}|_{0}^{120}$ vs.
 $T^+_{u,\updownarrow }|_{45}^{120}$ (red) and
 $E^+_{ws,l}$ vs.
 $T^+_{u,\updownarrow }|_{45}^{120}$ (purple), (b)
 $E^+_{ws,l}$ vs.
 $T^+_{v,\updownarrow }|_{45}^{120}$ (purple) and
 $\varPi ^+_{vl}|_{0}^{120}$ vs.
 $T^+_{v,\updownarrow }|_{45}^{120}$ (green), and (c)
 $\varPi ^+_{wl}|_{0}^{120}$ vs.
 $T^+_{w,\updownarrow }|_{45}^{120}$ (green) and
 $E^+_{wr,l}$ vs.
 $T^+_{w,\updownarrow }|_{45}^{120}$ (pink).

Given this regular transfer of energy from large to small scales, it is next of interest to see how this affects the small-scale energy balance. As seen in figure 9, the small-scale detached-eddy dissipation terms  $\epsilon ^+_{us}|_{45}^{120}, \epsilon ^+_{vs}|_{45}^{120}$ and
 $\epsilon ^+_{ws}|_{45}^{120}$ appear to increase in magnitude in response to the corresponding inter-scale turbulent transport terms, and this balance has also been observed in the small-scale statistics in figure 3(b,d,f). However, the temporal dynamics of this response must be investigated. The temporal cross-correlation function of streamwise inter-scale turbulent transport
 $T^+_{u,\updownarrow }|_{45}^{120}$ versus streamwise detached-eddy pressure strain
 $-\varPi ^+_{us}|_{45}^{120}$ is shown in figure 12(a) (green). Note that the sign of the streamwise pressure strain term has been flipped. The correlation shows a moderate left-shifted peak, indicating that the energy transfer to the streamwise component
 $u_s^+$ results in increased redistribution of energy to the wall-normal and spanwise components
 $v_s^+$ and
 $w_s^+$. The cross-correlation functions of streamwise inter-scale turbulent transport
 $T^+_{u,\updownarrow }|_{45}^{120}$ versus detached-eddy dissipation
 $-\epsilon ^+_{us}|_{45}^{120}$, wall-normal inter-scale turbulent transport
 $T^+_{v,\updownarrow }|_{45}^{120}$ versus detached-eddy dissipation
 $-\epsilon ^+_{vs}|_{45}^{120}$ and spanwise inter-scale turbulent transport
 $T^+_{w,\updownarrow }|_{45}^{120}$ versus detached-eddy dissipation
 $-\epsilon ^+_{ws}|_{45}^{120}$ are also shown in figures 12(a)–12(c), respectively (blue). Note that the signs of the small-scale dissipation terms have also been flipped, representing an increase in magnitude of the dissipation. In each case, the correlation functions are left-shifted, indicating that the cascade of energy from large to small scales indeed results in increased small-scale detached-eddy dissipation for each velocity component.
Temporal cross-correlation functions of (a)  $T^+_{u,\updownarrow }|_{45}^{120}$ vs.
 $-\varPi ^+_{us}|_{45}^{120}$ (green) and
 $T^+_{u,\updownarrow }|_{45}^{120}$ vs.
 $-\epsilon ^+_{us}|_{45}^{120}$ (blue), (b)
 $T^+_{v,\updownarrow }|_{45}^{120}$ vs.
 $-\epsilon ^+_{vs}|_{45}^{120}$ (blue) and (c)
 $T^+_{w,\updownarrow }|_{45}^{120}$ vs.
 $-\epsilon ^+_{ws}|_{45}^{120}$ (blue).

However, it is the widths of the cross-correlation functions in figure 12 that are most noteworthy. Although all of the plotted correlations are between terms in the small-scale energy balance equations, the long characteristic time scales observed are more reminiscent of those of the large-scale structures. In order to investigate this further, the temporal auto-correlation functions of various terms related to the large- and small-scale SSPs are plotted in figure 13. The auto-correlation functions of large- and small-scale turbulent production  $P^+_{ul}|_{0}^{120}$ and
 $P^+_{us}|_{0}^{45}$ are shown in figure 13(a,d) (solid red lines), large- and small-scale streamwise dissipation
 $\epsilon ^+_{ul}|_{0}^{120}$ and
 $\epsilon ^+_{us}|_{0}^{45}$ are shown in figure 13(b,e) (solid blue lines), and large- and small-scale wall-normal and spanwise dissipation
 $\epsilon ^+_{vl}|_{0}^{120}+\epsilon ^+_{wl}|_{0}^{120}$ and
 $\epsilon ^+_{vs}|_{0}^{45}+\epsilon ^+_{ws}|_{0}^{45}$ are shown in figure 13(c,f) (solid blue lines). It is immediately obvious that the characteristic time scales of production and dissipation of the large-scale SSP (figure 13a–c) are considerably longer than those of the small-scale SSP (figure 13d–f), consistent with the results of § 3 (figure 5). However, the small-scale energy-containing eddies are concentrated close to the wall
 $y^+\leq 45$, while the analysis of the energy cascade in this section has focused on the interval
 $y^+\in [45,120]$. For reference, the auto-correlation functions of small-scale detached-eddy dissipation over the interval
 $y^+\in [45,120]$ are also plotted; the streamwise dissipation
 $\epsilon ^+_{us}|_{45}^{120}$ in figure 13(e) (dotted blue line) and the wall-normal and spanwise dissipation
 $\epsilon ^+_{vs}|_{45}^{120}+\epsilon ^+_{ws}|_{45}^{120}$ in figure 13(f) (dotted blue line). It turns out that the characteristic time scales of detached-eddy dissipation in figure 13(e,f) (dotted blue lines) actually match those of the large-scale SSP in figure 13(b,c) (solid blue lines), which are considerably longer than those of the small-scale SSP in figure 13(e,f) (solid blue lines). The small-scale detached eddies in the interval
 $y^+\in [45,120]$ inherit the dissipation time scales of the large-scale SSP, consistent with the previous observation that the instantaneous dissipation rate depends on the integral length scale and velocity scale of the system (Goto & Vassilicos Reference Goto and Vassilicos2015), i.e. non-equilibrium turbulent dissipation. These observations would also explain the long time scales of small-scale wavy streaks and rolls in figure 5(d). As mentioned in § 2.3, both the small-scale energy-containing eddies and detached eddies would be included in the definition of
 $\boldsymbol {u}_s^+$ in (2.6), especially over the interval
 $y^+\in [0,45]$. The eddies associated with the energy cascade are mostly isotropic and rounded rather than elongated in shape (Kolmogorov Reference Kolmogorov1941). Therefore, the detached eddies would contribute to the kinetic energy of small-scale wavy streaks
 $E^+_{ws,s}$ and wavy rolls
 $E^+_{wr,s}$, and would thus be expected to inherit the time scales of the large-scale SSP, as is the case over the interval
 $y^+\in [45,120]$ (figure 13).
Temporal auto-correlation functions of (a)  $P^+_{ul}|_{0}^{120}$ (red), (b)
 $\epsilon ^+_{ul}|_{0}^{120}$ (blue), (c)
 $\epsilon ^+_{vl}|_{0}^{120}+\epsilon ^+_{wl}|_{0}^{120}$ (blue), (d)
 $P^+_{us}|_{0}^{45}$ (red), (e)
 $\epsilon ^+_{us}|_{0}^{45}$ (solid blue line) and
 $\epsilon ^+_{us}|_{45}^{120}$ (dotted blue line), and (f)
 $\epsilon ^+_{vs}|_{0}^{45}+\epsilon ^+_{ws}|_{0}^{45}$ (solid blue line) and
 $\epsilon ^+_{vs}|_{45}^{120}+\epsilon ^+_{ws}|_{45}^{120}$ (dotted blue line).

5. Driving of small-scale turbulent production
The analysis of the energy cascade in § 4 was based on the wall-normal interval  $y^+\in [45,120]$, across which the small-scale energy-containing eddies are largely absent (figure 3b). However, the transfer of energy from large to small scales extends much closer to the wall, with negative inter-scale turbulent transport at large scale and positive inter-scale turbulent transport at small scale across the wall-normal domain for the wall-normal term in particular (figure 4c,d). The question as to whether this energy transfer affects the small-scale energy-containing eddies is now investigated. Having established that the cascade of energy from large to small scales results in increased small-scale dissipation and pressure strain (figure 12), the only appropriate measure of its (possible) effect on the small-scale energy-containing eddies in particular is turbulent production. For this purpose, the wall-normal inter-scale turbulent transport term
 $T^+_{v,\updownarrow }$ and the small-scale turbulent production term
 $P^+_{us}$ are subsequently averaged over the interval
 $y^+\in [0,45]$ in order to study their temporal dynamics. The temporal cross-correlation function of
 $T^+_{v,\updownarrow }|_{0}^{45}$ versus
 $P^+_{us}|_{0}^{45}$ is shown in figure 14(a). The left-shifted peak indicates that small-scale turbulent production indeed increases in response to wall-normal inter-scale turbulent transport, confirming the existence of a new scale interaction process that energises the small-scale energy-containing eddies. However, there is no observed increase in small-scale turbulent production in response to positive streamwise inter-scale turbulent transport, even though
 $P^+_{us}$ also depends on
 $u_s^+$. Given its definition in (2.15), it is of interest to see which of the components of
 $T^+_{v,\updownarrow }$ has the greatest effect on
 $P^+_{us}$. Therefore,
 $T^+_{v,\updownarrow }$ is further decomposed into the terms
 \begin{equation} T^+_{v,\updownarrow d}={-}\langle v_s^+(\boldsymbol{u}^+_s\boldsymbol{\cdot} \boldsymbol{\nabla} v_l^+) \rangle_{x^+,z^+} \quad \mathrm{and} \quad T^+_{v,\updownarrow e}=\langle v_l^+(\boldsymbol{u}^+_l\boldsymbol{\cdot} \boldsymbol{\nabla} v_s^+)\rangle_{x^+,z^+},\end{equation}
which are also averaged over the interval  $y^+\in [0,45]$. It turns out that only
 $T^+_{v,\updownarrow d}$ seems to contribute to the increase in small-scale turbulent production and the cross-correlation function of
 $T^+_{v,\updownarrow d}|_{0}^{45}$ versus
 $P^+_{us}|_{0}^{45}$ is shown in figure 14(b), which exhibits a larger left-shifted peak. This may not be particularly surprising since one of the subcomponents of
 $T^+_{v,\updownarrow d}$ itself is directly proportional to the small-scale Reynolds stress
 $-u_s^+v_s^+$. Furthermore, the time series of
 $T^+_{v,\updownarrow d}|_{0}^{45}$ (solid black line) compared with the full wall-normal inter-scale turbulent transport term
 $T^+_{v,\updownarrow }|_{0}^{45}$ (dash–dotted black line) is plotted in figure 14(c) and the close overlap suggests that
 $T^+_{v,\updownarrow d}$ is also the dominant component of
 $T^+_{v,\updownarrow }$. In this work, the increase in small-scale production
 $P^+_{us}$ in response to the wall-normal turbulent transport term
 $T^+_{v,\updownarrow d}$ will be called the ‘driving’ of small-scale turbulent production and its dynamics is discussed in this section.
Temporal cross-correlation functions of (a)  $T^+_{v,\updownarrow }|_{0}^{45}$ vs.
 $P^+_{us}|_{0}^{45}$ (red) and (b)
 $T^+_{v,\updownarrow d}|_{0}^{45}$ vs.
 $P^+_{us}|_{0}^{45}$ (red), and (c) time series of
 $T^+_{v,\updownarrow }|_{0}^{45}$ (dash–dotted black line) and
 $T^+_{v,\updownarrow d}|_{0}^{45}$ (solid black line).

The time series of the wall-normal turbulent transport term  $T^+_{v,\updownarrow d}|_{0}^{45}$ (black) and small-scale turbulent production
 $10^{-1}P^+_{us}|_{0}^{45}$ (red) are shown in figure 15. It is immediately obvious that the two are well correlated, albeit with a time lag, as seen previously in figure 14(b). As mentioned in § 4, wall-normal inter-scale turbulent transport is a sink in the large-scale energy balance (figure 4c); hence,
 $T^+_{v,\updownarrow d}|_{0}^{45}$ should be related to the wall-normal energy source, i.e. pressure strain. The time series of the large-scale wall-normal pressure strain term
 $\varPi ^+_{vl}|_{0}^{120}$ (green) is also plotted in figure 15 and its fluctuation appears to stimulate that of
 $T^+_{v,\updownarrow d}|_{0}^{45}$, as in the case of the energy cascade across the interval
 $y^+\in [45,120]$ (figure 11).
Time series of  $\varPi ^+_{vl}|_{0}^{120}$ (green),
 $T^+_{v,\updownarrow d}|_{0}^{45}$ (black) and
 $10^{-1}P^+_{us}|_{0}^{45}$ (red).

In order to study the process in more detail, a driving event is identified in the time series in figure 15 (grey box) and snapshots of the velocity field during this event are shown in figure 16. The magnification of figure 15 for  $t^+\in [8320,8520]$ is shown in figure 16(a). A peak in large-scale wall-normal pressure strain (green) appears to result in a large increase in wall-normal inter-scale turbulent transport (black) and a subsequent increase in small-scale turbulent production (red). Figure 16(b–f) are snapshots of the velocity field at times
 $t^+= 8417$, 8439, 8450, 8456 and 8467, respectively, indicated by the dots in (a). The isosurfaces of small-scale wall-normal turbulent transport
 $T^+_{vs,d}=0.18$ are shown in black, small-scale turbulent production
 $P^+_{us,\square }=0.88$ in red and small-scale streamwise velocity
 $u_s^+=2.3$ in yellow. Note that the wall-normal range is
 $y^+\in [0,45]$. Before the driving event, at
 $t^+= 8417$ (figure 16b), the velocity field features weak small-scale streamwise velocity fluctuations and very small production isosurfaces. Though it is largely absent in figure 16(b), there is a substantial increase in turbulent transport by
 $t^+= 8439$ (figure 16c), fuelled by the large-scale wall-normal pressure strain. The turbulent transport isosurfaces are localised in both the streamwise and spanwise directions and this behaviour persists for the duration of the driving event. The turbulent transport reaches its maximum at
 $t^+= 8450$ (figure 16d) and by this time, there has been a noticeable increase in small-scale production. In particular, the turbulent transport isosurfaces precede the growth of the production isosurfaces, which drive the growth of the small-scale streamwise velocity fluctuations alongside them. At the later time
 $t^+= 8456$ (figure 16e), there has been a further increase in production and the streamwise velocity fluctuations have increased substantially in size, and by
 $t^+= 8467$ (figure 16f), the production has reached its peak. At the end of the driving event, the small-scale streamwise velocity fluctuations have been reinvigorated, although they appear to be more localised in space rather than elongated in the streamwise direction.
Driving: (a) magnification of figure 15 for  $t^+\in [8320,8520]$; (b,c,d,e,f) isosurfaces of
 $T^+_{vs,d}=0.18$ (black),
 $P^+_{us,\square }=0.88$ (red) and
 $u_s^+=2.3$ (yellow) at
 $t^+= 8417$, 8439, 8450, 8456 and 8467, respectively.

In contrast with the streamwise TKE cascade event observed in figure 10, in which turbulent transport from large to small scales occurs all along the low-speed streak, the driving event in figure 16 is highly localised. The isosurfaces of wall-normal turbulent transport only form around the spanwise centreline at  $z^+=110$, although they appear to stretch in the streamwise direction as time progresses. The turbulent production isosurfaces form beneath the turbulent transport isosurfaces, which are subsequently encircled by the streamwise velocity fluctuations. To investigate the spatio-temporal dynamics of the driving process in more detail, the isocontours of small-scale wall-normal turbulent transport
 $T^+_{vs,d}\geq 0.21$ (black), small-scale wall-normal velocity
 $v_s^+\leq -1.20$ (cyan) and small-scale turbulent production
 $P^+_{us,\square }\geq 1.10$ (red) at the spanwise centreline
 $z^+=110$ during the driving event are plotted in figure 17(a), corresponding to figure 16(c–e). It is apparent that the isocontours of turbulent transport and the resulting isocontours of wall-normal velocity tilt in the downstream direction at later times, likely due to the effect of the mean shear. Furthermore, the corresponding production isocontours are largest at time
 $t^+= 8439$, when the turbulent transport and wall-normal velocity isocontours are upright, but they begin to decay at later times
 $t^+= 8450$ and 8456 as the inclination angle of the wall-normal velocity isocontours decreases. This is remarkably similar to the Orr mechanism of transient growth (Orr Reference Orr1907), i.e. the transient amplification of energy caused by the sign of the Reynolds shear stress changing from negative to positive during the downstream tilting of a given flow structure by the mean shear, the role of which in wall-bounded turbulence has been highlighted recently (Encinar & Jiménez Reference Encinar and Jiménez2020). In this case, it appears that there is amplification of the streamwise velocity component by wall-normal turbulent transport from large to small scales, as opposed to the amplification of the wall-normal velocity component, since it has also been theorised that the Orr mechanism is responsible for the regeneration of streamwise vortices in the SSP (Jiménez Reference Jiménez2013, Reference Jiménez2015).
Driving: (a) isocontours of  $T^+_{vs,d}\geq 0.21$ (black),
 $v_s^+\leq -1.20$ (cyan) and
 $P^+_{us,\square }\geq 1.10$ (red) at
 $z^+=110$ during the driving event in figure 16; temporal cross-correlation functions of (b)
 $T^+_{v,\updownarrow d}|_{0}^{45}$ vs.
 $E^+_{wr,s}$ (pink) and
 $T^+_{v,\updownarrow d}|_{0}^{45}$ vs.
 $E^+_{ws,s}$ (purple), and (c)
 $T^+_{v,\updownarrow d}|_{0}^{45}$ vs.
 $E^+_{sr,s}$ (brown) and
 $T^+_{v,\updownarrow d}|_{0}^{45}$ vs.
 $E^+_{ss,s}$ (orange).

However, the Orr mechanism leads to transient not indefinite growth and the turbulent production isocontours in figure 17(a) decay again. Therefore, the precise effect of the driving process on the small-scale energy-containing eddies must now be investigated. The temporal dynamics of isolated energy-containing eddies at a single integral length scale are governed by the SSP (Hamilton et al. Reference Hamilton, Kim and Waleffe1995; Hwang & Bengana Reference Hwang and Bengana2016), which has also been observed at both large and small scales in the present two-scale interaction system (figure 5). In particular, the structural elements of the small-scale SSP are described by the kinetic energy terms in (3.2). However, the localised wall-normal and streamwise velocity fluctuations generated during the driving event in figure 16 would also contribute to the kinetic energy of small-scale wavy rolls  $E^+_{wr,s}$ and wavy streaks
 $E^+_{ws,s}$, respectively, and so care is needed in their interpretation. The temporal cross-correlation functions of the wall-normal turbulent transport term
 $T^+_{v,\updownarrow d}|_{0}^{45}$ versus
 $E^+_{wr,s}$ (pink) and
 $T^+_{v,\updownarrow d}|_{0}^{45}$ versus
 $E^+_{ws,s}$ (purple) are shown in figure 17(b). The left-shifted peaks indicate that wall-normal turbulent transport from large to small scales is largely in the form of localised wall-normal velocity fluctuations and the time lag suggests that these subsequently generate localised streamwise velocity fluctuations through small-scale turbulent production, consistent with the notion of the Orr mechanism. It is unclear as to whether these highly localised wall-normal and streamwise velocity fluctuations are related to the wavy rolls and wavy streaks of the small-scale SSP, especially given that the order of appearance is reversed. The effect of the driving process on the small-scale SSP would therefore be better measured by the response of the kinetic energy of small-scale straight rolls
 $E^+_{sr,s}$ and straight streaks
 $E^+_{ss,s}$. The temporal cross-correlation functions of
 $T^+_{v,\updownarrow d}|_{0}^{45}$ versus
 $E^+_{sr,s}$ (brown) and
 $T^+_{v,\updownarrow d}|_{0}^{45}$ versus
 $E^+_{ss,s}$ (orange) are shown in figure 17(c). There is a considerable increase in the kinetic energy of straight rolls in response to wall-normal turbulent transport from large to small scales (brown) and the peak of the correlation function is more left-shifted than that of the localised wall-normal velocity fluctuations in figure 17(b) (pink), indicating that these wavy rolls can indeed energise the straight rolls as per the usual progression of the small-scale SSP. The response of the kinetic energy of small-scale straight streaks in figure 17(c) is more modest (orange), which suggests that the localisation of the driving process hinders its ability to generate these elongated structures. Nevertheless, the corresponding correlation function is non-negligible and so the driving process does seem to have the ability to energise the small-scale SSP somewhat.
However, much of the small-scale turbulent production generated during the driving process appears to lead to the formation of localised streamwise velocity fluctuations (figures 16 and 17b), which may not be related to the small-scale SSP. These observations suggest that the dynamics of the small-scale structures are governed by the co-existence of the small-scale SSP, as seen in figure 5(b), and the transient amplification of localised small-scale streamwise velocity fluctuations due to wall-normal turbulent transport from large to small scales and the Orr mechanism. This driving process would also explain why small-scale turbulent production is not as strongly correlated with the kinetic energy of small-scale straight streaks in figure 7(b). In the absence of any scale interaction, it is reasonable to expect that small-scale production would fluctuate almost exactly in line with the small-scale SSP, as seen with large-scale production and the large-scale SSP in figure 7(a). However, it has now been shown that small-scale production is subject to the transient amplification described above and would therefore be affected by the competing influences of the two dynamical processes.
Having observed the event in figure 16, the timing of the driving process must now be investigated. As seen in the time series in figure 15, the wall-normal turbulent transport term  $T^+_{v,\updownarrow d}|_{0}^{45}$ appears to increase in response to the large-scale wall-normal pressure strain term
 $\varPi ^+_{vl}|_{0}^{120}$, which itself fluctuates in line with the streak instability stage of the large-scale SSP (figure 7c). Furthermore, it has been shown that the timing of the wall-normal energy cascade across the interval
 $y^+\in [45,120]$ coincides with the breakdown of large-scale streaks (figure 11b). To determine whether this holds true for the driving process, the temporal cross-correlation function of
 $\varPi ^+_{vl}|_{0}^{120}$ versus
 $T^+_{v,\updownarrow d}|_{0}^{45}$ is plotted in figure 18(a) and its left-shifted peak indicates that this is indeed the case. The cross-correlation functions of the kinetic energy of large-scale wavy streaks
 $E^+_{ws,l}$ versus small-scale turbulent production
 $P^+_{us}|_{0}^{45}$ (purple) and the kinetic energy of large-scale wavy rolls
 $E^+_{wr,l}$ versus
 $P^+_{us}|_{0}^{45}$ (pink) are shown in figure 18(b). Again, the left-shifted peaks indicate that small-scale production increases during the late stages of large-scale streak breakdown, albeit with a slightly longer time lag. Therefore, the timing of the driving process is clearly determined by the large-scale SSP, which occurs over much longer time scales (figure 5c). This is consistent with the fact that the wall-normal turbulent transport term
 $T^+_{v,\updownarrow d}$ is directly proportional to
 $\boldsymbol {\nabla } v_l^+$ in (5.1), which is of course related to the large-scale wavy rolls. Although it has been well documented that energy-containing eddies at various integral length scales exhibit SSPs independent of those at other scales (Hamilton et al. Reference Hamilton, Kim and Waleffe1995; Hwang & Cossu Reference Hwang and Cossu2010b, Reference Hwang and Cossu2011; Hwang Reference Hwang2015; Hwang & Bengana Reference Hwang and Bengana2016), the timing of the driving process (figure 18) and its energising effects (figure 17c) clearly demonstrate that the large-scale SSP affects the small-scale SSP, raising questions about their independence.
Temporal cross-correlation functions of (a)  $\varPi ^+_{vl}|_{0}^{120}$ vs.
 $T^+_{v,\updownarrow d}|_{0}^{45}$ (green) and (b)
 $E^+_{ws,l}$ vs.
 $P^+_{us}|_{0}^{45}$ (purple) and
 $E^+_{wr,l}$ vs.
 $P^+_{us}|_{0}^{45}$ (pink).

Finally, given this wall-normal turbulent transport from large to small scales and the resulting amplification of small-scale turbulent production by the Orr mechanism, it is of interest to see how this affects the small-scale energy balance. The temporal cross-correlation function of wall-normal turbulent transport  $T^+_{v,\updownarrow d}|_{0}^{45}$ versus small-scale wall-normal dissipation
 $-\epsilon ^+_{vs}|_{0}^{45}$ in figure 19(a) is left-shifted with a very short time lag, indicating that the magnitude of small-scale wall-normal dissipation increases immediately in response to the transfer of energy from the large scale. The cross-correlation function of
 $T^+_{v,\updownarrow d}|_{0}^{45}$ versus small-scale streamwise dissipation
 $-\epsilon ^+_{us}|_{0}^{45}$ (blue) in figure 19(b) is even more left-shifted, since there is a time lag between the wall-normal turbulent transport and the resulting small-scale production in figure 14, which then enhances the streamwise dissipation. The cross-correlation functions of
 $T^+_{v,\updownarrow d}|_{0}^{45}$ versus small-scale streamwise pressure strain
 $-\varPi ^+_{us}|_{0}^{45}$ (green) and
 $T^+_{v,\updownarrow d}|_{0}^{45}$ versus small-scale spanwise dissipation
 $-\epsilon ^+_{ws}|_{0}^{45}$ are shown in figures 19(b) and 19(c), respectively. Both correlations show left-shifted peaks, indicating that there is a subsequent redistribution of energy from the streamwise component
 $u_s^+$ to the spanwise component
 $w_s^+$ and an increase in the magnitude of small-scale spanwise dissipation. Each of the correlation functions in figure 19 exhibit very short time lags, indicating that there is a rapid increase in the magnitude of dissipation for each small-scale velocity component in response to the driving process. This is in contrast to the small-scale SSP, in which there is a noticeable time lag between production and dissipation, as can be deduced from figures 5(b) and 7(b). Therefore, the correlation functions in figure 19 are more likely a measure of the response to the transient amplification of localised small-scale velocity structures as seen in figure 17(b), consistent with the fact that the dissipation terms are proportional to the velocity gradients (see appendix B).
Temporal cross-correlation functions of (a)  $T^+_{v,\updownarrow d}|_{0}^{45}$ vs.
 $-\epsilon ^+_{vs}|_{0}^{45}$ (blue), (b)
 $T^+_{v,\updownarrow d}|_{0}^{45}$ vs.
 $-\epsilon ^+_{us}|_{0}^{45}$ (blue) and
 $T^+_{v,\updownarrow d}|_{0}^{45}$ vs.
 $-\varPi ^+_{us}|_{0}^{45}$ (green), and (c)
 $T^+_{v,\updownarrow d}|_{0}^{45}$ vs.
 $-\epsilon ^+_{ws}|_{0}^{45}$ (blue).

6. Feeding from small to large scales
The second scale interaction process identified in the statistical analysis of the two-scale energetics in § 2.3 is the feeding of energy from small to large scales (figure 4), resulting in the formation of the wall-reaching part of the large-scale energy-containing eddies (see also figure 28(c,e) in appendix A). These large-scale structures that reach the near-wall region will be called the ‘inactive motion’, since they do not carry any Reynolds stress due to the boundary condition at the wall (Townsend Reference Townsend1980; Cho et al. Reference Cho, Hwang and Choi2018). The feeding process manifests as peaks of positive streamwise and spanwise inter-scale turbulent transport at large scale (figure 4a,e) and negative streamwise and spanwise inter-scale turbulent transport at small scale (figure 4b,f) below  $y^+\approx 25$. The streamwise and spanwise inter-scale turbulent transport terms
 $-T^+_{u,\updownarrow }$ and
 $-T^+_{w,\updownarrow }$ are subsequently averaged over the intervals
 $y^+\in [5,25]$ and
 $y^+\in [0,25]$, respectively, in order to study the temporal dynamics of the feeding process, and the resulting large-scale structures are measured through the kinetic energy of wavy streamwise and spanwise inactive motion
 \begin{equation} E^+_{wu,i}=\tfrac{1}{2}\langle(u_l^+{-} \langle u_l^+ \rangle_{x^+})^2 \rangle_{x^+,z^+}|_{0}^{20} \quad \mathrm{and} \quad E^+_{ww,i}=\tfrac{1}{2}\langle(w_l^+{-} \langle w_l^+ \rangle_{x^+})^2 \rangle_{x^+,z^+}|_{0}^{20},\end{equation}
respectively. Note that the kinetic energy of straight streamwise and spanwise inactive motion is not considered here, the precise reasons for which are discussed below. Descriptions of the observables associated with the feeding process are provided in table 5.
Descriptions of the observables associated with the feeding from small to large scales.

The time series of the streamwise and spanwise inter-scale turbulent transport terms  $-T^+_{u,\updownarrow }|_{5}^{25}$ and
 $-T^+_{w,\updownarrow }|_{0}^{25}$ (black) are shown in figures 20(a) and 20(b), respectively. In order to highlight the transfer of energy between scales, the time series of the kinetic energy of small-scale wavy streaks
 $E^+_{ws,s}$ (orange) is also plotted, along with the kinetic energy of wavy (a) streamwise and (b) spanwise inactive motion
 $E^+_{wu,i}$ and
 $E^+_{ww,i}$ (pink), respectively. In both figures 20(a) and 20(b), the three time series are correlated – there is an increase in inter-scale turbulent transport in response to the small-scale wavy streaks, which results in an increase in wavy inactive motion at large scale for both velocity components. Both the streamwise and spanwise feeding processes appear to fluctuate in response to the small-scale wavy streaks, which requires further investigation.
Time series of (a)  $10^{-1}E^+_{ws,s}$ (orange),
 $-T^+_{u,\updownarrow }|_{5}^{25}$ (black) and
 $10^{-1}E^+_{wu,i}$ (pink), and (b)
 $2\times 10^{-2}E^+_{ws,s}$ (orange),
 $-T^+_{w,\updownarrow }|_{0}^{25}$ (black) and
 $5\times 10^{-2}E^+_{ww,i}$ (pink).

In order to study the spatio-temporal dynamics of the feeding process, an intense streamwise feeding event is identified in the time series in figure 20(a) (grey box) and snapshots of the velocity field during this event are shown in figure 21. The magnification of figure 20(a) for  $t^+\in [6440,6540]$ is shown in figure 21(a). A peak in the kinetic energy of small-scale wavy streaks (orange) appears to result in a large increase in streamwise inter-scale turbulent transport (black) and a subsequent increase in the kinetic energy of wavy streamwise inactive motion at large scale (pink). Figures 21(b)–21(f) are snapshots of the velocity field at times
 $t^+= 6470$, 6486, 6503, 6508 and 6519, respectively, indicated by the dots in (a). The isosurfaces of small-scale streaks
 $u_s^+=\pm 2.5$ are shown in orange, large-scale streamwise turbulent transport
 $T^+_{ul,f}=0.45$ in black and high- and low-speed large-scale streaks
 $u_l^+=\pm 3.05$ in pink and cyan, respectively. Note that the wall-normal range is
 $y^+\in [0,30]$. Before the feeding event, at
 $t^+=6470$ (figure 21b), the near-wall velocity field is dominated by the small-scale streaks, while turbulent transport and the large-scale streaks are largely absent. There is a substantial increase in turbulent transport by
 $t^+=6486$ (figure 21c), the isosurfaces of which form alongside the small-scale streaks. These turbulent transport isosurfaces precede the growth of the large-scale streaks, which have increased in size considerably by
 $t^+=6503$ (figure 21d). In particular, the turbulent transport seems to contribute more to the growth of the high-speed large-scale streaks, since the corresponding black and pink isosurfaces are well aligned. At later times
 $t^+=6508,6519$ (figure 21e,f), the small-scale streaks and turbulent transport isosurfaces begin to decay again, while the large-scale streaks increase further in size. At the end of the streamwise feeding event, the near-wall velocity field is dominated by strong large-scale streaks.
Streamwise feeding: (a) magnification of figure 20(a) for  $t^+\in [6440,6540]$; (b,c,d,e,f) isosurfaces of
 $u_s^+=\pm 2.5$ (orange),
 $T^+_{ul,f}=0.45$ (black) and
 $u_l^+=\pm 3.05$ (pink/cyan) at
 $t^+= 6470$, 6486, 6503, 6508 and 6519, respectively.

During the feeding event in figure 21, it was observed that the isosurfaces of large-scale streamwise turbulent transport form alongside the small-scale streaks. Furthermore, in the time series in figure 20, both the streamwise and spanwise inter-scale turbulent transport terms  $-T^+_{u,\updownarrow }|_{5}^{25}$ and
 $-T^+_{w,\updownarrow }|_{0}^{25}$ appear to increase in response to the kinetic energy of small-scale wavy streaks
 $E^+_{ws,s}$ in particular. This suggests that the feeding processes fluctuate in line with the small-scale SSP but the precise timing must now be investigated. The temporal cross-correlation function of small-scale turbulent production
 $P^+_{us}|_{0}^{45}$ versus streamwise inter-scale turbulent transport
 $-T^+_{u,\updownarrow }|_{5}^{25}$ (red) is shown in figure 22(a) and its left-shifted peak indicates that the streamwise feeding process is driven by the small-scale turbulent production mechanisms. In particular, it will be shown that the time scale of the streamwise inter-scale turbulent transport term
 $-T^+_{u,\updownarrow }|_{5}^{25}$ is quite short (figure 26a) compared with the characteristic time scale of the driving process (figure 14b), indicating that streamwise feeding fluctuates in line with the small-scale SSP rather than the Orr mechanism driven by the large scale. The left-shifted cross-correlation function of small-scale wavy streaks
 $E^+_{ws,s}$ versus streamwise inter-scale turbulent transport
 $-T^+_{u,\updownarrow }|_{5}^{25}$ (purple) further indicates that streamwise feeding is most active during the streak instability stage of the small-scale SSP. The same can be said for the spanwise feeding process, since spanwise inter-scale turbulent transport
 $-T^+_{w,\updownarrow }|_{0}^{25}$ increases in response to small-scale wavy streaks
 $E^+_{ws,s}$ and small-scale spanwise pressure strain
 $\varPi ^+_{ws}|_{0}^{45}$ (which itself fluctuates in line with the breakdown of small-scale streaks in figure 7d), as seen in the purple and green cross-correlations in figure 22(b), respectively. This turbulent transport from small to large scales results in an increase in the kinetic energy of wavy streamwise and spanwise inactive motion
 $E^+_{wu,i}$ and
 $E^+_{ww,i}$, as seen in the cross-correlation functions in figures 22(c) and 22(d), respectively. As observed in the feeding event in figure 21, the isosurfaces of large-scale turbulent transport are highly localised (see also figure 23) and would thus contribute to the growth of wavy rather than straight inactive motion. Therefore, the timing of both the streamwise and spanwise feeding processes is determined by the small-scale SSP, in particular the streak instability stage, and this results in the formation of wavy streamwise and spanwise inactive motion at large scale.
Temporal cross-correlation functions of (a)  $P^+_{us}|_{0}^{45}$ vs.
 $-T^+_{u,\updownarrow }|_{5}^{25}$ (red) and
 $E^+_{ws,s}$ vs.
 $-T^+_{u,\updownarrow }|_{5}^{25}$ (purple), (b)
 $E^+_{ws,s}$ vs.
 $-T^+_{w,\updownarrow }|_{0}^{25}$ (purple) and
 $\varPi ^+_{ws}|_{0}^{45}$ vs.
 $-T^+_{w,\updownarrow }|_{0}^{25}$ (green), (c)
 $-T^+_{u,\updownarrow }|_{5}^{25}$ vs.
 $E^+_{wu,i}$ (purple) and (d)
 $-T^+_{w,\updownarrow }|_{0}^{25}$ vs.
 $E^+_{ww,i}$ (pink).

The streamwise velocity field and streamwise turbulent transport at  $y^+\approx 8$; positive/negative isocontours of
 $u^{'+}$ (red/blue) and positive isocontours of
 $T^+_{ul,f}$ (black) during three streamwise feeding events.

Having established that the feeding process is related to the instability of small-scale streaks (figure 22), it is of interest to study the velocity field structure in more detail. Here, the focus is on the streamwise feeding process, since the streamwise inter-scale turbulent transport term  $-T^+_{u,\updownarrow }$ has greater magnitude than its spanwise equivalent in figure 4(a,e) and would thus have more of an effect on the large-scale energy balance. In order to identify some of the characteristics of streamwise feeding, the streamwise velocity field
 $u^{'+}$ and large-scale streamwise turbulent transport
 $T^+_{ul,f}$ at
 $y^+\approx 8$ are sampled during three feeding events, plotted in figure 23. At
 $y^+\approx 8$, the streamwise inter-scale turbulent transport term is positive at large scale (and negative at small scale) in figure 4(a), indicating that energy is transferred from small to large scales on average, and so this is the target wall-normal height of the following analysis since it is very close to the peak. The isocontours of the high-speed streaks are shown in red, low-speed streaks in blue and positive large-scale streamwise turbulent transport in black. It seems that the isocontours of turbulent transport are more correlated with the high-speed streaks, while the low-speed streaks appear out-of-phase with each other in a symmetric manner during these feeding events. Furthermore, the localisation of the streamwise feeding process is particularly apparent in figure 23, with numerous disjoint isocontours of turbulent transport.
However, the snapshots in figure 23 are quite noisy; hence, an alternative approach is required to better reveal the velocity field structure. For this purpose, the near-wall flow field is analysed through proper orthogonal decomposition (POD) (Berkooz, Holmes & Lumley Reference Berkooz, Holmes and Lumley1993). The small-scale streamwise velocity field  $u_s^+$, large-scale streamwise velocity field
 $u_l^+$ and large-scale streamwise turbulent transport
 $T^+_{ul,f}$ are sampled over a time period of
 $T^+\approx 50\ 000$, resulting in the collection of 9999 samples with temporal resolution
 $\varDelta t^+\approx 5$. At each sampling time, the data vectors
 \begin{equation} \boldsymbol{x}_s=[u_s^+,T^{'+}_{ul,f}]^T \quad \mathrm{and} \quad \boldsymbol{x}_l=[u_l^+,T^{'+}_{ul,f}]^T \end{equation}
are constructed, where  $T^{'+}_{ul,f}=T^+_{ul,f}-\langle T^+_{ul,f}\rangle _{x^+,z^+}$ is the large-scale streamwise turbulent transport fluctuation and
 $(\cdot )^T$ denotes the transpose. The data vectors are then used to form the two-point correlation tensors
 \begin{gather} R_s(\varDelta x^+,\varDelta z^+)= \overline{\langle \boldsymbol{x}_s(x^+{+}\varDelta x^+,z^+{+}\varDelta z^+)\boldsymbol{x}_s^T(x^+,z^+) \rangle}_{x^+,z^+}, \end{gather}
 \begin{gather}R_l(\varDelta x^+,\varDelta z^+)= \overline{\langle \boldsymbol{x}_l(x^+{+}\varDelta x^+,z^+{+}\varDelta z^+)\boldsymbol{x}_l^T(x^+,z^+) \rangle}_{x^+,z^+}, \end{gather}
the eigenvectors of which are the POD modes (as functions of  $\varDelta x^+$ and
 $\varDelta z^+$). Due to the periodic boundary conditions in the streamwise and spanwise directions, each POD mode should be a plane Fourier mode. Therefore, the presentation of individual POD modes is not very informative. Instead, ordering the normalised POD modes
 $\phi _j$ and
 $\psi _j$ according to the magnitudes of the corresponding eigenvalues, and multiplying the corresponding POD modes and coefficients
 $a_j$ and
 $b_j$ (which incorporate the time dependence and the square root of the eigenvalues) allows for the low-dimensional approximation to the small- and large-scale streamwise velocity fields associated with the streamwise feeding process. In particular, the rank-n truncations of each,
 \begin{equation} \boldsymbol{x}_s\approx\sum_{j=1}^{n}a_j\phi_j \quad \mathrm{and} \quad \boldsymbol{x}_l\approx\sum_{j=1}^{n}b_j\psi_j, \end{equation}
are used to approximate the two-point correlation tensors  $R_s$ and
 $R_l$. The rank-8 approximations to the small-scale streamwise velocity field
 $u_s^+$ and the large-scale streamwise turbulent transport fluctuation
 $T^{'+}_{ul,f}$ correlation structures at
 $y^+\approx 8$ are shown in figures 24(a) and 24(b), respectively. It has been found that the inclusion of higher-order POD modes does not change figure 24 qualitatively. The small-scale streamwise velocity field correlation structure is very similar to the subharmonic sinuous streak instability mode (Schoppa & Hussain Reference Schoppa and Hussain2002), in which the low-speed streaks bend away from the
 $z^+$-symmetric high-speed streak. The corresponding approximation to the large-scale streamwise turbulent transport fluctuation correlation structure shows that the peaks in energy transfer from small to large scales correlate with the high-speed small-scale streaks in figure 24(a), as observed in the snapshots in figure 23. It must be pointed out that the large-scale streamwise turbulent transport term
 $T^{+}_{ul,f}$ is comprised of the fluctuating component (
 $T^{'+}_{ul,f}$) and the positive mean component (
 $\langle T^+_{ul,f}\rangle _{x^+,z^+}$), which does not alter the flow structures visualised in figure 24 because its contribution is uniform in the
 $x^+$–
 $z^+$ plane. Indeed, it can easily be shown that applying the POD analysis to the total flow variables (including the mean and fluctuating components) does not change the flow features of the leading POD modes in figure 24, because both the Reynolds decomposition and POD are based on a ‘linear’ superposition. By its mathematical definition (Schoppa & Hussain Reference Schoppa and Hussain2002), the subharmonic instability of the small-scale streaks would generate large-scale structures and the POD analysis suggests that the subharmonic sinuous mode is the mechanism behind the streamwise feeding process. The rank-8 approximations to the large-scale streamwise velocity field
 $u_l^+$ and the large-scale streamwise turbulent transport fluctuation
 $T^{'+}_{ul,f}$ correlation structures at
 $y^+\approx 8$ are shown in figures 24(c) and 24(d), respectively. The large-scale streamwise velocity field correlation structure is very similar to the fundamental varicose streak instability mode, in which both the high- and low-speed streaks are
 $z^+$-symmetric (Schoppa & Hussain Reference Schoppa and Hussain2002). The corresponding approximation to the large-scale streamwise turbulent transport fluctuation correlation structure shows that streamwise feeding appears to favour the formation of high-speed streamwise inactive motion at large scale, since the positive isocontours in figures 24(c) and 24(d) are again correlated. This has also been observed in the streamwise feeding event in figure 21. Lastly, it must be pointed out that the POD analysis is applied to the correlation structure of the fluctuations of
 $T^{+}_{ul,f}$ (
 $T^{'+}_{ul,f}$) and so the structure identified is not necessarily directly related to the mean energy transfer from small to large scales. However, at the sampling wall-normal height of the analysis (
 $y^+\approx 8$), the mean streamwise inter-scale turbulent transport
 $-T^+_{u,\updownarrow }$ is positive at large scale (figure 4a), indicating that the transfer of energy from small to large scales is indeed dominant at this location. The POD analysis then identifies the most prominent spatial correlation structures at the sampling wall-normal height and so care must be taken in interpreting these results.
Proper orthogonal decomposition of the streamwise velocity field and streamwise turbulent transport at  $y^+\approx 8$; rank-8 approximations to the two-point correlation structures of (a,b)
 $u_s^+$ and
 $T^{'+}_{ul,f}$, and (c,d)
 $u_l^+$ and
 $T^{'+}_{ul,f}$.

As an aside, it has recently been suggested by Lee & Moser (Reference Lee and Moser2019) that the energy transfer from small to large scales near the wall may not actually be a scale interaction process and could instead be the manifestation of a transfer in orientation, in particular between streamwise-elongated modes and spanwise-elongated modes, i.e. large-scale structures. However, the appearance of the subharmonic sinuous instability mode of the small-scale streaks in the POD analysis (figure 24a) suggests an alternative mechanism for the energy transfer from small to large scales and, crucially, one that is consistent with its previous interpretation as a scale interaction process (Cho et al. Reference Cho, Hwang and Choi2018). While this ‘scale transfer in orientation’ phenomenon is indeed possible, more so in extended flow domains, these findings suggest that the feeding from small to large scales in the present highly confined flow domain is related to the subharmonic sinuous instability mechanism. Furthermore, it is worth mentioning that the interpretation of Lee & Moser (Reference Lee and Moser2019) is based on the visualisation of the turbulent transport spectra, which may have missed some non-local nonlinear interactions that can be captured by analysing the full nonlinear triadic interactions. Indeed, the analysis of Cho et al. (Reference Cho, Hwang and Choi2018) is based on the visualisation of these triadic interactions, although it focuses on the energy transfer between spanwise Fourier modes.
Given this regular transfer of energy from small to large scales, its effect on the large-scale energy balance must now be investigated. The temporal cross-correlation function of streamwise inter-scale turbulent transport  $-T^+_{u,\updownarrow }|_{5}^{25}$ versus large-scale streamwise pressure strain
 $-\varPi ^+_{ul}|_{7}^{20}$ is shown in figure 25(a). Note that the sign of the streamwise pressure strain term has been flipped. The left-shifted peak indicates that the streamwise TKE transferred from small to large scales is redistributed to the wall-normal and spanwise components
 $v_l^+$ and
 $w_l^+$. There is a corresponding increase in the magnitude of large-scale wall-normal and spanwise dissipation but it is very modest, as seen in the cross-correlation function of
 $-T^+_{u,\updownarrow }|_{5}^{25}$ versus
 $-\epsilon ^+_{vl}|_{7}^{20}-\epsilon ^+_{wl}|_{7}^{20}$ in figure 25(b). The cross-correlation function of spanwise inter-scale turbulent transport
 $-T^+_{w,\updownarrow }|_{0}^{25}$ versus large-scale spanwise dissipation
 $-\epsilon ^+_{wl}|_{7}^{20}$ is shown in figure 25(c) and its left-shifted peak indicates that the spanwise TKE transferred from small to large scales is dissipated at the large scale.
Temporal cross-correlation functions of (a)  $-T^+_{u,\updownarrow }|_{5}^{25}$ vs.
 $-\varPi ^+_{ul}|_{7}^{20}$ (green), (b)
 $-T^+_{u,\updownarrow }|_{5}^{25}$ vs.
 $-\epsilon ^+_{vl}|_{7}^{20}-\epsilon ^+_{wl}|_{7}^{20}$ (blue) and (c)
 $-T^+_{w,\updownarrow }|_{0}^{25}$ vs.
 $-\epsilon ^+_{wl}|_{7}^{20}$ (blue).

There is no observed increase in large-scale turbulent production in response to the feeding processes – the cross-correlation functions of  $-T^+_{u,\updownarrow }|_{5}^{25}$ versus
 $P^+_{ul}|_{7}^{20}$ and
 $-T^+_{w,\updownarrow }|_{0}^{25}$ versus
 $P^+_{ul}|_{7}^{20}$ are not positive. It is expected that the spanwise feeding process would have little effect, since the large-scale production term
 $P^+_{ul}$ is independent of
 $w_l^+$. However, there is no observed increase in large-scale production in response to the streamwise feeding process either, even though the peaks of
 $-T^+_{u,\updownarrow }$ and
 $P^+_{ul}$ have similar magnitude in figures 4(a) and 3(a), respectively. In the case of the driving process in § 5, it has been demonstrated that small-scale turbulent production increases in response to wall-normal turbulent transport from large to small scales in figure 14 but there is also no observed response to streamwise turbulent transport. This suggests that turbulent production is particularly sensitive to the wall-normal velocity component and the transfer of wall-normal TKE between scales. Crucially, no wall-normal feeding is observed in figure 4(c) and the wall-normal inter-scale turbulent transport term only shows evidence of the cascade of energy from large to small scales. Consequently, the streamwise and spanwise feeding processes only appear to result in increased large-scale pressure strain and dissipation with little effect on turbulent production, as has been theorised by Cho et al. (Reference Cho, Hwang and Choi2018). It should be mentioned that these observations do not necessarily preclude any possible role of the feeding processes in turbulent production and the associated skin-friction generation: for example, it might be possible that the large-scale structures generated during feeding events modulate large-scale turbulent production. Therefore, these findings must be interpreted carefully.
Finally, each of the cross-correlation functions in figure 25 are quite narrow, indicating that the effects of the streamwise and spanwise feeding processes on the large-scale energy balance are short-lived. Furthermore, the feeding event in figure 21 also occurs over a very short time interval, indicating that streamwise feeding is a fast and impulsive event. The temporal auto-correlation functions of the streamwise and spanwise inter-scale turbulent transport terms  $-T^+_{u,\updownarrow }|_{5}^{25}$ and
 $-T^+_{w,\updownarrow }|_{0}^{25}$ are shown in figures 26(a) and 26(b), respectively, which confirm that the streamwise and spanwise feeding process are indeed fast. The auto-correlation function of the resulting large-scale streamwise pressure strain
 $\varPi ^+_{ul}|_{7}^{20}$ (dotted green line) is shown in figure 26(c), which has a much shorter characteristic time scale than the streamwise pressure strain associated with the large-scale SSP
 $\varPi ^+_{ul}|_{0}^{120}$ (solid green line).
Temporal auto-correlation functions of (a)  $-T^+_{u,\updownarrow }|_{5}^{25}$ (black), (b)
 $-T^+_{w,\updownarrow }|_{0}^{25}$ (black) and (c)
 $\varPi ^+_{ul}|_{0}^{120}$ (solid green line) and
 $\varPi ^+_{ul}|_{7}^{20}$ (dotted green line).

7. Conclusions
In this work, the temporal dynamics of a turbulent flow with two integral length scales of motion are investigated, with a focus on scale interaction. The flow considered is that of the shear stress-driven model of independent near-wall turbulence as  $Re_\tau \rightarrow \infty$, which has been introduced recently (Doohan et al. Reference Doohan, Willis and Hwang2019). This model is formulated in inner units and governed by the unit-Reynolds-number Navier–Stokes equations, which are valid throughout the mesolayer. The domain size is fixed at
 $(L_x^+=640,L_y^+=180,L_z^+=220)$ and due to the periodic boundary conditions in the streamwise and spanwise directions, only energy-containing eddies with spanwise length scales
 $\lambda _z^+\approx 220$ and
 $\lambda _z^+\approx 110$ are resolved. The velocity field is decomposed into large- and small-scale components to represent the energy-containing eddies at each integral length scale, and the momentum and energy balance equations at each scale are derived. The statistics and dynamics of the terms in the energy balance equations are analysed, with a particular emphasis on inter-scale turbulent transport, and the corresponding scale interaction processes are related to the SSPs at each scale. A schematic diagram of the two-scale system is shown in figure 27 and the main findings are summarised as follows.
(i) The dynamics of the energy cascade over the interval
 $y^+\in [45,120]$ are entirely determined by the large-scale SSP. In particular, the timing of streamwise, wall-normal and spanwise inter-scale turbulent transport coincides with the large-scale streak breakdown stage, leading to same-component energy transfer from large to small scales. Crucially, the resulting small-scale dissipation inherits the characteristic time scales of that of the large-scale SSP, indicative of non-equilibrium turbulent dissipation dynamics (Goto & Vassilicos Reference Goto and Vassilicos2015).
(ii) A new scale interaction process is identified, namely that wall-normal turbulent transport from large to small scales over the interval
$y^+\in [0,45]$ drives small-scale turbulent production via the Orr mechanism. The main consequence of the driving process appears to be the transient amplification of localised small-scale velocity structures and their subsequent dissipation; however, it also has an energising effect on the small-scale SSP. This wall-normal energy transfer is most active during the streak breakdown stage of the large-scale SSP, as in the case of the energy cascade. Therefore, the dynamics of the small-scale structures are a complicated entanglement of the small-scale SSP, the dissipation of detached eddies associated with the energy cascade and the transient amplification of localised small-scale velocity structures via the Orr mechanism.(iii) The feeding of energy from small to large scales over the interval
$y^+\in [0,25]$ is impelled by the small-scale SSP, and the timing of both the streamwise and spanwise feeding processes coincides with the small-scale streak instability stage. The POD analysis at $y^+\approx 8$ suggests that streamwise feeding is related to the subharmonic sinuous streak instability mode and that it leads to the formation of the wall-reaching part of high-speed large-scale streaks in particular. The feeding processes result in increased large-scale pressure strain and dissipation; however, there is no observed increase in large-scale turbulent production. This suggests that while the large-scale SSP has an energising effect on the small-scale SSP through the driving process, there is no evidence of the latter affecting the former.


Schematic diagram of the two-scale system.

To the best of the authors' knowledge, this is the first exhaustive analysis of the temporal dynamics of the interactions between structures of all possible scales, at least in the given flow configuration. However, there are a number of limitations to the present study. The flow domain in question is only twice the size of the minimal unit in each direction and, thus, it only resolves energy-containing eddies at two integral length scales, i.e. the minimal unit of multi-scale turbulence. Once the spanwise domain width exceeds  $L_z^+\simeq 300$, energy-containing eddies at three integral length scales (
 $\lambda _z^+\simeq 100,150,300$) would be present, again due to the periodic boundary condition in the spanwise direction. As the inner-scaled domain size increases further, which is equivalent to increasing the Reynolds number, then the flow would encompass a hierarchy of scales – many more than two. In such a flow domain, the structures at every level in the hierarchy would interact with one another and the study of the corresponding scale interaction processes would become much more complicated. It is unclear as to how/whether the dynamical description of two-scale near-wall turbulence extends to flows with deeper hierarchies/higher Reynolds numbers, since the increased number of scale interactions would alter the turbulent dynamics. In such analyses, different flow decompositions may also have to be considered. For example, one of the scale interaction processes identified in Cho et al. (Reference Cho, Hwang and Choi2018) was the involvement of large energy-containing eddies in the cascade of energy from small energy-containing eddies to the adjacent smaller length scale, and studying the temporal dynamics of this process would require a triple decomposition of the velocity field. Consequently, there are many open questions in the study of the temporal dynamics of multi-scale turbulence and this work is only one of the first steps in the endeavour.
Acknowledgements
This work was supported by the European Office of Aerospace Research and Development (EOARD) (FA9550-19-1-7021; Program Manager: Dr D. Smith).
Funding
Y.H. gratefully acknowledges the financial support of the Leverhulme Trust (RPG-2019-123) and the Engineering and Physical Sciences Research Council (EPSRC; EP/T009365/1) in the UK.
Declaration of interest
The authors report no conflict of interest.
Appendix A. Spectral energy balance
The spectral energetics of minimal multi-scale near-wall turbulence are discussed in this section, in order to identify the energy-containing eddies at each scale, the characteristics of turbulent dissipation and the scale interaction processes active in the near-wall region. Following the approach of Cho et al. (Reference Cho, Hwang and Choi2018), the energy balance equations of each spanwise Fourier mode are considered, since this best characterises the size of the energy-containing eddies (Hwang Reference Hwang2015). Introducing the index notation  $x_j^+=x^+,y^+,z^+$ and
 $u_j^{'+}=u^{'+},v^{'+},w^{'+}$ for
 $j=1,2,3$, the fluctuating velocity components are decomposed into Fourier modes
 \begin{equation} u_j^{'+}(x^+,y^+,z^+,t^+)=\sum_{|n|\leq n_z}\widetilde{u_j^{'+}}(x^+,y^+,k_z^+,t^+)\,\textrm{e}^{\textrm{i}(nk_{z0}^+z^+)}, \end{equation}
where  $\widetilde {\cdot }$ denotes the Fourier coefficients,
 $k_{z0}^+$ is the fundamental spanwise wavenumber,
 $k_z^+=nk_{z0}^+$ is the spanwise wavenumber and
 $n_z$ is the number of harmonics in the spanwise direction. Then, taking the Fourier transform of (2.3), multiplying by the complex conjugate
 $\widetilde {u_j^{'+}}^*$, and averaging in the streamwise direction and in time yields the component-wise spectral energy balance equations
 \begin{align} \left\langle\overline{\frac{\partial\widetilde{E_u^+}(k_z^+)}{\partial t^+}}\right\rangle_{x^+} &= \underbrace{\left\langle\textrm{Re}\left\{\overline{-\widetilde{u^{'+}}^*(k_z^+) \widetilde{v^{'+}}(k_z^+)\frac{\partial U^+}{\partial y^+}}\right\} \right\rangle_{x^+}}_{\tilde{P}^+\left(y^+,k_z^+\right)}\nonumber\\ &\quad + \underbrace{\left\langle\textrm{Re}\left\{\overline{\widetilde{p^{'+}}(k_z^+) \frac{\partial{\widetilde{u^{'+}}^*(k_z^+)}}{\partial{x^+}}}\right\} \right\rangle_{x^+}}_{\tilde{\varPi}_{u}^+\left(y^+,k_z^+\right)}\nonumber\\ &\quad + \underbrace{\left\langle\textrm{Re}\left\{\overline{-\widetilde{u^{'+}}^*(k_z^+) \frac{\partial}{\partial{x_j^+}}(\widetilde{u^{'+}u_j^{'+}}(k_z^+))}\right\} \right\rangle_{x^+}}_{\tilde{T}_u^+\left(y^+,k_z^+\right)}\nonumber\\ &\quad + \underbrace{\left\langle\overline{\frac{\partial^2}{\partial y^{{+}2}} \left(\tfrac{1}{2}\left|\widetilde{u^{'+}}(k_z^+)\right|^2\right)} \right\rangle_{x^+}}_{\tilde{T}_{\nu,u}^+\left(y^+,k_z^+\right)} +\underbrace{\left\langle\overline{-\frac{\partial{\widetilde{u^{'+}}}(k_z^+)}{\partial{x_j^+}} \frac{\partial{\widetilde{u^{'+}}^*}(k_z^+)}{\partial{x_j^+}}} \right\rangle_{x^+}}_{\tilde{\epsilon}_u^+\left(y^+,k_z^+\right)}, \end{align}
 \begin{align} \left\langle\overline{\frac{\partial\widetilde{E_v^+}(k_z^+)}{\partial t^+}}\right\rangle_{x^+} &= \underbrace{\left\langle\textrm{Re}\left\{\overline{\widetilde{p^{'+}}(k_z^+) \frac{\partial{\widetilde{v^{'+}}^*(k_z^+)}}{\partial{y^+}}}\right\} \right\rangle_{x^+}}_{\tilde{\varPi}_v^+\left(y^+,k_z^+\right)}\nonumber\\ &\quad + \underbrace{\left\langle\textrm{Re}\left\{\overline{\frac{\partial}{\partial y^+} \left(-\widetilde{p^{'+}}(k_z^+)\widetilde{v^{'+}}^*(k_z^+)\right)}\right\} \right\rangle_{x^+}}_{\tilde{T}_p^+\left(y^+,k_z^+\right)}\nonumber\\ &\quad + \underbrace{\left\langle\textrm{Re}\left\{\overline{-\widetilde{v^{'+}}^*(k_z^+) \frac{\partial}{\partial{x_j^+}}(\widetilde{v^{'+}u_j^{'+}}(k_z^+))}\right\} \right\rangle_{x^+}}_{\tilde{T}_v^+\left(y^+,k_z^+\right)} \nonumber\\ &\quad + \underbrace{\left\langle\overline{\frac{\partial^2}{\partial y^{{+}2}} \left(\tfrac{1}{2}\left|\widetilde{v^{'+}}(k_z^+)\right|^2\right)} \right\rangle_{x^+}}_{\tilde{T}_{\nu,v}^+\left(y^+,k_z^+\right)} +\underbrace{\left\langle\overline{-\frac{\partial{\widetilde{v^{'+}}}(k_z^+)}{\partial{x_j^+}} \frac{\partial{\widetilde{v^{'+}}^*(k_z^+)}}{\partial{x_j^+}}} \right\rangle_{x^+}}_{\tilde{\epsilon}_v^+\left(y^+,k_z^+\right)},\nonumber\\ \left\langle\overline{\frac{\partial\widetilde{E_w^+}(k_z^+)}{\partial t^+}} \right\rangle_{x^+} &= \underbrace{\left\langle\textrm{Re}\left\{\overline{\widetilde{p^{'+}}(k_z^+) \left(ik_z^+\widetilde{w^{'+}}(k_z^+)\right)^*}\right\} \right\rangle_{x^+}}_{\tilde{\varPi}_w^+\left(y^+,k_z^+\right)}\nonumber\\ &\quad + \underbrace{\left\langle\textrm{Re}\left\{\overline{-\widetilde{w^{'+}}^*(k_z^+) \frac{\partial}{\partial{x_j^+}}(\widetilde{w^{'+}u_j^{'+}}(k_z^+))}\right\} \right\rangle_{x^+}}_{\tilde{T}_w^+\left(y^+,k_z^+\right)} \nonumber\end{align}
 \begin{align} &\quad + \underbrace{\left\langle\overline{\frac{\partial^2}{\partial y^{{+}2}} \left(\tfrac{1}{2}\left|\widetilde{w^{'+}}(k_z^+)\right|^2\right)} \right\rangle_{x^+}}_{\tilde{T}_{\nu,w}^+\left(y^+,k_z^+\right)} +\underbrace{\left\langle\overline{-\frac{\partial{\widetilde{w^{'+}}}(k_z^+)}{\partial{x_j^+}} \frac{\partial{\widetilde{w^{'+}}^*}(k_z^+)}{\partial{x_j^+}}} \right\rangle_{x^+}}_{\tilde{\epsilon}_w^+\left(y^+,k_z^+\right)}, \end{align}
where  $\widetilde {E_u^+}=|\widetilde {u^{'+}}|^2/2, \widetilde {E_v^+}=|\widetilde {v^{'+}}|^2/2$ and
 $\widetilde {E_w^+}=|\widetilde {w^{'+}}|^2/2$ are the streamwise, wall-normal and spanwise TKE components, and
 $\textrm {Re}\{\cdot \}$ denotes the real part. Here, only the dependence on the spanwise wavenumber
 $k_z^+$ is written explicitly. The terms on the right-hand side are the turbulent production
 $\tilde {P}^+$, streamwise, wall-normal and spanwise pressure strain
 $\tilde {\varPi }_{u}^+, \tilde {\varPi }_{v}^+$ and
 $\tilde {\varPi }_{w}^+$, pressure transport
 $\tilde {T}_p^+$, streamwise, wall-normal and spanwise turbulent transport
 $\tilde {T}_u^+, \tilde {T}_v^+$ and
 $\tilde {T}_w^+$, streamwise, wall-normal and spanwise viscous transport
 $\tilde {T}_{\nu ,u}^+, \tilde {T}_{\nu ,v}^+$ and
 $\tilde {T}_{\nu ,w}^+$, and streamwise, wall-normal and spanwise dissipation
 $\tilde {\epsilon }_u^+, \tilde {\epsilon }_v^+$ and
 $\tilde {\epsilon }_w^+$. Note that the system of (A2) is equivalent to the system of (3.4) in Cho et al. (Reference Cho, Hwang and Choi2018). The terms on the left-hand side represent the rate of change of the TKE of each spanwise Fourier mode, which vanishes in a statistically steady flow, hence, the terms on the right-hand side must balance each other. The one-dimensional co-spectra of the terms on the right-hand side of the spectral energy balance equations (A2) were computed over a time period of
 $T^+ > 300\ 000$, a selection of which are shown in figure 28. The spectra are only discussed briefly, since the spectral energy balance equation has been analysed in detail in a number of previous studies (e.g. Mizuno Reference Mizuno2016; Cho et al. Reference Cho, Hwang and Choi2018; Lee & Moser Reference Lee and Moser2019).
Premultiplied one-dimensional spanwise wavelength spectra of (a) turbulent production  $\tilde {P}^+, (b)$ streamwise pressure strain
 $\tilde {\varPi }_{u}^+, (c)$ streamwise turbulent transport
 $\tilde {T}_{u}^+, (d)$ wall-normal turbulent transport
 $\tilde {T}_{v}^+, (e)$ spanwise turbulent transport
 $\tilde {T}_{w}^+$ and (f) total dissipation
 $\tilde {\epsilon }^+$.

The premultiplied spanwise wavenumber spectra of turbulent production  $\tilde {P}^+_u$, as a function of the wall-normal height
 $y^+$ and the spanwise wavelength
 $\lambda _z^+$, is shown in figure 28(a). At the larger integral length scale
 $\lambda _z^+\approx 220$, production is more uniform across the wall-normal domain. However, it has a much more pronounced near-wall peak at
 $y^+\approx 12$ at the smaller integral length scale
 $\lambda _z^+\approx 110$ and is concentrated in the interval
 $y^+<45$. Figure 28(b) is the streamwise pressure strain spectra
 $\tilde {\varPi }_{u}^+$, which shows negative values across all spanwise wavelengths. The pressure strain terms, which are linked by the continuity equation in the form
 $\tilde {\varPi }_{u}^++\tilde {\varPi }_{v}^++\tilde {\varPi }_{w}^+=0$, redistribute the streamwise TKE to the wall-normal and spanwise components (Mizuno Reference Mizuno2016; Cho et al. Reference Cho, Hwang and Choi2018; Lee & Moser Reference Lee and Moser2019), and the wall-normal and spanwise pressure strain spectra exhibit positive values of similar magnitude (not shown here).
While the two aforementioned spectra match in shape, they do not match in magnitude, especially at the near-wall peak in production. This balance is provided by the streamwise turbulent transport spectra  $\tilde {T}^+_u$, which is shown in figure 28(c), and it shows both positive (red) and negative (blue) values, representing regions of energy gain and energy loss. The negative region of turbulent transport corresponds to the region where the turbulent production is active, extending across the entire wall-normal domain for
 $\lambda _z^+\approx 220$ and up to
 $y^+\approx 45$ for
 $\lambda _z^+\approx 110$. For
 $y^+>10$, there is positive turbulent transport at smaller wavelengths than negative turbulent transport. This indicates that there is energy transfer from large to small scales, i.e. energy cascade. However, there is also a region of positive turbulent transport very close to the wall (
 $y^+<15$), which has been identified in previous studies (e.g. Cho et al. Reference Cho, Hwang and Choi2018; Lee & Moser Reference Lee and Moser2019). In particular, Cho et al. (Reference Cho, Hwang and Choi2018) showed that this was the manifestation of the transfer of energy from small to large scales and it is apparent from figure 28(c) that its magnitude increases as
 $\lambda _z^+$ increases. The wall-normal and spanwise turbulent transport spectra
 $\tilde {T}^+_v$ and
 $\tilde {T}^+_w$ are shown in figures 28(d) and 28(e), respectively. Again, there are regions of negative turbulent transport at longer wavelengths where the pressure strain is most active and positive turbulent transport at adjacent smaller wavelengths. In the wall-normal spectra the energy cascade appears to be the only scale interaction process, whereas in the spanwise spectra there is also a very weak region of positive turbulent transport very close to the wall, indicative of energy transfer from small to large scales. Although this is practically invisible in the spanwise spectra due to its very small magnitude, it is apparent in the statistical analysis in § 2.3.
Finally, the spectra of total dissipation  $\tilde {\epsilon }^+=\tilde {\epsilon }^+_u+\tilde {\epsilon }^+_v +\tilde {\epsilon }^+_w$ is shown in figure 28(f). For
 $y^+>30$, the trough in dissipation occurs at
 $\lambda _z^+\approx 80$, although the peak in turbulent production appears at
 $\lambda _z^+\approx 220$ (figure 28a). The difference between the spanwise length scales of the peak in production and the trough in dissipation implies the cascade of energy through the turbulent transport terms discussed above (figure 28c,d,e). In contrast, for
 $y^+<30$, the dissipation appears to be quite different to the previous spectra and exhibits a bimodal distribution. The upper trough coincides with the peak in turbulent production at
 $y^+\approx 12$, representing the dissipation that takes place at the smaller integral length scale. However, it also shows substantial negative values at smaller wavelengths, matching the regions of positive turbulent transport, i.e. energy cascade. The lower trough of the total dissipation spectra occurs very close to the wall, in the region of positive turbulent transport coming from the transfer of energy from small to large scales.
Appendix B. Terms in the energy balance equations
In this section, the terms in the large- and small-scale energy balance equations (2.16) are written explicitly. They are as follows. At large scale,
 \begin{equation} P^+_{ul}={-}U^+_{y^+}\langle u_l^+v_l^+ \rangle_{x^+,z^+} \end{equation}
is turbulent production,
 \begin{gather} T^+_{ul,-}={-}\langle u_l^+ (\boldsymbol{u}^+_l\boldsymbol{\cdot} \boldsymbol{\nabla} u_l^+)\rangle_{x^+,z^+}={-}\boldsymbol{\nabla} \boldsymbol{\cdot} \langle\tfrac{1}{2}(u_l^+)^2 \boldsymbol{u}_l^+\rangle_{x^+,z^+}, \end{gather}
 \begin{gather}T^+_{vl,-}={-}\langle v_l^+ (\boldsymbol{u}^+_l\boldsymbol{\cdot} \boldsymbol{\nabla} v_l^+)\rangle_{x^+,z^+}={-}\boldsymbol{\nabla} \boldsymbol{\cdot} \langle\tfrac{1}{2}(v_l^+)^2 \boldsymbol{u}_l^+\rangle_{x^+,z^+}, \end{gather}
 \begin{gather}T^+_{wl,-}={-}\langle w_l^+ (\boldsymbol{u}^+_l\boldsymbol{\cdot} \boldsymbol{\nabla} w_l^+)\rangle_{x^+,z^+}={-}\boldsymbol{\nabla} \boldsymbol{\cdot} \langle\tfrac{1}{2}(w_l^+)^2\boldsymbol{u}_l^+\rangle_{x^+,z^+} \end{gather}
are streamwise, wall-normal and spanwise intra-scale spatial turbulent transport,
 \begin{gather} T^+_{ul,\#}={-}\boldsymbol{\nabla} \boldsymbol{\cdot} \langle\tfrac{1}{2}(u_l^+)^2 \boldsymbol{u}_s^+\rangle_{x^+,z^+} - \boldsymbol{\nabla} \boldsymbol{\cdot} \langle u_l^+u_s^+ \boldsymbol{u}_s^+\rangle_{x^+,z^+}, \end{gather}
 \begin{gather}T^+_{vl,\#}={-}\boldsymbol{\nabla} \boldsymbol{\cdot} \langle\tfrac{1}{2}(v_l^+)^2\boldsymbol{u}_s^+ \rangle_{x^+,z^+} - \boldsymbol{\nabla} \boldsymbol{\cdot} \langle v_l^+v_s^+\boldsymbol{u}_s^+\rangle_{x^+,z^+}, \end{gather}
 \begin{gather}T^+_{wl,\#}={-}\boldsymbol{\nabla} \boldsymbol{\cdot} \langle\tfrac{1}{2}(w_l^+)^2\boldsymbol{u}_s^+\rangle_{x^+,z^+} - \boldsymbol{\nabla} \boldsymbol{\cdot} \langle w_l^+w_s^+\boldsymbol{u}_s^+\rangle_{x^+,z^+} \end{gather}
are streamwise, wall-normal and spanwise inter-scale spatial turbulent transport,
 \begin{gather} T^+_{u,\updownarrow}={-}\langle u_l^+(\boldsymbol{u}^+_l\boldsymbol{\cdot} \boldsymbol{\nabla} u_s^+)\rangle_{x^+,z^+} + \langle u_s^+(\boldsymbol{u}^+_s \boldsymbol{\cdot} \boldsymbol{\nabla} u_l^+) \rangle_{x^+,z^+}, \end{gather}
 \begin{gather}T^+_{v,\updownarrow}={-}\langle v_l^+(\boldsymbol{u}^+_l\boldsymbol{\cdot} \boldsymbol{\nabla} v_s^+)\rangle_{x^+,z^+} + \langle v_s^+(\boldsymbol{u}^+_s\boldsymbol{\cdot} \boldsymbol{\nabla} v_l^+) \rangle_{x^+,z^+}, \end{gather}
 \begin{gather}T^+_{w,\updownarrow}={-}\langle w_l^+(\boldsymbol{u}^+_l\boldsymbol{\cdot} \boldsymbol{\nabla} w_s^+)\rangle_{x^+,z^+} + \langle w_s^+(\boldsymbol{u}^+_s\boldsymbol{\cdot} \boldsymbol{\nabla} w_l^+) \rangle_{x^+,z^+} \end{gather}
are streamwise, wall-normal and spanwise inter-scale turbulent transport,
 \begin{equation} \varPi^+_{ul}=\langle p_l^+(u_l^+)_{x^+} \rangle_{x^+,z^+}, \quad \varPi^+_{vl}=\langle p_l^+(v_l^+)_{y^+} \rangle_{x^+,z^+}, \quad \varPi^+_{wl}=\langle p_l^+(w_l^+)_{z^+} \rangle_{x^+,z^+} \end{equation}
are streamwise, wall-normal and spanwise pressure strain,
 \begin{equation} T^+_{p,vl}={-}\langle (p_l^+v_l^+)_{y^+} \rangle_{x^+,z^+} \end{equation}
is pressure transport,
 \begin{equation} T^+_{\nu,ul}=\tfrac{1}{2}\langle (u_l^{{+}2})_{y^+y^+}\rangle_{x^+,z^+}, \quad T^+_{\nu,vl}=\tfrac{1}{2}\langle (v_l^{{+}2})_{y^+y^+}\rangle_{x^+,z^+}, \quad T^+_{\nu,wl}=\tfrac{1}{2}\langle (w_l^{{+}2})_{y^+y^+}\rangle_{x^+,z^+} \end{equation}
are streamwise, wall-normal and spanwise viscous transport, and
 \begin{equation} \epsilon^+_{ul}={-}\langle\boldsymbol{\nabla} u_l^+\boldsymbol{\cdot} \boldsymbol{\nabla} u_l^+\rangle_{x^+,z^+}, \quad \epsilon^+_{vl}={-}\langle\boldsymbol{\nabla} v_l^+\boldsymbol{\cdot} \boldsymbol{\nabla} v_l^+\rangle_{x^+,z^+}, \quad \epsilon^+_{wl}={-}\langle\boldsymbol{\nabla} w_l^+\boldsymbol{\cdot} \boldsymbol{\nabla} w_l^+\rangle_{x^+,z^+} \end{equation}
are streamwise, wall-normal and spanwise dissipation. At small scale,
 \begin{equation} P^+_{us}={-}U^+_{y^+}\langle u_s^+v_s^+ \rangle_{x^+,z^+} \end{equation}
is turbulent production,
 \begin{gather} T^+_{us,-}={-}\langle u_s^+ (\boldsymbol{u}^+_s\boldsymbol{\cdot} \boldsymbol{\nabla} u_s^+)\rangle_{x^+,z^+}={-}\boldsymbol{\nabla} \boldsymbol{\cdot} \langle\tfrac{1}{2}(u_s^+)^2 \boldsymbol{u}_s^+\rangle_{x^+,z^+}, \end{gather}
 \begin{gather}T^+_{vs,-}={-}\langle v_s^+ (\boldsymbol{u}^+_s\boldsymbol{\cdot} \boldsymbol{\nabla} v_s^+)\rangle_{x^+,z^+}={-}\boldsymbol{\nabla} \boldsymbol{\cdot} \langle\tfrac{1}{2}(v_s^+)^2 \boldsymbol{u}_s^+\rangle_{x^+,z^+}, \end{gather}
 \begin{gather}T^+_{ws,-}={-}\langle w_s^+ (\boldsymbol{u}^+_s\boldsymbol{\cdot} \boldsymbol{\nabla} w_s^+)\rangle_{x^+,z^+}={-}\boldsymbol{\nabla} \boldsymbol{\cdot} \langle\tfrac{1}{2}(w_s^+)^2\boldsymbol{u}_s^+\rangle_{x^+,z^+} \end{gather}
are streamwise, wall-normal and spanwise intra-scale spatial turbulent transport,
 \begin{gather} T^+_{us,\#}={-}\boldsymbol{\nabla} \boldsymbol{\cdot} \langle\tfrac{1}{2}(u_s^+)^2 \boldsymbol{u}_l^+\rangle_{x^+,z^+} - \boldsymbol{\nabla} \boldsymbol{\cdot} \langle u_l^+u_s^+ \boldsymbol{u}_l^+\rangle_{x^+,z^+}, \end{gather}
 \begin{gather}T^+_{vs,\#}={-}\boldsymbol{\nabla} \boldsymbol{\cdot} \langle\tfrac{1}{2}(v_s^+)^2 \boldsymbol{u}_l^+\rangle_{x^+,z^+} - \boldsymbol{\nabla} \boldsymbol{\cdot} \langle v_l^+v_s^+\boldsymbol{u}_l^+\rangle_{x^+,z^+}, \end{gather}
 \begin{gather}T^+_{ws,\#}={-}\boldsymbol{\nabla} \boldsymbol{\cdot} \langle\tfrac{1}{2}(w_s^+)^2\boldsymbol{u}_l^+\rangle_{x^+,z^+} - \boldsymbol{\nabla} \boldsymbol{\cdot} \langle w_l^+w_s^+\boldsymbol{u}_l^+\rangle_{x^+,z^+} \end{gather}
are streamwise, wall-normal and spanwise inter-scale spatial turbulent transport,
 \begin{gather} T^+_{u,\updownarrow}= \langle u_l^+(\boldsymbol{u}^+_l\boldsymbol{\cdot} \boldsymbol{\nabla} u_s^+)\rangle_{x^+,z^+} - \langle u_s^+(\boldsymbol{u}^+_s\boldsymbol{\cdot} \boldsymbol{\nabla} u_l^+) \rangle_{x^+,z^+}, \end{gather}
 \begin{gather}T^+_{v,\updownarrow}= \langle v_l^+(\boldsymbol{u}^+_l\boldsymbol{\cdot} \boldsymbol{\nabla} v_s^+)\rangle_{x^+,z^+} - \langle v_s^+(\boldsymbol{u}^+_s\boldsymbol{\cdot} \boldsymbol{\nabla} v_l^+) \rangle_{x^+,z^+}, \end{gather}
 \begin{gather}T^+_{w,\updownarrow}= \langle w_l^+(\boldsymbol{u}^+_l\boldsymbol{\cdot} \boldsymbol{\nabla} w_s^+)\rangle_{x^+,z^+} - \langle w_s^+(\boldsymbol{u}^+_s\boldsymbol{\cdot} \boldsymbol{\nabla} w_l^+) \rangle_{x^+,z^+} \end{gather}
are streamwise, wall-normal and spanwise inter-scale turbulent transport,
 \begin{equation} \varPi^+_{us}=\langle p_s^+(u_s^+)_{x^+} \rangle_{x^+,z^+}, \quad \varPi^+_{vs}=\langle p_s^+(v_s^+)_{y^+} \rangle_{x^+,z^+}, \quad \varPi^+_{ws}=\langle p_s^+(w_s^+)_{z^+} \rangle_{x^+,z^+} \end{equation}
are streamwise, wall-normal and spanwise pressure strain,
 \begin{equation} T^+_{p,vs}={-}\langle (p_s^+v_s^+)_{y^+} \rangle_{x^+,z^+} \end{equation}
is pressure transport,
 \begin{equation} T^+_{\nu,us}=\tfrac{1}{2}\langle (u_s^{{+}2})_{y^+y^+}\rangle_{x^+,z^+}, \quad T^+_{\nu,vs}=\tfrac{1}{2}\langle (v_s^{{+}2})_{y^+y^+}\rangle_{x^+,z^+}, \quad T^+_{\nu,ws}=\tfrac{1}{2}\langle (w_s^{{+}2})_{y^+y^+}\rangle_{x^+,z^+} \end{equation}
are streamwise, wall-normal and spanwise viscous transport, and
 \begin{equation} \epsilon^+_{us}={-}\langle\boldsymbol{\nabla} u_s^+\boldsymbol{\cdot} \boldsymbol{\nabla} u_s^+\rangle_{x^+,z^+}, \quad \epsilon^+_{vs}={-}\langle\boldsymbol{\nabla} v_s^+\boldsymbol{\cdot} \boldsymbol{\nabla} v_s^+\rangle_{x^+,z^+}, \quad \epsilon^+_{ws}={-}\langle\boldsymbol{\nabla} w_s^+\boldsymbol{\cdot} \boldsymbol{\nabla} w_s^+\rangle_{x^+,z^+} \end{equation}
are streamwise, wall-normal and spanwise dissipation.



