



Non-technical Summary
In the last ten million years before the Cambrian Explosion, groundbreaking early animals started to make shells. Fossils of these shells can be found worldwide, but making sense of how these animals might have been related and what their ecosystems looked like remain important questions. Here, we reevaluate shelly fossils that were first reported in the 1980s from northwestern Mexico in an effort to compare them to other reinvigorated and similar fossil deposits in the southwestern USA. Using a wide range of approaches, including standard microscopy, thin-section preparation, and electron and x-ray microscopy, we found that these Mexican shells: (1) represent multiple distinct groups of animals; (2) are preserved in a couple of different ways; (3) show signs that their shells might not have been overly rigid or inflexible; and (4) might also show indications that predators had punctured or drilled into their shells. Along with ongoing efforts elsewhere around the world, studies of the fossil record just before life's first large diversification event will help to provide a framework for global correlation and illuminate the earliest evolutionary and ecological dynamics of animals.
Introduction
The fossil record of the terminal Ediacaran Period (~550–538 Ma) captures a dynamic interval in Earth history when skeletal animals first appeared in abundance (e.g., Hua at al., Reference Hua, Chen, Yuan, Zhang and Xiao2005; Murdock and Donoghue, Reference Murdock and Donoghue2011; Schiffbauer et al., Reference Schiffbauer, Huntley, O'Neil, Darroch, Laflamme and Cai2016). While these early biomineralizing animals were diversifying, the organisms of the classic Ediacaran biota (i.e., the White Sea Assemblage; Waggoner, Reference Waggoner2003; Muscente et al., Reference Muscente, Bykova, Boag, Buatois and Mángano2019) were becoming increasingly scarce (e.g., Darroch et al., Reference Darroch, Smith, Laflamme and Erwin2018; Muscente et al., Reference Muscente, Boag, Bykova and Schiffbauer2018), and the nature of the subsequent fossil record became indefinitely altered (e.g., Knoll, Reference Knoll2003). Among the earliest abundant skeletal animals, the latest Ediacaran cloudinomorphs (as defined by Selly et al., Reference Selly, Schiffbauer, Jacquet, Smith and Nelson2020), after their namesake Cloudina Germs, Reference Germs1972, represent a diverse morphoclade of tubular organisms built of repetitive cone-in-cone or funnel-shaped units (Germs, Reference Germs1972; Hua et al., Reference Hua, Chen, Yuan, Zhang and Xiao2005). Although many of these forms produced biomineralized tubes, others composed their skeletons from robust and recalcitrant organic materials or were only lightly biomineralized (e.g., Hua et al. Reference Hua, Chen, Yuan, Zhang and Xiao2005; Cai et al., Reference Cai, Schiffbauer, Hua and Xiao2011; Schiffbauer et al., Reference Schiffbauer, Xiao, Cai, Wallace, Hua, Hunter, Xu, Peng and Kaufman2014, Reference Schiffbauer, Selly, Jacquet, Merz, Nelson, Strange, Cai and Smith2020; Selly et al., Reference Selly, Schiffbauer, Jacquet, Smith and Nelson2020; Yang et al., Reference Yang, Steiner, Schiffbauer, Selly, Wu, Zhang and Liu2020). Although they commonly occur with other taxa like Corumbella Hahn et al., Reference Hahn, Hahn, Leonardos, Pflug and Walde1982, Namacalathus Grotzinger, Watters, and Knoll, Reference Grotzinger, Watters and Knoll2000, and Namapoikia Wood, Grotzinger, and Dickson, Reference Wood, Grotzinger and Dickson2002 (e.g., Warren et al., Reference Warren, Quaglio, Simões, Gaucher, Riccomini, Poiré, Freitas, Boggiani and Sial2017; Wood, Reference Wood2017), Cloudina is often the dominant taxon in the beds in which they occur, including possible reef communities (Penny et al., Reference Penny, Wood, Curtis, Bowyer, Tostevin and Hoffman2014; but see Mehra and Maloof, Reference Mehra and Maloof2018, for an alternative interpretation). Cloudina was first described from the Nama Group, Namibia (Germs, Reference Germs1972), but has since been described from a geologically short timespan across globally distributed units, including Brazil (e.g., Zaine and Fairchild, Reference Zaine and Fairchild1987; Becker-Kerber et al., Reference Becker-Kerber, Pacheco, Rudnitzki, Galante, Rodrigues and Leme2017), Spain (e.g., Cortijo et al., Reference Cortijo, Mus, Jensen and Palacios2015), China (e.g., Cai et al., Reference Cai, Cortijo, Schiffbauer and Hua2017), Oman (e.g., Amthor et al., Reference Amthor, Grotzinger, Schröder, Bowring, Ramezani, Martin and Matter2003), the southwestern United States (e.g., Grant, Reference Grant1990), and several others—establishing Cloudina as perhaps the most useful index fossil for the terminal Ediacaran interval (Grant, Reference Grant1990; Warren et al., Reference Warren, Fairchild, Gaucher, Boggiani, Poiré, Anelli and Inchausti2011, Reference Warren, Quaglio, Riccomini, Simões, Poire, Strikis, Anelli and Strikis2014; Chai et al., Reference Chai, Wu and Hua2021).
Often co-occurring with Cloudina, although less common, another widespread biomineralizing tubular organism of the late Ediacaran is Sinotubulites Chen, Chen, and Qian, Reference Chen, Chen and Qian1981. Instead of the cloudinomorph funnel-in-funnel morphology, Sinotubulites exhibits a tube-in-tube morphology with annular and sometimes longitudinal ridges (Chen et al., Reference Chen, Chen and Qian1981, Reference Chen, Bengtson, Zhou, Hua and Yue2008). In transverse cross section, Sinotubulites can exhibit circular to polygonal profiles, each of which has been conferred a different species designation (Cai et al., Reference Cai, Xiao, Hua and Yuan2015). Best known from several localities in South China, Sinotubulites has additionally been observed in Mexico and the southwestern USA (e.g., McMenamin, Reference McMenamin1985; Signor et al., Reference Signor, Mount and Onken1987; but also see Zhuravlev et al., Reference Zhuravlev, Liñán, Vintaned, Debrenne and Fedorov2012, who informally reclassified those from the southwestern USA as cloudinid steinkerns), Brazil (e.g., Yang et al., Reference Yang, Warren, Steiner, Smith and Liu2022), Spain (e.g., Cortijo et al., Reference Cortijo, Mus, Jensen and Palacios2015), and Namibia (e.g., Yang et al., Reference Yang, Warren, Steiner, Smith and Liu2022). Although other examples of predation on Cloudina have been inferred from possible drillholes or puncture marks in their skeletal tubes (e.g., Bengtson and Yue, Reference Bengtson and Yue1992; Becker-Kerber et al., Reference Becker-Kerber, Pacheco, Rudnitzki, Galante, Rodrigues and Leme2017), in at least one assemblage where Sinotubulites and Cloudina co-occur, Cloudina exhibited these marks whereas they were absent on the tubes of Sinotubulites (Hua et al., Reference Hua, Pratt and Zhang2003). This evidence plausibly suggests prey specificity or selectivity in early predator-prey dynamics, and nonetheless signals the increasing complexity of ecosystem interactions (Schiffbauer et al., Reference Schiffbauer, Huntley, O'Neil, Darroch, Laflamme and Cai2016).
In the upper Ediacaran La Ciénega Formation in Sonora, Mexico, a variety of tubular fossils have been reported. These appear as steinkerns, as external molds in dolomite, and as silica-replaced fossils (Hagadorn et al., Reference Hagadorn, Fedo and Waggoner2000; Sour-Tovar et al., Reference Sour-Tovar, Hagadorn and Huitrón-Rubio2007). The fossils from this region were initially identified by McMenamin (Reference McMenamin1985) as sinotubulitids, cambrotubulids, and circothecids, with no mention of observed cloudinomorph-type funnel-in-funnel structures. As reassessed by Grant (Reference Grant1990), these fossils were reclassified as cloudinids, arguing that the specimens of Sinotubulites initially described were instead Cloudina with compactional folds that gave the appearance of the longitudinal striae of Sinotubulites. Sour-Tovar et al. (Reference Sour-Tovar, Hagadorn and Huitrón-Rubio2007) and Zhuravlev et al. (Reference Zhuravlev, Liñán, Vintaned, Debrenne and Fedorov2012) interpreted these Ediacaran cloudiniids as steinkerns, external molds, and silica-replaced fossils of Cloudina hartmannae Germs, Reference Germs1972 from etched dolomite blocks. Recently, however, the organisms that Sour-Tovar et al. (Reference Sour-Tovar, Hagadorn and Huitrón-Rubio2007) reported as silica-replaced cloudinids have been taxonomically reassigned within the sinotubulitids, and synonymized with Sinotubulites baimatuoensis Chen, Chen, and Qian, Reference Chen, Chen and Qian1981 (Yang et al., Reference Yang, Warren, Steiner, Smith and Liu2022). Nonetheless, in light of the volume of recent work on tubular Ediacaran organisms as well as the back-and-forth appraisal of the La Ciénega organisms, the diversity, preservation, and ecology of this assemblage merits close reevaluation. Here, we examine tubular specimens from a silicified coquina bed within the La Ciénega Formation and compare them to contemporaneous assemblages in the southwestern United States (Cloud and Nelson, Reference Cloud and Nelson1966; Taylor, Reference Taylor1966; Mount et al., Reference Mount, Gevirtzman and Signor1983; Signor et al., Reference Signor, McMenamin, Gevirtzman and Mount1983, Reference Signor, Mount and Onken1987; Smith et al., Reference Smith, Nelson, Strange, Eyster, Rowland, Schrag and Macdonald2016, Reference Smith, Nelson, Tweedt, Zeng and Workman2017; Hagadorn and Waggoner, Reference Hagadorn and Waggoner2000; Selly et al., Reference Selly, Schiffbauer, Jacquet, Smith and Nelson2020). Using modern methodologies of imaging and analysis, our observations provide new insights into the community structure of the La Ciénega assemblage, inform aspects of their taphonomy, and reveal the nature and construction of their skeletal tubes in vivo.
Geologic setting
The Caborca block in Sonora, Mexico, preserves well-exposed sections of late Neoproterozoic–early Paleozoic sedimentary strata deposited in shallow-marine environments during rifting and subsequent passive-margin development in southern Laurentia (e.g., Stewart et al., Reference Stewart, McMenamin and Morales-Ramirez1984). Near the city of Caborca (Fig. 1.1, yellow star), the lowest relative age constraint within the Ediacaran succession comes from the Clemente Formation, which contains a distinctive oolitic unit that is chemostratigraphically correlated to the ~574–567 Shuram-Wonoka carbon isotope excursion (Fig. 1; Loyd et al., Reference Loyd, Marenco, Hagadorn, Lyons, Kaufman, Sour-Tovar and Corsetti2012; Rooney et al., Reference Rooney, Cantine, Bergmann, Gómez-Pérez, Al Baloushi, Boag, Busch, Sperling and Strauss2020). The Ediacaran-Cambrian transition occurs within the stratigraphically higher La Ciénega and Cerro Rajón formations, which preserve the basal Cambrian carbon isotope excursion (BACE) and the index fossil Treptichnus pedum Seilacher, Reference Seilacher1955, respectively (Fig. 1; Sour-Tovar et al., Reference Sour-Tovar, Hagadorn and Huitrón-Rubio2007; Loyd et al., Reference Loyd, Marenco, Hagadorn, Lyons, Kaufman, Sour-Tovar and Corsetti2012; Barrón-Díaz et al., Reference Barrón-Díaz, Paz-Moreno and Hagadorn2019; Hodgin et al., Reference Hodgin, Nelson, Wall, Barrón-Díaz, Webb, Schmitz, Fike, Hagadorn and Smith2021). Isotope dilution thermal ionization mass spectrometry (ID-TIMS) U-Pb isotopic analyses of detrital zircons from an epiclastic bed above the nadir of this carbon isotope excursion demonstrates a maximum depositional age of 539.40 ± 0.23 Ma for the upper part of the La Ciénega Formation, confirming its latest Ediacaran age (Hodgin et al., Reference Hodgin, Nelson, Wall, Barrón-Díaz, Webb, Schmitz, Fike, Hagadorn and Smith2021).
Locality map and stratigraphy of the Cerro Clemente section: (1) Map indicating position of Caborca localities (yellow star) in northern Mexico, and plausibly correlative fossiliferous units (grey stars) in the southwestern USA (e.g., Smith et al., Reference Smith, Nelson, Strange, Eyster, Rowland, Schrag and Macdonald2016; Selly et al., Reference Selly, Schiffbauer, Jacquet, Smith and Nelson2020; Nelson et al., Reference Nelson, Crowley, Smith, Schwartz, Hodgin and Schmitz2023). (2) Satellite image from Google Earth denoting the topography of the Cerro Clemente section with longitude and latitude markers. (3) Geologic map corresponding to the same map view in (2), after Hodgin et al. (Reference Hodgin, Nelson, Wall, Barrón-Díaz, Webb, Schmitz, Fike, Hagadorn and Smith2021). (4) Photograph of collected coquina block. (5) Stratigraphic section with carbon isotope chemostratigraphy after Hodgin et al. (Reference Hodgin, Nelson, Wall, Barrón-Díaz, Webb, Schmitz, Fike, Hagadorn and Smith2021), showing position of U-Pb radiometric date (green star) and sampled fossil horizon (yellow star).
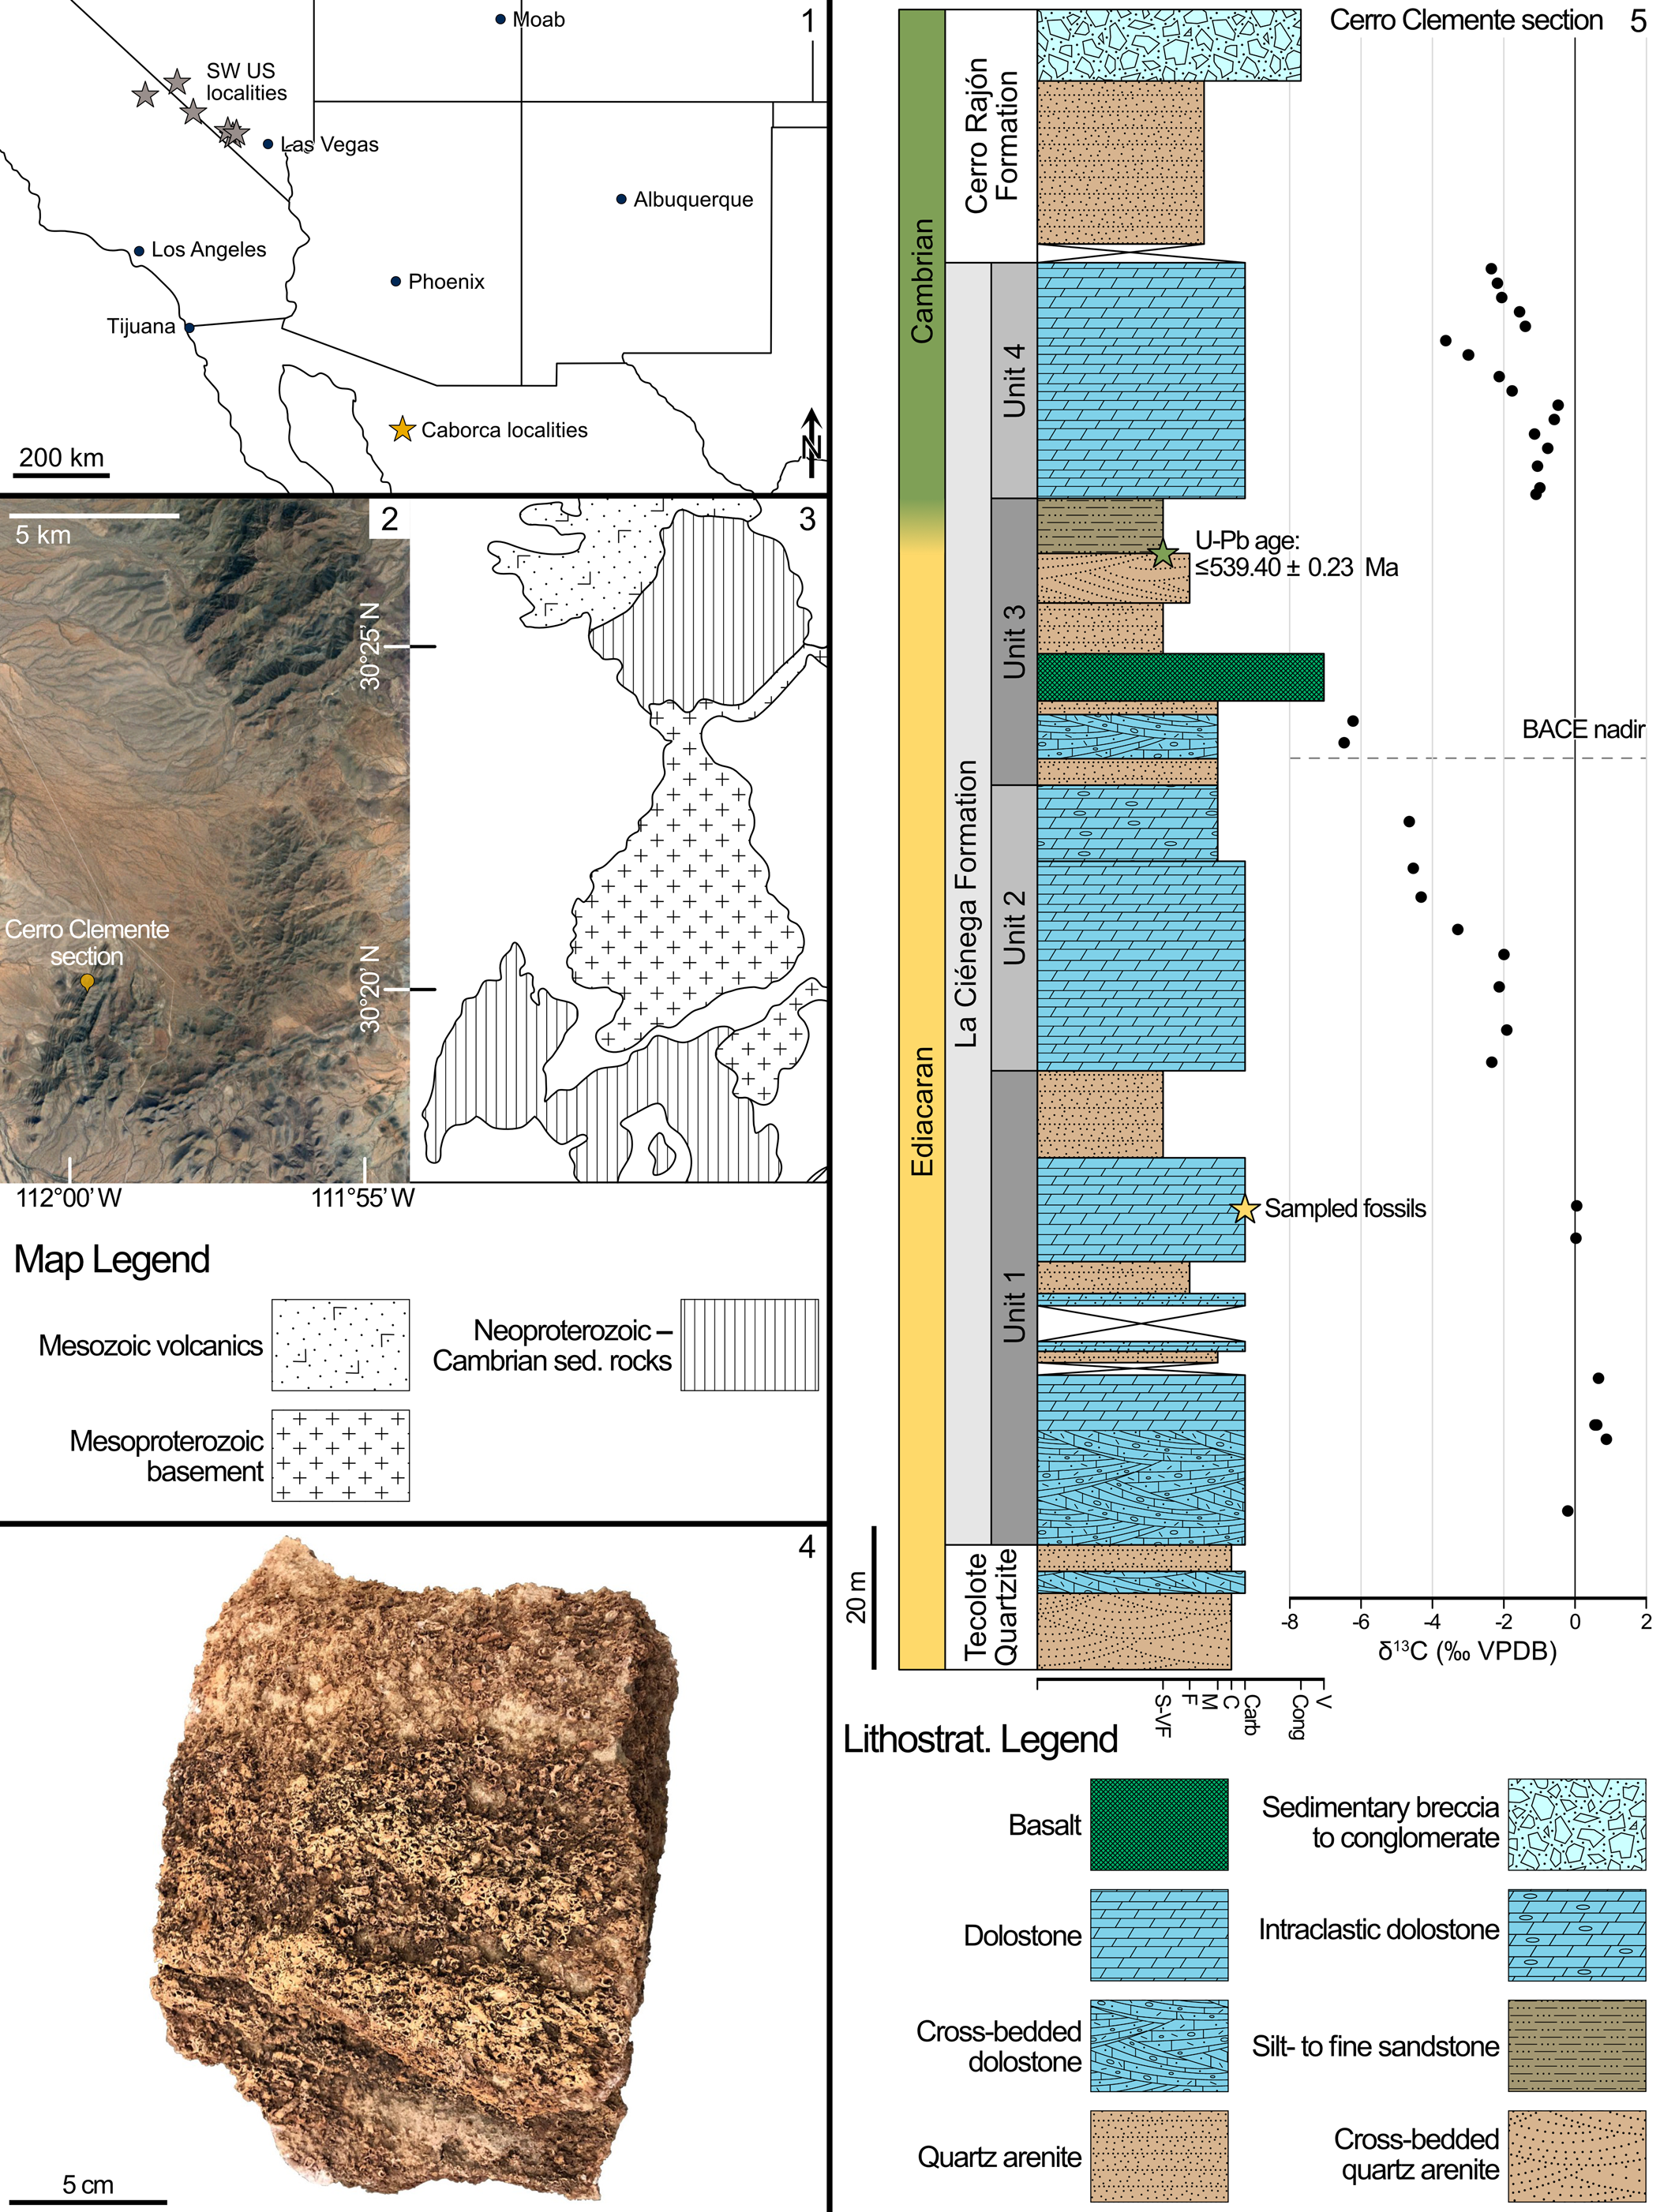
The La Ciénega Formation has been divided into four units (Units 1 through 4) and is primarily dolomitic grainstone (dolograinstone) with thinner intervals of siltstone to sandstone, as well as minor basaltic horizons (Stewart et al., Reference Stewart, McMenamin and Morales-Ramirez1984; Hodgin et al., Reference Hodgin, Nelson, Wall, Barrón-Díaz, Webb, Schmitz, Fike, Hagadorn and Smith2021). Below the carbon isotope excursion, Unit 1 of the La Ciénega Formation is primarily cross-bedded dolograinstone, with intervals of oolite, and sandy dolograinstone with minor interbedded quartz sandstone. The uppermost interval of Unit 1 is composed of micaceous siltstone to sandstone, representing a comparatively lower energy depositional environment (Hodgin et al., Reference Hodgin, Nelson, Wall, Barrón-Díaz, Webb, Schmitz, Fike, Hagadorn and Smith2021). Tubular fossils examined in this study are preserved in wackestone to packstone coquinas within a < 5 m stratigraphic interval that occurs in a consistent stratigraphic position in the upper carbonates of Unit 1 across three measured sections—Cerro Rajón, Cerro Clemente, and Cerro San Agustín—along 15–25 km of strike (Hodgin et al., Reference Hodgin, Nelson, Wall, Barrón-Díaz, Webb, Schmitz, Fike, Hagadorn and Smith2021). These late Ediacaran fossiliferous beds are dolomitic, or selectively to pervasively silicified (McMenamin, Reference McMenamin1985; Sour-Tovar et al., Reference Sour-Tovar, Hagadorn and Huitrón-Rubio2007). Tubular fossils are also preserved as casts and molds and by iron-oxide replacement (presumably after pyritization like in the southwestern USA; Selly et al., Reference Selly, Schiffbauer, Jacquet, Smith and Nelson2020) within siltstone to fine-grained sandstone in the upper siliciclastic interval of Unit 1 (Hodgin et al., Reference Hodgin, Nelson, Wall, Barrón-Díaz, Webb, Schmitz, Fike, Hagadorn and Smith2021).
Regionally, tubular fossils occur in contemporaneous late Ediacaran strata further north along the Cordilleran margin of Laurentia in Nevada and southeastern California where they are preserved within limestone and dolostone coquina in the Reed Dolomite and lower Deep Spring Formation (Cloud and Nelson, Reference Cloud and Nelson1966; Taylor, Reference Taylor1966; Mount et al., Reference Mount, Gevirtzman and Signor1983; Signor et al., Reference Signor, McMenamin, Gevirtzman and Mount1983, Reference Signor, Mount and Onken1987) and within siltstone and fine-grained sandstone as casts and molds, as compressions, and by pyrite replacement in the Deep Spring Formation and the lower member of the Wood Canyon Formation (Hagadorn and Waggoner, Reference Hagadorn and Waggoner2000; Smith et al., Reference Smith, Nelson, Strange, Eyster, Rowland, Schrag and Macdonald2016, Reference Smith, Nelson, Tweedt, Zeng and Workman2017; Selly et al., Reference Selly, Schiffbauer, Jacquet, Smith and Nelson2020). Based on lithostratigraphic and chemostratigraphic correlations along with the occurrences of tubular body fossils, the La Ciénega Formation has been proposed to be broadly correlative to the Deep Spring and Wood Canyon formations in the southwestern USA (e.g., Stewart et al., Reference Stewart, McMenamin and Morales-Ramirez1984; Sour-Tovar et al., Reference Sour-Tovar, Hagadorn and Huitrón-Rubio2007; Smith et al., Reference Smith, Nelson, Strange, Eyster, Rowland, Schrag and Macdonald2016; Hodgin et al., Reference Hodgin, Nelson, Wall, Barrón-Díaz, Webb, Schmitz, Fike, Hagadorn and Smith2021; Nelson et al., Reference Nelson, Crowley, Smith, Schwartz, Hodgin and Schmitz2023; Fig. 1.1, gray stars), although there remains a need to confirm equivalent taxic compositions of these assemblages.
Materials and methods
One large block sample, measuring ~15 × 10 × 10 cm (Fig. 1.4), was collected from the single observed silicified coquina bed within the La Ciénega Formation at the Cerro Clemente section (Hodgin et al., Reference Hodgin, Nelson, Wall, Barrón-Díaz, Webb, Schmitz, Fike, Hagadorn and Smith2021, fig. 2D, E). This sample was partitioned for multiple analytical purposes, including approximately one-eighth of the total volume for acid dissolution using ~10% acetic acid. The nonsoluble residues were collected, washed, and separated into > 420 μm, > 250 μm, and > 180 μm size fractions. Fossils with identifiable structures were examined with light microscopy, and selected samples were prepared for scanning electron microscopy (SEM).
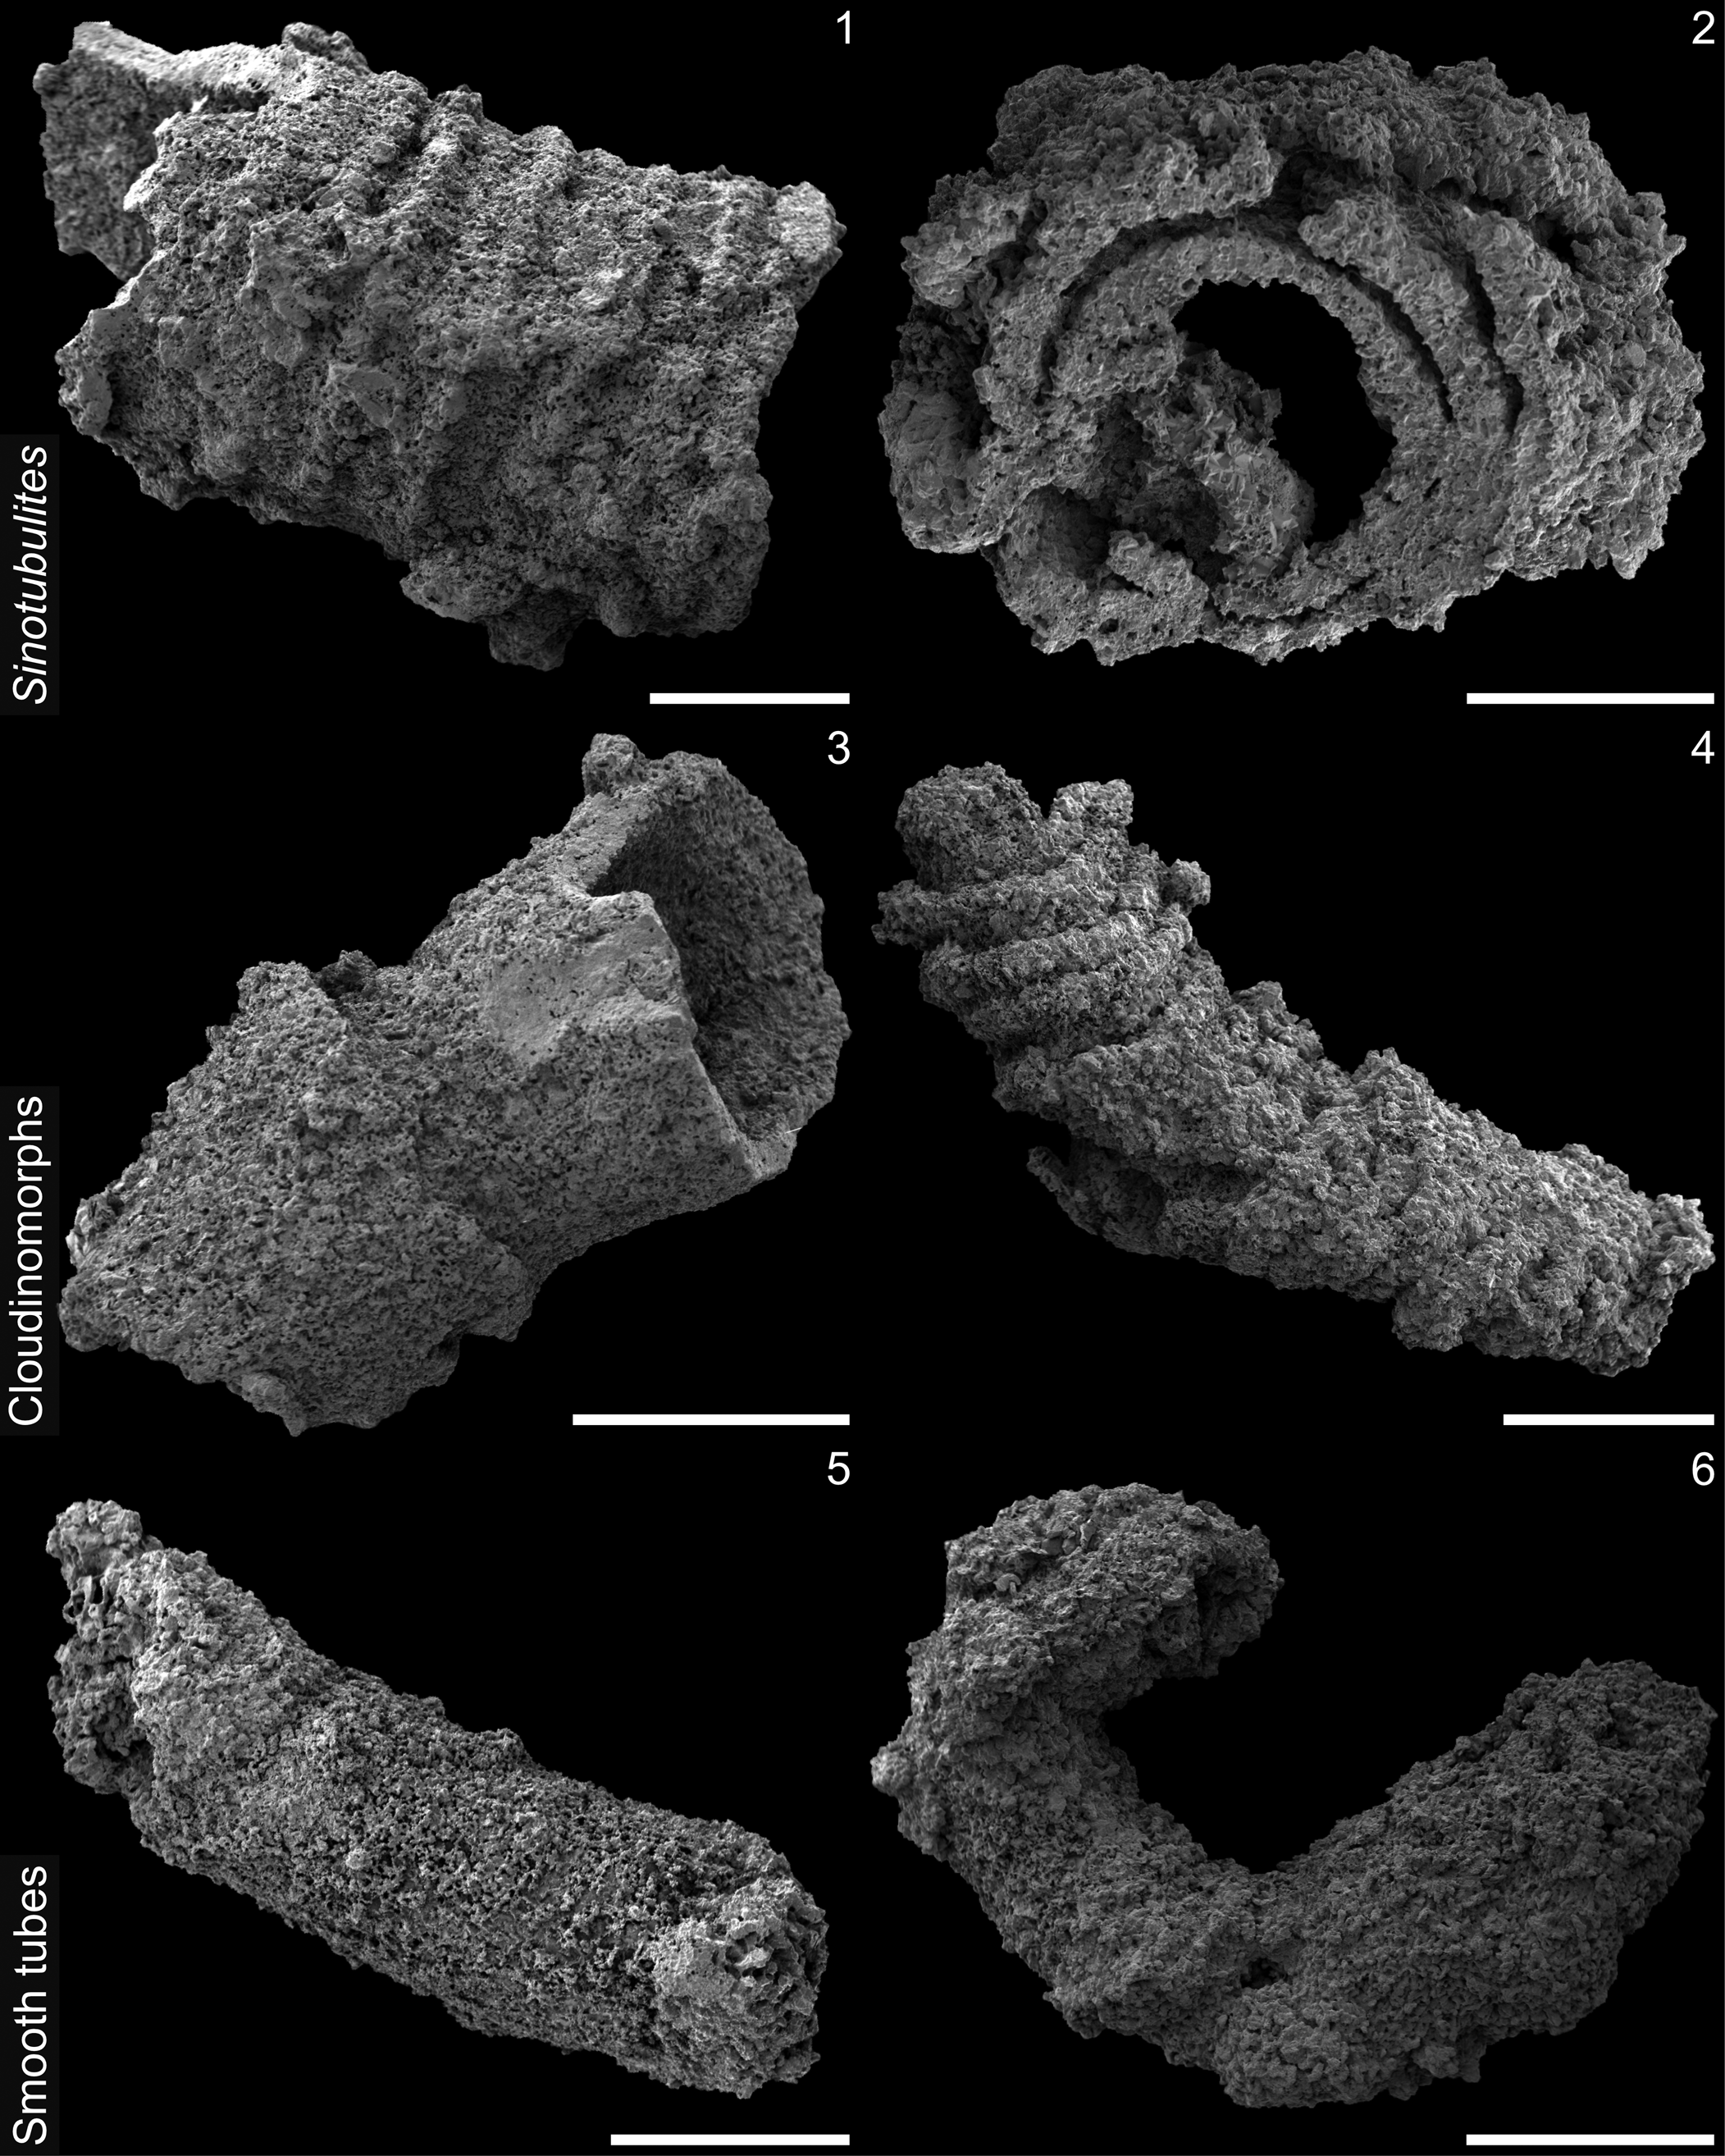
SEM analyses were conducted at the Smith College Center for Microscopy and Imaging using a FEI Quanta 450 with the following operating conditions: high chamber vacuum; working distance ~13 mm; beam voltage 5 keV; and spot size 6.0. Elemental analyses to assess the composition of the fossils were conducted using an EDAX Octane Elect Plus energy dispersive X-ray spectrometer (EDS) and processed using EDAX TEAM software. Basic morphological measurements of the extracted fossils were assessed from SEM images using FIJI (Schindelin et al., Reference Schindelin, Arganda-Carreras, Frise, Kaynig and Longair2012). These measurements include specimen width and length, as well as the inner tube width and wall thickness when visible. We note that these measurements were only performed on extracted fossils, which excluded fossils only visible in thin- or thick-section analyses. From our observations of the gross morphologies of the extracted fossils, we devised five form categories: (form 1) tube-in-tube structures, showing annular ridges and possible laminae in cross section when visible; (form 2) nonrimmed funnel-in-funnel tubes, exhibiting tapered and tight-fitting funnels with little to no visible apertural rim; (form 3) rimmed funnel-in-funnel tubes, also showing tapered funnels but with thickened or pronounced rims; and two morphologically simple categories of straight (form 4) or curved (form 5) smooth-walled tubes. Representatives of all forms are shown in Figure 2. Summary statistics (Table 1) and Mann-Whitney U pairwise tests for comparison of maximum widths (Table 2) were conducted in PAST4 (Hammer et al., Reference Hammer, Harper and Ryan2001).
Morphological groupings of fossils (SEM). (1, 2) Form 1, sinotubulitids in lateral (1) and cross-sectional (2) views: (1) lateral view showing diagnostic transverse corrugations; (2) cross section illustrating multiple tube-in-tube construction, with substantial silica overgrowth. (3, 4) Forms 2 and 3, cloudinomorphs, Cloudina sp. indet. (3) and cf. Saarina sp. indet. (4): (3) Cloudina with two nested funnel units and no thickened apertural rims; (4) the other cloudinomorph form showing thickened apertural rims with observable drooping imbrication. Also note slight change in growth direction or plastic deformation at tube midpoint, along with slight tubular compression. (5, 6) Forms 4 and 5, smooth tubes that are either straight (5) or sinuous (6). Scale bars = 1 mm (1, 3, 4, 6), 500 μm (2, 5).
Diagnostic size ranges and means by form grouping. “Forms 4 & 5 grouped together for size reporting.” NA = not applicable. All measurements in mm.

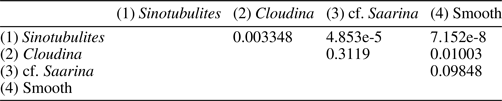
Mann-Whitney U pairwise evaluation of maximum widths of form groupings. All pairwise evaluations are significant at an alpha of 0.1, with the exception of the comparison of Cloudina and cf. Saarina sp. indet.
In addition, two petrographic thin sections were prepared and photographed. A polished thick section was also prepared and examined using a Zeiss Sigma 500 VP SEM at the University of Missouri X-ray Microanalysis Laboratory, where a large-area backscattered electron mosaic was collected using the Fibics ATLAS interface (chamber vacuum 25 Pa with a 99.999% dry nitrogen atmosphere; working distance 16 mm; beam voltage 20 keV; current 20 nA; aperture 30 μm). EDS elemental maps were also conducted from this thick section using dual Bruker XFlash spectrometers and processed using Bruker ESPRIT software. Also at the X-ray Microanalysis Laboratory, hand samples of fossil-bearing rock were imaged with a Zeiss Xradia 510 Versa X-ray tomographic microscope (μCT) to reconstruct the three-dimensional morphology of tubular fossils within their host rock. Operating conditions for μCT analyses were: beam voltage 150 kV; power 10 W; high energy beam filter (either the HE2 or HE4 Zeiss filters were used); exposure time ranged from 1–4 sec depending on transmittance values; projections through 360° rotation were selected at 1601, 2401, or 3001; all scans were conducted using the 0.4× detector; voxel resolution ranged from 33.668–55.647 μm. All resulting μCT data were processed in ORS Dragonfly.
Repositories and institutional abbreviations
UCMP = University of California Museum of Paleontology, Berkeley. Figured and other specimens examined in this study are deposited at Smith College, Northampton, Massachusetts, USA or the University of Missouri, Columbia, Missouri, USA.
Results
General morphologies and size distributions
Using the above-described morphological groupings as a guide for categorization, we were able to characterize 106 acid-extracted tubular fossils as follows: (form 1) N = 33, tube-in-tube tubes; (form 2) N = 20, nonrimmed funnel-in-funnel tubes; (form 3) N = 23, rimmed funnel-in-funnel tubes; (form 4) N = 20, straight smooth-walled tubes; and (form 5) N = 10, curved or sinuous smooth-walled tubes (Fig. 3). By form grouping, this was a relatively even distribution, with a Shannon diversity index of 1.55 and evenness 0.96. Taken together, the cloudinomorphs, comprising forms 2 and 3, were dominant, making up just over 40% of the total assemblage. Based on their tube construction, we consider the demonstrably tube-in-tube fossils with annular ridges (form 1) as sinotubulitids, which occupy ~31% of the assemblage. The other 28% of the assemblage is made of the collective smooth-walled forms (forms 4 and 5), which lack any notably distinguishing characteristics.
Fossil size distributions and assemblage structure. Violin and jitter plots of maximum width distributions across our five form groupings, from largest to smallest: form 1, Sinotubulites; form 2, Cloudina sp. indet.; form 3, cf. Saarina sp. indet.; form 4 and 5 combined, smooth tubes. White horizontal lines indicate median in each group; white vertical brackets show upper and lower 95% confidence intervals around the mean from 10,000 iteration bootstrap performed in PAST4. Pie chart at upper right showing proportion of the fossil assemblage occupied by each form grouping.
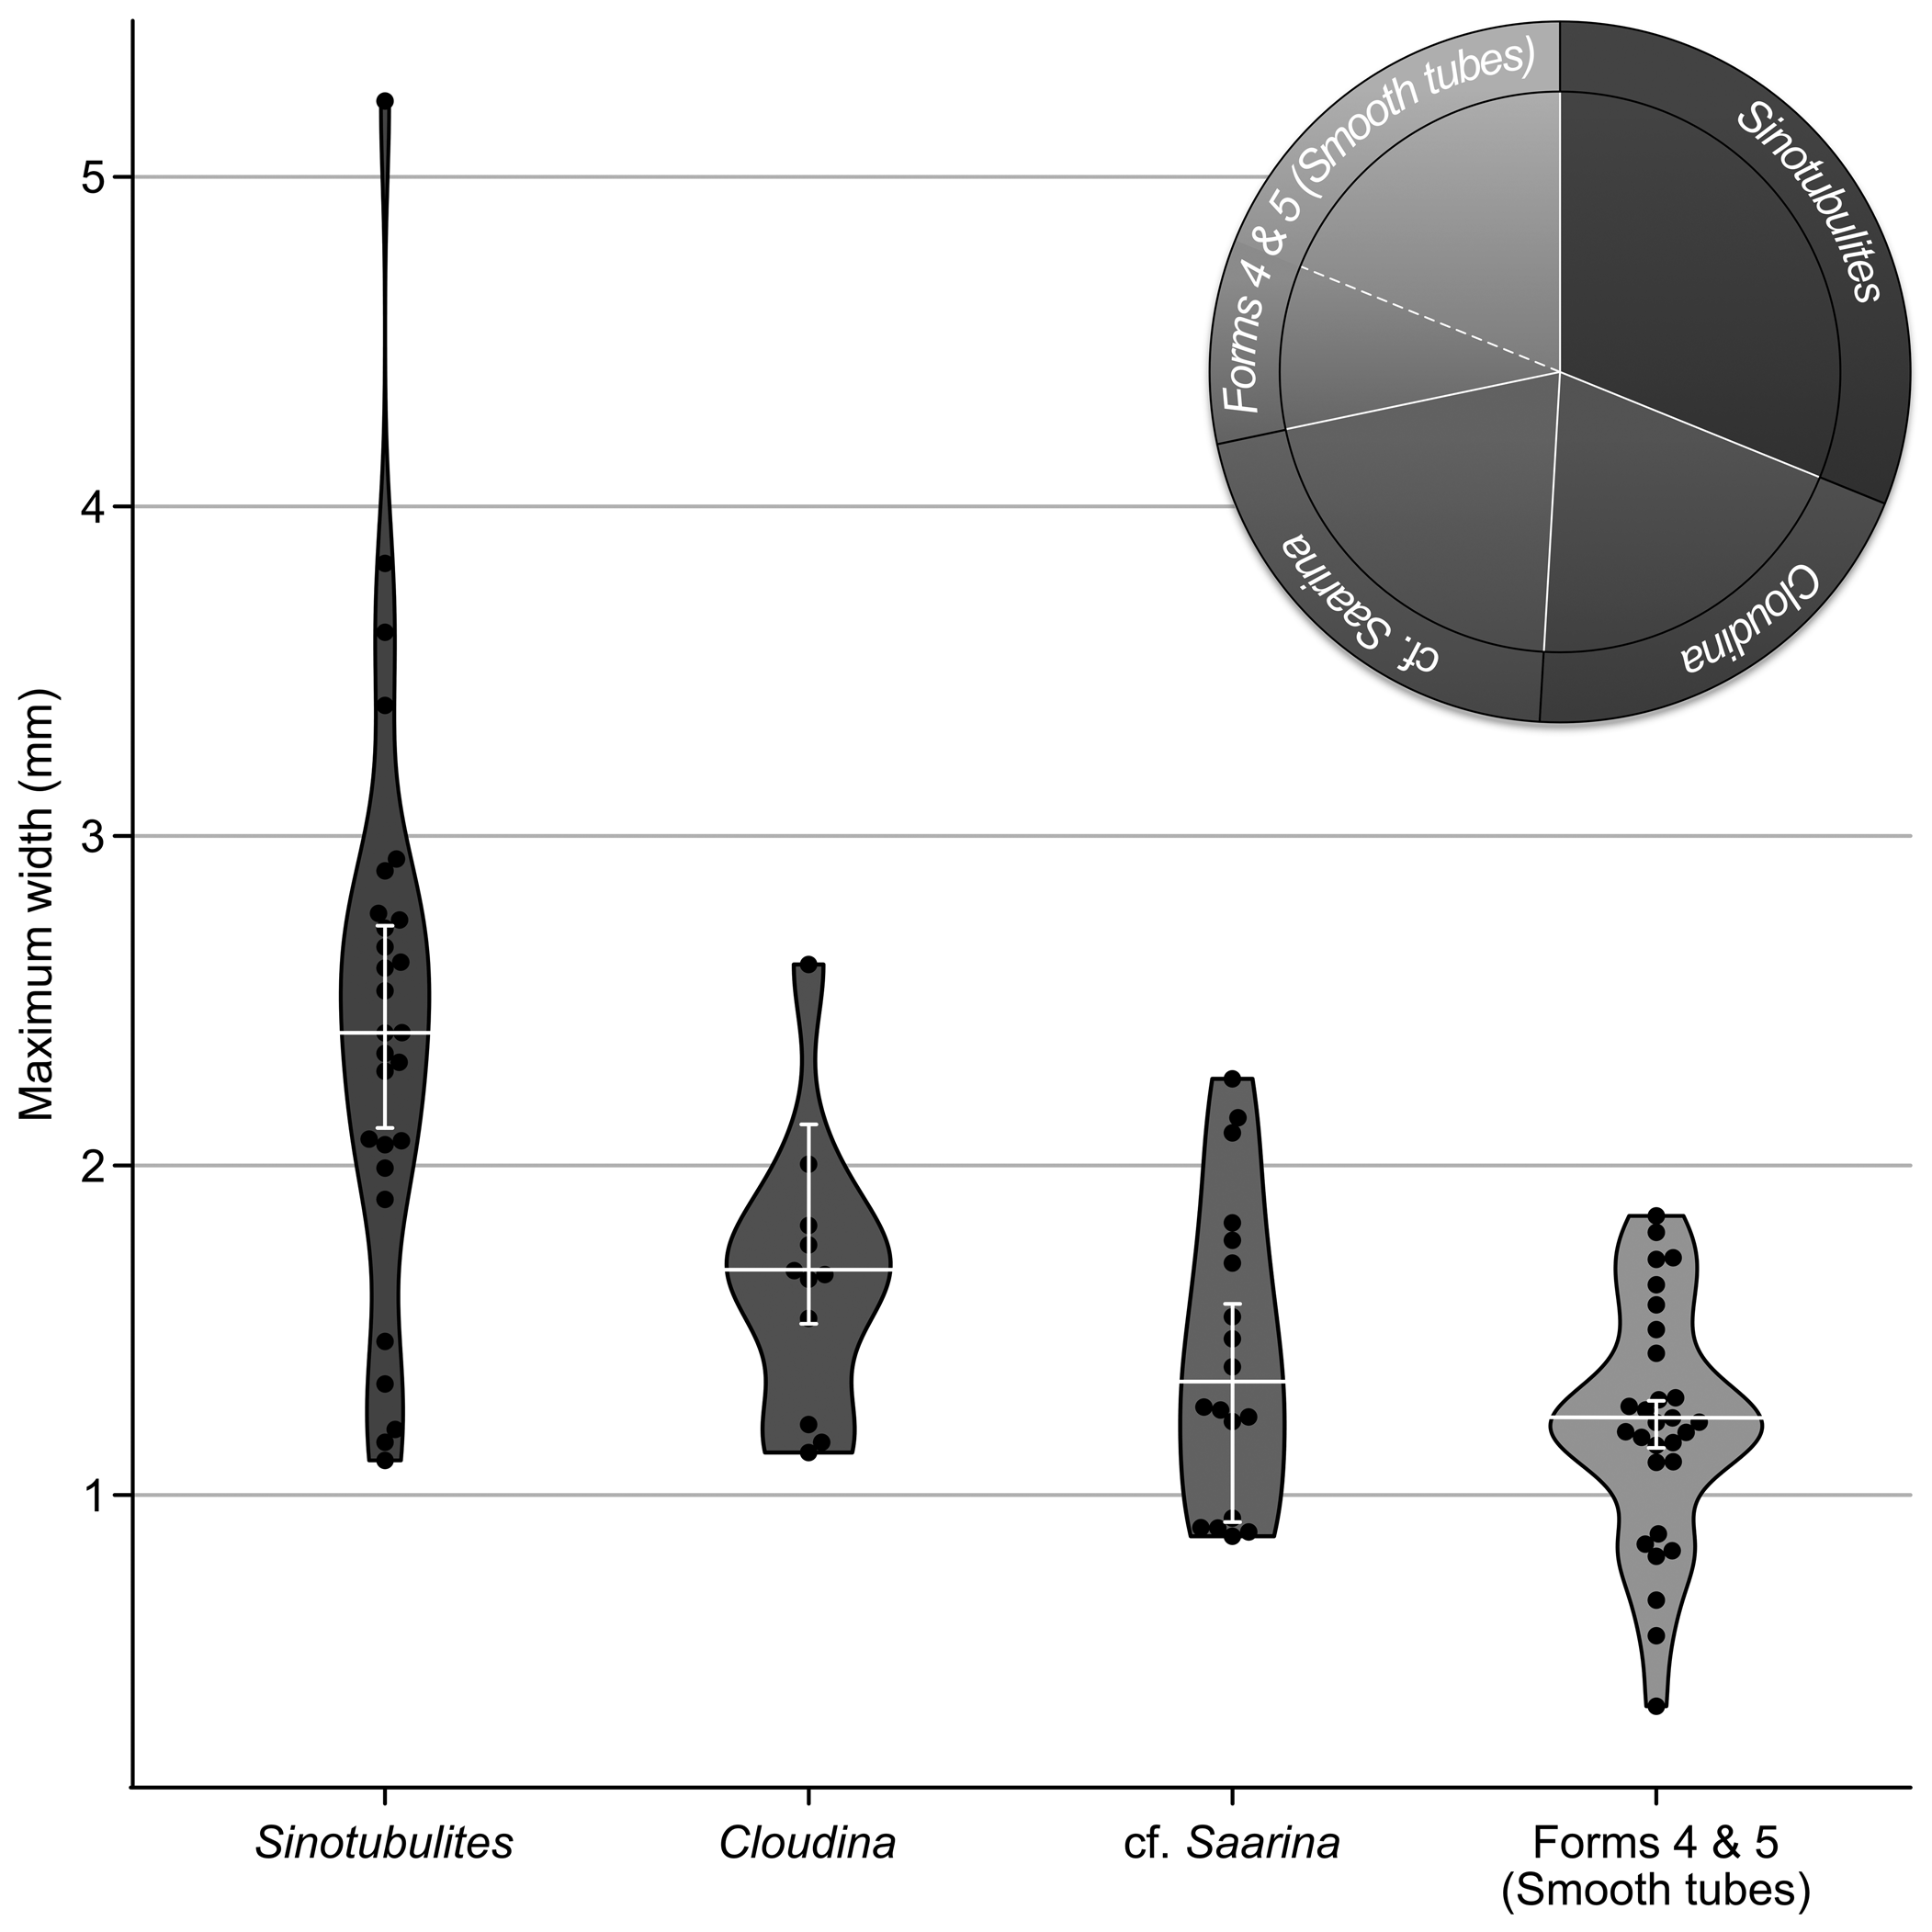
We compared the overall size distributions and measurements of observed features among the assigned morphological groups to better understand their morphological disparity (Table 1). Funnel-bearing cloudinomorph groups (forms 2 and 3) varied in maximum tube diameter from 0.88–2.61 mm, with a mean of 1.51 mm. Individually by group, form 2 was slightly larger on average, with a maximum diameter ranging from 1.13–2.61 mm with a mean of 1.65; form 3 ranged from 0.88–2.26 mm with a mean of 1.43 mm. On average, the sinotubulitids (form 1) were notably larger than either of the cloudinomorph forms, ranging in maximum diameter from 1.11–5.23 mm with a mean of 2.41 mm. Grouped together, the smooth tubes, regardless of tube curvature (forms 4 and 5), varied in width from 0.36–1.84 mm with a mean of 1.21 mm; separately, the means for these groups were very similar: 1.22 and 1.17 mm, respectively, for straight and sinuous forms. The distribution of maximum width data for all form groupings is shown in Figure 3. In contrast to width, tube length measurements were problematic and likely not biologically meaningful because these types of fossils are prone to fragmentation. Although these measurements were collected because they provide at least a minimum constraint for the biological length of the organism, we caution using these data in any diagnostic manner. To summarize length data: the cloudinomorphs (forms 2 and 3) ranged to 4.49 mm in length, whereas the sinotubulitids (form 1) and smooth tubes (forms 4 and 5) were generally longer, to 5.82 and 5.59 mm, respectively (summative morphological data shown in Table 1).
Thin-section petrography
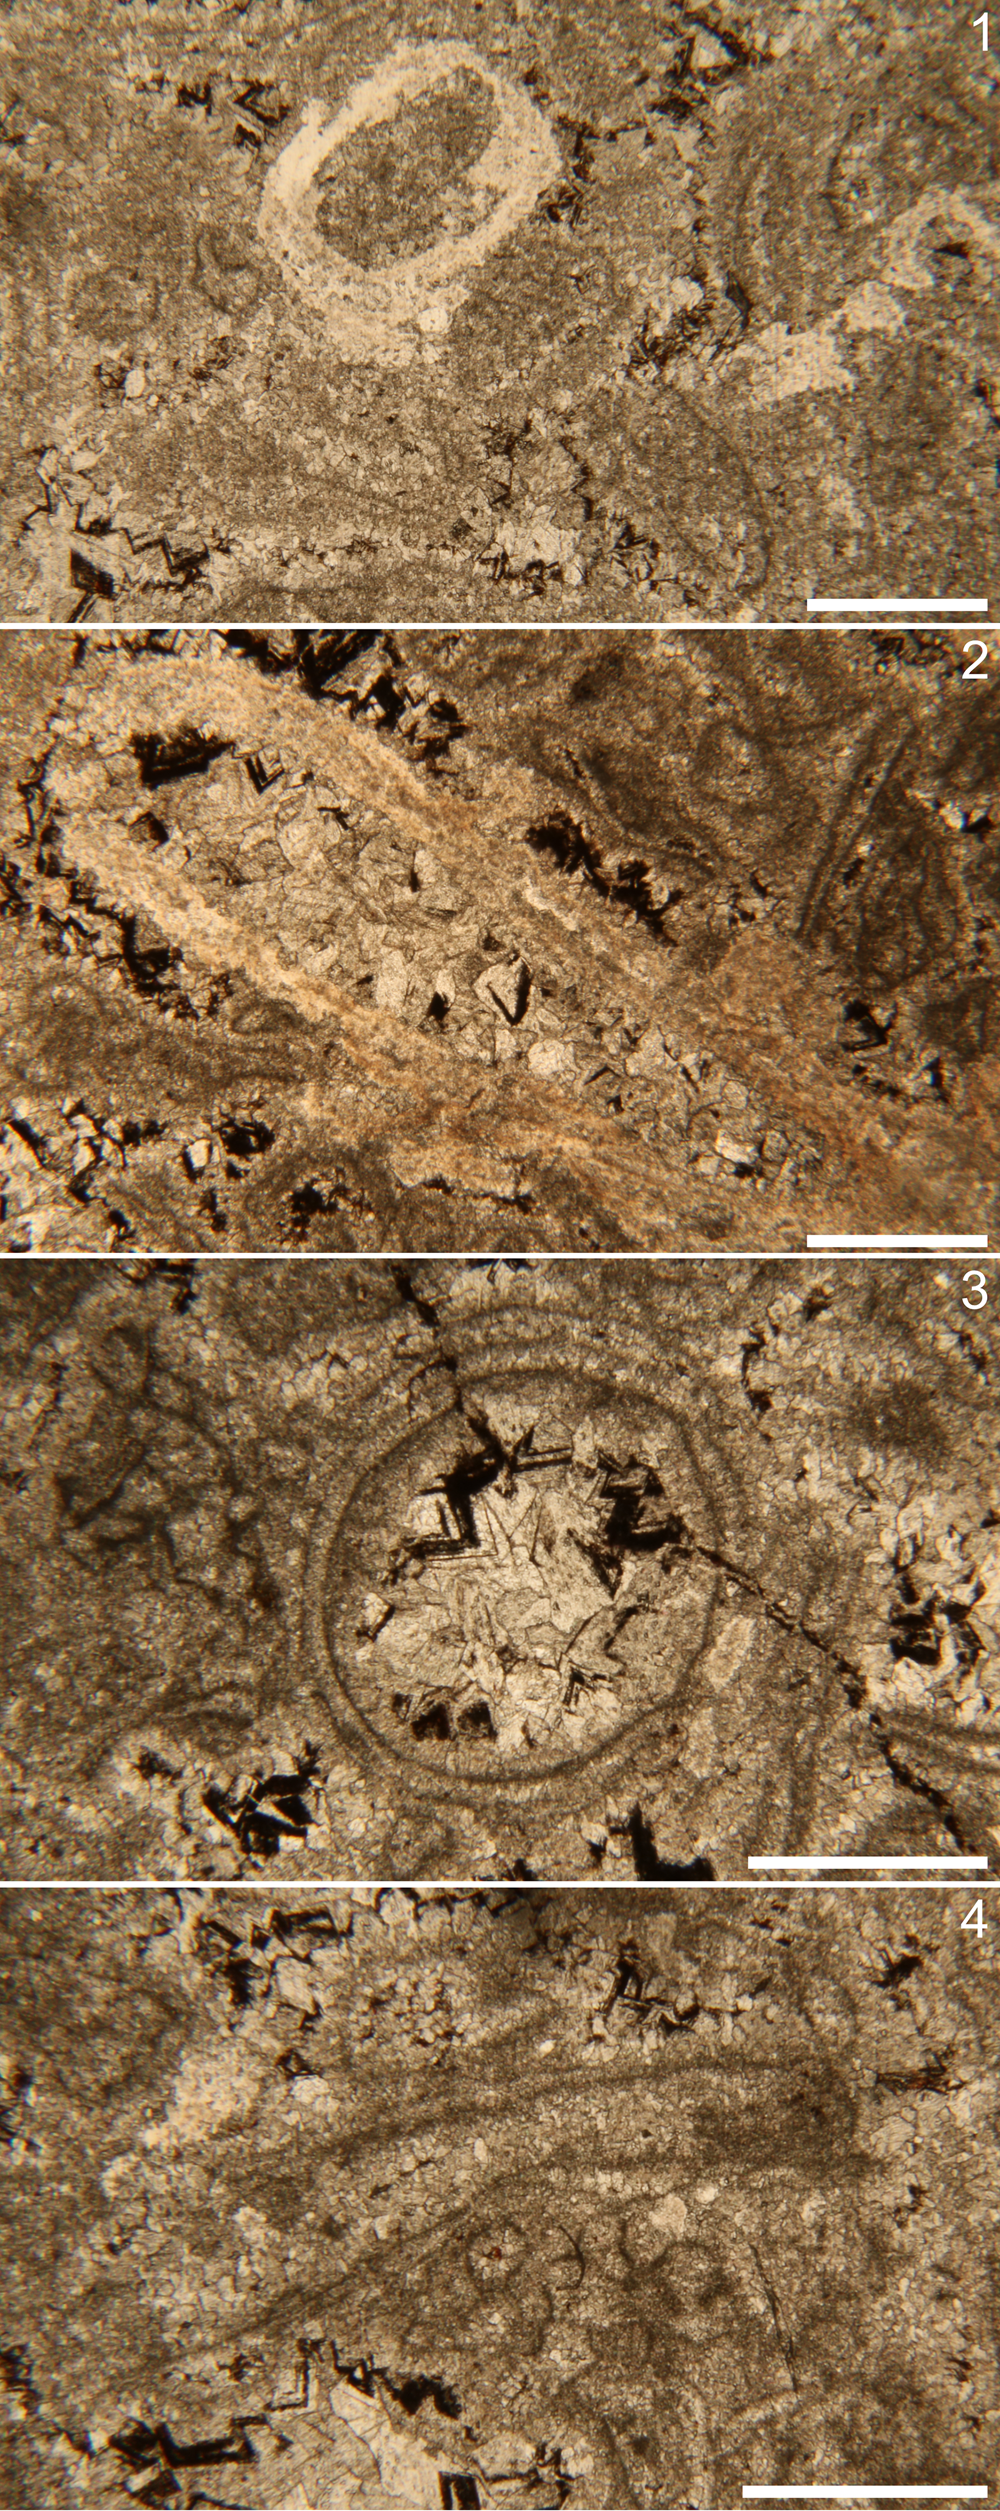
Petrographic analysis of thin sections prepared from the fossiliferous packstone blocks revealed an abundance of densely aggregated tubular fossils. Only a fraction of the fossils observed in thin section were silicified, with many others calcareous in composition (Fig. 4). The acid-extracted fossils were ubiquitously silicified, however, thus indicating that the calcareous fraction was lost during maceration and yielding asymmetrical views of this assemblage between acid extraction and bulk-rock viewing methods. Where the extracted silicified fossils were coarsely preserved, petrographic analysis revealed that some of the skeletal walls were constructed of very thin (2–3 μm thick), well-preserved micritic layers, with coarser carbonate cements and dolomitic rhombs surrounding and in-filling them (Fig. 4). Comparatively, wall thicknesses of extracted fossils, regardless of form grouping, were on the order of 0.15–0.32 mm where visible.
Petrographic thin section photomicrographs. (1) Silicified tube examples (brighter white material) in transverse section (left) and longitudinal section (right). (2) Silicified funnel-in-funnel tube in longitudinal section, nonorthogonal to the length of the tube. Note blocky calcareous infilling and potential fine layering in the tube wall. (3) Transverse plane of nonsilicified tube, with apparent fine layering and blocky calcareous infill. (4) Longitudinal plane of nonsilicified tubular fossil with fine layering and micritic infill. Scale bars = 1 mm.
SEM-EDS and μCT
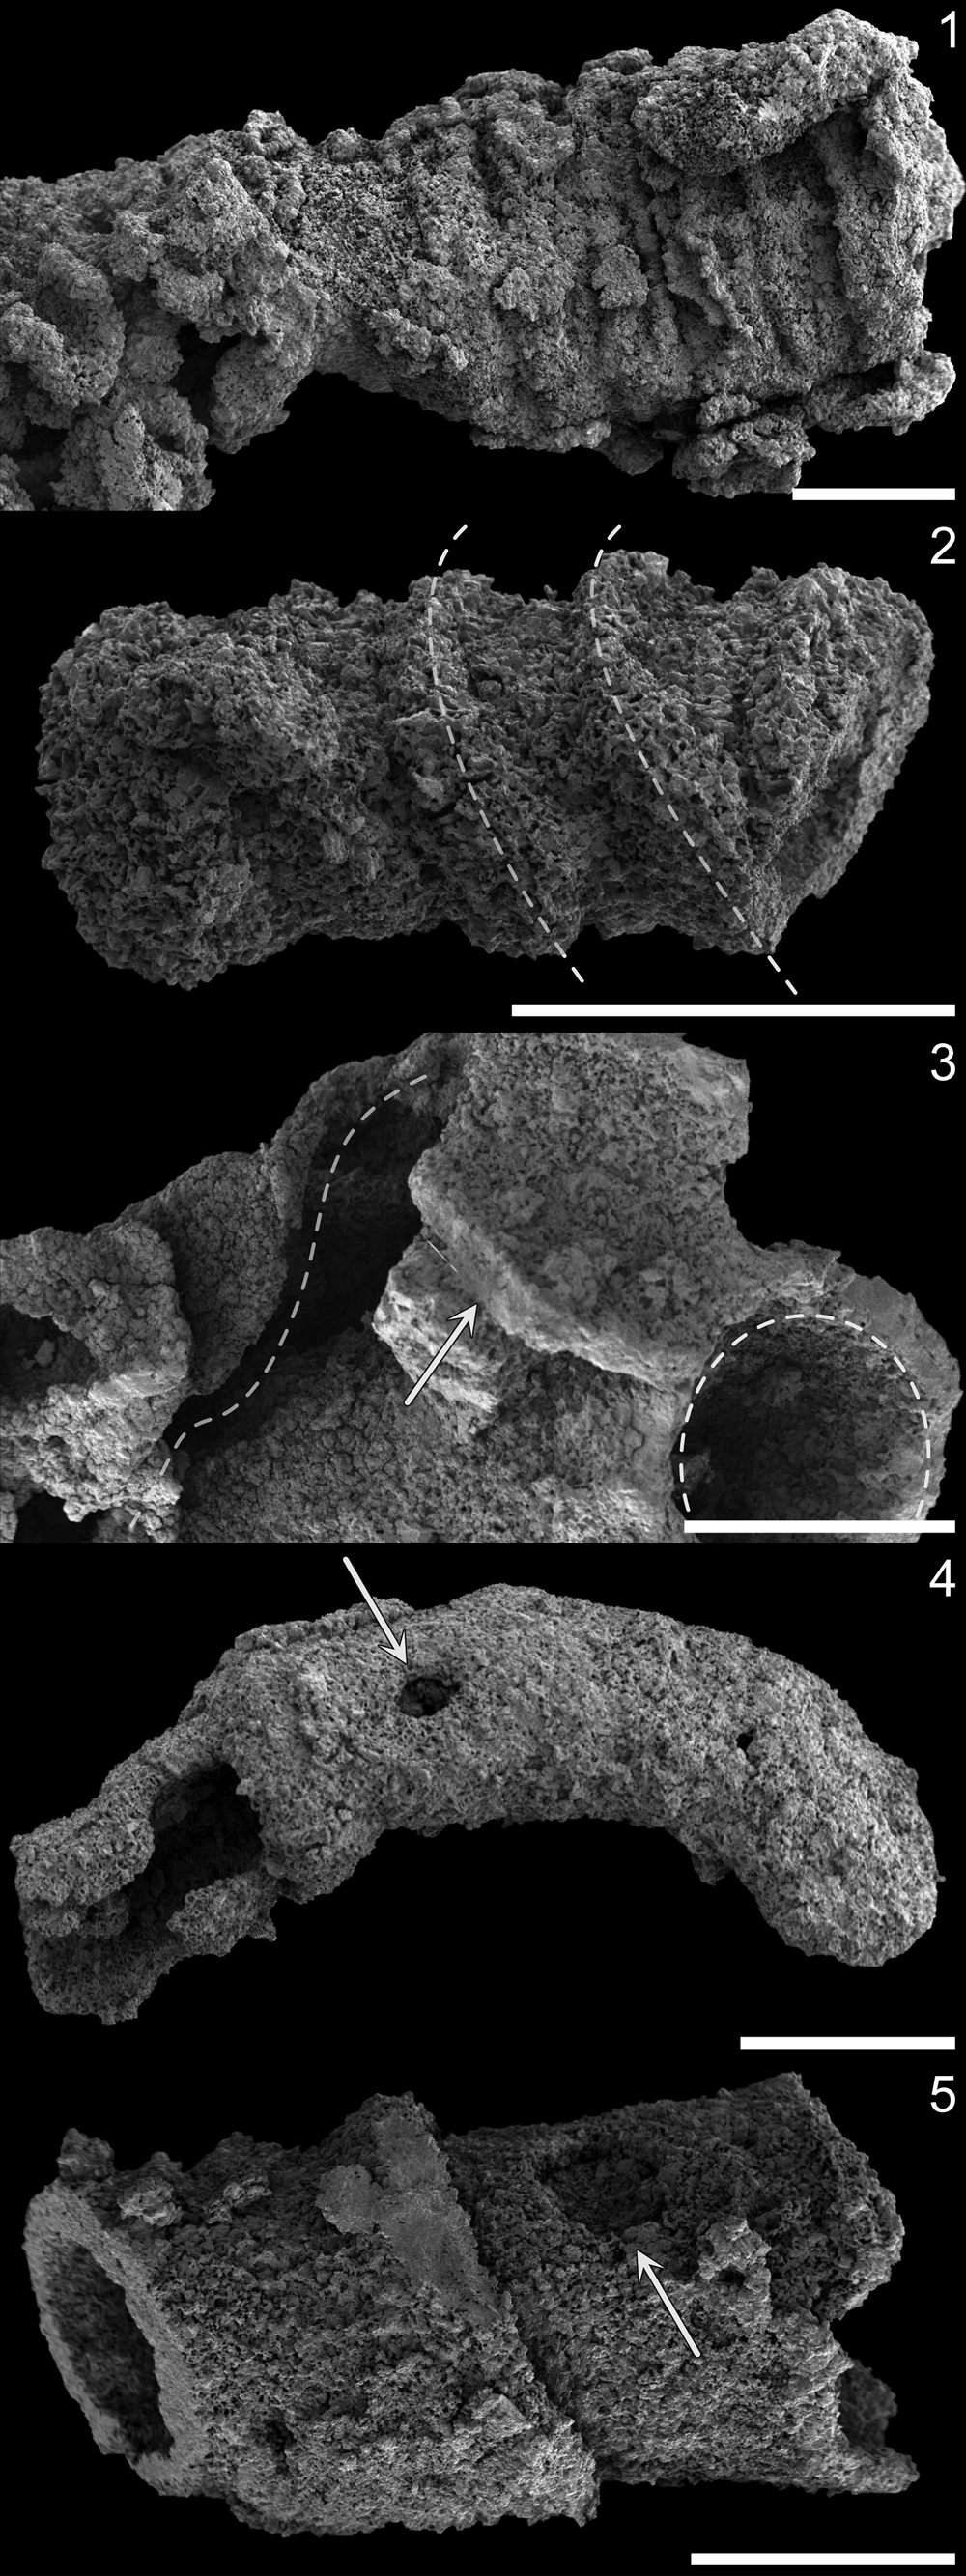
X-ray and electron imaging of these samples yielded information about the preservation and mode of skeletonization for these fossils. Like optical observations of acid-extracted fossils, SEM imaging confirmed that the fossil surfaces were coarsely preserved with abundant and pervasive crystal overgrowth, although larger-scale morphological details remain ostensibly unaltered. For example, several of the cloudinomorph fragments displayed elliptical cross sections or lateral imbrication of the thickened funnel rims (Figs. 2.4, 5.1); some sinotubulitids showed corrugated textures and irregular cross sections or apparent flattening (Fig. 5.2); and at least one example of a smooth-walled specimen displayed helical twisting along the outer wall (Fig. 5.3). In addition, some specimens, although rare, show a single, generally circular puncture in the skeletal walls. Minor surficial details, e.g., any fine-scale wrinkles, ridges, or striations if originally present, would have been overprinted by taphonomic mineralization, and irregularities or inconsistencies in the pronunciation of exterior features was noted in some specimens. Compositional EDS point analyses along acid-extracted fossil surfaces indicate that the tubes are silicified and, in some cases, contain blocky undissolved dolomitic cements.
Surface and deformative features of silicified fossils (SEM). (1) Sagittally flattened sinotubulitid specimen. (2) Imbricated funnel rims (dashed white lines to guide orientation) of cf. Saarina specimen with little-to-no flattening; compare with drooping funnel rims and slight compression of taxonomically comparable specimen in Figure 2.4. (3) Torted funnel (left dashed curve), broken funnel wall (arrow), and intact funnel aperture (right dashed curve) of Cloudina sp. indet. specimen. (4) Ovoid puncture (arrow) in smooth (curved) tube. (5) Subcircular puncture (arrow) in Cloudina sp. indet. funnel (infilled). Scale bars = 1 mm.
Backscattered electron imaging (atomic number contrast) and EDS elemental mapping of the thick section echoed that silicification is a common taphonomic mode for these tubes (Fig. 6). However, abundant but muted circular cross sections and tubular forms with differing preservation were also discernable in z-contrast imaging (Fig. 6). Elemental EDS mapping indicated that the composition of these faintly visible ‘ghost tubes’ was nearly equivalent to that of the host rock, representing the calcareous skeletal materials also observed in petrographic section. The primary compositional difference was driven by a lack of iron in the fossils themselves but elevated in the dolomitic matrix (Fig. 6). In μCT observation (Fig. 6), a high density of tubular fossils was observed, which we surmise includes both the silicified and calcareous skeletal fractions.
SEM imaging and EDS elemental maps of fossils in polished slab. (1) Overview gigamacro photomosaic of a portion of polished thick section; labeled rectangles correspond to SEM and EDS image regions as indicated. (2, 3) Silicified fossil in transverse section: (2) backscattered electron (z-contrast) image, with (3) corresponding overlain elemental maps for calcium, silicon, and iron. (4, 5) Calcareous fossil in transverse section: (4) Backscattered electron (z-contrast) image, with (5) corresponding overlain elemental mabs for calcium, silicon, and iron. Scale bars = 5 mm (1), 500 μm (2, 5).

Discussion
Age and diversity of the La Ciénega assemblage
Without more recent paleontological and paleoecological evaluation, McMenamin's (Reference McMenamin1985) original descriptions of the skeletal fossils of the La Ciénega Formation in 1983 and 1985 remain the primary sources of information on this assemblage. Grant (Reference Grant1990) reconsidered McMenemin's (Reference McMenamin1985) published La Ciénega fossils but did not agree on either the taxonomic identities of the organisms or the age of the deposit. In the ~40 years since, little work has been done on this early skeletal assemblage, with the exceptions of index fossil examination by Sour-Tovar et al. (Reference Sour-Tovar, Hagadorn and Huitrón-Rubio2007) to constrain the Ediacaran-Cambrian boundary in the region and more recent integrative geochronological, chemostratigraphic, and lithostratigraphic work by Hodgin et al. (Reference Hodgin, Nelson, Wall, Barrón-Díaz, Webb, Schmitz, Fike, Hagadorn and Smith2021) that included a biostratigraphic summary of the formation in context. As an important note, McMenemin's assessments (McMenemin et al., Reference McMenamin, Awramik and Stewart1983; McMenemin, Reference McMenamin1985) did sample fossil materials from sections other than that reported herein from the Cerro Clemente section, including the Cerro Rajón, Cerros Calaveras, and Cerros Pitiquito; his reported fossils were comparable across the examined sites. Below, we summarize these contributions and conundrums with regard to the paleontological assessment of the La Ciénega fossils.
The original reports of the La Ciénega fossils—first by McMenemin et al. (Reference McMenamin, Awramik and Stewart1983) without taxonomic assignments and subsequently with details of affinity by McMenemin (Reference McMenamin1985)—described them as a polytaxic assemblage, occurring as a coquina within the host sandy dololimestone. Indeed, the first report (McMenemin et al., Reference McMenamin, Awramik and Stewart1983) used a morphological grouping system much like we employed herein, including the following categories: (1) smooth, single-walled tubes (tube diameters ranging from 1.2–1.8 mm; lengths, fragmented, to 10 mm); (2) smooth-surfaced, multiple-walled tubes (2–3 mm in diameter; lengths, fragmented, to 10 mm); (3) robust, irregularly annulated, single-walled tubes (averaging 2.4 mm in diameter; lengths, fragmented, to 10 mm); and (4) a single regularly annulated tube (1.7 mm in diameter; fragmented length 4.8 mm). The annulated tubes, in his 1985 contribution, were all united under a novel species, Sinotubulites cienegensis McMenamin, Reference McMenamin1985. His smooth tubes, on the other hand, were suggested to represent circothecid hyoliths and/or sinuously curving conoid specimens of Cambrotubulus cf. C. decurvatus Missarzhevsky in Rozanov et al., Reference Rozanov, Missarzhevsky, Volkova, Voronova and Krylov1969. Where our groups are comparable, specifically the smooth-walled tubes (our forms 4 and 5) and the sinotubulitids (our form 1), our morphometric data are relatively comparable, with a nearly identical mean maximum diameter for the sinotubulitids at ~2.4 mm and generally smaller on average, but still in range, for the smooth tube groupings to ~1.8 mm in diameter (Table 1). Our material appears slightly more fragmented, however, with notably shorter lengths, although this could be relative to discrepancies in the methods used for acid extraction and cleaning.
Based on his identifications of Cambrotubulus and circothecids, McMenamin (Reference McMenamin1985) suggested a lower Cambrian age, specifically Meishucunian/Tommotian—terminology which now corresponds to the Terreneuvian Series, likely Series 2. He noted, however, that the presence of Sinotubulites required a range extension of this taxon into the Cambrian from older rocks, based on (at the time) the primary identifying report of the genus from the Ediacaran-Cambrian transition in China (Chen et al., Reference Chen, Chen and Qian1981). The alternative inference—that Cambrotubulus could be extended downward into older units—was ignored based on the suggested co-occurrence of Sinotubulites and Coleoloides Walcott, Reference Walcott1889 in the similar Deep Spring assemblage of Nevada (Signor et al., Reference Signor, McMenamin, Gevirtzman and Mount1983). Largely because of the presence of Coleoloides, although notably the least common faunal element in the Deep Spring Formation, this assemblage was deemed to be lower Cambrian in age and comparable to other well-known Coleoloides-bearing Cambrian units (Landing and Brett, Reference Landing and Brett1982; Bengtson and Fletcher, Reference Bengtson and Fletcher1983; Signor et al., Reference Signor, McMenamin, Gevirtzman and Mount1983).
In 1990, Grant published an overview of Cloudina, its global distribution, and its time constraints, meant to argue for the use of this ubiquitous fossil as an index for the terminal Proterozoic. Within this contribution, Grant (Reference Grant1990) also detailed the shell structure, construction, and taphonomy of these organisms, which in several cases led to the re-evaluation or reconsideration of other published tubular shelly taxa from the same time interval—e.g., including Sinotubulites, Nevadatubulus Signor, Mount, and Onken, Reference Signor, Mount and Onken1987, and Wyattia Taylor, Reference Taylor1966, which were therein suggested to be “probably either con-generic with, or closely related to, Cloudina” (Grant, Reference Grant1990, p. 269). Later in this contribution, Grant (Reference Grant1990) commented on McMenemin's (Reference McMenamin1985) likely misinterpretations, noting that the wave-invaginated circothecids instead showed the characteristic multilayered shell wall construction known of Cloudina and that the longitudinal ribs used to indicate the presence of sinotublitids were likely folds formed during compaction. In summary, Grant (Reference Grant1990) surmised that the La Ciénega assemblage—as well as the contemporaneous Deep Spring shelly fauna (Signor et al., Reference Signor, Mount and Onken1987)—contained only Cloudina and refuted a lower Cambrian placement in favor of the terminal Proterozoic. Similarly, Sour-Tovar et al. (Reference Sour-Tovar, Hagadorn and Huitrón-Rubio2007) noted the presence of the cloudinid-bearing coquinas in Units 1 and 4 of the La Ciénega and noted their comparisons to other late Ediacaran skeletal packstones globally but suggested only the presence of Cloudina hartmannae on the basis of size and morphological comparisons. Nevertheless, it is challenging to identify the fossils in either the polished slab or bedding surfaces as shown (Sour-Tovar et al., Reference Sour-Tovar, Hagadorn and Huitrón-Rubio2007). For instance, the close-up that they illustrated (Sour-Tovar et al., Reference Sour-Tovar, Hagadorn and Huitrón-Rubio2007, fig. 2d), without extracting the fossil, could instead represent the wrinkled transverse corrugations of Sinotubulites as opposed to the funnel-in-funnel form of cloudinomorphs.
Recent work has provided better age constraints to these units using radiometric dating, bio-, and chemostratigraphic approaches (Smith et al., Reference Smith, Nelson, Strange, Eyster, Rowland, Schrag and Macdonald2016; Hodgin et al., Reference Hodgin, Nelson, Wall, Barrón-Díaz, Webb, Schmitz, Fike, Hagadorn and Smith2021; Nelson et al., Reference Nelson, Crowley, Smith, Schwartz, Hodgin and Schmitz2023). Smith et al. (Reference Smith, Nelson, Strange, Eyster, Rowland, Schrag and Macdonald2016), for example, showed that the skeletal fauna of the Deep Spring Formation lies below the first appearance of Treptichnus pedum and the BACE. Although it is true that the global utility and correlation of the BACE has lately been questioned (e.g., Bowyer et al., Reference Bowyer, Zhuravlev, Wood, Shields and Zhou2022; Warren et al., Reference Warren, Inglez, Xiao, Buatois and Mangáno2023), these data, along with new reports from Hodgin et al. (Reference Hodgin, Nelson, Wall, Barrón-Díaz, Webb, Schmitz, Fike, Hagadorn and Smith2021) and Nelson et al. (Reference Nelson, Crowley, Smith, Schwartz, Hodgin and Schmitz2023) help to refine the relative age of these correlative southwestern USA and northwestern Mexico units to the latest Ediacaran–earliest Cambrian. From the regional litho-, chemo-, and biostratigraphy presented by Nelson et al. (Reference Nelson, Crowley, Smith, Schwartz, Hodgin and Schmitz2023), tube-bearing fossiliferous horizons along the southern Nevada-California boundary (from west to east: Hines Ridge, Mount Dunfee, Boundary Canyon, Montgomery Mountains, and Spring Mountians) are constrained by a minimum ID-TIMS U-Pb age of 532.83 ± 0.98 Ma as assessed directly from detrital zircons at the Spring Mountains locality, Nevada. From their proposed framework (Nelson et al., Reference Nelson, Crowley, Smith, Schwartz, Hodgin and Schmitz2023), this date precedes all regionally correlative occurrences of Treptichnus pedum and postdates all tubular fossil horizons and any reported occurrences of erniettomorphs. Comparably, Hodgin et al. (Reference Hodgin, Nelson, Wall, Barrón-Díaz, Webb, Schmitz, Fike, Hagadorn and Smith2021) added xircon U-Pb geochronology to their integrated litho-, chemo-, and biostratigraphy of the Sonoran La Ciénega and Cerro Rajón formations, as measured at the Cerro Rajón, Cerro Clemente, and Cerro San Agustín sections. The relative upward positioning of skeletal coquina in Unit 1, the onset and nadir of the BACE in Units 2 and 3, the zircon-bearing sandy dolostone in uppermost Unit 3 (providing a maximum depositional age of 539.40 ± 0.23 Ma), and T. pedum in the overlying Cerro Rajón Formation, collectively place the La Ciénega Formation in the late Ediacaran. When viewed in the broader context across the southwestern USA localities and those in northwestern Mexico, as presented by Nelson et al. (Reference Nelson, Crowley, Smith, Schwartz, Hodgin and Schmitz2023), the tubular fossils generally fall prior to the inferred correlation of the 539.40 Ma date, largely hung proximal to the BACE—although some sections show closer stratigraphic proximity between the fossil-bearing horizons and the nadir of the BACE than others (e.g., tens of meters or less in Spring Mountains, Montgomery Mountains, and Hines Ridge, versus >100 m in Cerro Rajón). The Mount Dunfee section, on the other hand, shows multiple horizons of tubular fossils ranging across the Reed Dolomite and Deep Spring Formation (e.g., Smith et al., Reference Smith, Nelson, Strange, Eyster, Rowland, Schrag and Macdonald2016; Selly et al., Reference Selly, Schiffbauer, Jacquet, Smith and Nelson2020; Nelson et al., Reference Nelson, Crowley, Smith, Schwartz, Hodgin and Schmitz2023).
From our assessments presented herein, we favor a polytaxic view of the La Ciénega tubular assemblage as opposed to Grant's (Reference Grant1990) monotaxic view. Based on observed morphologies and size groupings, we suggest the presence of at least three distinguishable taxa and another morphological grouping that remains unresolved. Given the extent of taphonomic overprinting observed within the extracted samples, we stress our apprehension in assigning fossils observed within this unit below the genus-level, although we can make provisional recommendations at the species level. We present these recommendations below.
Form 1: Sinotubulites
From the original description of Sinotublites (Chen et al., Reference Chen, Chen and Qian1981) from the late Ediacaran Dengying Formation, China, fossils of this genus and its junior synonym Qinella Zhang, Li, and Dong in Ding et al., Reference Ding, Zhang, Li and Dong1992 are characterized as cylindrical, multilayered tubular fossils with a tube-in-tube construction, an irregularly but strongly corrugated outer wall, and a weakly ornamented to smooth inner wall (as emended by Cai et al., Reference Cai, Xiao, Hua and Yuan2015 and Yang et al., Reference Yang, Warren, Steiner, Smith and Liu2022). This genus is known to have a cosmopolitan distribution during the late Ediacaran, with a range spanning China, Namibia, Spain, Brazil, Mexico, and the southwestern USA (see occurrences presented by Yang et al., Reference Yang, Warren, Steiner, Smith and Liu2022), and it often co-occurs with Cloudina—leading to the suggestion of the Cloudina-Namacalathus-Sinotubulites Assemblage Zone by Zhu et al. (Reference Zhu, Zhuravlev, Wood, Zhao and Sukhov2017), preceding the Anabarites-Protohertzina Assemblage Zone of the lowermost Cambrian. McMenamin (Reference McMenamin1985) established a new species of this genus from the Sonoran material, Sinotubulites cienegensis, based on his observations of less strongly oblique and bifurcating annulae (= corrugations) as compared to the type species of the genus, Sinotubulites baimatuoensis. Taking into account both taphonomic considerations and interspecific variation, however, Cai et al. (Reference Cai, Xiao, Hua and Yuan2015) synonymized Sinotubulites cienegensis—both from Sonora (McMenemin, Reference McMenamin1985) and the White-Inyo region of the southwestern USA (Signor et al., Reference Signor, Mount and Onken1987)—along with several other taxa, under the type species.
In addition to synonymies, Cai et al. (Reference Cai, Xiao, Hua and Yuan2015) erected three novel species of Sinotubulites, specifically owing to the polygonality of the tube cross sections: Sinotubulites triangularis Cai et al., Reference Cai, Xiao, Hua and Yuan2015; Sinotubulites pentacarinalis Cai et al., Reference Cai, Xiao, Hua and Yuan2015; and Sinotubulites hexagonus Cai et al., Reference Cai, Xiao, Hua and Yuan2015. Although Sinotubulites cienegensis might not be valid on its own, it is possible that the La Ciénega assemblage contains representatives of these polygonal Sinotubulites species. Indeed, McMenamin (Reference McMenamin1985) noted specifically that the cross sections of his observed La Ciénega Sinotubulites representatives ranged in shape, including circular, subellipsoidal, oblate, and irregularly polygonal. Without enough figured cross sections by McMenemin (Reference McMenamin1985) to illustrate their polygonal nature, resolving these taxa is not possible—although the singular cross section, appearing slightly oblique to the transverse plane, shown in his figure (McMenemin, Reference McMenamin1985, fig. 3.2) might tenuously suggest a pentagonal profile akin to Sinotubulites pentacarinalis. It is important to comment, however, that Signor et al. (Reference Signor, Mount and Onken1987) did not indicate observation of any polygonal cross sections from the contemporaneous southwestern USA White-Inyo fossil materials, nor were we able to assuredly identify any transversely polygonal specimens in our examination. From our acid-extracted materials, μCT volume viewing, and cross sections observable in thin- and thick-section, all fossils that we were able to assign as sinotubulitids show either the generally rounded profile of Sinotubulites baimatuoensis or taphonomically altered variations, e.g., flattened but recognizable sinotubulitid tubes (Fig. 5.1). As such, we suggest that all of our observed sinotubulitids be classified as Sinotubulites baimatuoensis, although we can also cautiously submit that Sinotubulites triangularis, Sinotubulites pentacarinalis, and/or Sinotubulites hexagonus might be present in the La Ciénega assemblage based on McMenemin's (Reference McMenamin1985) description. Nevertheless, we suggest that they would be only rare components and, at present, cannot confirm their occurrence.
Based on the emended diagnoses by Cai et al. (Reference Cai, Xiao, Hua and Yuan2015) and Yang et al. (Reference Yang, Warren, Steiner, Smith and Liu2022), the morphometric measurements assessed, and morphological features observed, the La Ciénega material fits well within the generic dimensions and descriptions. Our La Ciénega Sinotubulites baimatuoensis specimens are only marginally smaller in diameter (1.10–5.23 mm; N = 33) than the formally described range of the species (1.5–6 mm; Cai et al., Reference Cai, Xiao, Hua and Yuan2015) and relatively comparable to McMenemin's (Reference McMenamin1985) measurements of fossils from the same unit (< 0.9–4.3 mm; N = 21). Although crest-to-crest spacing of the corrugations can be regular or irregular, as well as densely or sparsely arranged (Cai et al., Reference Cai, Xiao, Hua and Yuan2015), our specimens tend to show relatively regular spacings of < 1 mm. Similarly, the total wall thickness in the La Ciénega materials tends to be highly variable, reported at 0.2–1.1 mm BY McMenemin (Reference McMenamin1985) and observed here ranging from 0.10–0.61 mm. Like the argument posed by Cai et al. (Reference Cai, Xiao, Hua and Yuan2015), we suggest that these size distinctions are a function of interspecific variation and/or taphonomic differences between the Mexican and Chinese materials, rather than warranting the establishment of a new species. Taphonomic quality almost certainly plays a large role, considering the distinctions in fidelity between the finely phosphatized Chinese materials and the coarsely silicified Mexican materials.
Forms 2 and 3: Cloudinomorphs
As suggested by Grant (Reference Grant1990), many of the forms identified in the original McMenemin (Reference McMenamin1985) report could reflect cloudinomorphs, e.g., the eccentrically nested funnel-in-funnel forms figured as transverse sections by McMenemin (Reference McMenamin1985, fig. 5.3, 5.6). Our extracted materials more confidently identify the presence of two cloudinomorphic forms, described below.
If we consider the correlative tubicolous fauna of the White-Inyos in the southwestern USA for reference, our form 2, with nonrimmed funnels or collars, appears most similar to the contemporaneous cloudinomorph Nevadatubulus dunfeei Signor, Mount, and Onken, Reference Signor, Mount and Onken1987 from the Mt. Dunfee, Nevada location of the Deep Spring Formation. This fossil taxon is abundant in its noted localities, is coarsely calcified, ranges from 0.5–1.2 mm in diameter, and appears to be structurally very similar to our extracted materials. Nevadatubulus, however, has been suggested to be synonymized with the type species of Cloudina, Cloudina hartmannae Germs, Reference Germs1972, by independent authors on the basis of comparable tube structure (Yang et al., Reference Yang, Steiner, Zhu, Li, Liu and Liu2016, Reference Yang, Warren, Steiner, Smith and Liu2022; Cai et al., Reference Cai, Cortijo, Schiffbauer and Hua2017). Differences in coarser (Nevadatubulus) versus finer (Cloudina) tube-wall layering was suggested, like above, to be a result of differential taphonomy between localities. Although there is a very wide diameter range of what has been classed as Cloudina, in a right-skewed distribution from hundreds of μm to > 4.5 mm (see Yang et al., Reference Yang, Warren, Steiner, Smith and Liu2022), our materials tend to be at the larger end of the range, with maximum diameters extending to 2.61 mm. Of note, this would have also been large compared to the former Nevadatubulus range (0.5–1.2 mm, as reported by Signor et al., Reference Signor, Mount and Onken1987). We anticipate, however, that the measurements of our specimens are exaggerated owing to the pervasive silica overgrowth on the fossil tube walls, but by what magnitude much remains unknown. Based on our observations and notable morphological similarities to well-preserved specimens reported from Lijiagou, China (Cai et al., Reference Cai, Cortijo, Schiffbauer and Hua2017), we consider our form 2 fossils to be most logically identified as representatives of Cloudina sp. indet. Although Cai et al. (Reference Cai, Cortijo, Schiffbauer and Hua2017) reported other species based on the presence and extent of transverse funnel-surface annulation, our specimens are too coarsely preserved to capture such details, and hence our suggestion for open nomenclature. Nevertheless, Cai et al.'s (Reference Cai, Cortijo, Schiffbauer and Hua2017) novel species Cloudina ningqiangensis Cai et al., Reference Cai, Cortijo, Schiffbauer and Hua2017, with smooth-sided funnels and a maximum diameter ranging from 0.22–2.67 mm, might be the appropriate taxonomic home if better preserved samples can be found, although its tightly nested funnels (minimal funnel spacing) is notably smaller than what we observed.
Our form 3 shows thickened funnel rims, a marginally smaller mean diameter (1.43 mm, N = 22), and a more prominent funnel-rim sag or droop along the sagittal plane (Fig. 2.4). Reminiscent of Conotubus hemiannulatus Zhang and Lin in Lin et al., Reference Lin, Zhang, Zhang, Tao and Wang1986, this parabolic funnel rim appearance and imbrication was argued by Cai et al. (Reference Cai, Hua, Xiao, Schiffbauer and Li2010) to result from angled shear of a nonbiomineral (but robust) tube during burial and compaction. Like Cloudina, Conotubus Zhang and Lin in Lin et al., Reference Lin, Zhang, Zhang, Tao and Wang1986 exhibits a wide range of tube diameters from hundreds of μm at narrowest to >10 mm at widest (Cai et al., Reference Cai, Schiffbauer, Hua and Xiao2011).
With more recent descriptive work analyzing pyritized tubular fossils from the Mt. Dunfee and Wood Canyon localities in Nevada (e.g., Smith et al., Reference Smith, Nelson, Strange, Eyster, Rowland, Schrag and Macdonald2016, Reference Smith, Nelson, Tweedt, Zeng and Workman2017; Selly et al., Reference Selly, Schiffbauer, Jacquet, Smith and Nelson2020) that are notably similar to Conotubus and other cloudinomorphs (e.g., Yang et al., Reference Yang, Warren, Steiner, Smith and Liu2022), these taxa should also be considered as possibilities. The closest in form is likely Saarina hagadorni Selly et al., Reference Selly, Schiffbauer, Jacquet, Smith and Nelson2020, which shows flared funnel rims and comparable tube dimensions, although distinct in preservational mineralogy—pyritization in Nevada versus silicification here. These two genera—Conotubus and Saarina Sokolov, Reference Sokolov1965—are obviously close in character, with Smith et al. (Reference Smith, Nelson, Strange, Eyster, Rowland, Schrag and Macdonald2016, Reference Smith, Nelson, Tweedt, Zeng and Workman2017) initially reporting these and comparable forms under the Conotubus moniker. Indeed, the funnel rims of Saarina hagadorni can also show the same drooping, imbricated appearance as that noted in Conotubus hemiannulatus (see, e.g., Selly et al., Reference Selly, Schiffbauer, Jacquet, Smith and Nelson2020, fig. 2E–F)—although, at least when using high-resolution electron microscopy, Saarina tends to have a more pronounced outward flare of the funnel rims than Conotubus (Selly et al., Reference Selly, Schiffbauer, Jacquet, Smith and Nelson2020). Given this, and the paleogeographic proximity of the Sonoran and southwestern USA localities, we recommend that specimens of our form 3 be considered cloudinomorphs cf. Saarina hagadorni, with remaining taxonomic uncertainties owing to striking differences in taphonomic resolution between the pyritized versus silicified specimens.
It remains possible that representatives of our form 3 are congeneric with those of form 2, with differences imposed only by taphonomy. For example, in the description of Nevadatubulus (Signor et al., Reference Signor, Mount and Onken1987), there are two figured specimens (holotype UCMP 37537 and paratype 37541, their fig. 4.1–4.4) that also exhibit apparently flared funnel rims—more so than any of the other figured paratypes, which look more convincingly similar to our form 2 grouping. However, no mention of the dissimilarity in the funnel-rim pronunciation was made (Signor et al., Reference Signor, Mount and Onken1987). If these thickened- and flared-rim variants of Nevadatubulus (Signor et al., Reference Signor, Mount and Onken1987) can also be considered cf. Saarina hagadorni, an interesting continuation of this work would be to examine this and other possible community-level parallels between the Sonoran and White-Inyo/Mt. Dunfee assemblages.
Forms 4 and 5: Smooth-walled forms
As compared to the other forms reported herein, the smooth-walled specimens (forms 4 and 5) are perhaps even trickier to assign, although it is clear that the same forms had been observed previously (McMenemin, Reference McMenamin1985). With regard to the curved, narrowly conical, smooth-walled tubes (our form 5), McMenemin (Reference McMenamin1985) presented a case that they represented comparators of Cambrotubulus decurvatus. He additionally cited personal communication with Signor for a similar occurrence in the Mt. Dunfee assemblage, although no such mention was made by Signor et al. (Reference Signor, Mount and Onken1987). Even though the presence of this taxon was the exemplar used to argue a lower Cambrian age for the unit, the description provided was somewhat hesitant or indecisive, citing the possibilities of these fossils being steinkerns or silicified microcoprolites (McMenemin, Reference McMenamin1985). Similarly, McMenemin (Reference McMenamin1985) reported the straight, conical, smooth-walled forms (our form 4) as likely circothecid hyoliths, although indeterminate at the genus and species levels given the lack of any surface ornamentation that could be useful for taxonomic identification. Given the abundance of possible genera to which these forms could belong—for example including Cambrotubulus, Hyolithellus Billings, Reference Billings1871, Coleolella Missarzhevsky in Rozanov et al., Reference Rozanov, Missarzhevsky, Volkova, Voronova and Krylov1969, Conotheca Rozanov et al., Reference Rozanov, Missarzhevsky, Volkova, Voronova and Krylov1969, Cupitheca Duan in Xing et al., Reference Xing, Ding, Luo, He and Wang1984, and some of the less-descript anabaritids—compounded with a dearth of identifying features, we suggest keeping these as unresolved tubiform problematica at present until further information can be provided. Given the significant overlap in sizes from the sinuous and straight forms that we observed, we cannot even confidently suggest that these represent more than interspecific, ontogenetic, or taphonomic variation within one taxon.
Taphonomy of skeletons
Whereas terminal Ediacaran skeletal tubes show a wide range of taphomodes, from calcification and phosphatization to pyritization and silicification (Yang et al., Reference Yang, Steiner, Schiffbauer, Selly, Wu, Zhang and Liu2020), the extent to which late Ediacaran tubular organisms were originally biomineralized has been a point of question in past literature. Although most commonly preserved in brittle material through replacive mineralization, regardless of final taphonomic composition, the original shell might have been at least somewhat pliable. For instance, Grant (Reference Grant1990) observed evidence of plastic deformation in the materials assigned to Cloudina. As a primitive form of biomineralization preceding true matrix-mediated or biologically controlled pathways, Grant (Reference Grant1990) proposed that the tubes of cloudinids might have originally been composed of organic materials with periodically deposited calcium carbonate contributing added rigidity and structural integrity. This suggestion was echoed by Hua et al. (Reference Hua, Chen, Yuan, Zhang and Xiao2005), who proposed that calcium carbonates were secreted and suspended in an organic matrix, which then cured to create the skeleton. Shore and Wood (Reference Shore and Wood2021) also argued that Cloudina skeletons mineralized on an organic template, perhaps easily assimilated from high alkalinity seawater in the late Ediacaran (Wood et al., Reference Wood, Ivantsov and Zhuravlev2017). Chen et. al. (Reference Chen, Bengtson, Zhou, Hua and Yue2008) inferred the same for Chinese examples of Sinotubulites, suggesting that their shell might have been comprised of a combination of both organic and calcareous materials. All of these inferences and suppositions were supported or argued by suggestions of flexure in the skeletal tubes of these terminal Ediacaran organisms—which were provided empirical support by Yang et al. (Reference Yang, Steiner, Schiffbauer, Selly, Wu, Zhang and Liu2020), who showed finely interlayered calcium phosphate and carbonaceous laminae in an ultrastructural study of exceptionally well-preserved cloudinomorphs, including Cloudina specimens from Paraguay and Namibia as well as the newly described Zuunia Yang et al., Reference Yang, Steiner, Schiffbauer, Selly, Wu, Zhang and Liu2020 from Mongolia. Ultimately, however, the level of biological control of skeletonization within these earliest biomineralizing metazoans might have varied by paleoenvironment, seawater chemistry and alkalinity, and ecological pressures, among other plausible drivers (Wood, Reference Wood2018). Here, we provide additional data supporting an original flexibility in the shells of the La Ciénega sinotubulitids and cloudinomorphs.
As supported by our combination of analyses, the La Ciénega assemblage exhibits two prominent modes of preservation—silicification and calcification—that both represent taphonomically replacive processes and thus do not reflect an original mineralogy of the fossils. From acid-extraction methods, we captured only a selective glimpse of the total diversity of this assemblage—that is, the portion of the assemblage that was silicified, because the calcareous shells were dissolved along with the dolomite packstone host. The calcareous shells, on the other hand, are only observable in petrographic section, polished slab view, or in μCT tomographs (Fig. 7). With regard to the latter, although indications of calcareous shells were visible, being able to resolve their three-dimensional structure apart from the host packstone matrix was challenging at best with little X-ray attenuation contrast; thus, determining the affinities of these ‘ghost tubes’ was also hindered. Nevertheless, we are confident that calcareous shells are indeed present and abundant within the La Ciénega assemblage from petrographic and thick-section observations and SEM-EDS analyses. In cross section, these do not appear substantially different from those that are silicified; however, for reliable assessments of morphology, size, and taxonomy reported herein, we focused only on the silicified materials, because the extractable materials provided our best three-dimensional views.
μCT views of fossils in hand sample. (1) Photogrammetric view of μCT-scanned sample, viewing the y-axis face. (2) Three-dimensional μCT tomographic reconstruction; red = segmented fossil data, brown = host rock matrix; y-axis to right, x-axis to left. (3) Two-dimensional slice example along x-axis showing fossil abundance by volume viewing; darker gray indicates fossils that were segmented in red in the volume view (2). Scale bars = 1 cm.

Our petrographic observations provided insight into the nature of deposition of these fossils but proved curious in explaining the taphonomic progression of this fossil assemblage, owing to the disarranged juxtaposition of silicified and calcareous tubes. Within the silicified portion, we suggest that it is possible to identify at least two phases of tube replacement—an initial phase of silicification followed by a second phase of infilling the internal cavity of the tube with carbonate cement. In conjunction with the observations of the calcareous tubes, we also infer that there was another phase of mineralization wherein formerly unsilicified tubes were remineralized, although this might have taken place simultaneously with the carbonate infilling of the silicified shells. The patchy silicification within the fossil packstone along with evidence of tube malleability within the silicified fraction could suggest that some of the tubular fossils were transported, likely during a storm event. In these cases, it is possible that postdepositional silicification occurred specifically within unoccupied tubes (those with no remaining organism or carcass), not only allowing for easier tube deformation, e.g, flattening or twisting, but also where percolation of burial fluids would have been less restricted than in tubes still filled with a recently deceased carcass. The latter, where carcasses were still intact in the buried tube, were likely instead remineralized during later phases of carbonate dissolution and cementation. A similar scenario was evoked by Warren et al. (Reference Warren, Fairchild, Gaucher, Boggiani, Poiré, Anelli and Inchausti2011) from analyses of the Itapucumi tubular assemblage in Paraguay, in which they inferred that tubes buried with an intact carcass would have inhibited both tube breakage during transport and either sediment or cement infill until later stages of decomposition. Alternatively, the taphonomic selectivity could also hint toward some taxonomic or histological selectivity of the observed mineralization processes, but as described above, we are hesitant to attempt identification of the ghost calcareous tubes with the currently available data.
The silicified fossils additionally revealed a propensity for elliptical and noncircular cross sections seems to point toward some level of plastic deformability. The presence of both circular and elliptical tube cross sections within the same taxon have usually been interpreted as differential tube compression during sediment compaction, in which those exhibiting circular cross sections were mineralized prior to compaction and those with elliptical cross section were not (Cai et al., Reference Cai, Schiffbauer, Hua and Xiao2011). However, Mehra and Maloof (Reference Mehra and Maloof2018) found that elliptical Cloudina cross sections were not oriented in the same direction (i.e., compaction stresses were not uniform) in proposed cloudinomorph reef structures, and therefore were most likely deformed in vivo. From this account, Mehra and Maloof (Reference Mehra and Maloof2018) inferred that Cloudina was likely only weakly biomineralized to account for the ease of deformation either before or during initial burial. Alternatively, this might not have been a deformational feature but instead a biological one. Like the reconstruction by Becker-Kerber et al. (Reference Becker-Kerber, Pacheco, Rudnitzki, Galante, Rodrigues and Leme2017), Cloudina might have had a recumbent life mode and thus a flatter bottom side of the skeletal tube (also hinted by Wood, Reference Wood2011), sometimes also inferred of Conotubus (Cai et al., Reference Cai, Schiffbauer, Hua and Xiao2011) and contemporaneous organic-walled tubes (e.g., Cai et al., Reference Cai, Hua and Zhang2013; Selly et al., Reference Selly, Schiffbauer, Jacquet, Smith and Nelson2020). Like these many examples before, the La Ciénega samples herein show a variety of both elliptical and circular cross sections (Figs. 2, 4), which could indicate early but differential taphonomic mineralization of initially weakly-to-nonmineralized tubes, and/or little stress imposed by sediment compaction. Others, however, show complete flattening, like the sinotubulitid in Figure 5.1, likely induced during initial burial and sediment compaction before silicification. In addition to funnel-unit imbrication (Fig. 2.4) or even marginal helical twisting (Fig. 5.2) one of our Cloudina specimens shows apparent torsion of a detached funnel unit, but another funnel with a clear generally circular cross section (Fig. 5.3), ruling out deformation affecting the whole organism. Our findings indicate that tubes of many taxa within this assemblage were prone to ductile deformation prior to sediment compaction. Any of these plausible inferences allow for the skeletons to deform biologically, during transport, or during burial, but also show brittle deformation after mineralization and burial stresses, nonetheless indicating a likely pliable in-vivo form.
Tentative inferences of predation
The last features of note, which might not expound further on the original mineralogy (or lack thereof) of the skeletal tubes, but coiuld provide evidence of their sturdiness, are what appear to be circular to subcircular punctures or borings (Fig. 5.4, 5.5) similar to those previously observed in Cloudina (Bengtson and Yue, Reference Bengtson and Yue1992; Hua et al., Reference Hua, Pratt and Zhang2003; Becker-Kerber et al., Reference Becker-Kerber, Pacheco, Rudnitzki, Galante, Rodrigues and Leme2017). Interpreted to be the result of drilling predators and an indication of both increasing trophic complexity and the protective function of tubicolous life modes, the generally < 100 μm diameter borings observed by Hua et al. (Reference Hua, Pratt and Zhang2003) were interestingly taxon-specific. In a skeletal assemblage that contained both Cloudina and Sinotubulities, only Cloudina shells were observed to have these plausible borings. In our samples, these features were quite rare (only a handful, < 5 convincing examples, were seen in our 106 total specimens) but were observed in both our Cloudina sp. indet. (Fig. 5.4) and smooth-tube morphogroup (Fig. 5.5). Our holes were ~300–400 μm in maximum diameter, which is comparable to the range reported by Bengtson and Yue (Reference Bengtson and Yue1992), only slightly larger than those figured in Becker-Kerber et al. (Reference Becker-Kerber, Pacheco, Rudnitzki, Galante, Rodrigues and Leme2017), and 4–5× the size range reported by Hua et al. (Reference Hua, Pratt and Zhang2003). Although we are not entirely confident that these punctures are traces of predation, their elliptical to circular regularity (Kowalewski, Reference Kowalewski1993) is a tantalizing indicator, considering the surface roughness of these samples imparted by the silicification process. However, it is perhaps equally as likely that these represent included and rounded grains that were captured during the silicification process, that either were later weathered or lost during our acid-extraction protocol. Nonetheless, finding more of these punctures during continued investigation could prove fruitful in uncovering their origin.
Conclusions
Like many other terminal Ediacaran fossil deposits with abundant shelly taxa, close re-consideration can offer new clues into their taxic diversity, the taphonomy and original construction of their tubular shells, and their paleoecology—and ultimately could provide us with new tools for biostratigraphic correlation and subdivision of the Ediacaran Period (e.g., Xiao et al., Reference Xiao, Narbonne, Zhou, Laflamme, Grazhdankin, Moczydlowska-Vidal and Cui2016). From our investigation and taxonomic re-evaluation of the La Ciénega fossil materials, we have illustrated that this deposit captures a polytaxic community of late Ediacaran tubiform organisms known from several other globally distributed units, including Sinotubulites, Cloudina, other cloudinomorphs probably akin to Saarina or Conotubus, and yet unresolved smooth-walled forms. We have shown here that these materials are preserved both by silicification, which constitutes the easily acid-extracted population, and by calcification, as observed in petrographic analysis. Some of the silicified taxa, specifically most observable in our representatives of Sinotubulities and the thickened-rim cloudinomorphs (whether Saarina or Conotubus), exhibit plastic deformation before and during preservation, which likely indicates that their skeletal tubes were not fully mineralized or rigid in vivo. This is echoed by observations in petrographic thin sections that show calcified tubes with what appear to be fine-scale organic tube layers or laminae, comparable to those shown by Yang et al. (Reference Yang, Steiner, Schiffbauer, Selly, Wu, Zhang and Liu2020)—although taxonomic identification is unfortunately challenging in thin sections alone without extracted representatives or enough detail provided by μCT volume imaging. Although we see fewer indications of plastic deformation in our representatives of Cloudina and the smooth-walled forms, we do observe plausible punctures or borings in examples of those shells, harkening comparisons with previously reported drillholes in Cloudina by Hua et al. (Reference Hua, Pratt and Zhang2003) and Bengtson and Yue (Reference Bengtson and Yue1992). Although our examples are very rare, at < 5% of our total extracted silicified fossils, seeking more evidence of these marks would be an exciting contribution to our understanding of early predator-prey dynamics, known presently at this age only from localities in Shaanxi Province, China. As a first step here, however, we have provided an important re-evaluation of these fossils using modern tools and techniques for visualization and compositional analysis, to follow along with renewed interest in terminal Ediacaran paleobiology of the southwestern USA. Further efforts to correlate these units, both chemo- and lithostratigraphically as well as biostratigraphically, will significantly contribute to our views of the latest Ediacaran in western Laurentia.
Acknowledgments
JDS and TS acknowledge support for the X-ray Microscopy Laboratory from the University of Missouri College of Arts and Science and NSF Instrumentation and Facilities #1636643. CW would like to thank J. Wopereis at the Center for Microscopy and Imaging (CMI) at Smith College for providing access to equipment and assistance with collecting EDS data. LLN acknowledges support from NSF Graduate Research Fellowship DGE-1746891 and National Geographic Early Career grant CP-002ER-17. We thank E.B. Hodgin for assistance in the field and M. Laflamme, L.V. Warren, and an anonymous reviewer for constructive feedback.
Declaration of competing interests
The authors declare no competing interests.



