Introduction
According to Australia's Health Report by the Australian Institute of Health and Welfare (AIHW, 2008), a baby born in Australia today can expect to live for 81.4 years, with men expected to live for 79 years and women for almost 84 years – the second longest life expectancy in the world, after Japan. By the year 2030, the elderly (>65 years) in Australia will comprise 22% of the population, a quarter of whom will be over 80 (ABS, 1999). A conservative estimate is that 25% of this population will have significant neuropsychiatric syndromes (ABS, 1998) and in the very old (>85 years), the fastest growing age group in the population, the prevalence of neuropsychiatric syndromes could reach 80%. A major proportion of this neuropsychiatric disability is due to dementia. In Australia, there are currently about 230,000 people with dementia, and unless there is a significant medical breakthrough (Access Economics, 2006) this number is expected to rise to 731,000 by 2050. Direct health and residential care costs exceed $6.6 billion per annum, while the indirect costs in foregone earnings, carer time and expenses are many times this (Mathers et al., Reference Mathers, Vos and Stevenson1999). By 2051, the impact of dementia will total 3.6% of GDP. The number of individuals with mild cognitive impairment (MCI) far exceeds the number with dementia, and the health impact of MCI is being increasingly appreciated. The challenge of the moment is to reduce disability among those currently affected and prevent disability among those at risk.
The field of neurocognitive disorders is in a state of flux. Basic neuroscience research is delineating the interaction of genetic predisposition, neurochemical changes, and comorbidity with diseases like cardiovascular disorders and diabetes in the genesis of neurocognitive syndromes (Ritchie and Lovestone, Reference Ritchie and Lovestone2002). Evidence suggests there are overlapping neuropathologies and as a result the nosological boundaries of cognitive disorders are being re-examined. Dementia is a disorder which tends to have a gradual onset and a progressive course, and there is likely to be a variable and often prolonged period between the occurrence of the first features of cognitive impairment and the time when criteria for a dementia diagnosis are met. Various syndromes describing mild complaints of memory loss, or objectively determined memory/cognitive impairment or decline, have been proposed to represent this predementia period. These syndromes include age-associated memory impairment (AAMI), late-life forgetfulness (LLF), aging-associated cognitive decline (AACD), mild cognitive impairment (MCI), and cognitive impairment no dementia (CIND) (Ritchie and Touchon, Reference Ritchie and Touchon2000). There is considerable overlap between these syndromes conceptually and in practice (Ritchie et al., Reference Ritchie, Artero and Touchon2001; Kumar et al., Reference Kumar2005; Blossom et al., Reference Blossom2007). Mild cognitive impairment (Winblad et al., Reference Winblad2004) is currently the most popular with researchers, although its veracity as a conceptual entity, diagnostic algorithm, and its ability to predict future dementia has been criticized (Mitchell et al., Reference Mitchell, Woodward and Hirose2008).
There is an international effort under way to better define the predementia syndromes and determine their predictive validity. It has been shown that patients with some MCI have a higher risk of progressing to Alzheimer's dementia (AD) than the general population over 65 years of age who convert at a rate of approximately 1–2% a year (Petersen et al., Reference Petersen2001). Reported conversion rates differ depending on sample and diagnostic criteria, ranging between 3.7% and 25% annually (Ritchie et al., Reference Ritchie, Artero and Touchon2001; Flicker et al., Reference Flicker, Ferris and Reisberg1991) although a median figure of about 12% conversion to dementia per year in MCI patients has been reported in clinic populations (Petersen, Reference Petersen2004). In community studies, the conversion rates are likely to be in the order of 6–10% (Petersen et al., Reference Petersen2009).
The Sydney Memory and Ageing Study (MAS) was initiated in 2005 to complement the worldwide effort to study mild neurocognitive syndromes. The primary objective of the study is to examine the clinical characteristics and prevalence of MCI and related syndromes in non-demented older Australians, and to determine the rate of change in cognitive function over time. The expectation is that this approach would help determine the features of the syndrome that best predict decline towards a diagnosis of dementia, be it AD, vascular dementia (VaD), dementia with Lewy bodies (DLB), frontotemporal dementia (FTD) or mixed dementia. It is expected that there would possibly be a ten-fold variation in the prevalence of MCI depending upon the criteria being used. The study also purports to examine predictors of cognitive decline from sociodemographic, clinical, neuropsychological, neuroimaging, biochemical, genetics, and proteomics perspectives. A secondary objective is to assess behavioral and psychological symptoms in MCI. It is hypothesized that many of the participants, all non-demented at the time of recruitment, would have a transition into dementia during the course of the study. As a result, the study also offers the opportunity to examine the effects of entering into a care-giving role for the supporters of these individuals, which is a subsidiary objective. This paper describes the baseline medical and neuropsychiatric characteristics of the cohort, and in particular the prevalence rates of MCI and its sub-types.
Methods
Recruitment
Participants were recruited randomly through the electoral roll from two federal government areas of Sydney, New South Wales, Australia – Kingsford-Smith and Wentworth. Registration on the electoral roll is compulsory in Australia, and this is a public document. Individuals in the age range 70–90 years on their last birthday were sent a letter inviting them to participate in the study. Those who responded in the affirmative were contacted by telephone to assess their eligibility. The cohort was recruited and examined for the first time (Wave 1) between September 2005 and November 2007, and this paper reports the results of this assessment.
Inclusion and exclusion criteria:
Participants aged 70–90 years living in the community were randomly selected to participate. They needed to speak and write English sufficiently well to complete a psychometric assessment and were able to consent to participate. The majority of participants (93.9%) had an informant who was the closest person to them and preferably someone who cohabitated with them. The informant had to know the participant well enough to be able to answer questions about the participant's memory, thinking, and daily functions.
The informant had to have at least weekly contact of not less than one hour with the participant.
Participants were excluded if they had a previous diagnosis of dementia, psychotic symptoms or a diagnosis of schizophrenia or bipolar disorder, multiple sclerosis, motor neuron disease, developmental disability, progressive malignancy (active cancer or receiving treatment for cancer, other than prostate – non-metastasized, and skin cancer), or if they had medical or psychological conditions that may have prevented them from completing assessments. Participants were excluded if they had a Mini-mental Statement Examination (MMSE; (Folstein et al., Reference Folstein, Folstein and McHugh1975) score of <24 adjusted for age, education and non-English speaking background (Anderson et al., Reference Anderson, Sachdev, Brodaty, Trollor and Andrews2007) at study entry, or if they received a diagnosis of dementia after comprehensive assessment.
Consent and feedback
Written informed consent was obtained from both participants and informants. Each participant was free to refuse a specific part of the assessment (such as blood sampling or MRI). Formal feedback from assessments was provided in written reports to the participants and their general practitioners. If tests revealed that the participant required immediate medical or psychiatric attention, they were contacted by telephone as was their general practitioner. The study was approved by the Ethics Committees of the University of New South Wales and the South Eastern Sydney and Illawarra Area Health Service.
Assessment
Consenting participants who met the inclusion criteria were assessed by trained research psychology graduates as follows:
Telephone Screen
This was performed prior to the face-to-face interview to confirm the following: willingness to participate, aged between 70 and 90 years, availability of an informant, adequate English language skills to complete a psychometric assessment (prompted with standardized questions), sufficient visual acuity to complete psychometric testing (with stimuli enlarged if necessary), and not meeting any exclusion criteria. It also collected demographic data (participant and informant) such as age, sex, education, marital status, occupation (current and previous), relationship between participant and informant, subjective cognitive complaints and the assessment of memory complaints in age-associated memory impairment (MAC-Q) (Crook et al., Reference Crook, Feher and Larrabee1992).
Face-to-Face Assessment
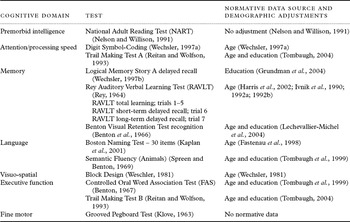
This was carried out in one or two sessions totaling three to four hours with appropriate breaks, and comprised a medical history interview and a neuropsychological and medical examination. The comprehensive neuropsychological battery was designed to assess various cognitive domains important for the diagnosis of dementia and predementia syndromes. The tests, and the associated domains, are detailed in Table 1.
Neuropsychological test battery administered in the Sydney Memory and Ageing Study

The medical history interview included questions about vascular diseases and vascular risk factors (hypertension, hypercholesterolemia, history of dyslipidemia, atrial fibrillation, smoking, obesity, diabetes, stroke or transient ischemic attack, angina), cancer, alcohol and caffeine consumption, vitamin deficiency, thyroid disorders, head injury, chronic lung disease, arthritis, osteoporosis, migraines, kidney disease, urinary tract infections, exposure to pesticides, sleep habits, vision and hearing problems, mental health problems including depression and anxiety, and current medications. Symptoms of anxiety were assessed with the Goldberg Anxiety Scale (Goldberg et al., Reference Goldberg, Bridges, Duncan-Jones and Grayson1988). We also collected information about health care utilization.
The medical examination comprised blood pressure (seated and standing), height and weight measures, hip to waist ratio, lateral stability test (Lord et al., Reference Lord, Rogers, Howland and Fitzpatrick1999), rigidity, rating of movement, speech, face and tremor, visual acuity, spirometry, grip strength, sit-to-stand test (Lord et al., Reference Lord, Murray, Chapman, Munro and Tiedemann2002), timed “up-and-go” test (Posiadlo and Richardson, Reference Posiadlo and Richardson1991) and 6-meter timed walk (Waite et al., Reference Waite, Broe, Garyson and Creasey2001) and the Brief Smell Identification Test (B-SIT) (Doty et al., Reference Doty, Marcus and Lee1996).
Participants were assessed at either a study center or in their own home if they were unable to visit the center. The assessment was split over two separate sessions if the participant was unable to do it in one session or if the assessment time exceeded four hours.
In addition to the in-person interview, participants were asked to complete the following self-report questionnaires: 15 item Geriatric Depression Scale (GDS; Yesavage et al., Reference Yesavage1983), Kessler 10 for psychological distress (K-10; Kessler and Mroczek, Reference Kessler and Mroczek1994), World Health Organization Disability Assessment Schedule II (WHODAS-II; Epping-Jordan and Üstün, Reference Epping-Jordan and Üstün2000), Assessment of Quality of Life 2 (AQoL 2; Richardson et al., Reference Richardson, Day, Peacock and Iezzi2004), current mental, social and physical activity, Food Frequency Questionnaire (Hodge et al., Reference Hodge, Patterson, Brown, Ireland and Giles2000), family history, the positive scale of the Positive and Negative Affect Schedule (PANAS; Watson et al., Reference Watson, Clark and Tellegen1988), Satisfaction With Life Scale (SWLS; Diener et al., Reference Diener, Emmons, Larsen and Griffin1985) and three subscales (neuroticism, openness and conscientiousness) of the NEO Five-Factor Inventory (Costa and McCrae, Reference Costa and McCrae1992).
Informant Interview and Questionnaires
Each participant's informant completed a phone interview and additional questionnaires as part of the caregiver component of the study. The phone interview was conducted by the same research psychologist who assessed the participant and it contained the Neuropsychiatric Inventory (NPI; Cummings et al., Reference Cummings, Mega, Gray, Rosenberg-Thompson, Carusi and Gornbein1994), Bayer Activities of Daily Living (B-ADL; Hindmarch et al., Reference Hindmarch, Lehfeld, de Jongh and Erzigkeit1998) and Instrumental Activities of Daily Living (IADL; Lawton and Brody, Reference Lawton and Brody1969). The Clinical Dementia Rating Scale (CDR; Morris, Reference Morris1993) was administered to assess the severity of cognitive disorders. In addition, the informant completed a questionnaire about care provision, a sleep questionnaire, and a short informant questionnaire on cognitive decline in the elderly (IQCODE; Jorm, Reference Jorm1994). To examine the burden of the carer, the informant completed self-reported questionnaires relating to quality of life (AQoL 2; Richardson et al., Reference Richardson, Day, Peacock and Iezzi2004), disability (WHODAS-II; Epping-Jordan and Utsun, Reference Epping-Jordan and Üstün2000) and psychological distress (K-10; Kessler and Mroczek, Reference Kessler and Mroczek1994).
Blood Tests
A blood sample was obtained after overnight fasting for the following investigations (not exclusively): full blood count, electrolytes, fasting blood glucose, lipid profile, C-reactive protein, vitamin B12, folate, thyroid stimulating hormone, homocysteine, total antioxidant capacity, malondialdehyde (MDA), vitamins A and E, carotene, EDTA plasma for proteomics, clotted blood for extraction of DNA, and buffy coat for cell lines.
MRI Scans
All participants were invited to undergo a MRI scan, and those who agreed were screened for contraindications (pacemaker, metallic implant or foreign bodies, cochlear implants, ferromagnetic homeostatic clips, claustrophobia), and were then scanned using a Philips 3T Achieva Quasar Dual scanner (Philips Medical Systems, Best, The Netherlands) located at the Prince of Wales Medical Research Institute, Sydney. Our standard protocol was: (a) a scout mid-sagittal cut for AC-PC plane alignment; (b) 3D T1-weighted structural (T1w TFE – turbo field echo) MRI, acquired coronally with repetition time TR = 6.39 ms, echo time TE = 2.9 ms, flip angle = 8°, matrix size = 256×256, field of view FOV = 256×256×190 mm3, and slice thickness =1 mm with no gap between; yielding 1×1×1 mm3 isotropic voxels; (c) T2-weighted fluid attenuated inversion recovery (FLAIR) sequence, acquired coronally with TR = 10000 ms, TE = 110 ms, inversion time TI = 2800 ms; matrix size =512×512; slice thickness = 3.5 mm with no gap between slices, yielding spatial resolution of 0.488×0.488×3.5 mm3/voxel; and (d) diffusion weighted imaging (DWI) scans with a single-shot spin-echo echo-planar imaging (EPI) sequence, scanned axially with six directional diffusion-sensitizing gradients (b = 1000s/mm2) with one no-diffusion-weighted b = 0 pulse; TE = 68 ms; flip angle = 90°; number of excitation (NEX) = 1; 38 axial slices with 3.5mm thickness and no gap; FOV = 250×133×250 mm3, matrix size =128×128, in-plane image resolution = 1.953×1.953mm. The total time of each subject's scanning session was approximately 20 minutes.
Genetics and Genomics
DNA was extracted from peripheral blood leukocytes or saliva samples at Genetics Repositories Australia (www.powmri.edu.au/GRA.htm) using standard procedures. As an initial analysis, apolipoprotein E (APOE) genotyping was undertaken. The two single nucleotide polymorphisms (rs7412 and rs429358), which distinguish between the three APOE alleles ɛ2, ɛ3 and ɛ4 were genotyped using Taqman assays (Applied Biosystems Inc. (ABI), Foster City, CA, U.S.A.). The validity of the genotyping was confirmed in a subsample by employing an alternate genotyping method that uses polymerase chain reaction amplification and restriction digest analysis (Hixson and Vernier, Reference Hixson and Vernier1990). A genome-wide association study (GWAS) using the Affymetrix Genome-Wide Human SNP Array 6.0 (Affymetrix, Santa Clara, CA, U.S.A.) is in progress.
Proteomics
A number of studies using newer proteomics techniques on blood samples from this cohort are in progress, using both hypothesis-driven and discovery approaches.
Follow-up assessments
The baseline assessment will essentially be repeated at two-yearly intervals after the initial assessment, with repeat blood sampling and MRI scans occurring in Wave 2 (2-year assessment) but not Wave 3 (4-year assessment). In the intervening years, participants will be contacted by telephone for a brief assessment. The telephone interview will include an update of the social and demographic data of the participant and informant and the Telephone Interview for Cognitive Status (TICS) (Brandt et al., Reference Brandt, Spencer and Folstein1988; de Jager et al., Reference de Jager, Budge and Clarke2003). The B-ADL (Hindmarsh et al., Reference Hindmarch, Lehfeld, de Jongh and Erzigkeit1998) and IADL (Lawton and Brody, Reference Lawton and Brody1969) will be completed by the informant.
Sub-studies
The Sydney Memory and Ageing Study sample is supporting other studies in subsamples of the cohort, including the following:
• Balance and Falls Study: examines the predictors of falling in the elderly (N = 500 in Wave 1; N = 531 in Wave 2).
• Metabolic and Inflammatory Markers Study: assesses additional metabolic and cardiovascular risk factors for cognitive impairment (N = 916 in Wave 1; N = 722 in Wave 2)
• Prospective Memory Study: a neuropsychological study with a focus on prospective memory (N = 120, only in Wave 1).
• Functional MRI study: examines changes in brain activity (blood oxygen level dependant response) in response to increased memory load in persons with mild cognitive impairment (MCI) and cognitively normal matched controls (N = 53).
Analyses
Consensus conferences
Individuals who met the following criteria were brought to a fortnightly case conference to decide on a diagnosis: a score of at least 1.5 standard deviations below published normative data on a memory and a non-memory measure, or on two non-memory measures, or reduced neuropsychological scores and a decline in activities of daily living based on an informant interview. Consensus diagnoses were made by an expert team comprising neuropsychiatrists, psychogeriatricians, and neuropsychologists on the basis of the available clinical, neuropsychological, laboratorial and imaging data. If a participant met the criteria for diagnosis of possible dementia at baseline, he/she was excluded from the study. Dementia was diagnosed on the basis of DSM-IV criteria, and an etiological diagnosis was made depending on various sets of criteria for dementia syndromes.
Participants were diagnosed with MCI using the most recent international consensus criteria (Winblad et al., Reference Winblad2004). A diagnosis of MCI was made if all of the following criteria were met: (a) complaint of decline in memory or other cognitive function which may be self- or informant-reported (memory complaint was required for amnestic MCI classifications, either memory or other cognitive complaint for non-amnestic classifications); (b) cognitive impairment on objective testing, i.e. not normal for age as determined by performance on at least one test measure 1.5 SDs or more below published normative values (or comparable standardized score provided in the normative source compared to age and/or education-matched samples); (c) not demented – participants did not have a pre-existing diagnosis of dementia on entry to the study, had an adjusted MMSE score of ≥24 and did not meet DSM-IV criteria for possible or probable dementia based on comprehensive clinical, cognitive and informant data gathered at assessment; (d) essentially normal function or minimal impairment in instrumental activities of daily living (IADLs) defined by a total average score <3.0 on the Bayer ADL Scale (Hindmarch et al., Reference Hindmarch, Lehfeld, de Jongh and Erzigkeit1998). This was later modified to take into account only impairment due to cognitive impairment; if there were physical reasons for functional impairment this was not held to indicate abnormal function. Four MCI subtypes (Petersen, Reference Petersen2004) were delineated according to cognitive impairment profiles – amnestic single domain (only memory domain impaired), amnestic multiple domain (memory plus at least one non-memory domain impaired), non-amnestic single domain (one non-memory domain impaired), and non-amnestic multiple domain (more than one non-memory domain impaired). The criterion for impaired domain was met if at least one of the measures from the domain was impaired. Cognitive domains, constituent test measures and normative data used for impairment classification are shown in Table 1
Participants were classified as cognitively normal if performance on all test measures was above the 6.68 percentile (−1.5 SDs) or equivalent score compared to normative published values, they were not demented (see criterion (c) above) and they had normal function or minimal impairment in IADLs defined by a total average score <3.0 on the Bayer ADL scale. Cognitive complaint was allowed.
MCI and cognitively normal classifications were only applied to participants from English-speaking backgrounds since the available normative data are based on predominantly English speakers. MCI subtypes were diagnosed on the basis of the International Consensus Criteria (Winblad et al., Reference Winblad2004). Impairment in a cognitive domain was considered present if the individual performed below 1.5 SD of age and education corrected norms for a test in that domain. Activities of daily living were considered to be impaired if the Bayer ADL score was >3.0. General cognitive function was considered to be preserved if MMSE score was >23.
MRI analyses
Images are de-identified, and then transferred to a computer server for storage. We use both Windows and Linux Workstations for our imaging data processes. Volumetric analyses and visual ratings of atrophy and white matter disease are undertaken at baseline and compared with those obtained at 2-year follow-up. Volumes of hippocampus, entorhinal cortex, parahippocampal gyrus and temporal neocortex are obtained using a standard tracing protocol already in use in our laboratory which utilizes the region of interest (ROI) tool in ANALYZE (Biomedical Imaging Resource, Mayo Clinic, Rochester, MN, U.S.A. 2009). Automated processes include segmentation of structural 3D T1-weighted scans into gray matter, white matter, cerebrospinal fluid (CSF) and intracranial volumes (ICV) using software packages such as SPM (http://www.fil.ion.ucl.ac.uk/spm/, Statistical Parametric Mapping, Wellcome Department of Imaging Neuroscience, London, U.K.), and the FMRIB's Software Library (FSL) (http://www.fmrib.ox.ac.uk/fsl, Oxford Centre for Functional Magnetic Resonance Imaging of the Brain, Oxford University, U.K.). Regional change in cortical thickness and gray matter volumes are examined using FreeSurfer (http://surfer.nmr.mgh.harvard.edu/, the Athinoula A. Martinos Center for Biomedical Imaging, Massachusetts General Hospital Boston, MA, U.S.A.). Automated white matter hyperintensity (WMH) detection and classification is performed using in-house software (Wen and Sachdev, Reference Wen and Sachdev2004; Wen et al., Reference Wen, Sachdev, Li, Chen and Anstey2009). We also examine the cortical surface indices and sulcal width (Liu et al., Reference Liu2010) and interregional cortical volume correlations using a brain network approach by applying graph theory.
Statistical analyses
Descriptive statistics were computed to characterize the cohort. Sex differences in the cohort were determined using the t-test for continuous variables and χ2 test for categorical variables. Repeated measures analyses of variance, multiple regression, mixed-effects models and survival analyses are planned to examine cognitive decline, conversion to dementia and potential predictors of such change. Other analyses will be determined by the particular objective or hypothesis. Analyses reported in this paper were performed using SPSS v18 (SPSS Inc, Chicago IL, U.S.A., 2006).
Results
The sample
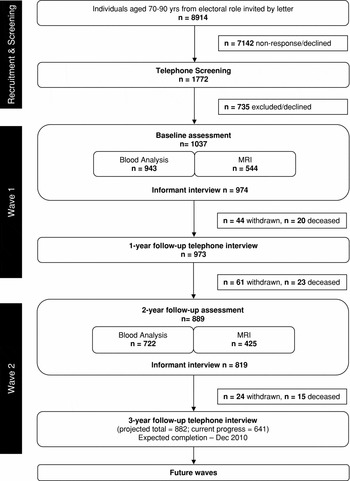
Of the 8914 individuals aged 70–90 years invited to participate, 7142 either did not respond to the letter or declined to participate; the remaining 1772 were contacted by telephone to confirm eligibility. From among these individuals, 735 were either ineligible or declined after further information about the study. The final sample comprised 1037 individuals who received detailed Wave 1 assessment documentation. Of these, 943 (90.9%) provided a blood sample, with the remaining giving a saliva sample for DNA extraction. MRI scans were performed on 544 (52.5%) individuals (figure 1).
MAS flowchart.

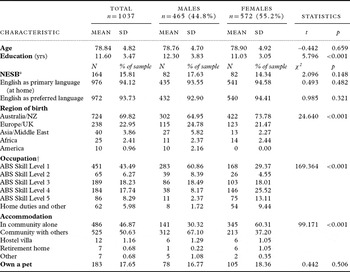
The sociodemographic characteristics of the sample are presented in Table 2. The mean age of the sample was 78.84 years, and 44.8% were men. They had a mean education (Crawford et al., Reference Crawford, Stewart, Cochrane, Foulds, Besson and Parker1989) of 11.6 years, with men being more educated by a mean 1.27 years. Just over 30% of the participants were born in countries other than Australia or New Zealand, and 15.8% of the sample came from a non-English speaking background; however 94.1% used English as the primary language at home. Being non-demented individuals, 97.5% lived in private homes, either alone (46.9%) or with someone else (50.6%). Pets were owned by 17.6%. When asked about their “main occupation”, approximately 60% of men and 30% of women had an occupational status equivalent to the Australian Bureau of Statistics (ABS, 2003) skill level 1, indicating a bachelor's degree or higher or 5 years of equivalent post-school experience. Only 156 (15%) were currently working in some capacity, the remaining being retired.
The sociodemographic characteristics of the sample

aNESB = Non-English speaking background.
† = Occupations have been grouped by ABS (Australian Bureau of Statistics) Skill Level which uses terminology from the Australian Qualifications Framework (AQF), for full details of this classification system see McLennan (Reference McLennan1997). ABS Skill Levels can be summarized as follows: Level 1: Bachelors degree or higher, or 5+ yrs experience; Level 2: AQF/Advanced Diploma, or 3+ yrs experience; Level 3: AQF Certificate III/IV, or 3+ yrs experience; Level 4: AQF Certificate II, or 1+ yrs experience; Level 5: Complete secondary education or AQF Certificate I.
To examine the representativeness of the sample, we compared those who were invited but did not participate with those who did. The two groups did not differ on age and sex. Further, we compared the participants in the study on sociodemographic characteristics with census data for the same geographical area obtained from the Australian Bureau of Statistics (ABS, 2003). There was no difference in the sex ratio, and while the age distributions were comparable, the Sydney MAS sample had a relatively lower proportion of individuals in the 70–74 age group (26.0% v. 32.3%, p < 0.05) and higher in the 75–80 age group (34.8% v. 29.9%, p < 0.05). The proportions in the 80–84 (26.9% v. 24.2%) and 85–89 (12.3% v. 13.6%) were not different. More Sydney MAS participants lived in private homes (97.5% v. 92.1% in the ABS data, p < 0.05) and were more educated than the comparable group in the census data (30.4% with tertiary and 56.4% with secondary education cf. 10.1% and 42.2% respectively for the ABS data).
The participants who had an MRI scan (n = 544), when compared with those who did not, were slightly younger (mean age 78.4 vs. 79.3 years, p = 0.005) and had more years of education (mean 11.83 vs. 11.34 years, p = 0.027), but did not differ on sex, MMSE and adjusted IADL scores.
Health characteristics
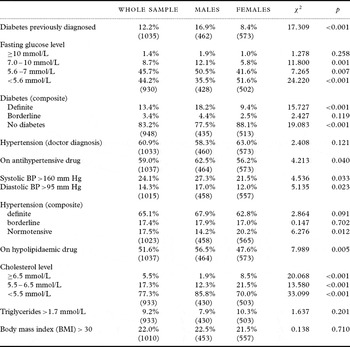
Some of the morbidities of the sample are summarized in Table 3.
Physical health status of participants

Note: Numbers in parentheses indicate size of sample for a particular variable, owing to some missing data.
Vascular risk factors
Hypertension was the most common vascular risk factor, with 60.9% of the sample having been diagnosed with hypertension previously and 59% being currently on antihypertensive drugs. Men and women were equally likely to be diagnosed with hypertension, although men were slightly more likely to be taking medication. At the time of assessment, 24.1% had systolic BP > 160 mm Hg and 14.3% had diastolic BP > 95 mm Hg, with men more likely to be currently hypertensive. Using a systolic BP of 160 and diastolic BP of 95 mm Hg as cut-offs, and including those previously diagnosed, a total of 65.1% had definite hypertension. Another 17.4% had borderline hypertension, with mean current systolic BP between 140 and 160 or diastolic BP 90–95 mm Hg. It is noteworthy that while only 17.5% were normotensive on examination, 59.0% of the sample was being treated with antihypertensive drugs. However, 29.7% of those on antihypertensive medication still had high blood pressure at the time of measurement. Similarly, while the rate of previously diagnosed diabetes mellitus was 12.2%, a number of participants had high fasting blood glucose (≥7 mmol/L) and this included those who had never been diagnosed. While men were more likely to be diabetic, high cholesterol levels were more common in women. Twenty-two percent of participants were judged to be obese (BMI > 30.0), with no sex differences. While 54.0% had smoked at some stage in their lives (men more often than women), only 7.2% had smoked in the last month, the latter being women more often than men (9.9% vs. 5.1%, p < 0.05). Past stroke was reported by 4% and transient ischemic attacks by 6.8%. Coronary artery disease was common, with myocardial infarction being reported by 11.6% and cardiac angina by 13%, both being more common in men. Atrial fibrillation had been diagnosed in 9.2% men and 4.8% women.
Alcohol use
Only 12.5% were total abstainers in the last year, and 28.3% drank daily, with an additional 13.9% drinking 4–6 times a week. Men were more likely to drink alcohol than women (37.0% men vs. 21.2% women who drank daily). Of the total sample, 529 (51%) reported drinking more heavily in the past, with 53.5% of this group reporting a history of drinking on four or more occasions per week and 57.3% reporting a consumption of four or more drinks per day on the average.
Other disorders
Of note, 54.5% had been diagnosed with arthritis, 13.7% with cancer other than skin cancer and 13.2% with thyroid disorder. For thyroid disease, women far outnumbered men. Less common disorders were Parkinson's disease in 1.2%, epilepsy in 0.7%, and autoimmune disorders in 1.9%. Sleep apnoea had been diagnosed in 5.6%, more often in men.
Vision and hearing
While visual problems are common in this age group, 90.3% of the participants in this study had self-reported adequate vision when corrected with glasses; 8.4% had problems reading small fonts or in dim light; 0.7% could not read or watch television and 0.6% were functionally blind. There were no significant sex differences in visual acuity. Hearing was self-reported as adequate in 59.2%, mildly impaired in 40.3% and a serious problem in 0.6%. Men were more likely to have been recommended a hearing aid (40.9% vs. 29.8%, p < 0.001).
Cognitive profile
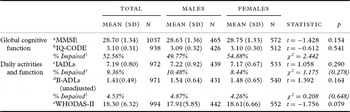
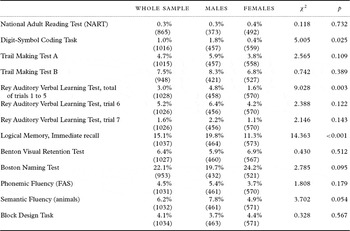
The mean adjusted MMSE score (Anderson et al., Reference Anderson, Sachdev, Brodaty, Trollor and Andrews2007) was 28.70 (SD 1.34) with women scoring only slightly higher than men (28.75 vs. 28.63, t = −1.428, p = 0.154) (Table 4). The informants reported decline in function of the participants over the previous five years, with the mean IQCODE score being 3.1 (SD 0.31), with 52.6% scoring >3.0, the cut-off for significant decline. This was not significantly different in men and women. The participants were mostly independent in ADLs and IADLs, with only 44 (4.5%) being impaired on IADLs based on a score >3.0 on the Bayer-ADL scale. The percentages of individuals with an impaired performance on various neuropsychological tests, based on a score <1.5 SD on published normative data for the individual's age and education where available (see Table 1), are presented in Table 5. The proportion with impairment varied from 1.0% on the Digit-Symbol coding task (Wechsler, Reference Wechsler1997b) to 22.1% on the Boston Naming Test (Kaplan et al, Reference Kaplan, Goodglass and Weintraub2001). Women were less likely to be impaired on the verbal memory tests.
Cognitive and functional status of the sample

aMini-mental State Examination (Folstein et al., Reference Folstein, Folstein and McHugh1975).
bInformant Questionnaire on Cognitive Decline in the Elderly (Jorm, Reference Jorm1994).
cInstrumental Activites of Daily Living (Lawton and Brody, Reference Lawton and Brody1969).
dBayer-Activities of Daily Living (Hindmarch, Reference Hindmarch, Lehfeld, de Jongh and Erzigkeit1998).
eWorld Health Organization Disability Assessment Schedule II (Epping-Jordan and Ustun, Reference Epping-Jordan and Üstün2000).
†Figures in these rows represent the number and percentage of people with impaired function as measured using the IQ-CODE, Instrumental ADL and Bayer ADL scales. Consequently, the relevant statistic for comparing between the sexes is the chi-square. Impairment was defined as: IQ-CODE >3, ADL >7, Bayer ADL ≥3.
Percentage of sample classified as impaired on neurological tests based on published normative data. Because of missing data, the sample size for each test is given in parentheses

Prevalence of MCI
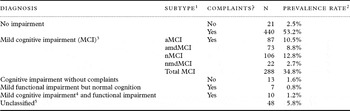
The prevalence of MCI using the international consensus criteria (Winblad et al., Reference Winblad2004) was based on 827 participants with a complete neuropsychological dataset and who had English proficiency adequate for conversation acquired at <9 years of age (Table 6). Participants were considered to have “subjective cognitive complaints” if they identified that their memory or other cognitive functioning was poorer than what it used to be, or they were having some lapses of memory, or their informants reported some decline from previous functioning. The endorsement of items on the MAC-Q by the participants or the IQCODE by the informants was regarded as “subjective” complaints. Using this broad approach, nearly all participants (95.5%) identified at least one subjective complaint. However, the majority of individuals (56.5%) did not have impairment on neuropsychological tests when age-appropriate norms were considered. Two hundred and eighty eight participants (34.8%) had both subjective complaints as well as some objective evidence of impairment in one or more domains of cognitive functioning, meeting the criteria for MCI. Of these cases, 55.5% had poor performance on memory tests (19.3% of all participants) qualifying for amnestic MCI, whereas 44.5% had non-amnestic MCI (15.5% of all participants). The prevalence rates for MCI by five-year age bands (70–75, 75–80, 80–85 and 85–90 years) were 30.9%, 35.0%, 37.3% and 39.1% respectively. There were a few individuals (1.6%) who had impairment on neuropsychological test performance but they or their informants did not report any problems with their cognitive functioning. There were seven (0.8%) individuals who reported cognitive problems but performed well on neuropsychological tests. Another ten (1.2%) had mild impairment of cognition on testing which was insufficient to diagnose dementia but their informants reported impairment in their IADLs. About 6% could not be classified owing to some missing or ambiguous data.
Categorization of cognitive status of participants achieved by consensus, taking into consideration subjective (participant or informant) report, neuropsychological text performance, and functional status based on independence in activities of daily living

1Subtypes apply only to participants with impaired neuropsychology scores.
2Rates are based on a subsample of 827 participants with an English-speaking background and complete neuropsychological data.
3Based on Petersen (Reference Petersen2004) criteria.
4Cognitive impairment insufficient to diagnose dementia, but individuals above the cut-off on IADL scores.
5Due to incomplete data.
aMCI = amnestic MCI; amdMCI = amnestic multidomain MCI; nMCI = non-amnestic MCI; nmdMCI = non-amnestic multidomain MCI.
Psychiatric status
One hundred and sixty-three participants (16.3%) had received a diagnosis of depression at some time in their lives (women 18.5% and men 13.6%, p < 0.036), and of these one-third had received treatment from a psychiatrist. Currently, 7.1% scored 6 or more on the Geriatric Depression scale, and 6.9% scored 5 or more on the Goldberg Anxiety Scale, with no sex differences.
APOE genotyping
APOE genotyping was successfully performed for the majority of the available DNA samples (>99%). Of the 944 Caucasian participants with APOE data, the frequencies of the six APOE genotypes were 0.4% for ɛ2/ɛ2, 1.6% for ɛ4/ɛ4, 1.5% for ɛ2/ɛ4, 13.5% for ɛ2/ɛ3, 19.6% for ɛ3/ɛ4 and 63.5% for ɛ3/ɛ3. Frequencies of the APOE alleles and genotypes in Caucasians were similar to other reports (Henderson et al., Reference Henderson1995; Farrer et al., Reference Farrer1997; Jorm et al., Reference Jorm, Mather, Butterworth, Anstey, Christensen and Easteal2007). The allele frequencies for each APOE single nucleotide polymorphism in Caucasians were in Hardy-Weinberg equilibrium (p > 0.05).
Subjective health
The majority of the participants rated their general health as being good (42.2%), very good (31.2%) or excellent (10.1%), with 14.9% rating it as fair and only 1.6% as poor, with no significant sex differences. Seven hundred and twenty five participants (72.8%) felt their health was better than other individuals their age.
Discussion
This paper describes the methodology and baseline characteristics of the Sydney Memory and Ageing Study. The medical and neuropsychiatric profile of a cohort of elderly individuals recruited into a longitudinal study of cognition and aging has been presented. This is a generally well-functioning cohort, mostly living in private homes and rating their general health as being better than average. The proportion living in private homes is not very different from that of elderly Australians in general. According to the Australian census of 2001 (ABS, 2003), 94.7% of men and 91.8% of women in the age group 75–84 years were living in private homes, with the percentages higher in younger and much lower in older individuals (68.0% and 68.1% respectively in the 85–94 age group). This must be compared with 95.7% in private homes in our sample, noting that we excluded individuals with a diagnosis or a positive screen for dementia, and these are individuals who agreed to participate in a longitudinal study requiring significant cognitive resources.
As would be expected in an elderly cohort, there is significant morbidity in this population. Hypertension was common, with 59% of the cohort currently on anti-hypertensive medication, out of 60.9% who had been diagnosed to be hypertensive by their doctor. However, on examination, 24.1% had systolic hypertension and 14.3% had diastolic hypertension. Untreated or under-treated hypertension is quite common in the Australian population. In the 1999–2000 Australian Diabetes, Obesity and Lifestyle Study (Briganti et al., Reference Briganti2003) prevalence of untreated hypertension in the elderly (≥65 years) was 20.8% (CI 15.6–26.0), and the majority of these individuals had had a blood pressure measurement in the previous 12 months. Our study further supports the contention that hypertension continues to be suboptimally treated in the elderly population.
While diabetes was previously diagnosed in 12.2%, some participants (11.1%) had raised fasting blood glucose levels (≥7 mmol/L). The prevalence of obesity was high (22%), but that of current smoking was low (7.2%). Other common disorders were coronary artery disease, arthritis, cancer and thyroid disease. Vision and hearing are commonly affected in this age group, although aids sufficiently corrected these problems in the majority. However, sensory impairment is an important consideration for performance on neuropsychological tests, and must be taken into account during administration and interpretation.
Our findings may be compared with the baseline characteristics of another elderly Australian cohort, the Australian Imaging, Biomarkers and Lifestyle (AIBL) study of aging (Ellis et al., Reference Ellis2009), with the important difference being that the latter recruited individuals aged >60 years by advertisement in three groups: Alzheimer's disease (n = 211), MCI (n = 133) and healthy controls (n = 768). Rates of hypertension and diabetes were lower in the AIBL study, but co-morbid medical illness was common in both cohorts. APOE ɛ4 carrier frequency was lower in MAS (22.7%) compared to both the healthy control group (27%0 and the MCI group (51%) in the AIBL study.
Elderly individuals almost invariably notice some difficulties with their memory or other cognitive functioning when they compare themselves with younger individuals or with what they used to be able to do (Slavin et al., Reference Slavin2010). In a few cases, the report of decline comes from an informant and not from the study participant. It is rare (3.4% in our study) for there not to be a complaint about cognition from some source at least. This does not mean, however, that participants are concerned about their memory or have objective evidence of impairment. Impaired performance on neuropsychological tests was present in 42.9%, and 33.4% were judged to meet the international consensus criteria for MCI (Winblad et al., Reference Winblad2004). The prevalence rates reported in the literature are very variable, reflecting the methodological differences in the studies. Most studies have reported a prevalence between 12% and 18% in individuals 65 years and older. One of the largest population-based studies – the Canadian Health and Ageing study (Graham et al., Reference Graham1997) – reported cognitive impairment not dementia (CIND) to have a rate of 18%. The Religious Orders Study (Bennett et al., Reference Bennett2002), which comprised volunteers, reported prevalence for MCI of 26.4%, and the Indianapolis Study of Health and Aging reported prevalence of 23.4% (Unverzagt et al., Reference Unverzagt2001). It must be noted that our sample is in the 70–90 age range, and therefore somewhat older than the other studies, and prevalence rates of MCI do increase with age, as they did in our sample, from 30.9% in the youngest age band to 39.1% in the oldest. A study with an age range similar to our study is the Mayo Clinic Study of Aging (Roberts et al., Reference Roberts2008) which is a population-based study of nearly 3000 participants, and reported a prevalence of MCI of 15% in the non-demented population. It is possible that the difference relates to the manner in which the definition of MCI was operationalized (Kochan et al., Reference Kochan2010). We used a neuropsychological algorithm to define MCI. This method is very sensitive to the choice of tests and the cut-offs used (Ritchie et al., Reference Ritchie, Artero and Touchon2001; Larrieu et al., Reference Larrieu2002). Overall, our rates of MCI are somewhat higher than comparable reports in the literature, and we attribute this to methodological differences.
We found that nearly half of the MCI group in our sample had impaired performance on tests of memory, thereby qualifying for amnestic MCI, and about one in four had single domain aMCI. The other half had non-amnestic MCI, which was much more likely to be single domain. The rates of the subtypes of MCI have been very variable in different studies, reflecting the effect of choice of tests and algorithms. In the Mayo Clinic Study (Roberts et al., Reference Roberts2008), the ratio of aMCI to naMCI was 2:1. In the Canadian Study of Health and Aging (Graham et al., Reference Graham1997), 5.3% had a circumscribed memory problem, akin to single domain aMCI. In the Cardiovascular Health Study (Lopez et al., Reference Lopez2003), 6% had single domain aMCI and 16% multiple domain disturbances. The validity of the different criteria is best judged in terms of predictive ability of any set of criteria for decline toward dementia. It is interesting that we found a small proportion of participants (0.73%) who performed in the normative range on neuropsychological tests were impaired on functional measures due to cognitive deficits as judged by their informants.
The rates of psychiatric disorder in our sample are consistent with what has been reported in similar populations. The best comparison data are from the Australian National Mental Health and Well-being Survey, although the age band was different from our cohort. In Australians aged 65 and above in the Survey, the 12-month prevalence of any mood disorder was 2.7% and of any anxiety disorder was 4.4% (Trollor et al., Reference Trollor, Anderson, Sachdev, Brodaty and Andrews2007). The rates in the current study are higher but they are based on a cut-off on a rating scale rather than a diagnostic interview schedule, and this may overestimate the extent of clinical depression. It is interesting that nearly 1 in 8 participants had been diagnosed with depression at some stage in their lives.
In spite of the above disorders reported by the participants, they generally rated their health as being good to excellent. Only 1.6% rated it as being poor. This may reflect the fact that most older individuals expect some physical and cognitive morbidity to be part of the aging process, and report their health in relation to other individuals their own age. It is also possible that our cohort, having agreed to be part of a longitudinal study, have a positive bias toward their health.
Our study has a number of limitations. First, only a proportion of potential participants finally agreed to participate in the study. In fact, an approach was made to nearly 9000 individuals to achieve an eventual sample of 1037. For reasons of confidentiality, we were unable to obtain the demographic characteristics or the reasons for refusal from those who declined to participate, except for age and sex, on which those who declined did not differ from those participating. Our sample cannot therefore be considered to be truly representative of the older population. It is more likely to represent older individuals who live in private homes and are independent in basic activities of daily living. It is not unusual for a sample such as this one to be better educated than the general population, as was the case in another Australian study, the PATH Through Life Study (Jorm et al., Reference Jorm2004; Reference Jorm, Mather, Butterworth, Anstey, Christensen and Easteal2007). Secondly, we excluded individuals with a diagnosis of dementia or an adjusted MMSE score <24, as the objective was to select a non-demented sample. The cohort is therefore likely to be higher functioning than a truly representative population. Thirdly, adequate knowledge of English was required to be able to complete the assessment. Therefore, only 5.9% of the sample used a language other than English as a primary language at home, while 15.8% came from a non-English speaking background. Since all assessments were in English, detailed neuropsychological profiles of the latter group must be received with caution because of lack of good normative data.
Conclusions
The Sydney Memory and Ageing Study is an epidemiologically acquired cohort of elderly individuals from Eastern Sydney, New South Wales, Australia, who have had extensive neuropsychiatric evaluations and are being followed up every two years. It offers an excellent opportunity to examine cognitive disorders longitudinally to determine their correlates, course and outcome. The study also presents an opportunity for national and international collaboration with other similar studies in an effort to detect cognitive disorders early and work toward their prevention.
Conflict of interest
None.
Description of authors' roles
PSS contributed to the study design, obtained research funds, provided supervision of data gathering and analysis, and prepared the first draft and final paper. HB contributed to the study design, obtained research funds, provided supervision of data gathering and analysis, and commented on drafts. SR provided supervision of data gathering and analysis, and commented on drafts. NAK contributed to the study design, provided supervision of data gathering and analysis, and commented on drafts. JNT contributed to the study design, provided supervision of data gathering, and commented on drafts. MJS contributed to the study design, provided supervision of data gathering and analysis, and commented on drafts. JC and KJK contributed to data analysis, and commented on drafts. BD and GAB contributed to the study design, and commented on drafts. KM contributed to genetic testing and data analysis, and commented on drafts. OL contributed to blood tests, clinical chemistry and some data analysis and commented on drafts.
Sydney MAS Team: Allison Bowman, Kim Burns, Joula Dekker, Louise Dooley, Michele de Permentier, Sarah Fairjones, Therese French, Cathy Foster, Emma Nugent-Clearly-Fox, Chien Gooi, Evelyn Harvey, Sharpley Hsieh, Laura Hughes, Sarah Jacek, Mary Johnston, Samantha Meeth, Eveline Milne, Angharad Moir, Roslyn O'Grady, Kia Pfaeffli, Carine Pose, Laura Reuser, Zeeshan Shahnawaz, Amanda Sharpley, Claire Thompson, Wiebke Queisser, Sam Wong: Contributed to data acquisition.
Acknowledgments
DNA samples were extracted by Genetic Repositories Australia, an enabling facility, which is supported by a National Health and Medical Research Council of Australia Grant, 401184. The APOE genotyping was performed by Arezoo Assareh and Karen Mather under the supervision of Professor Peter Schofield and John Kwok at the Prince of Wales Medical Research Institute, Sydney, Australia. Blood samples were collected by South Eastern Area Laboratory Service. Angie Russell assisted with the preparation of the paper. We thank the participants for their enthusiastic support. This study was supported by a National Health and Medical Research Council of Australia Program Grant (ID 350833).