




No CrossRef data available.
ESTIMATING FAILURE PROPAGATION IN MODELS OF CASCADING BLACKOUTS
Published online by Cambridge University Press: 31 August 2005
Abstract
We compare and test statistical estimates of failure propagation in data from versions of a probabilistic model of loading-dependent cascading failure and a power system blackout model of cascading transmission line overloads. The comparisons suggest mechanisms affecting failure propagation and are an initial step toward monitoring failure propagation from practical system data. Approximations to the probabilistic model describe the forms of probability distribution of cascade sizes.
Information
- Type
- Papers from the 8th International PMAPS Conference
- Information
- Probability in the Engineering and Informational Sciences , Volume 19 , Issue 4 , October 2005 , pp. 475 - 488
- Copyright
- © 2005 Cambridge University Press
1. INTRODUCTION
Large blackouts of electric power transmission systems are typically caused by cascading failure of loaded system components. For example, long, intricate cascades of events caused the western North American blackout of 30,390 MW in August 1996 [17] and the eastern North America blackout of 61,800 MW in August 2003 [20]. The vital importance of the electrical infrastructure to society motivates the analysis and monitoring of the risks of cascading failure [11]. In particular, in addition to limiting the start of outages that cascade, it is useful to be able to monitor the tendency of cascading failures to propagate after they are started [3,13].
CASCADE is a probabilistic model of loading-dependent cascading failure that is simple enough to be analytically tractable [12,14,15]. CASCADE contains no power system modeling, but does seem to approximately capture some of the salient features of cascading failure in large blackouts. The CASCADE model has many identical components randomly loaded. An initial disturbance adds load to each component and causes some components to fail by exceeding their loading limit. Failure of a component causes a fixed load increase for other components. As components fail, the system becomes more loaded and cascading failure of further components becomes likely.
The CASCADE model can be well approximated by a Galton–Watson branching process in which failures occur in stages and each failure in each stage causes further failures in the next stage according to a Poisson distribution [13]. The average number of failures in the initial disturbance is θ and the subsequent stochastic propagation of the failures is controlled by the parameter λ, which is the average number of failures caused by each failure in the previous stage.
OPA is a power system blackout model that represents probabilistic cascading line outages and overloads [1]. The network is conventionally modeled using DC load flow and linear programming (LP) dispatch of the generation. The initial disturbance is generated by random line outages and load variations. Overloaded lines outage with a given probability and the subsequent power flow redistribution and generator redispatch can overload further lines, which can then probabilistically outage in a cascading fashion. There is no attempt to represent all of the diverse interactions that can occur during a blackout. However, the modeling does represent a feasible cascading blackout consistent with some basic network and operational constraints. OPA can also model the slow evolution of the network as load grows and the network is upgraded in response to blackouts [2,4], but in this paper, the network is assumed to be fixed and these complex systems dynamics are neglected.
Other authors have constructed power system blackout models involving cascading failure emphasizing different aspects of the problem. Chen and Thorp [5,6] modeled hidden failures, computed the vulnerability of key lines using importance sampling, and examined criticality and blackout mitigation. Ni, McCalley, Vittal, and Tayyib [18] showed how to monitor the risk of a variety of system limits being exceeded; minimizing this risk would have the effect of limiting the risk of cascading events starting. Chen, Zhu, and McCalley [7] showed how to evaluate the risk of the first few likely cascading failures. Rios, Kirschen, Jawayeera, Nedic, and Allan [19] used Monte Carlo simulation to estimate the cost of security, taking account of hidden failures, cascading outages, and transient instability. For further literature review, see [11].
Our ultimate goal is to understand cascading failure in large blackouts from a global systems point of view, identify the main parameters governing the cascading process, and suggest ways to estimate these parameters from real or simulated outage data. These metrics will allow monitoring of the risk of cascading failure and quantifying of the trade-offs involved in blackout mitigation. In this paper, we take a step toward this goal by comparing the abstract cascading failure model CASCADE with the power system blackout model OPA. The comparison reveals which features of the OPA blackouts are captured by the CASCADE model. In particular, we seek to characterize in OPA and measure from OPA results the parameter λ governing the propagation of failures after the start of the cascade. Resolving problems in measuring λ from OPA results is a first step toward measuring the degree to which failures propagate in power systems. If the overall system stress is such that failures propagate minimally, then any failures that occur are likely to be a single failure or a short sequences of failures that cause small blackouts or no blackout. However, if the overall system stress is such that failures propagate readily, then there is a substantial risk of cascading failure leading to large blackouts and it is in the national interest to quantify this risk and examine the economics and engineering of mitigating this risk.
2. CASCADE MODEL AND BRANCHING PROCESS PARAMETERS
This section summarizes the CASCADE model of probabilistic load-dependent cascading failure and its branching process approximation [13,14,15]. (Here, the normalized version of CASCADE is summarized; for many purposes, the unnormalized version is more useful and flexible [12,15].)
The CASCADE model has n identical components with random initial loads. For each component, the minimum initial load is zero and the maximum initial load is one. For j = 1,2,…,n, component j has an initial load [ell ]j that is a random variable uniformly distributed in [0,1]. [ell ]1,[ell ]2,…,[ell ]n are independent.
Components fail when their load exceeds one. When a component fails, a fixed amount of load p ≥ 0 is transferred to each of k components. The k components to which the load is transferred are chosen randomly each time a component fails [14].
To start the cascade, we assume an initial disturbance that loads each component by an additional amount d. Other components may then fail, depending on their initial loads [ell ]j, and the failure of any of these components will distribute the additional load p that can cause further failures in a cascade. The cascade proceeds in stages with M1 failures due to the initial disturbance, M2 failures due to load increments from the M1 failures, M3 failures due to load increments from the M2 failures, and so on. The size of the cascading failure is measured by the total number of components failed, S.
For the case k = n in which load is transferred to all of the system components when each failure occurs, the distribution of S is a saturating quasibinomial distribution [8,15]:

where the saturation function φ is

Note that (1) uses 00 ≡ 1 and 0/0 ≡ 1 when needed.
In the case k < n, no analytic formula such as (1) is currently available, but it can be shown that approximation (4) remains valid [14].
Define

where λ may be interpreted as the total amount of load increment associated with any failure and is a measure of how much the components interact. θ may be interpreted as the average number of failures due to the initial disturbance.
Now, we approximate the CASCADE model [13,14]. Let n → ∞, k → ∞ and p → 0, d → 0 in such a way that λ = kp and θ = nd are fixed. For θ ≥ 0,

The approximate distribution (4) is a saturating form of the generalized Poisson distribution [9,10]. Moreover, under the same approximation, the stages of the CASCADE model become stages of a Galton–Watson branching process [13,16]. In particular, the initial failures are produced by a Poisson distribution with parameter θ. Each initial failure independently produces more failures according to a Poisson distribution with parameter λ, each of those failures independently produces more failures according to a Poisson distribution with parameter λ, and so on. This branching process leads to another interpretation of λ as the average number of failures per failure in the previous stage. λ is a measure of the average propagation of the failures [13].
The expected number of failures in stage j of the branching process is given by

until saturation due to the system size occurs. Formula (5) is exact for the branching process before saturation and an approximation for the expected number of failures in each stage of CASCADE.
Further approximation is useful. Using Stirling's formula and a limiting expression for an exponential for r >> 1, (4) becomes

and if θ/λ ∼ 1 so that also r >> θ/λ, then

Let

In approximation (7), the term r−(3/2) dominates for r [lsim ] r0 and the exponential term dominates for r [gsim ] r0. Thus, (7) reveals that the distribution of the number of failures has an approximate power-law region of exponent −1.5 for 1 << r [lsim ] r0 and an exponential tail for r0 [lsim ] r < r1. Approximation (7) implies that r0 is only a function of λ and does not depend on θ or the system size n.
We discuss some of the implications of the approximation for the form of the distribution of S.
- For λ = 1, (6) becomes
, r0 becomes infinite, and the power-law region extends up to the system size.

- r0−1 = λ − 1 − ln λ is a nonnegative function of λ with a quadratic minimum of zero at λ = 1. Therefore, for a range of λ near one, r0 = (λ − 1 − ln λ)−1 is large and the power-law region extends to large r.
- The risk of large cascades as compared with the risk of small cascades is approximately determined by λ. A small λ gives a distribution with an exponential tail past a small number of failures and a negligible probability of large cascades. λ near one gives a power tail with a significant probability of large cascades and λ > 1 gives a significant probability of all components failing.
- If λ < 1, then P[S = r] increases with θ. The increase is linear for small θ and exponential for large θ. Thus, reducing the probability of failures by decreasing the size of the initial disturbance is most effective when λ is less than and bounded away from one and θ is large.
3. OPA BLACKOUT MODEL
In the OPA model [1], there is a fast timescale of the order of minutes to hours, over which cascading overloads or outages may lead to a blackout. Cascading blackouts are modeled by overloads and outages of lines determined in the context of LP dispatch of a DC load flow model. To start the cascade, random line outages are triggered with a probability p0. A cascading overload may also start if one or more lines are overloaded in the solution of the LP optimization. In this situation, we assume that there is a probability p1 that an overloaded line will outage. When a solution is found, the overloaded lines of the solution are tested for possible outages. Outaged lines are, in effect, removed from the network and a new solution is calculated. This process can lead to multiple iterations, and the process continues until a solution with no more line outages is found. We regard each iteration as one stage of the cascading blackout process. The overall effect of the process is to generate a possible cascade of line outages that is consistent with the network constraints and the LP dispatch optimization.
The parameters p0 and p1 determine the initial disturbance. The level of stress on the system is determined by a multiplier on the loads in the power system.
4. ESTIMATING θ AND λ FROM DATA
This section proposes methods of estimating θ and λ from the data produced by CASCADE or OPA. Both CASCADE and OPA produce a stochastic sequence of failures in stages with M1 failures due to the initial disturbance and subsequent numbers of failures M2, M3, … In the case of OPA, the failures are transmission line outages. If at any stage (including the first stage) there are zero failures, then the cascade of failures ends.
For d > 0, the probability of a nontrivial cascade in the CASCADE model is easily obtained from (1) as

Let the observed frequency of nontrivial cascades be

Then (9) suggests the following estimator for θ:

Let the sample mean of the number of failures in stage j of the cascade be

Then (5) suggests the following estimator for λ based on the data from stage j of the cascade:

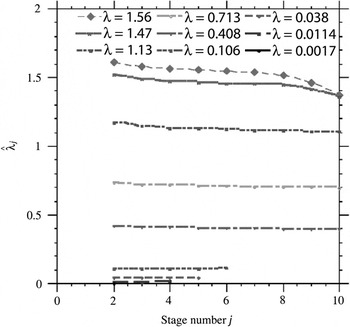
The naive estimators in (11) and (13) have been tested on data produced by CASCADE and they appear empirically to be useful statistics. For example, for λ < 1.3, Figure 1 shows the estimated

as a constant with respect to the stage j, as expected. (For λ > 1.3, the estimated

decreases with the stage j because at higher λ and higher j there are more cascades with all 190 components failed and this saturation effect reduces

. Recall that (5), used to derive (13), assumes no saturation.)

as a function of stage number j from the CASCADE model for λ = 0.0017, 0.0114, 0.038, 0.106, 0.408, 0.713, 1.13, 1.47, and 1.56. There are n = 190 components and θ = 0.095.
5. RESULTS
5.1. Comparing CASCADE and OPA
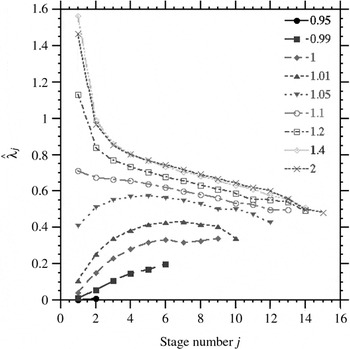
The OPA model on a 190-node treelike network [1] was used to produce line outage data. The load multiplier parameter was varied to vary the system stress. The

computed from the OPA results is plotted in Figure 2. We can see that at high load,

is a decreasing function of the stage j, whereas for low loads,

is an increasing function of the stage j. This functional form is not seen in the CASCADE model results in Figure 1.

as a function of stage number j from the OPA model for various values of the loading multiplier.
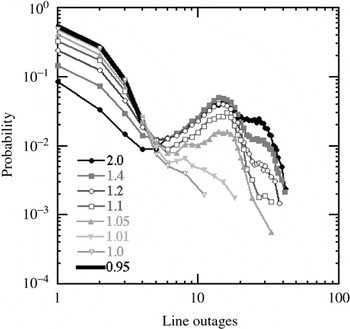
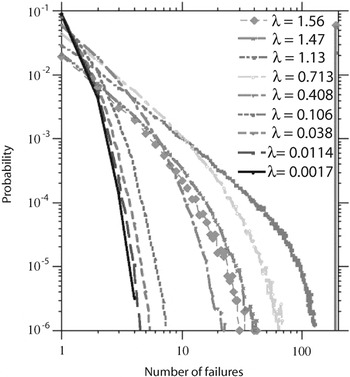
The probability distributions for the number of lines outaged in OPA corresponding to Figure 2 are shown in Figure 3. We can attempt to match these probability distributions with CASCADE by using

from the OPA results as an estimate of θ and using

from the OPA results as an estimate of λ. The resulting CASCADE probability distributions are shown in Figure 4. Although there is reasonable qualitative agreement between the probability distributions from OPA and CASCADE for smaller λ, the OPA probability distributions for larger λ contain a peak not present in the CASCADE probability distributions. We consider a modification to CASCADE to explain this peak in Section 5.2.

Probability distributions of the number of line outages from the OPA model for various values of the loading multiplier.

Probability distributions of the number of failures from CASCADE model using the values of from Figure 2 and . There are n = 190 components. Results for λ > 1 show a significant probability of all 190 components failing.
5.2. Blackout Inhibition Modification to CASCADE
In a blackout, there is not only an effect by which line outages further load the system and tend to cause further outages, but there is also an effect by which sufficient line outages will cause load to be shed and this load shedding reduces the load on the system. (It is also possible, but perhaps less common, for load shedding to introduce large disturbances and imbalances that further stress portions of the system.) Moreover, sufficient line outages will tend to island the system and this can have the effect of limiting further outages; that is, sufficiently many line outages can have an inhibitory effect on further cascading outages.
We attribute the peak in the OPA probability distributions for larger λ to this inhibitory effect. One can argue that for small λ, it is not likely that the cascade will include enough line outages to encounter the inhibitory effect. Moreover, the inhibitory effect could result in the decrease in

as the stage j increases, as observed for the larger λ in Figure 2.
CASCADE does not model the inhibitory effect and one way to test these explanations is to modify CASCADE to model the inhibitory effect. A crude modeling of the inhibitory effect in CASCADE is to halt the cascading process after a fixed number of components rmax have failed; that is, when rmax components have failed, the current stage of the cascade is completed, thus allowing more than rmax components to fail, but the next stage of the cascade is suppressed.
The results of the modified CASCADE model with rmax = 10 are shown in Figures 5 and 6. The decrease in

with j for larger λ is evident in Figure 5 and the peak in the probability distribution for larger λ is evident in Figure 6. These qualitative dependencies in the modified CASCADE results are similar to the OPA results in Figures 3 and 4. However, Figure 5 does not show the increase in

with j for smaller λ, as observed in Figure 2, and a further modification to CASCADE to examine this is considered in Section 5.3.

as a function of stage j from the CASCADE model with inhibition of line outages for various values of λ.

Probability distributions of the number of failures from the CASCADE model with inhibition of line outages for various values of λ.
We comment further on the modified CASCADE results in Figure 5. The value

in the first stage agrees with the input λ; that is, the inhibition does not seem to affect the initial propagation of the cascade. Also,

appears to decrease to a limiting value

for values of

. For

is independent of stage j.
5.3. Random Line Failure Modification to CASCADE
One effect present in OPA but not present in CASCADE is that overloaded lines do not always fail, but, rather, fail with probability p1. Implementing this additional modification in CASCADE for various values of p1 gives

values as shown in Figure 7. Some similar results for OPA are shown in Figure 8 and there is now some qualitative similarity between OPA and the further modified version of CASCADE. In particular, for lower values of p1,

increases with stage j.

as a function of stage j from the CASCADE model with inhibition of line outages and overloaded lines outaged with probability p1 for various values of p1. The parameters are p = 0.25, k = 10, rmax = 15, and n = 200.

as a function of stage j from the OPA model for various values of p1 on a 94-node treelike network.
6. CONCLUSION
We have used the CASCADE probabilistic model of cascading failure and its approximations to define an estimator

of the propagation of failures at stage j of the cascade. The approximations to CASCADE also describe the extent of the region of power-law behavior in probability distributions of cascade size. Testing the estimator

on data produced by the cascading blackout model, OPA suggests that whereas

appears to reflect the initial propagation of line outages,

may decrease or increase with j. Modifications to the CASCADE model that also produce the decrease or increase of

with j suggest explanations of these effects. For example, the decrease in

for larger λ may be attributed to the inhibition of line outages by load shedding after a sufficient number of lines are outaged.
These initial results show that the interplay between the CASCADE and OPA models is useful for understanding the propagation of failures in cascading blackouts and, in particular, will be helpful in devising and testing statistical estimators to quantify this propagation.
Acknowledgments
I. Dobson and B.A. Carreras gratefully acknowledge coordination of this work by the Consortium for Electric Reliability Technology Solutions and funding in part by the Office of Electric Transmission and Distribution, Transmission Reliability Program of the U.S. Department of Energy under contract 9908935 and Interagency Agreement DE-A1099EE35075 with the National Science Foundation. I. Dobson, D.E. Newman, and B.A. Carreras gratefully acknowledge support in part from NSF grants ECS-0214369 and ECS-0216053. Part of this research has been carried out at Oak Ridge National Laboratory, managed by UT-Battelle, LLC, for the U.S. Department of Energy under contract number DE-AC05-00OR22725.
References
REFERENCES
Carreras, B.A.,
Lynch, V.E.,
Dobson, I., &
Newman, D.E.
(2002).
Critical points and transitions in an electric power transmission
model for cascading failure blackouts.
Chaos
12(4):
985–994.Google Scholar
Carreras, B.A.,
Lynch, V.E.,
Dobson, I., &
Newman, D.E.
(2004).
Complex dynamics of blackouts in power transmission systems.
Chaos
14(3):
643–652.Google Scholar
Carreras, B.A.,
Lynch, V.E.,
Dobson, I., &
Newman, D.E.
(2004).
Dynamical and probabilistic approaches to the study of blackout
vulnerability of the power transmission grid.
37th Hawaii International Conference on System Sciences.
Carreras, B.A.,
Lynch, V.E.,
Newman, D.E., &
Dobson, I.
(2003).
Blackout mitigation assessment in power transmission
systems.
36th Hawaii International Conference on System Sciences.
Chen, J. &
Thorp, J.S.
(2002).
A reliability study of transmission system protection via a hidden
failure DC load flow model.
IEE Fifth International Conference on Power System Management and
Control, pp.
384–389.
Chen, J.,
Thorp, J.S., &
Dobson, I.
(2005).
Cascading dynamics and mitigation assessment in power system
disturbances via a hidden failure model.
International Journal of Electrical Power and Energy Systems
27(4):
318–326.Google Scholar
Chen, Q.,
Zhu, K., &
McCalley, J.D.
(2001).
Dynamic decision-event trees for rapid response to unfolding events
in bulk transmission systems.
IEEE Porto Power Tech Proceedings,
vol. 2.
Consul, P.C.
(1974).
A simple urn model dependent upon predetermined strategy.
Sankhya: The Indian Journal of Statistics, Series B
36(4):
391–399.Google Scholar
Consul, P.C.
(1988).
On some models leading to the generalized Poisson
distribution.
Communications in Statistics—Theory and Methods
17(2):
423–442.Google Scholar
Consul, P.C.
(1989).
Generalized Poisson distributions.
New York:
Dekker.
Dobson, I.,
Carreras, B.A.,
Lynch, V.E., &
Newman, D.E.
(2004).
Complex systems analysis of series of blackouts: Cascading failure,
criticality, and self-organization.
IREP Symposium on Bulk Power System Dynamics and
Control—VI.
Dobson, I.,
Carreras, B.A., &
Newman, D.E.
(2003).
A probabilistic loading-dependent model of cascading failure and
possible implications for blackouts.
36th Hawaii International Conference on System Sciences.
Dobson, I.,
Carreras, B.A., &
Newman, D.E.
(2004).
A branching process approximation to cascading load-dependent
system failure.
37th Hawaii International Conference on System Sciences.
Dobson, I.,
Carreras, B.A., &
Newman, D.E.
(2004).
Probabilistic load-dependent cascading failure with limited
component interactions.
IEEE International Symposium on Circuits and Systems.
Dobson, I.,
Carreras, B.A., &
Newman, D.E.
(2005).
A loading-dependent model of probabilistic cascading failure.
Probability in the Engineering and Informational Sciences
19(1):
15–32.Google Scholar
Harris, T.E.
(1989).
Theory of branching processes.
New York:
Dover.
NERC
(2002).
1996 system disturbances.
Princeton, NJ:
North American Electric Reliability Council.
Ni, M.,
McCalley, J.D.,
Vittal, V., &
Tayyib, T.
(2003).
Online risk-based security assessment.
IEEE Transactions on Power Systems
18(1):
258–265.Google Scholar
Rios, M.A.,
Kirschen, D.S.,
Jawayeera, D.,
Nedic, D.P., &
Allan, R.N.
(2002).
Value of security: Modeling time-dependent phenomena and weather
conditions.
IEEE Transactions on Power Systems
17(3):
543–548.Google Scholar
U.S.–Canada Power System Outage Task Force
(2004).
Final report on the August 14th blackout in the United States and
Canada,
United States Department of Energy,
Washington, DC, and
National Resources Canada.
as a function of stage number j from the CASCADE model for λ = 0.0017, 0.0114, 0.038, 0.106, 0.408, 0.713, 1.13, 1.47, and 1.56. There are n = 190 components and θ = 0.095.
as a function of stage number j from the OPA model for various values of the loading multiplier.
Probability distributions of the number of line outages from the OPA model for various values of the loading multiplier.
Probability distributions of the number of failures from CASCADE model using the values of from Figure 2 and . There are n = 190 components. Results for λ > 1 show a significant probability of all 190 components failing.
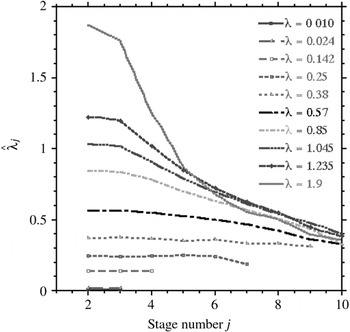
as a function of stage j from the CASCADE model with inhibition of line outages for various values of λ.
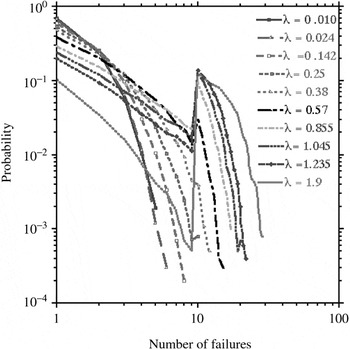
Probability distributions of the number of failures from the CASCADE model with inhibition of line outages for various values of λ.
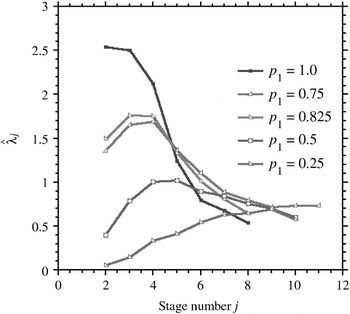
as a function of stage j from the CASCADE model with inhibition of line outages and overloaded lines outaged with probability p1 for various values of p1. The parameters are p = 0.25, k = 10, rmax = 15, and n = 200.
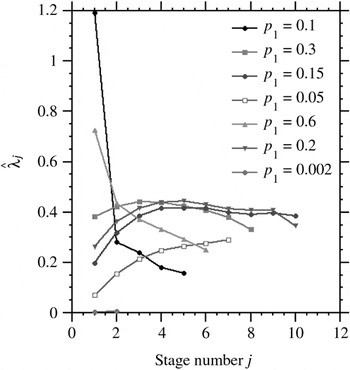
as a function of stage j from the OPA model for various values of p1 on a 94-node treelike network.
 You have
Access
- 36
- Cited by