




1 Introduction
The dynamical significance of vortical structures in the near field of round jets, i.e. the vortex rings and the streamwise vortices, has been known for several decades (see Ho & Huerre (Reference Ho and Huerre1984) for a review). A fundamental understanding of their interactions, especially in turbulent jets at high Reynolds number ( $Re$), can aid in devising control strategies. For example, manipulation of these structures can help improve combustion efficiency and reduce jet noise (Crow & Champagne Reference Crow and Champagne1971; Zaman Reference Zaman1985). This paper aims at exploring further and proving the validity of one such interaction, recently hypothesized to underlie a new shear layer spatial organization in Davoust, Jacquin & Leclaire (Reference Davoust, Jacquin and Leclaire2012).
In round jets, the saturation of the primary Kelvin–Helmholtz instability of the free shear layer results in its rolling up into vortex rings. On the other hand, streamwise vortices are secondary structures, which are assumed to be formed by a three-dimensional instability of either the resulting vortex rings (Widnall & Sullivan Reference Widnall and Sullivan1973; Pierrehumbert & Widnall Reference Pierrehumbert and Widnall1982) or the remnant vorticity present between consecutive rings, as studied by Lin & Corcos (Reference Lin and Corcos1984) and Lasheras & Choi (Reference Lasheras and Choi1988) in plane mixing layers, later extended to round jets by Martin & Meiburg (Reference Martin and Meiburg1991). As shown by these studies, the general organization of the flow in the near field thus consists of a periodic array of vortex rings and an azimuthal array of counter-rotating streamwise vortices (also referred to as ribs or braids), present in the region between the rings (called the ‘braid region’). Various studies have elucidated the existence and organization of the streamwise structures and their dynamical significance in jet mixing and entrainment, such as visualizations by Liepmann & Gharib (Reference Liepmann and Gharib1992), vortex filament methods by Martin & Meiburg (Reference Martin and Meiburg1991) and simulations of Verzicco & Orlandi (Reference Verzicco and Orlandi1994).
Several kinds of vortical interactions of these structures have been observed, like vortex pairing (Zaman & Hussain Reference Zaman and Hussain1980; Shaabani-Ardali, Sipp & Lesshafft Reference Shaabani-Ardali, Sipp and Lesshafft2019) and leapfrog-type interactions (Glauser, Leib & George Reference Glauser, Leib and George1987) that involve vortex rings. Some accounts of the interactions between the streamwise vortices and vortex rings that coexist in the near field were reported in the simulation studies of Martin & Meiburg (Reference Martin and Meiburg1991), Verzicco & Orlandi (Reference Verzicco and Orlandi1994) and Comte, Silvestrini & Bégou (Reference Comte, Silvestrini and Bégou1998). In their experiments on plane mixing layers, Bernal & Roshko (Reference Bernal and Roshko1986) found that the streamwise vortices wound back and forth between alternate spanwise vortices, and Lasheras & Choi (Reference Lasheras and Choi1988) observed wave-like undulations on the cores of the spanwise vortices induced by the former. These structures were seen to develop almost independently of each other in their initial formation stage and possibly interacted in the later stages of their development, as reported in Lasheras & Choi (Reference Lasheras and Choi1988) and Huang & Ho (Reference Huang and Ho1990) for plane mixing layers. Similar inferences were drawn by Martin & Meiburg (Reference Martin and Meiburg1991) in the case of round jets. Verzicco & Orlandi (Reference Verzicco and Orlandi1994) observed formation of cup-like regions of azimuthal vorticity in temporally evolving round jets, which they attributed to the stretching of vortex rings induced by streamwise vortices. Grinstein et al. (Reference Grinstein, Gutmark, Parr, Hanson-Parr and Obeysekare1996) exclusively studied interactions between vortex rings and externally generated streamwise vortices. They observed that these interactions resulted in the deformation of the rings, which further break down into small-scale eddies, helping in controlling combustion rates.
Schematic from Davoust et al. (Reference Davoust, Jacquin and Leclaire2012) showing the simplified structure of the near field of round jets in terms of vortex rings (azimuthal vorticity fluctuations  $\unicode[STIX]{x1D714}_{\unicode[STIX]{x1D703}}^{\prime }$) and streamwise vortices (streamwise vorticity fluctuations
 $\unicode[STIX]{x1D714}_{z}^{\prime }$): (a) as classically described in the literature, and (b) as found in the investigations of Davoust et al. (Reference Davoust, Jacquin and Leclaire2012) and in the current configuration. The solid line represents the axial velocity fluctuations
 $u_{z}^{\prime }$ along the centreline of the jet.

Proposed scenario in Davoust et al. (Reference Davoust, Jacquin and Leclaire2012) that considers an interaction between the fluctuations of azimuthal and streamwise vorticity in a turbulent round jet at  $Re=2.1\times 10^{5}$: (a) observed preferential location of a streamwise vortex with respect to an axisymmetric mode, (b) deformation of the negative azimuthal vorticity fluctuation by the streamwise vortex, and (c) reorientation of the deformed part by mean shear.

Recently, in Davoust et al. (Reference Davoust, Jacquin and Leclaire2012), interactions between fluctuating components of the azimuthal and streamwise vorticity were experimentally observed in round jets at  $Re=2.1\times 10^{5}$ (based on nozzle exit diameter). Instead of the classical azimuthal array of counter-rotating streamwise vortices in the braid region, these vortices appeared to be organized in the radial direction. Figure 1 illustrates this difference, where the azimuthal and axial vorticity fluctuations are denoted by
 $\unicode[STIX]{x1D714}_{\unicode[STIX]{x1D703}}^{\prime }$ and
 $\unicode[STIX]{x1D714}_{z}^{\prime }$, respectively. The tilting of the rings was found to be a manifestation of the first azimuthal mode, i.e.
 $m=\pm 1$. The numerical studies of Martin & Meiburg (Reference Martin and Meiburg1991) and Verzicco & Orlandi (Reference Verzicco and Orlandi1994) found radial organization of opposite-signed streamwise vorticity in the ring region due to wrapping of streamwise vortices around the rings. However, the radial organization observed in Davoust et al. (Reference Davoust, Jacquin and Leclaire2012) was preferentially located in the braid region. From a further analysis of the flow organization, these authors hypothesized that in high-
 $Re$ jets, a scenario based on vortex induction mechanisms, as shown in figure 2, can be possible. It was attributed to the fact that the fluctuations of azimuthal vorticity, corresponding to the axisymmetric mode (
 $m=0$), were found to be weaker than that of the streamwise component. More precisely, the hypothesized scenario basically involves an interaction between a weak
 $m=0$ fluctuation and a stronger streamwise vortex located between two positive azimuthal vorticity fluctuations. According to this, the streamwise vorticity first tends to deform the negative azimuthal vorticity fluctuation in the radial direction. These deformations are further reoriented and stretched in the axial direction by mean shear, resulting in the formation of additional streamwise vorticity of opposite sign in the radial direction.
One possible reason for such an interaction not being realized in earlier studies could be the difficulty of obtaining vorticity field measurements, or in the use of visualization experiments where only the vorticity at the interface of the jet and ambient fluid is seen, as suggested in Davoust et al. (Reference Davoust, Jacquin and Leclaire2012). Also, at higher  $Re$, due to the presence of smaller scales, eduction of these structures becomes more difficult. Such a task is usually devoted to proper orthogonal decomposition (POD) in the context of turbulent flows, due to its ability to order spatial structures by kinetic energy content (Berkooz, Holmes & Lumley Reference Berkooz, Holmes and Lumley1993; Holmes et al. Reference Holmes, Lumley, Berkooz and Rowley2012). While POD, and also its space-time formulation for statistically stationary flows, spectral proper orthogonal decomposition (SPOD) (see e.g. Towne, Schmidt & Colonius Reference Towne, Schmidt and Colonius2018)), have been applied successfully to jets in several studies, such as Glauser et al. (Reference Glauser, Leib and George1987), Citriniti & George (Reference Citriniti and George2000), Jung, Gamard & George (Reference Jung, Gamard and George2004) and Tinney, Glauser & Ukeiley (Reference Tinney, Glauser and Ukeiley2008), these works have focused mostly on the applicability of SPOD to jet flows, and on reconstructing the flow field from a truncated system of SPOD and azimuthal modes. In the current work, however, similar to Davoust et al. (Reference Davoust, Jacquin and Leclaire2012), we take advantage both of high-speed stereo particle image velocimetry (HS-SPIV) and of SPOD to dig deeper into the vortical organization of jets, and in particular to extract the most energetic
 $m=0$ mode, i.e. the vortex rings.
Our motivation is to further explore, and possibly confirm the likelihood of, the interaction proposed by Davoust et al. (Reference Davoust, Jacquin and Leclaire2012), which, though probable, was hypothesized from observations on one configuration of a jet flow, at one given value of  $Re$ only, and therefore with a specific strength of the
 $m=0$ mode relative to the streamwise vortices. As this strength was a key parameter in the proposed scenario, it is varied in the current study through acoustic excitation of the
 $m=0$ mode. The hypothesis is validated by monitoring if the new radial organization is also observed for other cases of dominant streamwise vortices, and, conversely, if stronger vortex rings promote the more traditionally observed azimuthal organization. If this case arises, one will then be able to validate the conjecture of Davoust et al. (Reference Davoust, Jacquin and Leclaire2012), which, in their work, had been left as an open point to be confirmed. Note that, here we often alternate between the terms ‘vortex rings’ and ‘
 $m=0$’ or ‘axisymmetric mode’, wherein a vortex ring in general can consist of higher azimuthal modes, while the
 $m=0$ mode would refer to a perfectly axisymmetric ring. Exciting the
 $m=0$ mode would, in other words, indicate that we are strengthening the rings. In order also to assess the robustness of the scenario to different experimental conditions, we consider, in addition, various values of
 $Re$, and of the Strouhal number (
 $St$) associated with the excitation. The variation in
 $Re$ comes along with different intensities of turbulence in the exiting boundary layer of the jet, becoming an additional parameter. We use SPOD to give a global portrait of the dynamics of the jets, and streamwise vorticity autocorrelations to investigate the vorticity organization, as in Rogers & Moin (Reference Rogers and Moin1987).
In addition to the elements of proof supporting the above-mentioned scenario, we report on some interesting effects of increasing amplitude of excitation on jet physics, which to our knowledge have not been discussed in previous excitation studies (Crow & Champagne Reference Crow and Champagne1971; Zaman & Hussain Reference Zaman and Hussain1980; Samet & Petersen Reference Samet and Petersen1988), as single hot-wire anemometry was the main tool in most of these investigations, allowing the measurement of only one component of velocity. Most of these studies have deduced about the nature of the vortical organization and its application to flow control, mostly from the turbulence statistics of the axial velocity component such as fluctuation intensities and power spectra. In this regard, the current work also contributes in gaining a more complete picture of the effect of excitation through vorticity fields and a characterization of the vortical strengths.
We begin with a description of the experimental set-up and the post-processing tools used, in § 2. The results of a  $Re=1.5\times 10^{5}$, low-Mach-number round jet studied in a cross-sectional plane two diameters downstream of the nozzle using HS-SPIV are detailed in § 3. The impact of exciting the most energetic
 $m=0$ mode is discussed in § 4. In § 5, the robustness of the proposed scenario for jets at different flow conditions is presented, considering different values of
 $Re$ and different states of the initial boundary layer, together with an investigation of the effect of excitation Strouhal number.
2 Flow and diagnostic tools
A round air jet exiting from a nozzle of  $D=15.0~\text{cm}$ diameter, with exit velocity
 $U_{j}$ in the range of 9. 5 to 34. 9 m s-1, as shown in figure 3(a), is generated in the open-circuit wind tunnel R4Ch of ONERA, Meudon. The boundary layer is tripped at 56.0 mm upstream of the nozzle exit with a carborundum strip. This jet is studied using HS-SPIV and hot-wire anemometry (HWA).
(a) Notations for the round jet studied and (b) the HS-SPIV set-up: the measurement plane is at  $Z=2D$, capturing the entire jet.

2.1 Velocity measurements
Hot-wire anemometry was used for point measurements of velocities, especially at the nozzle exit. To compute the power spectral density (PSD), 30 blocks of 8192 samples were recorded with a low-pass filter at 3 kHz and acquisition frequency of 9 kHz, using a Dantec P11 single-wire probe (1.25 mm long and  $5~\unicode[STIX]{x03BC}\text{m}$ diameter sensor).
For the HS-SPIV, two Phantom V710 high-speed cameras equipped with 105 mm lenses at an  $f_{\#}=8$ aperture were used in forward scattering configuration. A high-repetition-rate double-pulse Nd:YLF 527 nm laser synchronized with the cameras generated a 2.5 mm thick light sheet. The inter-pulse time was adjusted such that a maximum displacement of 7 pixels is obtained on the camera images. Sixteen blocks of 4096 double-frame image pairs were recorded at an acquisition frequency
 $F_{a}=2.5~\text{kHz}$. Velocity vectors were computed using FOLKI-SPIV, an in-house PIV software described in Champagnat et al. (Reference Champagnat, Plyer, Le Besnerais, Leclaire, Davoust and Le Sant2011). An interrogation window size of 31 pixels was chosen, which yielded a spatial resolution of the vector field of 2.7 mm (
 $0.018D$). All the HS-SPIV measurements presented here were made in the
 $Z=2D$ cross-sectional plane. Figure 3(b) summarizes this through a schematic representation of the set-up. The
 $Z=2D$ plane was chosen as being sufficiently downstream such that the mixing layer is fully developed and has lesser influence of the upstream conditions, including exiting boundary layer characteristics and that of the jet facility. Additionally, it was upstream enough to allow the study of the initial evolution of the structures and also such that the required measurement plane could be captured by the available HS-PIV system to obtain a good spatial resolution.
To provide an estimate of the uncertainty associated with the quantities of interest obtained with HS-SPIV in this study, we monitored the distribution of values obtained in flow zones in which these quantities were known from physics to be uniform. We then chose the associated uncertainty estimate as  $\pm 2\unicode[STIX]{x1D70E}$ of the distribution,
 $\unicode[STIX]{x1D70E}$ standing for the standard deviation (leading to a 95 % confidence level if the distribution were Gaussian). The uncertainty on the mean axial velocity was then found to be ±0. 3 %, and on the turbulence intensities to be ±0. 4 % of
 $U_{j}$. For the root mean square (r.m.s.) of the vorticity field, an uncertainty of ±6. 0 % was estimated. Note that the uncertainties estimated in such a way thus account for measurement noise (in the case of averaged fluctuating quantities) as well as possible residual bias sources of HS-SPIV, such as peak locking. Statistical error is found to be negligible, this point having been verified through a convergence study. It should be noted that, given the approach chosen, these estimates, however, cannot account for the effect of spatial filtering due to the presence of significant flow gradients at the scale of the PIV interrogation windows. However, we will provide a typical estimate of this phenomenon by comparing HS-SPIV and HWA results, in § 3.1.
2.2 Axisymmetric excitation and parameters studied
Acoustic excitation was achieved by means of a loudspeaker mounted on top of the settling chamber, which provided axisymmetric forcing at the nozzle exit. The loudspeaker was driven by a pure sine wave whose amplitude can be varied through the voltage supplied to the loudspeaker. Irrespective of the exit jet velocities  $U_{j}$, significant amplitudes of excitation were obtained at a frequency
 $F$ of 52 Hz, which has thus been assumed to be one of the resonant frequencies of the settling chamber. Our first aim is to selectively excite the most energetic
 $m=0$ mode to demonstrate the validity of the hypothesis of Davoust et al. (Reference Davoust, Jacquin and Leclaire2012), which accounts for the radial organization of streamwise vortices found in high-
 $Re$ jets. Figure 4 shows the axial velocity spectra at
 $Z=2D$ for a range of
 $U_{j}$. The peak in the spectra scales with
 $U_{j}$ to yield a constant Strouhal number of
 $St=FD/U_{j}\approx 0.49$. As the excitation frequency
 $F_{e}$ in our experiments had to be fixed at 52 Hz in order to reach sufficient amplitudes, we chose to set the jet exit velocity to
 $U_{j}=15.9~\text{m}~\text{s}^{-1}$. This resulted in a Reynolds number
 $Re=1.5\times 10^{5}$ and excitation Strouhal number,
 $St_{e}=F_{e}D/U_{j}=0.49$.
We then varied the  $Re$ of the flow, by changing
 $U_{j}$, to determine the robustness of the proposed mechanism for different flow parameters. In that process, it was noted that transitional and fully turbulent boundary layers were obtained with the same strip, depending on the exit velocity. The state of the boundary layer is determined here according to the classification of Zaman (Reference Zaman1985), based on the mean velocity profile and the peak turbulence intensities in the exiting boundary layer. For instance, the
 $Re=1.5\times 10^{5}$ jet has an initially transitional (or more precisely nominally laminar) boundary layer that is neither fully laminar nor fully turbulent, as quite often encountered in applications, this point having been investigated in particular by Zaman (Reference Zaman2012) with regards to jet noise. However, it will be shown here that, interestingly, this boundary layer state has no observable influence on the dynamics under consideration.
The influence of  $St_{e}$ on the discussed interaction between the
 $m=0$ mode and streamwise vortices was also explored. This was achieved by varying
 $U_{j}$ at the fixed frequency of excitation, 52 Hz, in order to maintain the possibility of reaching high excitation amplitudes. Table 1 gathers the explored values, along with the corresponding
 $St_{e}$ and boundary layer states. Note that, for one of the exit velocities, we also removed the carborundum strip in order to reach laminar boundary layer conditions. Four values of
 $U_{j}$ were examined,
 $U_{j}=9.5~\text{m}~\text{s}^{-1}$ being the lowest possible one in the current set-up and the highest being
 $U_{j}=34.9~\text{m}~\text{s}^{-1}$. The
 $U_{j}=9.5~\text{m}~\text{s}^{-1}$ jet was in fact not excited, as it resulted in amplification of different frequencies at the nozzle exit. We ascribe this to an operational instability of the centrifugal fan upstream of the loudspeaker at low velocities. This point was thus considered within the
 $Re$ variation only. The other three values for
 $U_{j}$ were chosen to target
 $St_{e}=0.49$, 0.35 and 0.22. The value
 $St_{e}=0.35$ was chosen to be in the range of the so-called preferred mode of jets (Crow & Champagne Reference Crow and Champagne1971) and
 $St_{e}=0.22$ to be in the lower end of the natural spectrum of figure 4, which corresponds to a less energetic
 $m=0$ mode.
Power spectral density (PSD) of the non-dimensional axial velocity fluctuations ( $u_{z}^{\prime }/U_{j}$) measured on the jet axis at
 $Z=2D$, as a function of
 $St=fD/U_{j}$ for the exit jet velocities
 $U_{j}=15.8~\text{m}~\text{s}^{-1}$ (dashed line),
 $22.2~\text{m}~\text{s}^{-1}$ (dash-dotted line) and
 $28.0~\text{m}~\text{s}^{-1}$ (dotted line).

Parameters explored in this study. Note that the most energetic frequency at  $Z=2D$ scales with
 $U_{j}$ to give
 $St\approx 0.49$, and that the excitation frequency was fixed at 52 Hz.

2.3 Frame of reference and notation
The acquired HS-SPIV data are transformed from Cartesian ( $x,y$) to cylindrical (
 $r,\unicode[STIX]{x1D703}$) coordinates using bilinear interpolation, with a resolution of
 $N_{r}=34$ points in the radial and
 $N_{\unicode[STIX]{x1D703}}=128$ points in the azimuthal directions. This preserves the resolution in the shear layer on both the grids. The mean velocity is subtracted from the instantaneous field to yield the fluctuation velocity field, which is the basis for all the statistical measures presented in this paper.
In the following sections, we represent dimensional quantities by uppercase ( $R,\unicode[STIX]{x1D6E9},Z$) and non-dimensional by lowercase (
 $r,\unicode[STIX]{x1D703},z$) symbols in the cylindrical coordinate system. Lengths and velocities are presented in non-dimensional forms scaled with the nozzle exit diameter (
 $D$) and centreline average jet velocity (
 $U_{j}$), respectively. Non-dimensional time is expressed by
 $t$ and frequency by Strouhal number,
 $St=FD/U_{j}$, with
 $St_{e}$ denoting the excitation Strouhal number, as already introduced above. We denote the components of the mean velocity vector by (
 $u_{r},u_{\unicode[STIX]{x1D703}},u_{z}$), the fluctuations by a prime (
 $u_{r}^{\prime },u_{\unicode[STIX]{x1D703}}^{\prime },u_{z}^{\prime }$) and the turbulence or fluctuation intensities by superscript
 $rms$, denoting root mean square (e.g.
 $u_{z}^{rms}=\langle u_{z}^{\prime }\rangle ^{1/2}$). Unless specified, most of the measurements are at
 $z=2$, a cross-sectional plane at two diameters from the nozzle exit.
2.4 Spectral proper orthogonal decomposition
We have used SPOD to extract the most energetic structures in the flow, similar to Davoust et al. (Reference Davoust, Jacquin and Leclaire2012). Owing to the statistical stationarity and axisymmetry of the flow, the SPOD eigenfunctions in time and azimuthal direction are then the Fourier modes. In practice, each component ( $u_{i}$ for
 $i=z,r,\unicode[STIX]{x1D703}$) of the fluctuations of the velocity vector are first Fourier-transformed in
 $t$ and
 $\unicode[STIX]{x1D703}$ as
 $$\begin{eqnarray}\hat{u} _{i}(r,m,f)=\int _{0}^{t_{0}}\int _{0}^{2\unicode[STIX]{x03C0}}u_{i}^{\prime }(r,\unicode[STIX]{x1D703},t)\text{e}^{-\text{i}(m\unicode[STIX]{x1D703}+2\unicode[STIX]{x03C0}ft)}\,\text{d}\unicode[STIX]{x1D703}\,\text{d}t,\end{eqnarray}$$
where  $t_{0}$ is the acquisition length of each block, and
 $f$ is a duplicate notation for the reduced frequency or Strouhal number
 $St$, which we use here instead of
 $St$ to avoid confusion in the equations. SPOD modes
 $\unicode[STIX]{x1D719}_{i}^{(n)}(r,m,f)$ with
 $n=1,2,\ldots$ for the given ensemble are found using
 $$\begin{eqnarray}\int _{0}^{r_{0}}B_{ij}(r,r^{\prime },m,f)\unicode[STIX]{x1D719}_{j}^{(n)}(r^{\prime },m,f)\,\text{d}r^{\prime }=\unicode[STIX]{x1D706}^{(n)}(m,f)\unicode[STIX]{x1D719}_{i}^{(n)}(r,m,f),\end{eqnarray}$$
where  $r_{0}$ is the radial extent of the measurement plane and
 $\unicode[STIX]{x1D706}^{(n)}$ are the eigenvalues. The Hermitian symmetric kernel (
 $B_{ij}$) is the weighted two-point cross-spectrum given by
 $$\begin{eqnarray}B_{ij}(r,r^{\prime },m,f)=r^{1/2}\langle \hat{u} _{i}(r,m,f)\hat{u} _{j}^{\ast }(r^{\prime },m,f)\rangle {r^{\prime }}^{1/2},\end{eqnarray}$$
with  $x^{\ast }$ representing the complex conjugate of
 $x$. The angle bracket
 $\langle ~\rangle$ denotes the ensemble average over all the data blocks. The members of the ensemble can be reconstructed through
 $$\begin{eqnarray}\hat{u} _{i}(r,m,f)=\frac{1}{r^{1/2}}\mathop{\sum }_{n}\hat{a}^{(n)}(m,f)\unicode[STIX]{x1D719}_{i}^{(n)}(r,m,f),\end{eqnarray}$$
where  $\hat{a}^{(n)}(m,f)$ are the coefficients found by projecting the velocity vector onto the SPOD basis as
 $$\begin{eqnarray}\hat{a}^{(n)}(m,f)=\int _{0}^{r_{0}}r^{1/2}\hat{u} _{i}(r,m,f)\unicode[STIX]{x1D719}_{i}^{\ast (n)}(r,m,f)\,\text{d}r.\end{eqnarray}$$
More details about the implementation of SPOD are given in appendix A.
3 Analysis of the unexcited jet at  $Re=1.5\times 10^{5}$

3.1 Inflow conditions and characterization of HS-SPIV measurements with HWA
Mean and fluctuation intensity profiles of the axial velocity near the nozzle exit, at  $z=0.003$, are shown in figure 5. The exiting boundary layer is transitional. While the mean velocity fits the Blasius boundary layer profile, the peak turbulence intensity is as high as 2 % for the boundary layer to be fully laminar. The boundary layer momentum thickness,
 $\unicode[STIX]{x1D6FF}_{\unicode[STIX]{x1D703}}$, is equal to 0.0021. It is known that the inflow conditions of the exiting boundary layer from the nozzle can play a role in the downstream evolution of jets (Hussain & Zedan Reference Hussain and Zedan1978; Bogey & Bailly Reference Bogey and Bailly2010). However, it will be shown in § 5.1 that the phenomenon observed in the current work is not sensitive to these conditions.
With regards to temporal aliasing due to the high acquisition rate of 2.5 kHz for HS-SPIV, it has been shown in Davoust et al. (Reference Davoust, Jacquin and Leclaire2012) that the limited spatial resolution of HS-SPIV also prevents temporal aliasing. Figure 6(a) shows this temporal filtering through the comparison of frequency spectra of axial velocity fluctuations at  $z=2$ obtained with HS-SPIV and HWA. The two techniques agree well up to
 $St=1$, after which HS-SPIV has a cutoff of up to -8 dB (at
 $St=9.5$) in the shear layer. Besides, it can be noted that the shear layer exhibits a broadband spectra, while in the core there is a broad peak, as in figure 4, which can be interpreted as a signature there of the large-scale structures from the shear layer. Also, the mean and fluctuation intensities at
 $z=2$ are compared for the two techniques in figure 6(b). Good agreement is found in the core, whereas in the shear layer, HS-SPIV captures up to 80 % of the fluctuations owing to its inherent filtering of turbulence.
Axial velocity profiles of the unexcited jet at  $Re=1.5\times 10^{5}$ near the nozzle exit (
 $z=0.003$) obtained using HWA: mean velocity (—●—) and r.m.s. (—
 $\times$—).

Comparison between HS-SPIV and HWA measurements for the unexcited jet at  $Re=1.5\times 10^{5}$ at
 $z=2$. (a) PSD of the axial velocity in the jet core (
 $r=0.24$) and shear layer (
 $r=0.51$): solid black line, HS-SPIV; and dotted blue line, HWA measurements. (b) Radial profiles of mean and r.m.s. of the axial velocity: solid black line, HS-SPIV; and dashed blue lines, HWA measurements, for
 $u_{z}|_{z=2}$ (– –●– –) and for
 $u_{z}^{rms}|_{z=2}$ (– –
 $\times$– –).

3.2 Azimuthal and frequency distribution
We then look at the distribution of velocity fluctuations with respect to frequency  $f$ and azimuthal wavenumber
 $m$, along with the contribution from the most energetic structures (corresponding to
 $n=1$, i.e. the first POD mode) at
 $z=2$. Here we restrict to the main observations, as the natural dynamics of the present jet at
 $Re=1.5\times 10^{5}$ were found to be nearly identical to those of Davoust et al. (Reference Davoust, Jacquin and Leclaire2012) at
 $Re=2.1\times 10^{5}$. Using the same notation as in that study, the azimuthal and frequency spectra can be computed from (2.3). The unweighted two-point cross-spectrum
 $S_{ij}$ is given by
 $$\begin{eqnarray}S_{ij}(r,r^{\prime },m,f)=\langle \hat{u} _{i}(r,m,f)\hat{u} _{j}^{\ast }(r^{\prime },m,f)\rangle =\frac{B_{ij}(r,r^{\prime },m,f)}{r^{1/2}{r^{\prime }}^{1/2}}.\end{eqnarray}$$
The azimuthal spectrum  $Sm_{i}(r,m)$, which represents the fraction of the kinetic energy contained in the
 $i$th component of the fluctuating velocity vector corresponding to mode
 $m$ at radius
 $r$, can be computed as
 $$\begin{eqnarray}Sm_{i}(r,m)=\int S_{ii}(r,r,m,f)\,\text{d}\,f=\frac{1}{r}\int B_{ii}(r,r,m,f)\,\text{d}\,f.\end{eqnarray}$$
Truncating to  $n=1$ POD mode, the azimuthal spectrum can be expressed in terms of the eigenfunctions
 $\unicode[STIX]{x1D719}_{i}$ as
 $$\begin{eqnarray}Sm_{i}^{(1)}(r,m)=\frac{1}{r}\int \unicode[STIX]{x1D706}^{(1)}(m,f)|\unicode[STIX]{x1D719}_{i}^{(1)}(r,m,f)|^{2}\,\text{d}\,f.\end{eqnarray}$$
Figure 7 shows the azimuthal spectra of the axial velocity,  $Sm_{z}(r,m)$, at two radial locations, in the jet core and the shear layer. The dominance of the
 $m=0$ mode in the core (
 $r=0.24$) and of the higher azimuthal modes (
 $m=4{-}7$) in the shear layer (
 $r=0.51$) can be seen, in agreement with previous studies (Citriniti & George Reference Citriniti and George2000; Jung et al. Reference Jung, Gamard and George2004). It was shown in Davoust et al. (Reference Davoust, Jacquin and Leclaire2012) that the second most energetic azimuthal mode in the jet core, the
 $m=\pm 1$ mode, is related to the tilting of the vortex rings with respect to the jet axis, as was also observed by Liepmann & Gharib (Reference Liepmann and Gharib1992) in their visualizations. It is interesting to look at the dominance of higher azimuthal modes in the shear layer. Azimuthal wavenumbers in the neighbourhood of
 $m=5$ have the maximum energy fraction, as also found in past experimental studies (see e.g. the SPOD results of Glauser et al. (Reference Glauser, Leib and George1987), Citriniti & George (Reference Citriniti and George2000) and Jung et al. (Reference Jung, Gamard and George2004)), and therefore have been often used in numerical simulations to trigger three-dimensional instabilities in jets (Martin & Meiburg Reference Martin and Meiburg1991; Brancher, Chomaz & Huerre Reference Brancher, Chomaz and Huerre1994). Figure 7 includes as well the truncated system with only the
 $n=1$ POD mode, where it can be seen that the first POD mode approximates well the dynamics in the jet core. However, in the shear layer, a higher number of POD modes are required to capture the turbulent flow region, with still a significant contribution from the
 $n=1$ POD mode.
Azimuthal spectra of the axial velocity corresponding to full spectra  $Sm_{z}(r,m)$ (●) and to the first POD mode only,
 $Sm_{z}^{(1)}(m)$ (

 $r=0.24$; and (b) in the shear layer,
 $r=0.51$.

The frequency spectrum  $Sf_{i}(r,f)$ can be computed as
 $$\begin{eqnarray}Sf_{i}(r,f)=\mathop{\sum }_{m}S_{ii}(r,r,m,f).\end{eqnarray}$$
Again, on truncation to  $n=1$ POD mode, it can be expressed as
 $$\begin{eqnarray}Sf_{i}^{(1)}(r,f)=\frac{1}{r}\mathop{\sum }_{m}\unicode[STIX]{x1D706}^{(1)}(m,f)|\unicode[STIX]{x1D719}_{i}^{(1)}(r,m,f)|^{2}.\end{eqnarray}$$
The frequency spectrum of the axial velocity in the jet core (figure 8) also shows the significant contribution of the  $m=0$ and
 $n=1$ POD mode to the overall dynamics in the core. With the inclusion of the first azimuthal modes (
 $m=\pm 1$), the truncated system containing just the
 $n=1$ POD mode again provides a good description of the dynamics. The broad peak in the spectrum arises from the
 $m=0$ mode, which is spread over a range of frequencies, with the most energetic frequency occurring at
 $St=0.49$. This peak can be interpreted as the passage frequency of the most energetic vortex rings at
 $z=2$. Axisymmetric excitation at this frequency will be studied in the following section.
Frequency spectra of the axial velocity at  $z=2$ in the core at
 $r=0.24$; the full spectrum
 $Sf_{i}(r,f)$ is represented by the solid black line. The contribution from the first POD mode,
 $Sf_{i}^{(1)}(r,f)$, corresponding to
 $m=0$ is denoted by the blue dashed line,
 $m=\pm 1$ by the red and green dotted lines and
 $m=[-1,0,1]$ by the blue solid line with filled circles, presented on a linear scale.

4 Effect of axisymmetric excitation at the most energetic natural frequency,$St_{e}=0.49$

Having characterized the unexcited jet, we now discuss its response to excitation at  $St_{e}=0.49$ for increasing excitation amplitudes, in terms of changes in the flow topology and vortical organization. Similar to Crow & Champagne (Reference Crow and Champagne1971), the excitation amplitude is expressed in terms of fluctuation intensities, or r.m.s. of the axial velocity at the jet exit centreline (
 $u_{z}^{rms}|_{z=0,r=0}$), which for an unexcited jet is very small, typically below 0.5 %. As explained by these authors, this quantity can be seen as a signature of the large-scale structures. The response of the jet is then sought in terms of fluctuation intensities on the centreline at
 $z=2$ (
 $u_{z}^{rms}|_{z=2,r=0}$), as shown in figure 9. At low excitation amplitudes, we observe an almost linear response, which quickly gets saturated under nonlinearities as the amplitude increases.
We varied the excitation amplitude along this curve and observed the changes in the flow topology. Especially,  $u_{z}^{rms}|_{z=0,r=0}=1.4\,\%$, 2.6 % and 4.8 % were studied in detail, and are presented in the following sections. This choice will be justified later in § 4.3, where we will discuss the organization of streamwise vortices. As a comparison, we recall that Crow & Champagne (Reference Crow and Champagne1971) and Hussain & Zaman (Reference Hussain and Zaman1981) used 2 % forcing in their excitation studies.
The response of the jet expressed as fluctuation intensities on the jet axis at  $z=2$ (
 $u_{z}^{rms}|_{z=2,r=0}$), as a function of the excitation amplitude at the nozzle exit (
 $u_{z}^{rms}|_{z=0,r=0}$).

4.1 Fluctuation intensities
Figure 10 shows the effect of increasing excitation amplitude on the exiting boundary layer, measured in terms of axial velocity. While no appreciable change is observed in the mean profile even at the highest amplitude (4.8 %), there is a monotonic increase in the r.m.s. velocities in the jet core as well as in the shear layer. The peak r.m.s. values reach up to 12 % for the most excited case, while the mean profiles remain of the Blasius type, thus making the boundary layer transitional whatever the excitation level.
The effect of excitation on the exit boundary layer ( $z=0.003$) in terms of axial velocity measured by HWA: (a) mean and (b) fluctuation intensities, where the solid black line represents the unexcited jet, and other lines represent excitation at
 $u_{z}^{rms}=1.4\,\%$ (dotted red line), at 2.6 % (dash-dotted green line) and at 4.8 % (dashed blue line).

The radial profiles of fluctuation intensities at  $z=2$ are shown in figure 11, averaged in the azimuthal direction, as the flow is statistically axisymmetric. With increasing excitation amplitudes, one observes an increase in the r.m.s. of axial and radial components of velocity, which are mainly induced by the vortex rings, with no appreciable change in the azimuthal component, as expected. In figure 11(a)
 $u_{z}^{rms}$ can be seen to develop a local minimum at
 $r\approx 0.58$, not observed in the natural case. The phase-averaged longitudinal views of streamwise vorticity and azimuthal vorticity shown in figure 12, performed on a Taylor reconstruction and using the excitation as reference signal, indicate that this location of the minimum coincides with the core of the vortex rings. Details about the use of Taylor’s hypothesis are given in § 4.2, and about the phase averaging in appendix B. The appearance of this minimum in
 $u_{z}^{rms}$ could thus be due to the regularization in the formation of vortex rings at the excitation frequency, i.e. the cores of the rings could occur at the same radial location in the shear layer as they convect downstream. When considering the azimuthal spectra of the axial velocity in the shear layer at
 $r=0.51$ (figure 13b), one observes a decrease in the higher azimuthal modes with increasing levels of excitation. This again suggests the increasing axisymmetry of the flow with excitation, even in the shear layer. On the other hand, no appreciable change in the distribution of higher azimuthal modes is observed in the jet core at
 $r=0.24$ in figure 13(a), except for slight elevations in their energy levels.
Going back to the phase-averaged vorticity fields of figure 12, we see a remarkable persistence of the vortical structures even upon phase averaging. This compares well with the classical portrait observed in the visualizations of Liepmann & Gharib (Reference Liepmann and Gharib1992) for round jets at low  $Re$, where the streamwise vortices were found wrapping around the azimuthal rings. Also, regions of high positive azimuthal vorticity fluctuations contain high streamwise vorticity fluctuations (see the light patches close to
 $r\approx 0.6$), suggesting that the rings are corrugated in the azimuthal direction and not perfectly axisymmetric, as could have been expected with the excitation. Possibly, the peak observed at
 $r=0.58$ in the r.m.s. profile of
 $\unicode[STIX]{x1D714}_{z}^{\prime }$ in figure 11(d) could also be a trace of this corrugation. However, it must be noted that there should be a contribution from
 $\unicode[STIX]{x1D714}_{z}^{\prime }$ in the streamwise vortices as well towards this peak value. The other peak in the r.m.s. profile occurs at
 $r=0.38$, which is near the downstream edge of a streamwise vortex. The streamwise vortices appear closest to the vortex rings at this location and near the upstream edge, where they wrap around the rings. Besides, the
 $\unicode[STIX]{x1D714}_{z}^{rms}$ values remain almost the same with increasing levels of excitation and the radial extent where they are significant increases, indicating the spread of streamwise vorticity into the jet core. Section 4.3 will shed more light into this, where we will study the streamwise vorticity organization in detail.
Radial profiles of fluctuation intensities at  $z=2$ of (a) axial, (b) radial and (c) azimuthal velocity and (d) streamwise vorticity, where the solid black line represents the unexcited jet, and other lines represent excitation at
 $u_{z}^{rms}=1.4\,\%$ (dotted red line), at 2.6 % (dash-dotted green line) and at 4.8 % (dashed blue line).

The azimuthal spectra of  $\unicode[STIX]{x1D714}_{z}^{\prime }$ are presented in figure 14. For the unexcited jet, the streamwise vorticity is distributed over a range of azimuthal wavenumbers from
 $m=2$ to 10, while for the most excited case, that range is narrowed down to
 $m=5{-}9$ at
 $r=0.38$, and around
 $m=5$ at
 $r=0.58$. This suggests that excitation also leads to a regularization in the formation of streamwise vortices. A look into the azimuthal spectra of
 $u_{r}^{\prime }$ and
 $u_{\unicode[STIX]{x1D703}}^{\prime }$, from which
 $\unicode[STIX]{x1D714}_{z}^{\prime }$ is computed, reveals that the two peaks at
 $r=0.38$ and 0.58 stem from the distribution of the azimuthal velocity component. Noting that
 $u_{\unicode[STIX]{x1D703}}^{\prime }$ can be induced by the streamwise vortices but not by the
 $m=0$ mode, the azimuthal wavenumber in figure 14 at
 $r=0.38$ could thus possibly be interpreted as the average number of streamwise vortices in the shear layer. The azimuthal wavenumber at
 $r=0.58$, pertaining to the vortex rings as mentioned above, could relate to the number of corrugations that they exhibit, the
 $u_{\unicode[STIX]{x1D703}}^{\prime }$ being induced by the tilted part of the rings in the axial direction. Owing to the closeness of the maximal values for
 $m$ at those two radial locations, it could be hypothesized that the presence of the streamwise vortices and the corrugations in the vortex rings could be linked to one another. Indeed, Martin & Meiburg (Reference Martin and Meiburg1991) found in round jets that the streamwise vortices caused waviness on the cores of the vortex rings where they wrapped around the rings, and Lasheras & Choi (Reference Lasheras and Choi1988) observed wavy undulations in the spanwise rollers caused by streamwise vortices in planar mixing layers.
4.2 Taylor’s reconstruction in the axial direction
Since in our experiments, the HS-SPIV measurement plane is at a fixed downstream location, the local spatial structure of the flow in the axial direction is derived from the temporal snapshots using Taylor’s hypothesis. For low turbulence intensities compared to the mean flow speed, Taylor’s hypothesis of frozen turbulence allows one to view temporal fluctuations at a fixed point in space as a result of a frozen spatial structure convecting past that point at the mean flow speed, or the convection velocity  $u_{c}$ (Taylor Reference Taylor1938). An appropriate convection velocity and the validity of the hypothesis must be carefully considered while applying this hypothesis. Davoust & Jacquin (Reference Davoust and Jacquin2011) proposed a method based on the continuity equation to calculate
 $u_{c}$, particularly suited for experimental data. Computing in the Fourier space,
 $u_{c}$ was obtained as a function of frequency and spatial location in a measurement plane normal to the mean flow. The application of this method to compute
 $u_{c}$ in the current work is detailed in appendix C.
Phase-averaged (a)  $\unicode[STIX]{x1D714}_{z}^{\prime }$ and (b)
 $\unicode[STIX]{x1D714}_{\unicode[STIX]{x1D703}}^{\prime }$ for two periods, reconstructed using Taylor’s hypothesis from HS-SPIV measurements at
 $z=2$, for the most excited case at 4.8 %. Extraction in the longitudinal plane. See § 4.2 for more details on Taylor’s reconstruction.

Variation of azimuthal spectra of the axial velocity with increasing excitation levels, where the solid black line represents the unexcited jet, and the other lines represent excitation at  $u_{z}^{rms}=1.4\,\%$ (dotted red line), at 2.6 % (dash-dotted green line) and at 4.8 % (dashed blue line). This is a close-up of the higher azimuthal modes, the
 $m=0$ mode having very high amplitudes for the excited cases (a) in the core
 $r=0.24$ and (b) in the shear layer
 $r=0.51$.

Azimuthal spectra of the streamwise vorticity ( $\unicode[STIX]{x1D714}_{z}^{\prime }$) for the (a) unexcited jet and (b) excited jet at 4.8 %.

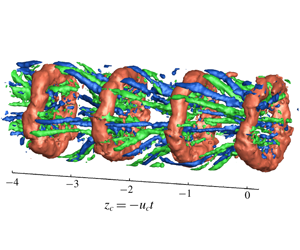
We can derive physical intuition for the flow and the effect of excitation through such a reconstruction, as shown in figure 15 for a natural jet and its excited counterpart at an excitation level of  $u_{z}^{rms}|_{z=0}=4.8\,\%$. The axial coordinate is
 $z=-u_{c}t$. As expected, excitation is seen to raise the inherent order in the turbulent flow above the background noise. Also, in the excited case one can discern the classical structure of the near field of a jet through excitation, which consists of a periodic array of vortex rings and counter-rotating streamwise vortices, organized in the azimuthal direction (Liepmann & Gharib Reference Liepmann and Gharib1992). The wrapping of the streamwise vortices around the rings and wave-like undulations on the ring cores are evident in the excited jet. Similar observations of core undulations were made by Lasheras & Choi (Reference Lasheras and Choi1988), for plane free shear layers subjected to sinusoidal perturbations. Also, the inclination of the streamwise vortices is towards the jet centreline near the upstream region of the rings, while immediately downstream, it can be observed to be away from the centreline. In the unexcited jet, on the other hand, they tend to be more aligned in the axial direction, though it is rather difficult to comment clearly on the structures in there. For the jet excited at 4.8 %, we could count the approximate number of streamwise vortices from the Taylor’s reconstruction to be around 16, eight of each sign, thus corresponding to an azimuthal wavenumber
 $m=8$. This lies in the range of dominant azimuthal wavenumbers of
 $\unicode[STIX]{x1D714}_{z}^{\prime }$ seen in figure 13 at
 $r=0.51$, thus supporting the inference made in the previous section that those azimuthal wavenumbers could possibly indicate the number of streamwise vortices.
Taylor’s reconstruction of vorticity fluctuations in the axial direction ( $z_{c}=-u_{c}t$) for (a) the natural jet and (b) the excited jet at
 $u_{z}^{rms}|_{z=0}=4.8\,\%$. The orange colour corresponds to isosurfaces of
 $\unicode[STIX]{x1D714}_{\unicode[STIX]{x1D703}}^{\prime }=+3$, the green and blue to those of
 $\unicode[STIX]{x1D714}_{z}^{\prime }=+3$ and
 $\unicode[STIX]{x1D714}_{z}^{\prime }=-3$, respectively. The flow is from left to right.

4.3 Streamwise vorticity organization
In order to visualize the organization of streamwise vorticity fluctuations in our flow, we compute the following autocorrelation, similar to Davoust et al. (Reference Davoust, Jacquin and Leclaire2012):
 $$\begin{eqnarray}C_{\unicode[STIX]{x1D714}_{z}\unicode[STIX]{x1D714}_{z}}(r,r^{\prime },\unicode[STIX]{x1D703}^{\prime },t^{\prime })=\frac{\langle \unicode[STIX]{x1D714}_{z}^{\prime }(r,\unicode[STIX]{x1D703},t)\unicode[STIX]{x1D714}_{z}^{\prime }(r^{\prime },\unicode[STIX]{x1D703}+\unicode[STIX]{x1D703}^{\prime },t+t^{\prime })\rangle _{\unicode[STIX]{x1D703}}}{\langle {\unicode[STIX]{x1D714}_{z}^{\prime }}^{2}(r,\unicode[STIX]{x1D703},t)\rangle _{\unicode[STIX]{x1D703}}^{1/2}\langle {\unicode[STIX]{x1D714}_{z}^{\prime }}^{2}(r^{\prime },\unicode[STIX]{x1D703},t)\rangle _{\unicode[STIX]{x1D703}}^{1/2}}.\end{eqnarray}$$
Here  $\langle ~\rangle _{\unicode[STIX]{x1D703}}$ denotes an average over both data blocks and
 $\unicode[STIX]{x1D703}$, as the flow has statistical stationarity and azimuthal homogeneity. Contours of
 $C_{\unicode[STIX]{x1D714}_{z}\unicode[STIX]{x1D714}_{z}}$ for
 $t^{\prime }=0$, i.e. correlation of
 $\unicode[STIX]{x1D714}_{z}^{\prime }$ at a particular instant of time in the cross-section averaged over all snapshots, would give a probable vortex structure in a statistical sense. Figures 16 and 17 show these contours in the cross-sectional plane at
 $z=2$, and in the longitudinal plane reconstructed using Taylor’s hypothesis, respectively, at three radial locations in the jet. The plots containing the contours are accompanied by schematics depicting the correlation process at the top. These positions,
 $r=0.38$, 0.51 and 0.68, were chosen to represent the downstream, middle and upstream part of a streamwise vortex (see e.g. figure 12).
Figures 16 and 17 compare the streamwise vorticity organizations found for the natural jet (left column), and for the excited jet at  $u_{z}^{rms}|_{z=0}=2.6\,\%$ (right column). In the left column (i) of figure 16, we can see patches of negative correlation above and below the probing point at
 $r=0.51$, located near the centre of the shear layer, indicating the presence of opposite-signed vorticity in the radial direction. This, along with the correlation patches at other radial probing points, suggests a radial organization of streamwise vortices, as was also observed by Davoust et al. (Reference Davoust, Jacquin and Leclaire2012) at
 $Re=2.1\times 10^{5}$. In the right column (ii) of figure 16, we observe an azimuthal organization of the streamwise vortices, especially at
 $r=0.38$, where the negative patches on the left and the right are of larger amplitude than the patch on top, and also at
 $r=0.51$, where negative patches on all sides have the same amplitude, the patch on top being located farther away. Consistently, this azimuthal organization is also apparent in the Taylor reconstructions of figure 15. The strength of this azimuthal correlation, however, tends to decrease as we move away from the jet centreline, becoming nearly equal to the radial correlation. To us, this trend cannot be explained with the present figures, and will require considering correlations separately in the braid and ring regions. This will be performed below while presenting the most excited case,
 $u_{z}^{rms}|_{z=0}=4.8\,\%$, where the effects of maximum excitation allow a clearer analysis of the vortical organization.
A typical organization of streamwise vorticity in the cross-sectional plane at  $z=2$, evidenced through isocontours of
 $C_{\unicode[STIX]{x1D714}_{z}\unicode[STIX]{x1D714}_{z}}(r,r^{\prime },\unicode[STIX]{x1D703}^{\prime },t^{\prime }=0)$ at three radial locations in the jet. On the top, (ai) is a schematic depicting the correlation process. Columns (b–d) correspond to the natural (i) and excited (ii) cases, exhibiting radial and azimuthal organizations, respectively. Excitation is performed at
 $St_{e}=0.49$,
 $u_{z}^{rms}|_{z=0}=2.6\,\%$. Solid lines represent positive correlation while dashed lines represent negative correlation.

Similar organization of streamwise vorticity as in figure 16 but in a longitudinal plane reconstructed using Taylor’s hypothesis: (ai) schematic depicting the correlation process, columns (b–d) isocontours of  $C_{\unicode[STIX]{x1D714}_{z}\unicode[STIX]{x1D714}_{z}}(r,r^{\prime },\unicode[STIX]{x1D703}^{\prime }=0,t^{\prime })$ at the indicated radial locations. Columns correspond to the natural (i) and excited (ii) cases, exhibiting radial and azimuthal organizations, respectively.

A similar image unfolds when we look at the longitudinal planes in figure 17. The left column (i) shows negative correlation patches aligned along the positive patch around the probing point, again giving a global portrait of radially organized streamwise vortices. The correlations appear to be elongated and inclined to the jet axis. The angle of inclination to the jet centreline is seen to increase as we probe away from the centreline, as was noted in Davoust et al. (Reference Davoust, Jacquin and Leclaire2012). In the column on the right (ii), these negative patches are reduced, indicating the quasi-absence of opposite-signed vortices in the radial direction. Interestingly, at  $r=0.38$ we still see some correlation in the radial direction, with the maximum negative correlation of -0. 07 around
 $r=0.58$. This will also be discussed in more detail when analysing the most excited case, at
 $u_{z}^{rms}|_{z=0}=4.8\,\%$.
Seeing these differences in the organization of streamwise vortices between a natural and an excited jet, questions arise naturally as to the amplitude of excitation necessary for the change to occur, as well as its sudden or progressive character. To shed light on this, we now describe a case with intermediate excitation compared to the previous one, i.e.  $u_{z}^{rms}|_{z=0}=1.4\,\%$, represented in figure 18. In this figure, one sees the presence of negative lobes of
 $C_{\unicode[STIX]{x1D714}_{z}\unicode[STIX]{x1D714}_{z}}$ of significant magnitude in both radial and azimuthal directions, which leads us to term this organization as ‘transitional’. In practice, when considering other intermediate levels, one observes that the switch of organization, from radial in the natural case, to azimuthal in sufficiently excited cases, is not sudden but progressive, via these transitional states, with obviously azimuthal organizations appearing from
 $u_{z}^{rms}|_{z=0}=2.6\,\%$.
We now turn to the vortical organization obtained for the highest level of excitation that could be reached in this study, i.e.  $u_{z}^{rms}|_{z=0}=4.8\,\%$, plotted in figure 19. This figure contains slightly different and additional information compared to the previous ones, in order to explain most precisely the typical correlation organizations observed in the excited cases. In addition to correlations
 $C_{\unicode[STIX]{x1D714}_{z}\unicode[STIX]{x1D714}_{z}}$ in a cross-sectional plane, which correspond to averaging over all snapshots (panels
 $b\text{i}$ and
 $b\text{ii}$), we also present correlations that are conditionally averaged in the braid (panels
 $c\text{i}$ and
 $c\text{ii}$) and ring regions (panels
 $d\text{i}$ and
 $d\text{ii}$), respectively. Panel (
 $a\text{i}$) on the top is the phase-averaged streamwise vorticity field from figure 12, where we have indicated the probing points,
 $r=0.38$ and
 $r=0.58$, to help establish links between the correlations and the three-dimensional vortical organization. Also, note that the choice of the two probed radii was for the following reasons: considering specifically the conditional averaging which highlights the ring region,
 $r=0.38$, already included above, is chosen to coincide with the downstream edge of a streamwise vortex, while
 $r=0.58$ is to coincide with the core of a vortex ring. Recall also that, at these points, maximum values were found in the
 $\unicode[STIX]{x1D714}_{z}^{rms}$ profile of figure 11(d).
First, let us look in detail at the correlations averaged over all snapshots, i.e. columns (bi) and (bii). Increasing the amplitude of excitation to very high levels, such as 4.8 % here, results in stronger correlation patches, compared to those at 2.6 % excitation of figure 16. At both the radial locations, we can see strong correlation of opposite-signed streamwise vorticity in the azimuthal direction. The correlation patches are more compact at  $r=0.38$ than those at
 $r=0.58$. The source of this can be found by looking separately at the ring and braid region. We will first focus on the braid region, i.e. columns (ci) and (cii). This location can be roughly identified, for instance, as a cross-sectional plane at
 $z_{c}=-2$ in the phase-averaged plot (ai), where the correlations would be averaged over several such snapshots containing the braid region. Compact patches of the correlation in the azimuthal direction can be seen at
 $r=0.38$, with a slight shift in the alignment of maximum correlation patches. This could indicate that the streamwise vortices are not completely aligned in the azimuthal direction along their length but could be slightly shifted in the radial or axial direction, especially near the high-speed side of the shear layer. At
 $r=0.58$, the patches are more distant, which to us simply reflects the fact that streamwise vortices are both spatially persistent, being well defined almost from one vortex ring to the next one, and also not strictly streamwise but inclined in the radial direction. As can probably be better understood in the Taylor reconstruction of figure 15, these two facts imply that, following a vortex in the braid region, leading us to consider decreasing radii, the same number of streamwise vortices has to fit around annuli of decreasing lengths, mechanically making them closer to one another. Here, we can see a mild version of this effect, by probing at the same
 $z_{c}$ but different radii.
A typical transitional organization of streamwise vorticity: isocontours of (a)  $C_{\unicode[STIX]{x1D714}_{z}\unicode[STIX]{x1D714}_{z}}(r,r^{\prime },\unicode[STIX]{x1D703}^{\prime },t^{\prime }=0)$ in the cross-sectional plane at
 $z=2$ and of (b)
 $C_{\unicode[STIX]{x1D714}_{z}\unicode[STIX]{x1D714}_{z}}(r,r^{\prime },\unicode[STIX]{x1D703}^{\prime }=0,t^{\prime })$ in the longitudinal plane at
 $r=0.38$ shown for excitation at
 $St_{e}=0.49$ and
 $u_{z}^{rms}|_{z=0}=1.4\,\%$.

Next, the vorticity organization in the ring region, shown in plots (di) and (dii) of figure 19, appears more complicated, as noted before, owing to the streamwise vorticity coming from both the corrugated rings and the streamwise vortices. These plots could, for instance, correspond to a cross-sectional plane at  $z_{c}=-1.5$ in panel (ai). As discussed above,
 $r=0.38$ points to the downstream end of a streamwise vortex, while
 $r=0.58$ points to the core of a vortex ring. Both panels (di) and (dii) match nicely with the organization that can be understood from panel (ai). Beginning with the streamwise vortex downstream end at
 $r=0.38$ (panel dii), one first observes two negative correlation lobes on the right and left, highlighting the azimuthal organization of the streamwise vortices even until their downstream end. The negative patch on top identifies corrugation of the vortex ring, as already identified above. When turning to correlation probed within the vortex ring itself at
 $r=0.58$ (panel di), one retrieves the signs of the streamwise vortices, as negative patches both above and below the ring core, consistent with the wrapping of these structures around a ring. Negative patches observed on the left and right sides of the probing point, i.e. along the azimuth, most probably stem from the corrugation of the vortex ring itself, being a signature of the phenomenon’s wavelength. Interestingly, these conditionally averaged plots, obtained here for excited jets (and being impossible to obtain for the natural ones due to a lack of phase reference) show good resemblance to the numerical simulations of low-
 $Re$ unexcited jets of Martin & Meiburg (Reference Martin and Meiburg1991) and Brancher et al. (Reference Brancher, Chomaz and Huerre1994). Martin & Meiburg (Reference Martin and Meiburg1991), in particular, observed opposite-signed streamwise vorticity in the ring and braid region at the same azimuthal location, which was attributed to ring waviness evident from the cross-sectional view of the vortex filaments. It thus appears that, in a way, performing axisymmetric excitation on the present higher-
 $Re$ jet, and thereby enhancing the strength of their vortex rings, brings their global vortical organization close to that of lower-
 $Re$ jets, where these vortex rings are better defined and possibly more intense.
Streamwise vorticity organization for  $u_{z}^{rms}|_{z=0}=4.8\,\%$. (ai) The phase-averaged streamwise vorticity field of figure 12 showing the radial locations
 $r=0.58$ and
 $r=0.38$ at which the isocontours of
 $C_{\unicode[STIX]{x1D714}_{z}\unicode[STIX]{x1D714}_{z}}(r,r^{\prime },\unicode[STIX]{x1D703}^{\prime },t^{\prime }=0)$ are plotted in (bi) and (bii), respectively. Isocontours of conditionally averaged correlation are shown in (ci) and (cii) in the braid and in (di) and (dii) in the braid region at
 $r=0.58$ and
 $r=0.38$, respectively.

4.4 Strength comparison
Having observed a transition in the streamwise vorticity organization with increasing excitation levels, we now seek a quantitative estimate for the strengths of the fluctuations, to evaluate the possible magnitude of a ring deformation by the streamwise vortices, as hypothesized by Davoust et al. (Reference Davoust, Jacquin and Leclaire2012) and illustrated in figure 2. The strength of the streamwise vortices is estimated here from the maximum of  $\unicode[STIX]{x1D714}_{z}^{rms}$, which is logically found to occur in the shear layer. For the rings, their strengths are estimated from the r.m.s. of azimuthal vorticity fluctuations,
 $\unicode[STIX]{x1D714}_{\unicode[STIX]{x1D703}}^{rms}$, corresponding to the
 $m=0$ mode reconstructed from the first SPOD mode in the shear layer. Again, the maximum value of
 $\unicode[STIX]{x1D714}_{\unicode[STIX]{x1D703}}^{rms}$ is considered. This estimation process is detailed in appendix D.
The comparison of strengths in terms of  $\unicode[STIX]{x1D714}_{\unicode[STIX]{x1D703}}^{rms}/\unicode[STIX]{x1D714}_{z}^{rms}$, along with the observed vorticity organization, is given in table 2. It can be seen that, as the excitation level is increased, the strength of the fluctuations of azimuthal vorticity increases with respect to those of streamwise vorticity. This can be straightforwardly interpreted as the vortex rings getting stronger with the increase in the excitation level. The shift in the organization of streamwise vortices towards the azimuthal array is observed from higher levels of excitation on
 $u_{z}^{rms}|_{z=0}=2.6\,\%$, precisely as soon as the
 $m=0$ mode gains similar strengths as the streamwise vortices. Note that further increase in the excitation level to 4.8 % does not affect the overall organization of streamwise vortices, except for the qualitative changes noted in the previous section.
Recalling the proposed mechanism in Davoust et al. (Reference Davoust, Jacquin and Leclaire2012), the radial organization was accounted for by an interaction between a streamwise vortex, an  $m=0$ mode or vortex ring and mean shear. Streamwise vortices were hypothesized to deform the weaker
 $m=0$ vortex rings, and the deformations to be further reoriented and stretched in the axial direction by mean shear. The especially weak value of the underlying parameter in this mechanism, i.e. the relative strength of the
 $m=0$ mode with respect to streamwise vortices, was brought forward as possibly being the trigger and justification for such a mechanism. Streamwise vortices, an order of magnitude stronger than the rings, were deemed able to influence the latter. In the present study, as the strength of the
 $m=0$ mode is increased through acoustic excitation (as seen in table 2), we observe that the streamwise vorticity correlation shifts in the azimuthal direction, suggesting the reduction of streamwise vorticity produced by a ring deformation. Thus, we note that the parameter
 $\unicode[STIX]{x1D714}_{\unicode[STIX]{x1D703}}^{rms}/\unicode[STIX]{x1D714}_{z}^{rms}$ is indeed a good measure of the influence of streamwise vortices on the rings. Axisymmetric excitation is effective in strengthening the rings and possibly reducing their tendency to be deformed and tilted by streamwise vortices and mean shear, thus corroborating the plausibility of the scenario introduced by Davoust et al. (Reference Davoust, Jacquin and Leclaire2012).
Variation of the estimated relative vortical strengths as a function of excitation, together with the corresponding streamwise vorticity organization observed for the  $Re=1.5\times 10^{5}$ jet.

5 Robustness assessment: vorticity organization for other inflow and excitation conditions
Having given additional credit to the proposed interaction in an initially transitional jet, we then explore its robustness, together with the same underlying quantities, at other  $Re$ and excitation parameters.
5.1 Dependence on the state of the boundary layer and $Re$ for natural jets

As the exit boundary layer state is known to possibly have an effect on the nature of the vortex rings and their subsequent evolution, we investigated the phenomenon for two other states, viz. laminar and fully turbulent, as mentioned in table 1. It was observed that the state of the boundary layer did not have a significant effect on the mean velocity and fluctuation intensity profiles studied here (see Courtier (Reference Courtier2014), for more details). The organization of streamwise vorticity was found to be independent of the state as well. A similar observation of independence with respect to boundary layer state was made by Hussain & Zaman (Reference Hussain and Zaman1981), for the value of the preferred mode of the jet.
Next, we studied a range of Reynolds numbers that was achievable with the current set-up. To the best of our knowledge, the highest  $Re$ at which a mention about streamwise vorticity is made is 80 000, by Citriniti & George (Reference Citriniti and George2000). They inferred an azimuthal array based on the velocity field induced by the streamwise vortices. However, for all the
 $Re$ in our jet and without excitation, a radial organization was found, even for our lowest value,
 $Re=92\,000$, which is quite close to that considered by Citriniti & George (Reference Citriniti and George2000). Table 3 summarizes this, along with a comparison of the relative strengths of the vortex rings and streamwise vortices, which were of the order of 0.1, similar to that for the
 $Re=1.5\times 10^{5}$ jet, and therefore also in line with the proposed dynamical scenario.
Ratio of the strength of the  $m=0$ mode to that of streamwise vortices, together with the corresponding streamwise vorticity organization for jets at different
 $Re$, without excitation.

5.2 Effect of Strouhal number of $m=0$ excitation

Response of the jet in terms of fluctuation intensities at  $z=2$ (
 $u_{z}^{rms}|_{z=2}$) for excitation at different
 $St_{e}$ and increasing amplitudes of excitation at the nozzle exit (
 $u_{z}^{rms}|_{z=0}$):
 $St_{e}=0.22$ represented by ‘
 $\times$’,
 $St_{e}=0.35$ by ‘+’ and
 $St_{e}=0.49$ by ‘●’.

In the following, we investigate the effect of the Strouhal number at which the  $m=0$ mode is forced, on the shift in the organization of streamwise vorticity. Being noise amplifier flows, jets tend to amplify disturbances in a wide range of frequencies (Michalke Reference Michalke1984). Recalling the choice of
 $St_{e}$ from § 2.2, the responses of the jet at
 $St_{e}=0.35$ and
 $St_{e}=0.22$ are shown in figure 20, along with that at
 $St_{e}=0.49$ for comparison. The value
 $St_{e}=0.35$ was chosen so as to lie in the range of the so-called jet preferred mode of Crow & Champagne (Reference Crow and Champagne1971) and
 $St_{e}=0.22$ as a less energetic
 $m=0$ mode. Similar to figure 9, we plot here the value of
 $u_{z}^{rms}|_{z=2,r=0}$ as a function of
 $u_{z}^{rms}|_{z=0,r=0}$. The trends show good agreement with the observations of Crow & Champagne (Reference Crow and Champagne1971), with
 $St_{e}=0.35$ getting amplified the most under nonlinear saturation, and
 $St_{e}=0.22$ the least. We then study if and how
 $St_{e}$ can affect the conclusions drawn in § 4.4.
Table 4 shows a similar comparison of the relative strengths and the corresponding type of organization of streamwise vorticity, along with the estimated scale of the  $m=0$ mode. Also included are the values for
 $u_{z}^{rms}|_{z=0,r=0}$. Considering a fixed amplitude of excitation,
 $u_{z}^{rms}|_{z=0,r=0}=2.6\,\%$, the most energetic
 $m=0$ mode,
 $St_{e}=0.49$, results in the highest vortex ring strength among all the
 $St_{e}$ values tested. This is expected, as the
 $m=0$ mode had maximum energy at this
 $St$ in the unexcited jet, as seen in figure 8, and we are just increasing the energy at this frequency, or in other words, forcing the most energetic vortex rings to form. For the
 $St_{e}=0.35$, on the other hand, more energy is required to obtain the
 $m=0$ mode with enough strength for an azimuthal array. As for the lowest excitation Strouhal number considered here, i.e.
 $St_{e}=0.22$, comparison cannot be fully complete, as excitation cannot be driven beyond
 $u_{z}^{rms}|_{z=0,r=0}=2.6\,\%$ in the current set-up, this value corresponding to the maximum voltage that can be applied to the loudspeaker. Recalling again from figure 8, this
 $St$ has additionally much less energy in the
 $m=0$ mode for the unexcited jet. It thus seems that we would possibly require even higher amplitudes of excitation than that obtained at other
 $St_{e}$ to force the formation of vortex rings at this
 $St$.
Variation of the relative vortical strengths through excitation, together with the corresponding streamwise vorticity organization, for the  $m=0$ mode excited at different
 $St_{e}$. The values for
 $Re=0.92\times 10^{5}$ and
 $St_{e}=0.49$ are included for comparison.

As a summary of these observations, excitation of the axisymmetric mode at its most energetic  $St$ in the unexcited jet is the most efficient way to strengthen the vortex rings. In terms of streamwise vorticity organization, there appears to be a threshold value of the relative strength for obtaining a complete azimuthal organization, as can also be visually illustrated in figure 21. Interestingly, this threshold seems to be roughly equal to 1, implying that, wherever streamwise vortices are stronger than azimuthal vortices, a radial array is formed, and conversely for an azimuthal array. Again, the term ‘transitional’ here represents a configuration somewhere between fully radial and azimuthal arrays.
While the estimated vortex ring strength agrees well with the observed type of organization, it is interesting to note that the centreline fluctuation intensities at  $z=2$ (
 $u_{z}^{rms}|_{z=2,r=0}$) happen to not fully reflect the strength of the vortex rings. A first possible source of explanation could be that the fluctuations in the jet core, where the flow is essentially potential, arise from the coherent structures that induce velocities at the jet centre, i.e. mainly the vortex rings and the streamwise vortices. Hence, the higher centreline fluctuation intensities for the
 $St_{e}=0.35$, even though the estimated vortex ring strength is lower than that for
 $St_{e}=0.49$, could be due to a contribution from the streamwise vortices. Indeed, as evidenced in figures 15 and 12, these vortices are never strictly streamwise, but are inclined to the jet axis, and thus can induce axial velocity fluctuations. Also, the way we choose to estimate the strength of the
 $m=0$ mode (discussed in appendix D) cannot be directly linked to the fluctuations induced at the jet centreline, which would rather depend on the global distribution of
 $\unicode[STIX]{x1D714}_{\unicode[STIX]{x1D703}}$, and not only on its maximum value in the shear layer. In any case, this observation that excitation at
 $St_{e}=0.35$, which lies in the range of the so-called jet preferred mode (as termed by Crow & Champagne Reference Crow and Champagne1971), also leads here to maximum response of the jet, while not exhibiting the most intense vortex rings, raises a number of questions that could constitute an interesting matter for future research.
Graphical representation summarizing the different parameters studied in this work. The relative strengths of the vortical structures are plotted for varying amplitudes of excitation: blue filled circles show  $St_{e}=0.49$, orange crosses show
 $St_{e}=0.35$, green plus signs show
 $St_{e}=0.22$ and red star shows
 $Re=0.92\times 10^{5}$. The pink patch highlights the radial organization, the pale blue patch the transitional and the light green patch the azimuthal organization.

6 Conclusion
In this paper, we have further investigated the possibility of a specific interaction between streamwise and azimuthal vortices, the latter being described by the axisymmetric mode, in the near field of high- $Re$ round jets. This interaction had been introduced by Davoust et al. (Reference Davoust, Jacquin and Leclaire2012), as a conjecture to be confirmed. Based on a single configuration of jet flow, these authors observed a radial organization of streamwise vorticity fluctuations at two diameters downstream of the nozzle, which they hypothesized to be a result of the streamwise vortices being stronger than the azimuthal ones, and thus able to deform them. These deformations could further be reoriented and stretched in the axial direction by the mean shear, generating opposite-signed streamwise vorticity that gives rise to a radial organization, contrary to the azimuthal organization usually reported in the literature, for lower Reynolds numbers. As this hypothesized scenario had been introduced on the basis of only one case of relative strength of the streamwise and azimuthal vortical structures, confirmation that this relative strength has a direct link to the radial or azimuthal organization of the streamwise vortices has been taken as the main objective of the current work.
In order to validate this hypothesis, we first studied a  $Re=1.5\times 10^{5}$ jet with an initially transitional boundary layer undergoing acoustic excitation. High-speed stereo particle image velocimetry (HS-SPIV) measurements were made in a cross-sectional plane at two diameters downstream of the nozzle exit. The most energetic axisymmetric mode (
 $m=0$) that had a Strouhal number of
 $St=0.49$ was excited, to vary its strength relative to streamwise vortices. The flow field in the cross-sectional plane was reconstructed in the axial direction using Taylor’s hypothesis, and spectral proper orthogonal decomposition provided the means to extract the most energetic
 $m=0$ mode. With increasing amplitudes of excitation, a gradual shift, from a radial configuration of streamwise vortices in the unexcited jet, towards an azimuthal array classically found at lower
 $Re$, was observed. The estimated strengths of the two structures were in accordance with the growing
 $m=0$ mode relative to the streamwise vortices. This allowed us to infer that strengthening the vortex rings weakens the influence of streamwise vortices on them. Higher excitation amplitude aided in discerning the topology of the flow, leading to vorticity patterns comparable to those seen, for instance, in the visualizations of Liepmann & Gharib (Reference Liepmann and Gharib1992) at
 $Re=5000$, and some interesting effects of very high amplitudes of excitation were observed, like the suppression of higher azimuthal modes in the shear layer. Excitation provided a phase reference as well, for phase averaging of vorticity field and conditional averaging, which contributed to a better understanding of the vorticity organization in high-
 $Re$ excited jets. Evidence of corrugation of the rings in the axial direction was also found, which was inferred in terms of streamwise vorticity appearing within the rings.
A similar correlation between the spatial organization found and the relative strength of the two types of vortical structures was also observed in other initial boundary layer states, such as laminar and fully turbulent cases. It was found in jets at  $Re$ ranging from 9. 2 × 10⁴ to 3. 5 × 10⁵ as well, thus signifying the robustness of the proposed scenario. The
 $m=0$ mode was excited at other Strouhal numbers, viz.
 $St_{e}=0.35$ (in the range of the jet preferred mode) and
 $St_{e}=0.22$ (the less energetic
 $m=0$ mode) to examine the effect of
 $St_{e}$ on the drawn conclusions. While the
 $m=0$ mode at
 $St_{e}=0.35$ required higher amplitudes of excitation to have a complete switch to an azimuthal organization compared to that of
 $St_{e}=0.49$, the
 $St_{e}=0.22$ could not be driven to high enough amplitudes for the switch, exhibiting a radial organization throughout. Anyhow, probably the most important conclusion of this parameter variation, and of the present work itself, is that, irrespective of the Reynolds number, state of the boundary layer and value of the excitation Strouhal number, a radial (or azimuthal) organization was systematically observed whenever the vortex rings were weaker (or stronger) than the streamwise vortices, thus corroborating the hypothesis of Davoust et al. (Reference Davoust, Jacquin and Leclaire2012).
From a perspective of jet control, various studies have found an increase in the spreading rate and thereby a faster decay of the potential core by passive control (Burattini et al. Reference Burattini, Antonia, Rajagopalan and Stephens2004; Sadeghi & Pollard Reference Sadeghi and Pollard2012) and active control (Crow & Champagne Reference Crow and Champagne1971; Zaman & Hussain Reference Zaman and Hussain1980). Most of these studies have pursued an understanding of the effect of control strategies by measuring the axial component of velocity. With the HS-SPIV measurements of the velocity vector field in the current study, our results suggest the increasing radial velocity component and the spread of streamwise vorticity into the jet core with increasing excitation amplitude. This could be related to the increased rate of entrainment and reduced size of the potential core that was observed by Crow & Champagne (Reference Crow and Champagne1971) with axisymmetric excitation.
This study has mainly focused on the streamwise vortices, which are an integral part of the near field of jets. They further give rise to different flow features, such as the generation of side jets (Monkewitz & Pfizenmaier Reference Monkewitz and Pfizenmaier1991) and the formation of streaks, as recently reported by Nogueira et al. (Reference Nogueira, Cavalieri, Jordan and Jaunet2019). An azimuthal array of these streamwise vortices can create mixing zones wherein low- and high-momentum fluid is transported into and out of the jet core, respectively, as demonstrated in Citriniti & George (Reference Citriniti and George2000). Hence, a change in the organization of these structures could also alter this mixing pattern. Currently, we are seeking a theoretical framework to model the interaction between vortex rings and streamwise vortices. We expect that this work will also motivate further research into studying these interactions in compressible jets as well as in numerical simulations, to improve turbulence modelling. The impact of the change in flow topology in terms of streamwise vorticity organization in the near field of jets on aeroacoustics would be another direction of pursuit.
Acknowledgements
The authors are grateful to G. Losfeld, C. Goudeau and C. Illoul for their help in performing HS-SPIV, and to J. M. Luyssen, P. Geffroy and J. P. Tobeli for their contributions towards setting up experiments.
Declaration of interests
The authors report no conflict of interest.
Appendix A. Proper orthogonal decomposition implementation
An algorithm similar to Towne et al. (Reference Towne, Schmidt and Colonius2018) was implemented to compute the SPOD basis, with 256 blocks of 512 samples each with an overlap of 50 %, yielding a frequency resolution of 4.88 Hz ( $St\approx 0.03$ for the
 $Re=1.5\times 10^{5}$ jet). For the
 $Re=1.5\times 10^{5}$ jet without excitation, the
 $n=1$ POD mode contained approximately 54 % of the total kinetic energy, while it was as high as 88 % in the most excited case (
 $u_{z}^{rms}|_{z=0}=4.8\,\%$). Davoust et al. (Reference Davoust, Jacquin and Leclaire2012) also found approximately 56 % energy in the
 $n=1$ POD mode in their analysis of a
 $Re=2.1\times 10^{5}$ jet.
Appendix B. Phase averaging and conditional averaging of the streamwise vorticity correlations for the excited jet
An instantaneous flow field can be decomposed into a mean component, a periodic component, ascribed to coherent structures, and background turbulence (Hussain & Reynolds Reference Hussain and Reynolds1970). A phase average of this field can then be defined as
 $$\begin{eqnarray}\tilde{u} (x,t)=\lim _{N\rightarrow \infty }\frac{1}{N}\mathop{\sum }_{n=0}^{N}u(x,t+n\unicode[STIX]{x1D70F}),\end{eqnarray}$$
where  $\unicode[STIX]{x1D70F}$ is chosen as the period of the passage of the coherent structures. Excitation of the
 $m=0$ mode results in a periodic signal for the axial velocity on the jet centreline, induced by the vortex rings. Using this signal as phase reference, we performed phase averaging of streamwise and azimuthal vorticity over 100 periods with
 $\unicode[STIX]{x1D70F}=50~\text{s}$, corresponding to a forcing frequency of 52 Hz and acquisition frequency of 2.5 kHz. An example of the outcome of this was presented in figure 12. This, however, was not performed on the unexcited jet due to a lack of phase reference.
As mentioned in the review by Kovasznay (Reference Kovasznay1978), conditional averaging allows quantitative description of interesting regions in a turbulent flow. Here, we have used it to distinguish the streamwise vorticity organization in the ring and braid regions to better understand the structure of the vortical structures in high- $Re$ jets. For conditional averaging of the correlation over the ring and braid region, we again use
 $u_{z}^{\prime }$ at
 $z=2$ on the jet centreline as the phase reference. We identify the ring region corresponding to the local maxima of
 $u_{z}^{\prime }$, while the braid region corresponds to local minima of
 $u_{z}^{\prime }$. We first save the snapshots in these regions and then average the streamwise vorticity autocorrelation of (4.1) over the respective snapshots.
Appendix C. On convection velocities
Convection velocity ( $u_{c}$) was computed by the method proposed in Davoust & Jacquin (Reference Davoust and Jacquin2011), and the procedure is briefly described below. The continuity equation for incompressible flows combined with the Taylor’s hypothesis gives
 $$\begin{eqnarray}\unicode[STIX]{x1D735}_{xy}\boldsymbol{\cdot }\boldsymbol{u}=\frac{\unicode[STIX]{x2202}u_{x}}{\unicode[STIX]{x2202}x}+\frac{\unicode[STIX]{x2202}u_{y}}{\unicode[STIX]{x2202}y}=-\frac{\unicode[STIX]{x2202}u_{z}}{\unicode[STIX]{x2202}z}=\frac{1}{u_{c}}\frac{\unicode[STIX]{x2202}u_{z}}{\unicode[STIX]{x2202}t}.\end{eqnarray}$$
Then  $u_{c}$ is sought as a function of spatial location (
 $x,y$) and frequency
 $f$ through a statistical relationship between the spectral components of
 $\unicode[STIX]{x1D735}_{xy}\boldsymbol{\cdot }\boldsymbol{u}$ and
 $\unicode[STIX]{x2202}u_{z}/\unicode[STIX]{x2202}t$ in the Fourier space. Note that, here again, we use notation
 $f$ instead of
 $St$ to refer to the dimensionless frequency, for clarity. For the round jet studied in the current work, the
 $\unicode[STIX]{x1D735}_{xy}\boldsymbol{\cdot }\boldsymbol{u}$ was first computed on the Cartesian grid (
 $x,y$) and then interpolated onto the cylindrical grid (
 $r,\unicode[STIX]{x1D703}$). The Fourier transform in time over different blocks of data resulted in
 $\text{i}2\unicode[STIX]{x03C0}f\hat{u} _{z}$ and
 $\unicode[STIX]{x1D735}_{xy}\boldsymbol{\cdot }\hat{\boldsymbol{u}}$. The size of the data blocks and frequency resolution were similar to the SPOD computation. The validity of this relationship can be found by the following correlation coefficient:
 $$\begin{eqnarray}\unicode[STIX]{x1D70C}(r,f)=\frac{\langle (\text{i}2\unicode[STIX]{x03C0}f\hat{u} _{z})(\unicode[STIX]{x1D735}_{xy}\boldsymbol{\cdot }\hat{\boldsymbol{u}})^{\ast }\rangle }{\langle |\text{i}2\unicode[STIX]{x03C0}f\hat{u} _{z}|^{2}\rangle ^{1/2}\langle |\unicode[STIX]{x1D735}_{xy}\boldsymbol{\cdot }\hat{\boldsymbol{u}}|^{2}\rangle ^{1/2}},\end{eqnarray}$$
where  $\langle ~\rangle$ denotes an average over the data blocks and
 $\unicode[STIX]{x1D703}$ (as the flow is statistically axisymmetric), and
 $(~)^{\ast }$ denotes the complex conjugate. A high value of
 $\unicode[STIX]{x1D70C}$ suggests that the approximation of frozen turbulence is accurate. Principal component analysis is then finally used to obtain the sought convection velocity,
 $u_{c}(r,f)$, as the direction of the eigenvector with the largest eigenvalue for the Hermitian matrix evaluated at each (
 $r,f$):
 $$\begin{eqnarray}\left(\begin{array}{@{}cc@{}}\langle |\unicode[STIX]{x1D735}_{xy}\boldsymbol{\cdot }\hat{\boldsymbol{u}}|^{2}\rangle & \langle (\text{i}2\unicode[STIX]{x03C0}f\hat{u} _{z})(\unicode[STIX]{x1D735}_{xy}\boldsymbol{\cdot }\hat{\boldsymbol{u}})^{\ast }\rangle \\ \langle (\unicode[STIX]{x1D735}_{xy}\boldsymbol{\cdot }\hat{\boldsymbol{u}})(\text{i}2\unicode[STIX]{x03C0}f\hat{u} _{z})^{\ast }\rangle & \langle |\text{i}2\unicode[STIX]{x03C0}f\hat{u} _{z}|^{2}\rangle \end{array}\right).\end{eqnarray}$$
The result of the above computation is illustrated for the unforced jet at  $Re=1.5\times 10^{5}$ in figure 22 for
 $f=0.49$. The correlation coefficient is high (>0. 7) in most of the spectrum, especially on the high-speed side of the shear layer (
 $r<0.7$) and
 $f$ around 0.49. The validity of the hypothesis fails for very low
 $f$ and regions of high turbulence intensity (
 $r>0.7$), as expected. The variation of
 $u_{c}$ with
 $r$ shows that it is almost constant in the jet core but gradually decreases in the shear layer. A large number of results of this article relying on the use of Taylor’s hypothesis pertain to the jet at
 $Re=1.5\times 10^{5}$, with or without forcing at
 $f=0.49$. For both these cases, we thus consider a constant value of the convection velocity,
 $u_{c}=0.6$, which is observed to approximate well
 $u_{c}(r,f)$ up to a radial location of
 $r=0.7$ (also in the excited case, not shown here for conciseness). On the other hand, the exact value of
 $u_{c}(r,f)$ was considered in the framework of vortex ring strength estimation, in § 4.4, in order to obtain as accurate results as possible.
Example computation of convection velocity for the  $Re=1.5\times 10^{5}$ unexcited jet: (a) Contours of correlation coefficient
 $\unicode[STIX]{x1D70C}$ (real part) as a function of radius and frequency. (b) Radial variation of
 $u_{c}$ and
 $\unicode[STIX]{x1D70C}$ for
 $f=0.49$.

Appendix D. Estimation of strength of the $m=0$ mode

We choose to characterize the strength of the  $m=0$ mode by restricting to only the
 $n=1$ SPOD mode corresponding to the azimuthal vorticity fluctuations. Keeping only the
 $n=1$ SPOD mode discards the contribution from small-scale turbulence, allowing the extraction of the most energetic
 $m=0$ mode over all frequencies and an estimation of the approximate strength of the vortex rings. Contribution of higher SPOD modes to the axisymmetric mode was found to be not significant. For instance, in the unforced case of
 $Re=1.5\times 10^{5}$ jet, the
 $n=1$ SPOD mode contributed to 64.3 % compared to 9.0 % contribution from the
 $n=2$ SPOD mode to the percentage of energy contained in the
 $m=0$ mode. Though SPOD is not needed for the excited cases, where most of the energy is concentrated in the excited
 $m=0$ mode, it is used in order to be able to compare with the unexcited jet. We here show more details on how this estimate is derived in practice.
The strength of the vortex rings can be estimated from the reconstructed vorticity from the velocity POD modes along with the use of Taylor’s hypothesis in the axial direction. This vorticity is defined as
 $$\begin{eqnarray}\unicode[STIX]{x1D714}_{\unicode[STIX]{x1D703}}(r,\unicode[STIX]{x1D703},t)=\frac{\unicode[STIX]{x2202}u_{r}(r,\unicode[STIX]{x1D703},t)}{\unicode[STIX]{x2202}z}-\frac{\unicode[STIX]{x2202}u_{z}(r,\unicode[STIX]{x1D703},t)}{\unicode[STIX]{x2202}r}.\end{eqnarray}$$
Using  $z=-u_{c}t$, where
 $u_{c}$ is the convection velocity obtained from the application of Taylor’s hypothesis, we have
 $$\begin{eqnarray}\unicode[STIX]{x1D714}_{\unicode[STIX]{x1D703}}(r,\unicode[STIX]{x1D703},t)=\frac{1}{-u_{c}}\frac{\unicode[STIX]{x2202}u_{r}(r,\unicode[STIX]{x1D703},t)}{\unicode[STIX]{x2202}t}-\frac{\unicode[STIX]{x2202}u_{z}(r,\unicode[STIX]{x1D703},t)}{\unicode[STIX]{x2202}r},\end{eqnarray}$$
which in the Fourier space is
 $$\begin{eqnarray}\hat{\unicode[STIX]{x1D714}}_{\unicode[STIX]{x1D703}}(r,m,f)=\frac{(\text{i}2\unicode[STIX]{x03C0}f)}{u_{c}}\hat{u} _{r}(r,m,f)-\frac{\unicode[STIX]{x2202}\hat{u} _{z}(r,m,f)}{\unicode[STIX]{x2202}r}.\end{eqnarray}$$
From POD, we have
 $$\begin{eqnarray}\hat{\unicode[STIX]{x1D714}}_{\unicode[STIX]{x1D703}}(r,f)=\mathop{\sum }_{n}\hat{a}^{(n)}(m,f)\hat{\unicode[STIX]{x1D713}}_{\unicode[STIX]{x1D714}_{\unicode[STIX]{x1D703}}}^{(1)}(r,f),\end{eqnarray}$$
where  $\hat{\unicode[STIX]{x1D713}}_{\unicode[STIX]{x1D714}_{\unicode[STIX]{x1D703}}}^{(1)}(r,f)$ is the vorticity eigenfunction reconstructed from the velocity eigenfunctions, distinguishing it from the eigenfunctions of POD of the vorticity field itself. Considering just the first POD and
 $m=0$ mode, equation (D 3) becomes
 $$\begin{eqnarray}\hat{\unicode[STIX]{x1D714}}_{\unicode[STIX]{x1D703}}(r,f)=\hat{a}^{(1)}(f)\hat{\unicode[STIX]{x1D713}}_{\unicode[STIX]{x1D714}_{\unicode[STIX]{x1D703}}}^{(1)}(r,f),\end{eqnarray}$$
where
 $$\begin{eqnarray}\hat{\unicode[STIX]{x1D713}}_{\unicode[STIX]{x1D714}_{\unicode[STIX]{x1D703}}}^{(1)}(r,f)=\frac{(\text{i}2\unicode[STIX]{x03C0}f)}{u_{c}}\hat{\unicode[STIX]{x1D719}}_{r}^{(1)}(r,f)-\frac{\unicode[STIX]{x2202}\hat{\unicode[STIX]{x1D719}}_{z}^{(1)}(r,f)}{\unicode[STIX]{x2202}r}.\end{eqnarray}$$
The term  $\unicode[STIX]{x1D714}_{\unicode[STIX]{x1D703},rms}^{(1),m=0}$ provides the strength of the most energetic
 $m=0$ mode, which can be estimated as follows:
 $$\begin{eqnarray}\displaystyle \displaystyle \langle {\unicode[STIX]{x1D714}^{\prime }}_{\unicode[STIX]{x1D703}}^{2}\rangle ^{1/2}\approx (\unicode[STIX]{x1D714}_{\unicode[STIX]{x1D703},rms}^{(1),m=0})^{2} & = & \displaystyle \frac{1}{F}\int _{0}^{F}|\hat{a}^{(1)}(0,f)\hat{\unicode[STIX]{x1D713}}_{\unicode[STIX]{x1D714}_{\unicode[STIX]{x1D703}}}^{(1)}(r,0,f)|^{2}\,\text{d}\,f\nonumber\\ \displaystyle & = & \displaystyle \displaystyle \frac{1}{F}\int _{0}^{F}\left|\hat{u_{z}}^{(1)}(r,0,f)\frac{\hat{\unicode[STIX]{x1D713}}_{\unicode[STIX]{x1D714}_{\unicode[STIX]{x1D703}}}^{(1)}(r,0,f)}{\hat{\unicode[STIX]{x1D719}}_{z}^{(1)}(r,0,f)}\right|^{2}\,\text{d}\,f.\end{eqnarray}$$
Hence,
 $$\begin{eqnarray}\langle {\unicode[STIX]{x1D714}^{\prime }}_{\unicode[STIX]{x1D703}}^{2}\rangle ^{1/2}\approx \left(\frac{1}{F}\int _{0}^{F}|\hat{u} _{z}^{(1)}(r,f)|^{2}\left|\frac{\hat{\unicode[STIX]{x1D713}}_{\unicode[STIX]{x1D714}_{\unicode[STIX]{x1D703}}}^{(1)}(r,f)}{\hat{\unicode[STIX]{x1D719}}_{z}^{(1)}(r,f)}\right|^{2}\,\text{d}\,f\right)^{1/2}.\end{eqnarray}$$
To finally account for the vortex rings,  $\hat{u} _{z}^{(1)}(r,f)$ and
 $\hat{\unicode[STIX]{x1D719}}_{z}^{(1)}(r,f)$ are both evaluated at the same radial location, whereas the maximum value of
 $\hat{\unicode[STIX]{x1D713}}_{\unicode[STIX]{x1D714}_{\unicode[STIX]{x1D703}}}^{(1)}(r,f)$ in the shear layer is considered. The variation of
 $u_{c}(r,f)$ was taken into account in the Taylor’s hypothesis while computing
 $\hat{\unicode[STIX]{x1D713}}_{\unicode[STIX]{x1D714}_{\unicode[STIX]{x1D703}}}^{(1)}(r,f)$.



