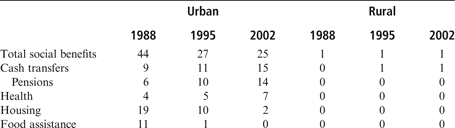
One of the many dramatic changes since China launched its market economy reforms 30 years ago has been the significant cutback in its provision of urban social benefits, driven by the pursuit of economic growth and efficiency. To lower costs and improve productivity, most state-owned and collective enterprises had to shift the previously heavy welfare burden to be shared by the employers, their employees and the government.Footnote 1 Using survey data from the national China Household Income Project (CHIP), Gao and RiskinFootnote 2 revealed that the average share of social benefits in total household income for all urban families shrank from 44 per cent in 1988 to 27 per cent in 1995 and then to 25 per cent in 2002, as shown in Table 1. More specifically, the privatization of housing led to a rapidly diminishing housing benefit: this made up 19 per cent of total household income in 1988 but just 10 per cent in 1995 and 2 per cent in 2002. With the ration system eliminated, food assistance plummeted from 11 per cent of total household income in 1988 to almost nothing in 1995 and 2002. Using the same data source, Khan and RiskinFootnote 3 documented that net subsidies other than in-kind housing benefits dropped from 21 per cent of total household income in 1988 to 1 per cent in 1995 and 0.07 per cent in 2002 in urban China. To help relieve economic hardship and to avoid serious social unrest among the new urban poor, the government has established several new programmes since the early 1990s, including unemployment insurance, living subsidy for the laid-off and the Minimum Livelihood Guarantee (dibao 低保).Footnote 4 Although these programmes target the poorest urban families, recent research has found them to be far from sufficient to lift families out of poverty.Footnote 5
Shares of Social Benefits in Total Household Income (%)

Source:
Qin Gao and Carl Riskin, “Market versus social benefits: explaining China's changing income inequality,” in Deborah Davis and Feng Wang (eds), Creating Wealth and Poverty in Post-Socialist China (Palo Alto, CA: Stanford University Press, 2008).
In contrast, one of the most intact phenomena during this period has been the marginal welfare provision for China's rural residents. Social benefits for rural families only accounted for 1 per cent of their total household income between 1988 and 2002, as shown in Table 1.Footnote 6 The “Five Guarantees” (wu bao 五保) programme aims to provide food, clothing, medical care, housing and burial expenses for the rural elderly, disabled and minors with no family support or income sources. Unfortunately, the programme has been ineffective in providing help for the target population in most rural areas. The community-based Rural Co-operative Medical System (RCMS, nongcun hezuo yiliao 农村合作医疗), which used to provide basic health services and had a wide rural coverage, collapsed after the rural economic reforms were launched, leaving many people unable to afford the dramatically increasing healthcare expenses. The government has initiated several policies since 2002 to address the laggard conditions of rural social benefits. These include eliminating the formerly heavy taxes and fees levied on peasants, restoring and subsidizing the RCMS, and expanding the dibao programme from urban to rural areas.Footnote 7 Most of these policies have yet to be fully carried out, and their outcomes await future evaluation.
What do these changes in social benefit provision and generosity mean for income redistribution? Who gains and who loses? Has the Chinese social benefit system been progressive (that is, helping the poor) or regressive (favouring the rich), and if so, to what extent? An explicit redistributive mechanism, the social benefit system reallocates resources to improve the economic well-being of certain subgroups, and in most cases, overall social justice. This article uses CHIP data and a revealing statistical method (detailed below) to quantify the redistributive effects of the Chinese social benefit system and to track changes over time (from 1988 to 1995 and 2002).
It directly builds on two recent studies using the same data source – one by Khan and RiskinFootnote 8 and the other by Gao and Riskin.Footnote 9 Both of these provided descriptive results on the sizes and trends of social benefit provisions and explored how social benefits affect overall income inequality. For example, Gao and Riskin found that both urban and rural total social benefits were distributed more unequally than market income and total household income during the 1988–2002 period and that this trend was increasingly predominant over time. More specifically, they used concentration ratiosFootnote 10 to measure how unequally social benefits were distributed. Like the Gini coefficient, the higher the value of the concentration ratio, the more unequal the distribution. They found that, in urban areas, the concentration ratios of total social benefits (0.25 in 1988, 0.41 in 1995 and 0.46 in 2002) were higher than the Gini coefficients of the total household income (0.23 in 1988, 0.34 in 1995 and 0.35 in 2002) in all three years, and the difference kept rising over time. The same trend held in rural China, although the inequality was even greater. Specifically, the concentration ratio of total social benefits increased from 0.37 in 1988 to 0.44 in 1995 and then jumped to 0.71 in 2002, as compared to the respective values of the Gini coefficients for total household income (0.36 in 1988, 0.42 in 1995 and 0.37 in 2002).
These results suggest that the social benefits in urban and rural China both played a disequalizing role in redistributing resources during the 1988–2002 period. However, neither Gao and Riskin nor Khan and Riskin directly examined the redistributive nature of the social benefits, that is, whether social benefits themselves were redistributed progressively or regressively. The present article explicitly focuses on this question by examining how the redistribution of social benefits affected the bottom and top of the income distribution. In other words, to what extent was the Chinese social benefit system progressive or regressive, and did the reallocation of social benefits help enhance overall social justice? Because of the drastically different mechanisms for providing social benefits in urban and rural China, the article first investigates the redistributive nature of the social benefit systems in the two areas separately and then combines them to provide a national picture. Findings can have direct implications for China's future social policy reforms.
Data and Methods
This article uses all three waves (1988, 1995 and 2002) of CHIP data, arguably the best publicly available national survey data on Chinese household income and expenditure.Footnote 11 CHIP is a cross-sectional study designed by a team of Chinese and Western scholars and conducted by the Institute of Economics at the Chinese Academy of Social Sciences. As noted by Khan and Riskin, CHIP remains “the only available source of (almost) nation-wide household-level data on income and other individual and household characteristics … [and] the only comprehensive data base for the application of an income definition that helps overcome the limitations of the official definition underlying the published income data in China.”Footnote 12 CHIP particularly fits the analytical needs of this study. On the one hand, it provides detailed information on households' receipt of various cash and in-kind social benefits, along with other income sources; on the other hand, questions on income and benefits were asked consistently across the CHIP surveys, allowing the tracking of changes and comparisons over time. Samples of the CHIP study were drawn from larger National Bureau of Statistics samples using a multistage stratified probability method. CHIP is nationally representative and contains sample provinces from eastern, central and western regions.Footnote 13 Its urban sample included 9,009 households in 1988, 6,931 in 1995 and 6,835 in 2002; the rural sample includes 10,258, 7,998 and 9,200 households in the three years, respectively.
Consistent with the Gao and Riskin study, this article uses comprehensive measures of social benefits and market income. In both urban and rural areas, social benefits are composed of cash transfers (including pensions, living hardship subsidies, unemployment insurance, living subsidies for the laid-off and dibao benefits) and in-kind benefits (including health, housing and food). The inclusion of health benefits expands the conventional definition of social benefits and is thus broader than the measures used in earlier analyses of CHIP data by Khan and Riskin. Market income is measured as the household income before social benefits and any other public or private transfers. In urban areas, market income is made up of wages, income from private enterprises, property income, financial income (such as stocks, bonds, interests and dividends), and the rental value of owner-occupied housing. In rural areas, market income includes wages, income from family farming and non-farm activities, property income, financial income, the rental value of owner-occupied housing, remittances sent by members working outside the home, and other miscellaneous income. The sum of market income (pre-transfer income) and social benefits is referred to as post-transfer income.Footnote 14
Both pre- and post-transfer incomes are calculated as annual household per capita values to take into consideration household size and the economies afforded by resource pooling among household members. Official urban and rural consumer price indices are used to convert 1988 and 1995 values to constant 2002 values for urban and rural areas, respectively.Footnote 15 To analyse social benefits at the national level, randomly selected households from the urban and rural samples are added to make the combined samples reflect their respective population shares in each year studied and thus better represent the national picture.Footnote 16
To understand the redistributive nature of social benefits, especially at the bottom and top of the income distribution, an innovative and revealing analytical approach is used. The difference between income inequality levels calculated from pre- and post-transfer incomes captures the redistributive effects of social benefits. The inequality measure adopted in this study is the economic distance between households at three different points of income distribution: the 10th, 50th and 90th percentiles. The 10th percentile household (P10) represents the poor, the 90th percentile household (P90) represents the rich, and the 50th percentile household (P50) is the median income household in the society. The P10/P50 ratio therefore measures the economic distance between the bottom and middle income households, and the P90/P50 ratio reflects the economic distance between the top and middle income households. A comparison of these two ratios indicates the income inequality gap between the bottom and top of the income distribution.Footnote 17 This measure is not only intuitively interpretable and graphically revealing, but also overcomes the limitation of the widely used Gini coefficient, which does not always capture the lower and higher ends of the income distribution and therefore does not accurately reveal progressivity or regressivity.Footnote 18
A progressive social benefit system implies that resources are redistributed from the rich to the poor. Using the approach described above, such a system should narrow the economic distance at both the bottom and top of the income distribution (that is, increase the value of P10/P50 and decrease the value of P90/P50). If economic distance is enlarged at both ends, the social benefit system is clearly regressive. If the social benefits reduce the economic distance at the bottom (indicating progressivity) but increase it at the top (indicating regressivity), the redistributive nature is ambivalent and the extent of progressivity or regressivity is determined by which of the two effects dominates.
It is important to note that a rapidly increasing number of migrants who hold rural household registration status (hukou 户口) but actually live in cities and towns are excluded from this analysis. Virtually no social benefits were received by these migrants. Khan and Riskin estimated that the net subsidies (total subsidies less taxes and fees paid) received by migrant families were negative in 2002 (about 1 per cent of total household income), indicating that their tax and fee payments exceeded the sum of any support from the government.Footnote 19 Although CHIP 2002 for the first time included a subsurvey of 2,000 migrant households, the exclusion of migrants in the earlier CHIP waves prohibits a consistent estimation of their social benefits and in particular the redistributive effects of those benefits. It can be assumed that, because of the minimal social benefits received by the migrants, if they were to be included in the national analysis, the overall social benefit system would have a smaller yet more regressive redistributive impact than shown by the current findings.
The Predominantly Progressive Urban Social Benefit System
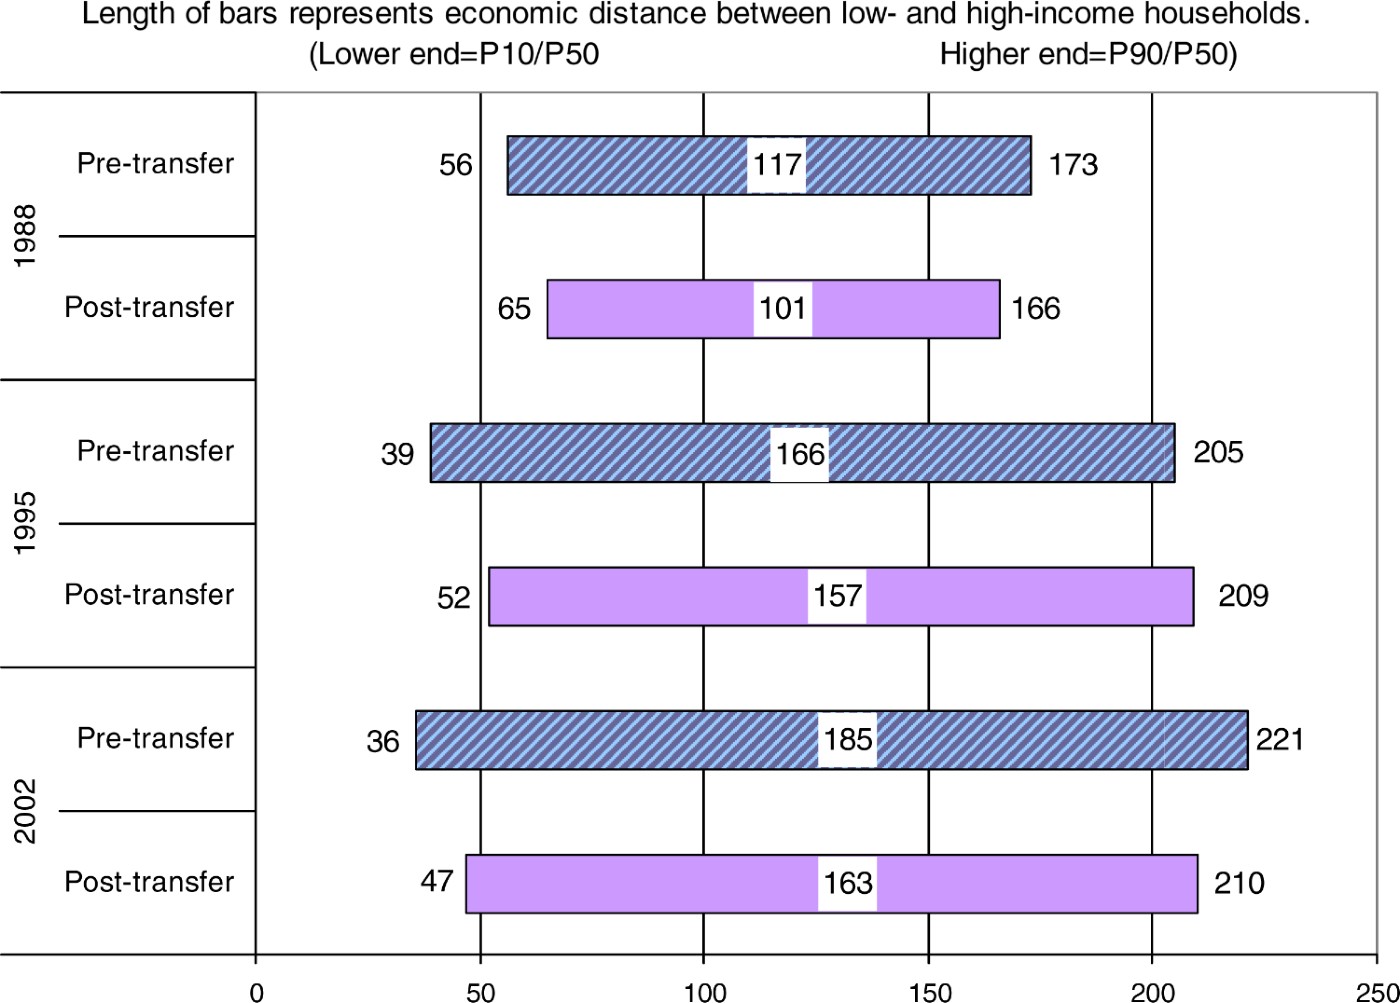
The social benefit system in urban China was predominantly progressive during the 1988–2002 period. Figure 1 shows the redistributive effects of urban social benefits over time. The length of bars represents the economic distance between low and high income households, with the value of the P10/P50 ratio at the lower end and the value of the P90/P50 ratio at the higher end. For each year studied there are two bars, one representing pre-transfer income and the other post-transfer income, and the differences between the two reveals the redistributive nature of the social benefit system.
Redistributive Effects of Urban Social Benefits

The redistribution of social benefits narrowed the economic distance between the bottom- and top-income households in all three years, even though the rich actually gained rather than lost through the transfers in 1995.Footnote 20 In 1988, the average pre-transfer income earned by the low-income households was only 56 per cent of that earned by the middle-income households, while the pre-transfer income of the high-income households was 173 per cent of the median. Social benefits were redistributed progressively to reduce the economic distance between the two ends, lifting the relative income of the bottom (to 65 per cent of the median) and lowering that of the top (to 166 per cent of the median).
The income inequality gap was greatly enlarged from 1988 to 1995, driven by the significantly higher proportion of pre-transfer income in total household income (73 per cent in 1995 as compared to 54 per cent in 1988).Footnote 21 In 1995, pre-transfer income for the poor households was only 39 per cent of that of the middle-income households, while it was 205 per cent for the rich. Social benefits were redistributed partly progressively and partly regressively: they lifted the relative income of the poor to 52 per cent of the median but also favoured the rich and raised their relative income to 209 per cent of the median. Because the increase was larger at the bottom (an increase of 13 percentage points) than the top (an increase of 4 percentage points), the social benefit system appeared to be more progressive than regressive. The post-transfer income inequality level, consequently, was only slightly reduced by social benefits, as shown by the slightly shorter length of the post-transfer economic distance bar (157) compared to the pre-transfer bar (166).
From 1995 to 2002, the proportion of pre-transfer income in total household income increased further (from 73 to 78 per cent),Footnote 22 thereby broadening the pre-transfer economic distance: the poor only received 36 per cent of the market income earned by the middle-income households in 2002 (compared to 39 per cent in 1995), while the rich enjoyed 221 per cent of the medium market income (compared to 205 per cent in 1995). Social benefits were clearly distributed progressively in 2002, raising the relative income of the poor to 47 per cent of the median and lowering that of the top to 210 per cent.
Despite the predominantly progressive role of urban social benefits, the post-transfer income inequality levels kept rising over time, as indicated by the elongated post-transfer economic distance bars from 1988 (101) to 1995 (157) and then to 2002 (163). The shrinking size of urban social benefits certainly contributed to this trend. However, its driving force was a combination of the increased share of pre-transfer income in total household income and the growing inequality in pre-transfer income itself.Footnote 23 Gao and Riskin discovered that the contribution of social benefits to overall income inequality dropped from 48 per cent in 1988 to 33 per cent in both 1995 and 2002, while the contribution of pre-transfer income to overall income inequality continued to rise, from 48 per cent in 1988 to 66 per cent in 1995 and 70 per cent in 2002.Footnote 24
What social policy changes led to the predominantly progressive nature of urban social benefits? Pensions, unemployment insurance, living subsidies for the laid-off and the dibao programme were the major progressively redistributed benefits that helped improve the economic conditions of those left behind by the market. Gao and Riskin found that the average share of pension income in total household income increased from 6 per cent in 1988 to 10 per cent in 1995 and 14 per cent in 2002, yet its redistribution moved from very disequalizing in 1988 (as indicated by the higher value of its concentration ratio than the overall Gini coefficient) to slightly equalizing in 1995 and 2002 (with lower values of concentration ratios than the overall Gini coefficients).Footnote 25 Several public assistance programmes were expanded during this period in an effort to provide a basic safety net for the poor. In particular, the dibao programme experienced the most significant expansion. As shown in Figure 2, total dibao expenditures in urban China increased steadily after 1996, from 0.3 billion yuan in 1997 to 2.7 billion yuan in 2000, 10.9 billion yuan in 2002, 19.2 billion yuan in 2005 and 27.5 billion yuan in 2007. The number of dibao recipients was 0.8 million in 1996 and increased to 4.0 million by 2000. It then saw a huge jump during 2000–02 to 11.7 million in 2001 and 20.6 million in 2002, but the increase levelled off after 2002 and the total number of recipients has remained at around 22.5 million since 2003. Despite the inability of these public assistance programmes to eliminate poverty,Footnote 26 their progressive goals have been clear and are expected to grow in the future as the government continues its efforts to create a “harmonious society.”Footnote 27
Total Dibao Expenditures and Number of Recipients in Urban China, 1996–2007

In contrast, health, food and other in-kind benefits were regressively redistributed, favouring the higher income groups and raising overall income inequality. The reason is that these benefits were generally closely linked with employment status, sector and type: more prestigious and stable jobs were likely to bring not only higher earnings but also more generous fringe benefits. Healthcare serves as the best example. The share of health benefits in total household income only increased slightly during the period (from 4 per cent in 1988 to 7 per cent in 2002), but its redistribution changed from very equalizing in 1988 (with a much lower concentration ratio of 0.19 relative to the overall Gini coefficient of 0.23) to highly disequalizing in 2002 (with a concentration ratio of 0.83 compared to the overall Gini coefficient of 0.35).Footnote 28
Urban housing was gradually privatized during this period, and changes in housing policy could help explain the somewhat ambivalent nature of the redistribution of social benefits in 1995. The government started a nationwide housing reform in 1988, including rent increases and the sale of public housing, mostly to its occupants. Only 18 per cent of urban households owned housing in 1988. The majority of families still lived in free or heavily subsidized public housing, with housing benefits averaging 19 per cent of total household income. As the reform progressed to 1995, a larger group of privileged urban residents had been given priority to purchase housing from their work units at heavily subsidized prices, resulting in a higher rate of housing ownership (42 per cent) and a more unequal distribution of housing benefits (with a concentration ratio of 0.51 relative to the overall Gini coefficient of 0.34). This may have been the determining factor for the regressivity of social benefits in 1995. The government began to build generally affordable housing in 1998 and introduced the publicly accumulated housing fund nationwide in 1999. These reforms, coupled with the spread of subsidized purchase opportunities, greatly increased urban housing ownership (to 79 per cent) while sharply reducing inequality in housing benefits by 2002 (the concentration ratio fell to 0.31, lower than the overall Gini coefficient of 0.35).Footnote 29
In summary, urban social benefits were predominantly progressive during the 1988–2002 period. Relative to the median income, poor households' economic conditions were lifted by social benefit transfers while part of rich households' market income was reallocated to support the poor, with the exception that the rich actually gained from social benefits in 1995, probably through housing benefits. However, despite the overall progressive role of social benefits, the post-transfer income inequality levels continued to rise, apparently driven by a combination of the increased share of market income in total household income and the growing inequality in pre-transfer income itself.
The Regressive Rural Social Benefit System
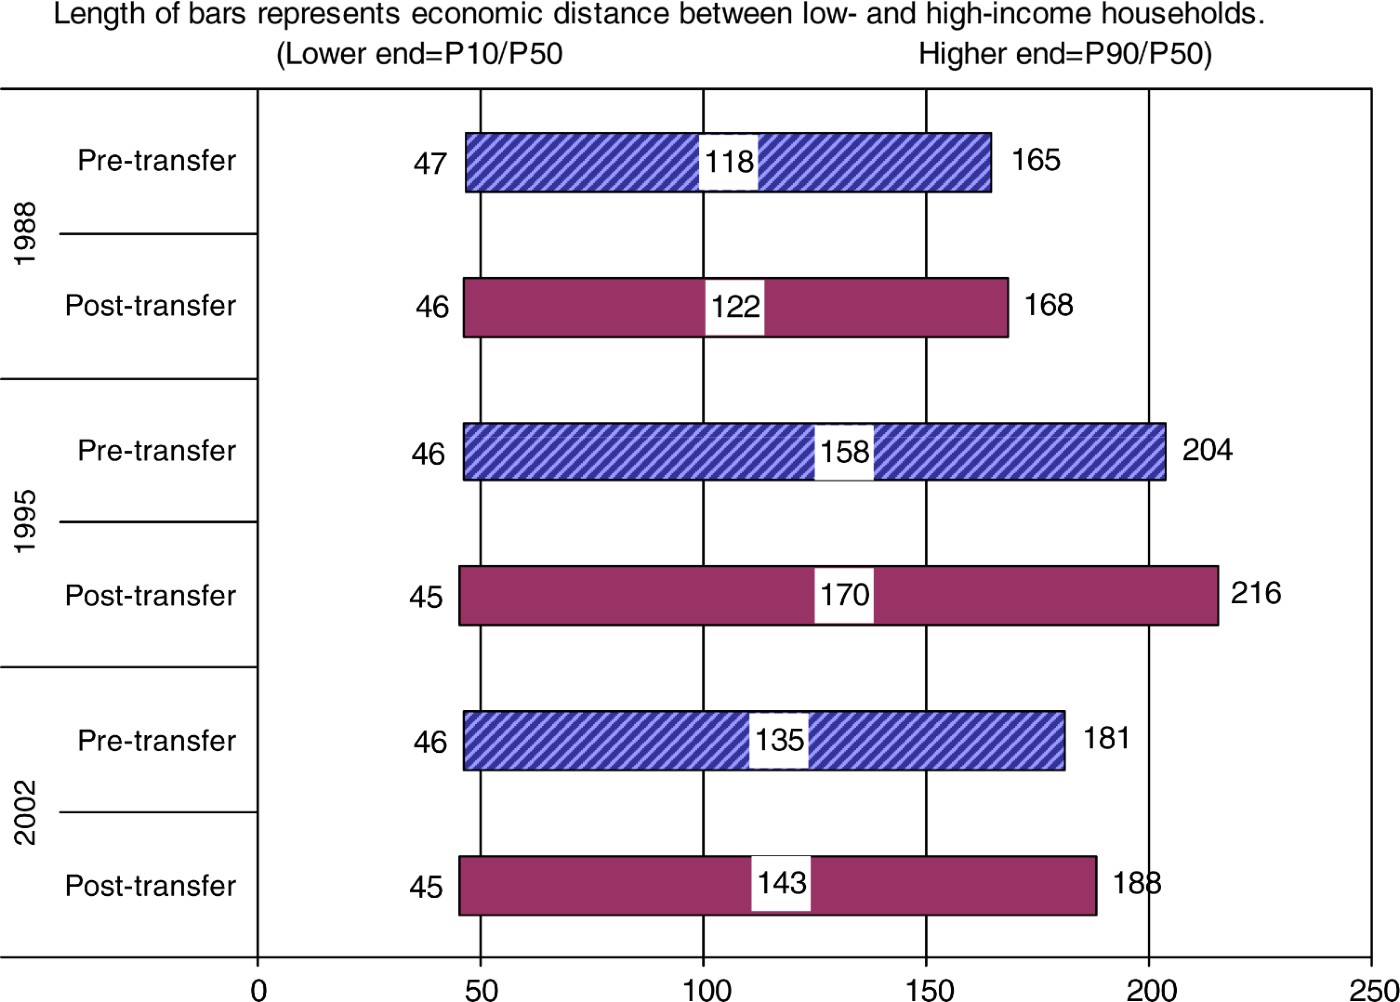
The redistribution of rural social benefits was consistently regressive during the 1988–2002 period, as shown in Figure 3. First, because of the minimal size of rural social benefits (averaging only 1 per cent of total household income during the period, as shown in Table 1), they had little impact on overall income inequality as indicated by the similar lengths of the economic distance bars for pre- and post-transfer income in the respective years. Moreover, the redistribution of social benefits was clearly regressive: the social benefit transfers consistently favoured the rich and enlarged their economic distance from the median income, while poor households' income relative to the median actually decreased by one percentage point in all years.
Redistributive Effects of Rural Social Benefits

The regressivity in the rural social benefit system occurred because only a very small group of rural residents had access to pensions and healthcare as a result of their prior or current employment in state-owned or collective enterprises. This did not appear to pose any serious threat to political stability requiring government intervention in rural China until 2002. In particular, healthcare became a privilege after the RCMS collapsed. Its concentration ratio remained much higher (0.70 in 1988, 0.65 in 1995 and 0.72 in 2002) than the overall Gini coefficients (0.36 in 1988, 0.40 in 1995 and 0.36 in 2002), indicating a highly unequal distribution of healthcare.Footnote 30
Overall income inequality rose dramatically from 1988 to 1995, as shown by the elongated economic distance bars during this time; however, from 1995 to 2002 it significantly decreased, settling at just over the 1988 level. This may be the result of a combination of factors that helped stimulate inequality in pre-transfer income in 1995. These include increased market opportunities led by rural economic reforms, developments in township and village enterprises (xiangzhen qiye 乡镇企业), and increased migration from rural to urban areas, all of which promoted the relative incomes of individuals who were more competitive in the market economy. By 2002, the advantages created by these factors may have diminished, yielding a lower level of overall income inequality.Footnote 31
The National Social Benefit System: Regressive but Increasingly Less So
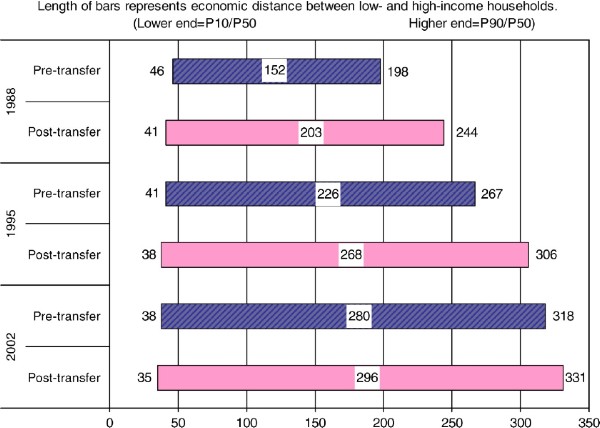
What happens to the redistributive nature of the entire social benefit system if the urban and rural pictures are merged? The answer is clearly shown in Figure 4. The national social benefit system remained regressive from 1988 to 2002, but the extent of its regressivity appears to have decreased over time. First, the redistribution of social benefits greatly favoured the rich in all three years, lifting their incomes relative to the median income, while the relative incomes of the poor households decreased consistently. In 1988, the pre-transfer income of the rich was 198 per cent of the median level, and social benefit transfers increased this economic distance to 244 per cent. The redistribution of social benefits increased the distance between the top- and medium-income households to much higher post-transfer levels in the two later years (306 per cent in 1995 and 331 per cent in 2002, relative to the pre-transfer levels of 267 per cent and 318 per cent, respectively). The reduction in the relative incomes of the poor households also persisted over time but to a much smaller extent (five percentage points in 1988 and three percentage points in 1995 and 2002).
Redistributive Effects of the Chinese Social Benefit System: National Picture

The regressivity of the national social benefit system was mainly because the rural population as a whole was poorer than the urban population, whereas the social benefits went principally to the urban residents. Calculations from CHIP data show that household per capita market income for rural residents was 76 per cent that for urban residents in 1988; this proportion further decreased to 53 per cent in 1995 and only 40 per cent in 2002. In contrast, 99 per cent of the national social benefits were allocated to the urban population in all three years, despite the fact that the rural population remained the vast majority of the total population during this period.Footnote 32
Second, the extent of the regressivity in social benefit redistribution in the national context decreased over time, suggesting a somewhat promising policy direction towards progressivity and improved social justice in the future. The reduced regressivity is indicated by the increasingly narrowed economic distance at the top of the income distribution from 1988 to 2002. In 1988, social benefits lifted the rich households' relative income by 46 percentage points (from 198 to 244 per cent of the median income). The increase due to social benefit transfers was smaller in 1995 (an increase of 39 percentage points) and dropped further in 2002 (an increase of just 13 percentage points). Correspondingly, the reduction in the relative income of the poor was also smaller in 1995 and 2002 (three percentage points) than in 1988 (five percentage points). These trends suggest that policy changes during this period were at least moving in the direction of reduced inequality at the national level. Rapid urbanization may also have helped. The increase in the urban population improved the chances of the progressivity of urban social benefits to trump the regressivity of rural social benefits and thus reduced the overall regressivity of the national system.
Third, despite the promising trend of decreased regressivity in the redistribution of social benefits, the national picture reveals the continually rising income inequality – for both pre- and post-transfer income – over time, as illustrated by the persistent elongation of the distance bars from 1988 to 1995 and to 2002 (Figure 4). This trend was partly influenced by the regressive nature of the social benefit system as discussed above and partly by the growing urban–rural pre-transfer income disparity that dominated inequalities within the respective areas.Footnote 33 As shown in Table 2, median pre-transfer income in both urban and rural areas increased significantly during this period. In urban areas, the household per capita median pre-transfer income rose from 2,219 yuan in 1988 to 3,883 yuan in 1995 and to 6,729 yuan in 2002. It also increased in rural areas but to a much lesser extent: rural median pre-transfer income was 1,419 yuan in 1988 and increased to 1,611 yuan in 1995 and to 2,169 yuan in 2002. The drastically rising value of the urban-to-rural ratio over time (from 1.56 in 1988 to 2.41 in 1995 and then to 3.10 in 2002) indicates that urban–rural pre-transfer income disparity is the major barrier to reducing income inequality in the national context.
Urban versus Rural Median Pre-transfer Income (in household per capita annual yuan)

Note:
The urban and rural median pre-transfer incomes are in constant 2002 values, adjusted by the official urban and rural consumer price indices, respectively, as discussed above.
Source:
Author's calculations.
Policy Trends since 2002: Moving in a More Equitable Direction
While the unavailability of survey data prohibits quantitative updates on trends since 2002, recent policy changes have suggested that social welfare policies in both urban and rural China are moving in a more equitable direction. In urban China, pensions and healthcare have been reformed to cover all employees through shared financing responsibilities among employers, employees and the state, and by a combination of social pool funds and personal savings accounts.Footnote 34 Unemployment insurance, living subsidies for the laid-off and the dibao programme have all been expanded to provide broader coverage and more generous benefits to help the urban poor.Footnote 35 As a result, the previously predominantly progressive urban social benefit system appears to have been even more progressive since 2002.
Meanwhile, the government has taken some bold actions to address the severe lack of social benefits in rural China. In recent years, the Hu-Wen administration has initiated several major programmes to support rural residents, including the elimination of agricultural taxes, the restoration of the rural RCMS and the expansion of dibao to provide a safety net for the rural poor.Footnote 36 To date, these initiatives have all been implemented and are making notable progress. First, the elimination of agricultural taxes was experimented with in some provinces from 2004 to 2005 and was implemented nationwide in 2006. Because rural taxes had been disproportionately levied on the poor,Footnote 37 this initiative has been a gigantic step to relieve poor peasants from financial hardship.
Second, the rural RCMS programme has been gradually restored since 2002 and is set to be implemented nationwide by the end of 2008. The RCMS is a heavily subsidized voluntary health insurance programme for rural residents. The government – both central and local – is responsible for about 80 per cent of RCMS expenditure. The central government provides subsidies to the less developed provinces in the western and central areas. In 2008, it contributed 80 yuan for each participant, whereas individuals only contributed 20 yuan. Although the coverage approached 100 per cent nominally, it is important to note that actual beneficiaries were only about 30 per cent of all rural residents in 2007.Footnote 38 Other challenges, such as low benefit levels, adverse selection for participation,Footnote 39 moral hazards in service use and benefit claiming, and rising financial burdens on the government, are inherent in the new RCMS and will need to be addressed as the system is established and expands.Footnote 40
Third, the rural dibao programme was first experimented with in 1996 in various provinces and was formally established nationwide in 2007.Footnote 41 Its goal is to provide cash subsidies to poor families so that they can meet basic local living standards. The majority of the recipients have a low income because of chronic illness, disability, old age, and/or an adverse natural living environment. Official statistics show that the total number of rural dibao recipients more than doubled from 16.1 million in January 2007 to 38.8 million in October 2008. Total expenditure for the rural dibao programme was 104.1 billion yuan in 2007 and is expected to be more than double this amount in 2008. However, it is important to note the huge disparity between the rural and urban dibao programmes: in October 2008, per capita dibao expenditure was 44 yuan in rural China compared to 133 yuan in urban China.Footnote 42 The administrative process and effectiveness of the rural dibao programme also need to be evaluated by future research as the programme expands.
In addition, the government has started to address the needs of the growing rural-to-urban migrant population. One notable step has been to encourage access to compulsory education for migrant children in the cities and to prohibit the cities' public schools from charging extra fees. This, however, has proved to be difficult to implement. For one thing, the law states that all children are entitled to free compulsory education where their hukou is, which for most migrant children is their village of origin rather than their current city of residence. For another, the city governments have little incentive to accommodate migrant children given the excessive financial burden and other presumed socio-psychological challenges if these children are admitted. As a result, most migrant children are still attending substandard private schools or paying extra fees to attend city public schools. A recent estimate suggests that about 7 per cent of migrant children have never attended school.Footnote 43 Lack of other important benefits, including pensions, health insurance, work injury insurance and unemployment insurance, remain serious problems for migrants. They are left out of the urban dibao programme because it requires recipients to have an urban hukou.
Conclusion and Policy Implications
This article investigates the redistributive nature of the Chinese social benefit system within urban and rural areas and in the national context during the 1988–2002 period. Like many other dimensions of Chinese society, this appears to be a two-sided story. Urban social benefits were much more generous and predominantly progressive, while rural social benefits were minimal and consistently regressive. This unbalanced provision of social benefits was coupled with large pre-transfer income inequality gaps in both urban and rural areas, leading to even greater income inequality at the national level.
The much lower household income in rural China as compared to urban China and the fact that the vast majority of all social benefits were allocated to urban residents contributed to an overall regressive national social benefit system. In particular, the rich were heavily favoured while the poor were discriminated against in social benefit transfers. One promising finding is that the extent of the regressivity of social benefits at the national level decreased during the study period. Such a positive change suggests that China's social welfare policies are moving in a more equitable direction, as illustrated by many government initiatives since 2002.Footnote 44 The outcomes of these initiatives, especially their redistributive effects, require close observation and await evaluation.
While the focus of this study is on social benefits, the dominant role of pre-transfer income (that is, market income) emerges from the analysis. The progressive urban social benefits were unable to close the rising income inequality gap driven by pre-transfer income. Additionally, the disparity in pre-transfer income between urban and rural areas contributed to even higher inequality gaps in the national context. Although China implements a market economy “with socialist characteristics,” it is in the interest of the government to maintain income inequality at an acceptable level in order to avoid possible social unrest. Whether and to what extent the government chooses to intervene in the market economy or redistribute income through social benefits remains to be seen.
Several important policy lessons emerge from these findings. First, the rural social benefit system should be further expanded and its regressivity needs to be reduced. Despite expansions in the provision of rural benefits since 2002, the rural system still lags behind the urban system in terms of coverage and benefit levels, as well as progressivity. It will take persistent efforts and close monitoring to ensure that the recent policy initiatives are carried out so that rural residents' basic welfare needs are met and greater equity is achieved. For example, the many challenges faced by the newly restored RCMS – including low benefit levels, adverse selection for participation, moral hazards in service use and benefit claiming, and a rising financial burden on the government – all need to be considered and addressed in the next steps of its reforms.
Second, the expansion in public assistance (most notably the dibao programme) in both urban and rural areas should be supplemented by work-support programmes to provide work incentives, skills training and job opportunities for the poor. As revealed by recent ethnographic work, the dibao may actually deter participants from working or pursuing better life opportunities and trap these families in deeper or lengthier poverty.Footnote 45 “Make work pay” programmes such as Earned Income Tax Credit in the United States and Working Tax Credit in Britain have been successful alternatives to alleviate poverty and encourage work.Footnote 46 These programmes operate as a refundable tax credit to subsidize workers in low-income families. Under the American system, a working family can receive tax credits (calculated as a percentage of earned income) up to a certain income threshold. This programme has been the most effective anti-poverty programme in the US. It was adopted by South Korea in 2008, and China should also consider adopting it to move poor families from welfare to work. In addition, other services such as skills training and information on job opportunities should be provided.
Third, it is vital to address the lack of social benefits for the continuously growing migrant population. While the government pledges to expand the urban and rural social benefit systems, there is an urgent need to establish a basic safety net for migrants. The lack of any such safety net could lead to serious social unrest and impede economic and social developments. This not only violates the respect for the basic rights of this large and vulnerable population, but also ignores the enormous contributions to economic growth made by migrants over the years. To establish a social benefit system for them is essential in building the Chinese “welfare state”Footnote 47 and in achieving a “harmonious society.”