





Introduction
In cultural narratives, drugs are often portrayed as catalysts for inspiration and imagination, yet also regarded as poisons that erode genius. Drug-induced neurotoxic alterations promote compulsive drug-seeking behavior, which may impair divergent thinking and lead to cognitive rigidity (Cole et al., Reference Cole, Zimmerman, Matchanova, Kutlu, Gould and Parikh2020; Gangal et al., Reference Gangal, Xie, Huang, Cheng, Wang, Lu, Zhuang, Essoh, Huang, Chen, Smith, Smith and Wang2023). Such cognitive limitations may undermine adaptive responses to environmental demands, constituting a critical factor underlying persistently high relapse rates (Carrión et al., Reference Carrión, John, Dorvil, Auther, McLaughlin, Arnovitz, Bachman, Belger, Duncan, Hamilton, Johannesen, Ku, Light, Niznikiewicz, Roach, Addington, Bearden, Cadenhead, Cannon and Cornblatt2026). Previous studies have primarily focused on the effects of drug addiction on general cognitive functions (Ceceli et al., Reference Ceceli, Parvaz, King, Schafer, Malaker, Sharma, Alia-Klein and Goldstein2023; Domínguez-Salas, Díaz-Batanero, Lozano-Rojas, & Verdejo-García, Reference Domínguez-Salas, Díaz-Batanero, Lozano-Rojas and Verdejo-García2016; Verdejo-Garcia et al., Reference Verdejo-Garcia, Clark, Verdejo-Román, Albein-Urios, Martinez-Gonzalez, Gutierrez and Soriano-Mas2015). However, how long-term drug use and withdrawal affect higher-order thinking processes, such as divergent thinking, and their association with withdrawal symptoms remains elusive. This gap limits a deeper understanding of adjustment difficulties during abstinence and hinders the acceptance and effectiveness of withdrawal treatment (Goldstein, Reference Goldstein2022; Vidrine et al., Reference Vidrine, Reitzel, Figueroa, Velasquez, Mazas, Cinciripini and Wetter2013).
As a core component of higher-order thinking and flexible behavior, divergent thinking enables individuals to generate novel and appropriate solutions through cognitive shifting when habitual strategies fail to resolve a problem (Ovando-Tellez et al., Reference Ovando-Tellez, Kenett, Benedek, Bernard, Belo, Beranger, Bieth and Volle2022). The prefrontal cortex (PFC) and temporoparietal junction (TPJ) are the key neural substrates for divergent thinking. Previous neuroimaging studies have consistently revealed structural abnormalities and functional dysregulation in the PFC and TPJ among individuals with drug addiction (Herlinger & Lingford-Hughes, Reference Herlinger and Lingford-Hughes2022; Liu et al., Reference Liu, Hao, Kaneko, Ouyang, Zhang, Xu, Xue and Liu2009; Sun et al., Reference Sun, Wang, Lin, Lu, Shu, Meng, Wang, Han, He and Shi2017; Tolomeo & Yu, Reference Tolomeo and Yu2022; Wollman et al., Reference Wollman, Alhassoon, Hall, Stern, Connors, Kimmel, Allen, Stephan and Radua2017). The PFC regulates top-down cognitive control to maintain goal-directed behavior, while the TPJ updates problem context representation and regulates spontaneous reflection processes (Beaty et al., Reference Beaty, Cortes, Zeitlen, Weinberger and Green2021; Benedek et al., Reference Benedek, Jauk, Fink, Koschutnig, Reishofer, Ebner and Neubauer2014; Chen et al., Reference Chen, Yang, Li, Wei, Li, Lei, Zhang and Qiu2014, Reference Chen, Beaty, Wei, Yang, Sun, Liu, Yang, Zhang and Qiu2018; Huang, Tang, Sun, & Luo, Reference Huang, Tang, Sun and Luo2018; Ovando-Tellez et al., Reference Ovando-Tellez, Kenett, Benedek, Bernard, Belo, Beranger, Bieth and Volle2022). During divergent thinking, the TPJ is involved in idea generation, while the PFC supports idea evaluation and integration (Dosenbach et al., Reference Dosenbach, Fair, Miezin, Cohen, Wenger, Dosenbach, Fox, Snyder, Vincent, Raichle, Schlaggar and Petersen2007). Therefore, functional abnormalities in the TPJ and PFC could disrupt key cognitive processes underlying divergent thinking. Lower efficiency in neural information transmission and higher cognitive demands may induce compensatory mechanisms, manifested by increased activation to mitigate neural functional damage (Huhn et al., Reference Huhn, Brooner, Sweeney, Yip, Ayaz and Dunn2019; Jansen et al., Reference Jansen, Van Holst, Van Den Brink, Veltman, Caan and Goudriaan2015; Mayer et al., Reference Mayer, Wilcox, Teshiba, Ling and Yang2013; McConnell et al., Reference McConnell, Garland, Zubieta, Newman-Norlund, Powers and Froeliger2020).
More efficient regional coupling is essential for sustaining goal-directed behavior and adaptive control (Menon & D’Esposito, Reference Menon and D’Esposito2022). Individuals with high divergent thinking typically exhibit strong connectivity between PFC and TPJ (Beaty et al., Reference Beaty, Cortes, Zeitlen, Weinberger and Green2021; Chen et al., Reference Chen, Beaty, Wei, Yang, Sun, Liu, Yang, Zhang and Qiu2018). The PFC serves as a core hub of the executive control network (ECN), whereas portions of the TPJ constitute key nodes of the default mode network (DMN) (Davey, Pujol, & Harrison, Reference Davey, Pujol and Harrison2016). This PFC–TPJ coupling may therefore reflect functional interactions between executive control and internally oriented processing systems that support divergent thinking. Disruptions in ECN–DMN connectivity have been observed in individuals with substance use disorders (Ceceli, Bradberry, & Goldstein, Reference Ceceli, Bradberry and Goldstein2022; Zhang & Volkow, Reference Zhang and Volkow2019). During withdrawal, chronic opioid users with pain may reflect a shift in neural resources from the ECN to the DMN, potentially leading to impaired flexible goal-directed control (McConnell et al., Reference McConnell, Garland, Zubieta, Newman-Norlund, Powers and Froeliger2020). Reduced top-down control may facilitate unconstrained thinking processes, such as mind-wandering and spontaneous associations, which support the generation of divergent ideas (Christoff et al., Reference Christoff, Irving, Fox, Spreng and Andrews-Hanna2016). However, excessive decoupling of executive control could disrupt the goal-directed evaluation, integration, and refinement of ideas, ultimately impairing divergent thinking performance (Fu et al., Reference Fu, Wang, Li, Meng, Dang, Yuan and Duan202 Reference Beaty, Kenett, Christensen, Rosenberg, Benedek, Chen, Fink, Qiu, Kwapil, Kane and Silvia6; Menon & D’Esposito, Reference Menon and D’Esposito2022).
Impairment in divergent thinking reduces the ability to generate flexible and adaptive responses during abstinence, thereby leading to cognitive rigidity (Simon & Bock, Reference Simon and Bock2016; Zabelina & Ganis, Reference Zabelina and Ganis2018). Such rigidity often increases a repetitive focus on negative internal states and limits effective coping strategies, which may exacerbate protracted withdrawal symptoms after the acute physiological phase, including persistent physical discomfort and negative emotional states (Demirbas, Ilhan, & Dogan, Reference Demirbas, Ilhan and Dogan2012; Gangal et al., Reference Gangal, Xie, Huang, Cheng, Wang, Lu, Zhuang, Essoh, Huang, Chen, Smith, Smith and Wang2023; Watkins & Roberts, Reference Watkins and Roberts2020). However, the relationship between impaired divergent thinking and withdrawal symptoms remains to be clarified. Moreover, the shared neural signatures of these processes need to be identified, which could facilitate the diagnosis of high-risk populations and provide new intervention targets for the concurrent improvement of withdrawal outcomes and higher-order cognitive function.
In conclusion, the present study aims to examine divergent thinking deficits in heroin use disorder (HUD), characterize their underlying neural correlates, and explore how these impairments co-occur with protracted withdrawal symptoms. In the study, we mainly focused on the PFC and TPJ and detected their cortical neural responses using functional near-infrared spectroscopy (fNIRS). fNIRS has been widely used in monitoring abnormal neural indicators of mental disorders, demonstrating its efficacy in assessing cortical activity and functional connectivity (Duan, Van Dam, Ai, & Xu, Reference Duan, Van Dam, Ai and Xu2020; Liu et al., Reference Liu, Liu, Yi, Zhu, Markey and Pelowski2019). Due to its portability and cost-effectiveness, fNIRS has demonstrated significant potential and advantages in the rapid diagnosis and classification of brain diseases (Albrecht, Kvist, & Franzén, Reference Albrecht, Kvist and Franzén2025; Butters et al., Reference Butters, Srinivasan, O’Brien, Su and Bale2023). A detailed investigation into fNIRS neural signatures can provide key biomarkers for the rapid diagnosis of withdrawal states and cognitive impairments, and offer direct cortical targets for non-invasive brain stimulation interventions. Using sparse regression-based feature identification, key neural features jointly associated with impairments in divergent thinking and the severity of withdrawal symptoms were precisely extracted. Additionally, although previous studies have demonstrated that some of the structural brain abnormalities related to addiction are restored as withdrawal time increases, cognitive impairments such as decision-making remain after 1.5 years of abstinence in drug users (Biernacki et al., Reference Biernacki, McLennan, Terrett, Labuschagne and Rendell2016; Zhang et al., Reference Zhang, Zhao, Zhang, Cao, Yin, Liu, Yuan and Luo2019). To further investigate the lasting impact of heroin dependence on divergent thinking, this study also examines differences among HUD patients at varying abstinence periods. We hypothesized that HUD individuals have impaired divergent thinking, which is associated with hyperactivation and impaired network connectivity. Such behavioral impairment and abnormal cortical activity patterns could reliably predict the severity of protracted withdrawal symptoms.
Methods
Participants
The present study recruited 70 heroin users aged 35 to 55 years from multiple drug rehabilitation centers who were under isolation treatment. 35 healthy control participants were recruited from the local schools and communities, who were matched to the HUD group in terms of age, gender, educational attainment, smoking, and drinking habits. Selection criteria for participants with HUD included: (1) meeting the diagnostic criteria for severe substance use disorder outlined in the Fifth Edition of the Diagnostic and Statistical Manual of Mental Disorders (DSM-5); (2) consuming an average of 0.1 grams or more of heroin per day, with a positive result of a urine test before entering the rehabilitation center; (3) having a history of drug use for 10 years or more; (4) absence of other substance use disorders, such as methamphetamine, cannabis, and so forth. All participants had no symptoms of mental illness or a family history of mental illness, no intake of hormonal contraceptives, anesthetics, or caffeine-containing foods in the three days before the experiment, and no recent surgery. At the rehabilitation center, all HUD participants underwent standardized rehabilitation procedures, including daily physical exercise and supportive therapy to prevent relapse.
These participants were in a continuous abstinence period of 6–18 months (Francis, Reference Francis2020; Laudet & White, Reference Laudet and White2008). Evidence from animal experiments and neuroimaging studies suggests that approximately 12 months after abstinence represents a critical stage during which neural plasticity, cognitive function, and emotion regulation show significant recovery (Martinelli et al., Reference Martinelli, Nagelhout, Bellaert, Best, Vanderplasschen and Van De Mheen2020; Xu et al., Reference Xu, Liu, Li, Deng, Huang, Yuan, Lv, Wang, Zhang, Guo, Han, Liu and Fu2015). To further examine whether divergent thinking shows significant improvement with increasing duration of abstinence, the HUD participants were further divided into two subgroups based on drug withdrawal duration: one group with a drug abstinence period of 6–12 months (HUD1), and another with a period of 12–18 months (HUD2). Eight participants were excluded from the study due to compromised data resulting from sampling interruptions and poor signal quality. The final sample consisted of 34 participants in the HUD1 group (age: M = 49.23 years, SD = 6.63), 30 participants in the HUD2 group (age: M = 46.33 years, SD = 9.94), and 33 participants in the HC group (age: M = 46.39 years, SD = 7.06). Detailed demographic and addiction characteristics are presented in Supplementary Table S1.
Task and procedure
The Realistic Presented Problem-solving Task (RPP) was employed to assess divergent thinking (Cheng, Zhang, Xie, & Hao, Reference Cheng, Zhang, Xie and Hao2026; Duan et al., Reference Duan, Yang, Wang, Kan, Zhao, Li and Hu2022 ; Xue, Lu, & Hao, Reference Xue, Lu and Hao2018; Yuan, Lu, Yang, & Hao, Reference Yuan, Lu, Yang and Hao2021). Participants were required to verbally generate as many solutions as possible for realistic social problems commonly encountered in daily life. The RPP task was adapted from the Alternative Uses Task (AUT) paradigm by replacing abstract object-based problems with realistic social scenarios. Naturalistic contexts with greater ecological validity minimize potential behavioral differences attributable to general cognitive abilities between the HUD and HC groups. Open-ended problems without predefined correct answers can effectively assess divergent thinking, reflecting the processes of flexible idea generation and adaptive problem-solving.
In this study, three socially relevant problem scenarios from the Means-Ends Problem-solving Task (MESP) were selected as test items (Madore & Schacter, Reference Madore and Schacter2014). All scenarios were randomly presented from a third-person perspective. For example, one scenario described a hypothetical individual who had recently moved to a new neighborhood and did not know anyone there. Participants were instructed to generate possible ways to help him/her establish new social connections. Each item was presented for 2 minutes, followed by a 20-second fixation interval (“+”). fNIRS data were recorded throughout task completion.
Protracted withdrawal symptoms scale
Protracted withdrawal syndrome was assessed by the Rating Scale for Protracted Withdrawal Symptoms of heroin addiction (Jie et al., Reference Jie, Jun, Yanping, Tingting, Xiaoli, Liyan, Guozhu, Yanping, Lin, Wei, Hongxian, Jing, Suxia, Mingsheng, Zuoning and Lixia2009). It contains 19 items in four dimensions: physical symptoms, emotional symptoms, craving symptoms, and insomnia symptoms. The items were scored on a 5-point scale. Higher scores indicated more severe protracted withdrawal symptoms.
fNIRS data acquisition
Near-infrared signals of three wavelengths of 780 nm, 805 nm, and 830 nm were recorded by the NirSmatII-200pro system (HuiChuang, China) with a sampling rate of 11 Hz. In all, 24 emitters and 24 detectors were spaced three centimeters apart to form 68 recording channels (Figure 1a,b). Referencing the international 10–20 system, the placement of the optodes covering the PFC was referred to as the Fpz electrode, while the placement of the optodes covering the bilateral parietal and temporal cortex was referred to as the P6 electrode and P5 electrode (Zhao et al., Reference Zhao, Li, Wang, Kan, Xu and Duan2022). The spatial positions of all optodes and channels were recorded by a 3D magnetic space digitizer (FASTRAK; Polhemus, USA). The Brodmann partition, based on MNI coordinates, was further converted using the NIRS-SPM MATLAB package (Supplementary Table S8). Seven sub-regions were identified, including the dorsolateral prefrontal cortex (dlPFC, BA9, BA46), frontopolar area (FPC, BA10), inferior prefrontal gyrus (IFG, BA47), orbitofrontal area (OFC, BA11), angular gyrus (AG, BA39), supramarginal gyrus (SMG, BA40), superior parietal lobule (SPL, BA7), and superior temporal gyrus (STG, BA22) (for a detailed description, see Supplementary Table S7). The AG and SMG overlap with the TPJ (Igelström & Graziano, Reference Igelström and Graziano2017).
Diagram of the fNIRS optode probes and analysis workflow. (a) 68 fNIRS channels composed of 24 emitters and 24 detectors. The center point of the bottom row of optode probes was located at Fpz. The center point of the bilateral parietal and temporal cortex was located separately in P6 and P5. (b) Regions of interest. The configuration of the regions of interest was located according to the MNI coordinates. (c) Overall analysis workflow.

Figure 1. Long description
Panel A shows the f N I R S channel configuration. A large grid at the bottom contains 38 numbered channels interspersed with red emitters and blue detectors, with an arrow pointing from channel 26 to the F p z anchor. Two smaller grids above represent bilateral parietal and temporal regions. The left grid contains channels 39 through 53, anchored at P 6. The right grid contains channels 54 through 68, anchored at P 5.
Panel B displays three anatomical brain models labeled F for Frontal, R for Right, and L for Left. Numbered circles on the brain surfaces correspond to the f N I R S channels. A legend identifies eight color-coded regions of interest: Dorsolateral Prefrontal Cortex (d l P F C) in pink, Frontopolar Cortex (F P C) in orange, Inferior Prefrontal Gyrus (I F G) in brown, Orbitofrontal Cortex (O F C) in teal, Supramarginal Gyrus (S M G) in green, Angular Gyrus (A G) in purple, Superior Parietal Lobule (S P L) in light pink, and Superior Temporal Gyrus (S T G) in yellow.
Panel C outlines the workflow in two main sections. The Data Collection section shows an f N I R S Recording timeline alternating between 20-second rest periods and 2-minute task items (Item 1, Item 2, Item 3) related to a Realistic Presented Problem Task measuring Fluency, Flexibility, Originality, Appropriateness, and Persistence. The Data Extraction section flows from Pre-processing to three analysis streams: Cortical Activation using a General Linear Model (G L M) to find Beta Values; Functional Connectivity (F C) resulting in Task-related F C Matrices for H U D 1, H U D 2, and H C groups; and Network Topological Analysis. This final stream calculates Global Network Metrics (Global and Local Efficiency) and Local Network Metrics (Nodal Efficiency, Nodal Local Efficiency, Nodal Degree Centrality, and Nodal Clustering Coefficient) visualized through node-and-link network diagrams.
Behavioral data analysis
The overall analysis workflow is illustrated in Figure 1c. Following the standardized scoring method of the classic AUT for assessing divergent thinking (Wang et al., Reference Wang, Ding, Dou, Zhu, Zhang, Yi, Wu, Xie, Zhu, Song and Li2022, Reference Wang, Zhang, Li, Qi, Zhang, Ball and Duan2023), responses generated in the RPP task were evaluated across three key dimensions: fluency, flexibility, and originality. Additionally, appropriateness and persistence were assessed to further gauge participants’ abilities in idea evaluation and sustained exploration. The fluency score was the total number of answers given by a participant, with 1 point for each reasonable answer. The flexibility score was the number of categories in a participant’s answers, with one point for each category. The originality score was determined by the frequency of a reported answer in the overall answer pool, which was composed of the answers from all participants. Two points were given when the percentage was less than 1%. One point was given when the percentage was between 1% and 5%. No points were given when the percentage exceeded 5%. The appropriateness scores were rated on a 5-point scale, with 5 being “strongly appropriate” and 1 being “strongly inappropriate.” The appropriateness scores of each answer were averaged to get the final appropriateness score of one participant. Two professionals in the field of psychology assessed each participant’s responses. The average scores of the two raters were used as the overall results for each of the three dimensions. The persistence scores were ultimately calculated by dividing flexibility scores by fluency scores (Nijstad, De Dreu, Rietzschel, & Baas, Reference Nijstad, De Dreu, Rietzschel and Baas2010; Wang, Lu, Runco, & Hao, Reference Wang, Lu, Runco and Hao2018). It was confirmed that the Internal Consistency Coefficient (ICC) between the two raters was reliable (fluency ICC = 0.994, flexibility ICC = 0.964, originality ICC = 0.919, appropriateness ICC = 0.809). The final score for each dimension is the total of the three items.
fNIRS data analysis
The NirSpark v1.8.1 (HuiChuang, China) was used to preprocess the fNIRS data. Motion artifacts were removed using a spline interpolation method by calculating the moving standard deviation. A bandpass filter with a frequency of 0.01 Hz–0.1 Hz was then applied to diminish both noise and interference signals, such as low-frequency drift, heartbeats, and breathing (Zhang et al., Reference Zhang, Moerman, Niu, Warreyn and Roeyers2022). The concentration changes of HbO, HbR, and HbT were converted from the raw density signals by the modified Beer–Lambert Law. The subsequent analysis utilized the HbO signal as the primary indicator, given its superior signal-to-noise ratio and greater sensitivity to cerebral blood flow changes (Yennu, Tian, Gatchel, & Liu, Reference Yennu, Tian, Gatchel and Liu2016). The fNIRS data were then smoothed with the hemodynamic response function (HRF) to correct the temporal autocorrelation (Friston et al., Reference Friston, Josephs, Zarahn, Holmes, Rouquette and Poline2000). A block range was set to 0–120 s with a pre-baseline range of -20s. Based on the general linear model (GLM), the beta values for the 68 channels were analyzed to reflect the level of neural activation. The beta values of all channels within each ROI were averaged.
The task-related functional connectivity (FC) strengths between channels were calculated using Pearson correlation coefficients. To achieve a stable FC strength, the total duration of three blocks excluding the fixation was used for analysis, yielding a 68 × 68 correlation matrix representing FC strength over the time series (Aarabi & Huppert, Reference Aarabi and Huppert2019). Fisher’s r-to-z transformation was applied to normalize coherence values into a Gaussian distribution variable. Based on the channel-based localization of brain regions, we averaged all channel-to-channel pairs within the regions of interest (ROIs) to determine both inter-ROI and intra-ROI connectivity.
Gretna toolbox was used to conduct the main network analysis based on binary brain networks (Wang et al., Reference Wang, Du, Chen, Chen, Huang, Luo, Zhao, Kumar and Gong2015). Since negative correlations also reflect signal synchronization between cortical regions, the absolute value of functional connectivity was incorporated into the calculation. To minimize bias from using a single threshold, a sparsity of 10% - 50% (Step size = 1%) was applied to extract the brain networks’ topological features (Wang et al., Reference Wang, Ding, Dou, Zhu, Zhang, Yi, Wu, Xie, Zhu, Song and Li2022; Zhang et al., Reference Zhang, Moerman, Niu, Warreyn and Roeyers2022). To assess overall brain network connectivity, the area under the curve (AUC) of each network metric was calculated across different sparsity levels. In this study, global network and regional node metrics were compared between the addiction and control groups (Latora & Marchiori, Reference Latora and Marchiori2001). Global network metrics included global efficiency (
$ {E}_{glob} $
 ) and local efficiency (
$ {E}_{loc} $
 ), while nodal network metrics encompassed nodal efficiency, nodal local efficiency, nodal degree centrality, and nodal clustering coefficient (detailed in Method S2).
Statistical analysis
Statistical significance testing
An F-test with Group (HUD1, HUD2, HC) as the between-participants factor was conducted using SPSS 25.0 for the between-group statistical comparison. F-test results for the fNIRS data were corrected using the False Discovery Rate (FDR) method, and post hoc tests were adjusted using the Bonferroni method to control for multiple comparison errors.
Sparse regression-based features identification
To further examine the shared neural features between divergent thinking deficits and protracted withdrawal symptoms, sparse regression-based feature identification was applied (Zhang et al., Reference Zhang, Yang, Shang, Guo, Zhang, Du, Zhang, Yang, Shang, Guo, Zhang and Du2025). In Sparse Regression Prediction, let Y∈Rn × q be the matrix of fNIRS neural signatures with n subjects and q features, and z be the diagnosis status of protracted withdrawal symptoms; the regression model:

which could reveal diagnosis-related features. If Ω(v) is the L1-norm, this model is the LASSO. LASSO promotes sparsity by shrinking the coefficients of less informative features toward zero, thereby selecting a compact subset of predictive biomarkers and potentially improving model generalization. Owing to the sparsity-inducing nature of the subgradient-optimized LASSO, the resulting coefficient vector contains a small number of large-magnitude weights and many near-zero values. Features associated with high-magnitude coefficients are interpreted as predictive features, forming the final selected feature set for downstream analysis.
Results
Lower behavioral performance in the HUD groups relative to the HC group
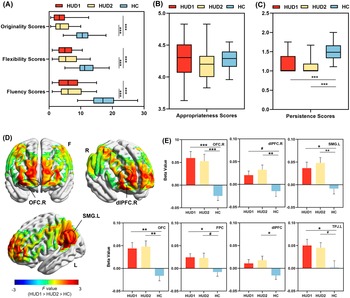
The results showed a significant main effect of Group in fluency [F (2, 94) = 62.28, p < 0.001, ηp 2 = 0.570], flexibility [F (2, 94) = 41.96, p < 0.001, ηp 2 = 0.472], originality [F (2, 94) = 38.16, p < 0.001,ηp 2 = 0.448] and persistence [F (2, 94) = 35.50, p < 0.001, ηp 2 = 0.430] (Figure 2a–c, Supplementary Table S2). Bonferroni-adjusted pairwise comparison tests indicated that RPP scores in the two HUD groups were lower than those in the HC group on the dimensions of fluency (HUD1: p < 0.001; HUD2: p < 0.001), flexibility (HUD1: p < 0.001; HUD2: p < 0.001), originality (HUD1: p < 0.001; HUD2: p < 0.001) and persistence (HUD1: p < 0.001; HUD2: p < 0.001). For appropriateness scores, no significant difference was found between the HUD and HC groups [F (2, 94) = 0.12, p = 0.886, ηp 2 = 0.003]. There were also no significant differences in RPP performance between the HUD1 and HUD2 groups.
Differences in task performance and cortical activation among three groups. (a) Scores on originality, flexibility, and fluency dimensions among three groups. (b) Scores on appropriateness dimensions among three groups. (c) Scores on the persistence dimension among three groups. (d) The F-map illustrates the differences in F-values across brain regions among the three groups. Significant subcortical regions delineated through FDR correction are highlighted. (e) Beta values across significant ROIs after FDR correction among the three groups. Error bars represent standard errors of the mean. Note: L, ‘left sagittal plane’; R, ‘right sagittal plane’; F, ‘coronal plane’. HUD1: ‘heroin use disorder group with short duration of abstinence’; HUD2: ‘heroin use disorder group with long duration of abstinence’; HC: ‘healthy control group’. #p < 0.10, *p < 0.05, **p < 0.01, ***p < 0.001.

Figure 2. Long description
Panel A is a horizontal box plot showing originality, flexibility, and fluency scores. The H C group (blue) significantly outperforms H U D 1 (red) and H U D 2 (yellow) across all three metrics, indicated by triple asterisks. Panel B shows appropriateness scores with overlapping ranges between 3.5 and 5.0. Panel C shows persistence scores where H C is significantly higher than both H U D groups. Panel D displays three-dimensional brain maps in coronal (F), right sagittal (R), and left sagittal (L) planes. Heat maps show F-values ranging from negative 3 (blue) to positive 3 (red). Circles highlight significant regions: O F C dot R, d l P F C dot R, and S M G dot L. Panel E contains seven bar charts plotting Beta Values for specific R O I s: O F C dot R, d l P F C dot R, S M G dot L, O F C, F P C, d l P F C, and T P J dot L. In all regions, H U D 1 and H U D 2 show positive beta values while H C shows negative values. Significance levels are marked with pound signs for p less than 0.10, single asterisks for p less than 0.05, double for p less than 0.01, and triple for p less than 0.001.
Higher cortical activation in the HUD groups relative to the HC group
The main effect of Group was significant on the OFC [F (2, 94) = 8.78, p FDR < 0.001, ηp 2 = 0.158], the FPC [F (2, 94) = 4.35, p FDR = 0.029, ηp 2 = 0.157], the dlPFC [F (2, 94) = 4.11, p FDR = 0.029, ηp 2 = 0.080], and the left TPJ [F (2, 94) = 4.18, p FDR = 0.029, ηp 2 = 0.082] (Figure 3, Supplementary Table S3). Subsequently, the Bonferroni-adjusted pairwise comparison tests showed that the two HUD groups exhibited greater activation in the OFC (HUD1: p = 0.001; HUD2: p = 0.002) and dlPFC (HUD1: p = 0.076; HUD2: p = 0.029) compared to the HC group. Activation on the FPC (HUD1: p = 0.015; HUD2: p = 0.154) and left TPJ (HUD1: p = 0.021; HUD2: p = 0.110) was greater in the HUD1 group than in the HC group.
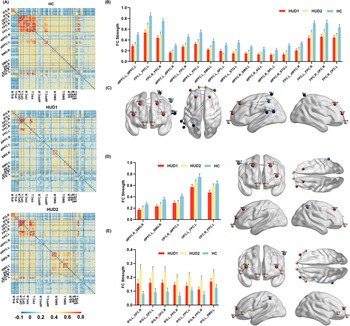
The difference in the functional connectivity among the three groups. (a) Group-averaged connectivity matrix map for HUD1, HUD2, and HC groups. The Pearson correlation coefficient z-value was presented in the correlation matrix maps corresponding to channel pairs from each ROI. (b) Group-averaged functional connectivity strengths of significant ROI pairs after F-tests with FDR correction. (c) The visualization of spatial information through ROI connectivity. Error bars represent standard errors of the mean. Note: HUD1: ‘heroin use disorder group with short duration of abstinence’; HUD2: ‘heroin use disorder group with long duration of abstinence’; HC: ‘healthy control group’.

Figure 3. Long description
Panel A displays three group-averaged connectivity matrix maps for H C, H U D 1, and H U D 2. The matrices show Pearson correlation coefficient z-values ranging from negative 0.1 in blue to 0.8 in red. Regions of interest labeled on both axes include I F G, O F C, F P C, d l P F C, S M G, A G, and S T G for both left and right hemispheres. The H C group shows the highest density of red-orange high-correlation clusters, while H U D 1 shows the lowest.
Panel B is a bar chart showing F C Strength across 16 significant R O I pairs. The y-axis ranges from 0.0 to 1.0. For every pair, such as d l P F C dot L to d l P F C dot R and F P C dot L to F P C dot R, the H C group (blue bar) has the highest strength, followed by H U D 2 (yellow bar), and H U D 1 (red bar) has the lowest. Error bars indicate standard error of the mean.
Panel C provides anatomical visualizations of the brain from frontal, dorsal, and lateral views. Colored nodes representing R O I s are connected by lines of varying thickness to indicate functional connectivity. Red nodes are concentrated in the frontal regions, while blue nodes are located in the parietal and temporal regions. The lines illustrate the spatial distribution of the significant connections analyzed in the bar charts.
Differences in global and nodal network topological characteristics among three groups. (a) Global network properties in the sparsity range of 10%—50% (Step size = 1%). (b) Nodal distributions within ROIs show significant differences across three groups in nodal network properties. The nodes are shown with different node sizes, indicating the F values of ANOVA. The nodes within disrupted ROIs with significantly decreased or increased values related to HUD are respectively shown in blue and red. (c) Group-averaged values of nodal network properties among disrupted ROIs. Error bars represent standard errors of the mean. Note: L, ‘left sagittal plane’; R, ‘right sagittal plane’; F, ‘coronal plane’. HUD1: ‘heroin use disorder group with short duration of abstinence’; HUD2: ‘heroin use disorder group with long duration of abstinence’; HC: ‘healthy control group’. #p < 0.10, *p < 0.05, **p < 0.01, ***p < 0.001.

Figure 4. Long description
Panel A contains two line graphs showing Global Efficiency and Local Efficiency on the y-axes against Sparsity from 0.10 to 0.5 on the x-axes. Both metrics show a logarithmic increase as sparsity increases, with H U D 1, H U D 2, and H C groups following nearly identical trajectories.
Panel B displays anatomical brain maps from sagittal and coronal perspectives. Blue and red spheres of varying sizes represent nodes within R O I s. Larger spheres indicate higher F values from A N O V A. The maps are categorized by Nodal Efficiency, Nodal Local Efficiency, Nodal Degree Centrality, and Nodal Clustering Coefficient.
Panel C consists of four bar charts showing group-averaged values for specific R O I s including d l P F C dot L, I F G dot L, T P J dot R, and F P C dot L.
- Nodal Efficiency: H C is significantly higher than H U D 1 and H U D 2 in d l P F C dot L, while H U D 1 is highest in T P J dot R.
- Nodal Local Efficiency: H C is significantly higher than both H U D groups in d l P F C dot L.
- Nodal Degree Centrality: H C shows significantly higher values in d l P F C dot L and F P C dot L compared to H U D groups.
- Nodal Clustering Coefficient: H C is significantly higher than H U D groups in d l P F C dot L.
Statistical significance is indicated by asterisks where three asterisks denote p less than 0.001.
The left and right hemispheres of the ROI were further distinguished to localize regions of variance more accurately. The main effect of Group was significant on the right OFC [F (2, 94) = 12.64, p FDR < 0.001, ηp 2 = 0.212], the right dlPFC [F (2, 94) = 5.31, p FDR = 0.033, ηp 2 = 0.102], and the left SMG [F (2, 94) = 5.82, p FDR = 0.028, ηp 2 = 0.110]. Subsequent Bonferroni-adjusted pairwise comparison tests revealed that beta values of the right OFC (HUD1: p < 0.001; HUD2: p = 0.001), right dlPFC (HUD1: p = 0.046; HUD2: p = 0.009), and left SMG (HUD1: p = 0.014; HUD2: p = 0.011) in the HUD groups were significantly higher than those in the HC group. The differences in cortical activation in these regions between the HUD1 and HUD2 groups were not significant.
Alterations in functional connectivity in HUD
As seen in Figure 3a–c, the results of functional connectivity revealed weaker intra-ROI connections within the left dlPFC, left FPC, and right FPC in the HUD groups compared to the HC group (ANOVA tests, all ps < 0.05, FDR corrected) (Supplementary Table S4). Compared to the HC group, both HUD groups exhibited significantly reduced short-range FC strengths between ROIs within the PFC, including dlPFC.L_dlPFC.R, dlPFC.L_FPC.R, dlPFC.L_FPC.L, FPC.L_dlPFC.R, FPC.L_FPC.R, FPC.R_OFC.R, and FPC.R_OFC.L (ANOVA, all ps < 0.05, FDR corrected). Regarding the long-range FC strengths between the PFC and bilateral temporoparietal regions, both HUD groups demonstrated weaker FC strengths compared to the HC group, specifically between the bilateral dlPFC and temporoparietal regions, including SMG, SPL, and STG (ANOVA tests, all ps < 0.05, FDR corrected).
Additionally, the two HUD groups also exhibited partially differentiated FC patterns (Supplementary Tables S5–S6). The HUD1 group showed weaker FC strengths on ROI pairs between the bilateral dlPFC and right temporoparietal region (t-tests, all ps < 0.05), as well as ROI pairs between the OFC and other subregions of the PFC (t-tests, all ps < 0.02) (Figure 3d). The HUD2 group showed stronger FC strengths related to the IFG, particularly the connections of the IFG with the OFC, FPC, and the left temporoparietal region (t-tests, all ps < 0.05) (Figure 3e).
Alterations in the global and nodal network metrics in HUD
For global network properties, there was no significant difference in
$ {\mathrm{E}}_{\mathrm{glob}} $
 or
$ {E}_{loc} $
 between HUD and HC groups (Figure 4a). However, as shown in Figure 4b,c, both HUD groups exhibited significantly reduced nodal efficiency (HUD1: p = 0.040; HUD2: p < 0.001), nodal local efficiency (HUD1: p < 0.001; HUD2: p < 0.001), nodal degree centrality (HUD1: p < 0.001; HUD2: p < 0.001), and nodal clustering coefficient (HUD1: p < 0.001; HUD2: p < 0.001) in the left dlPFC compared to the HC group (ANOVA tests, all ps < 0.05, FDR corrected) (Supplementary Table S7). Additionally, the HUD1 group further showed reduced nodal local efficiency (p = 0.002) and nodal degree centrality (p = 0.001) in the left FPC compared to the HC group (ANOVA tests, all ps < 0.08, FDR corrected).
Conversely, compared with the HC group, both HUD groups showed higher nodal efficiency (HUD1: p = 0.014; HUD2: p = 0.026) and nodal degree centrality (HUD1: p = 0.018; HUD2: p = 0.013) in the left IFG, as well as higher nodal degree centrality in the right TPJ (HUD1: p = 0.009; HUD2: p = 0.015). In addition, the HUD1 group exhibited higher nodal efficiency in the right TPJ (p < 0.001) (ANOVA tests, all ps < 0.015, FDR corrected).
Prediction of protracted withdrawal symptoms by task-related brain responses
Pearson’s correlation analysis indicated that most of the brain response metrics were significantly correlated with scores on the RPP task (Figure 5a). Notably, in the HUD group, RPP task performance in fluency, flexibility, and originality showed significant negative correlations with emotional and insomnia symptoms of protracted withdrawal (Figure 5b). Moreover, multiple abnormal neural features related to network connectivity were also found to associate with both emotional and insomnia symptoms.
The prediction of protracted withdrawal symptoms by key features from cortical activity. (a) Correlation between all extracted neural features, task performance, and protracted withdrawal symptoms. In addition to the appropriateness dimension, four dimensions of the RPP task that showed significant differences across three groups were included in the analysis. (b) Correlations between the three dimensions of task performance and emotional and insomnia withdrawal symptoms. (c) Prediction performance for the four dimensions of protracted withdrawal symptoms. (d) Prediction weights of neural features. (e) Mediation model of neural features, task performance, and withdrawal symptoms. Note: BV: ‘beta value’; NE: ‘nodal efficiency’; NLE: ‘nodal local efficiency’; NDC: ‘nodal degree centrality’; NCC: ‘nodal clustering coefficient’. #p < 0.10, *p < 0.05, **p < 0.01, ***p < 0.001.

Figure 5. Long description
Panel A is a heatmap showing correlations between neural features on the vertical axis and task performance or symptoms on the horizontal axis. Red indicates positive correlation up to 0.4, and blue indicates negative correlation down to -0.4.
Panel B contains six scatter plots with linear regression lines. The top row shows negative correlations between Emotional symptoms and Fluency, Flexibility, and Originality scores. The bottom row shows similar negative correlations between Insomnia symptoms and the same three task scores. All plots show a downward trend with r values ranging from -0.31 to -0.41.
Panel C consists of two bar charts. The top chart shows R M S E values for Craving, Emotional, Physical, and Insomnia symptoms, with Craving being the highest. The bottom chart shows R values for the same categories, with Insomnia and Emotional symptoms showing the highest predictive correlation.
Panel D is a series of four horizontal heatmaps representing prediction weights for Craving, Emotional, Physical, and Insomnia symptoms across various neural features. Specific features like O F C underscore R underscore B V and d l P F C underscore R underscore S M G underscore R are highlighted with callout lines.
Panel E displays two mediation models. The left model in blue connects d l P F C underscore R underscore S M G underscore R to Emotional symptoms, mediated by Fluency, Flexibility, and Originality. The right model in red connects d l P F C underscore R underscore S M G underscore L to Insomnia symptoms through the same mediators. Both models show significant negative paths from task performance to symptoms.
Task-related neural features during divergent thinking significantly predicted emotional, physical, and insomnia symptoms (Emotional: RMSE = 0.34, r = 0.78; Physical: RMSE = 0.59, r = 0.59; Insomnia: RMSE = 0.37, r = 0.83) (Figure 5c). In contrast, the predictive performance for craving-related withdrawal symptoms was poor (RMSE = 1.53, r = 0.20). Among the selected features, FC strength of dlPFC.R_SMG.R, beta values of the OFC.R, and FC strength of dlPFC.R_SMG.L exhibited the highest relative weights in the prediction of emotional, physical, and insomnia symptoms, respectively (Figure 5d). Mediation analyses were further conducted to examine the relationships among the highest-weighted neural features, task performance, and withdrawal symptoms. The results indicated significant indirect effects linking FC strength of dlPFC.R_SMG.R to emotional symptoms via divergent thinking performance (Fluency, 95% CI = [−0.2007, −0.0148]; Flexibility, 95% CI = [−0.2215, −0.0244]; Originality, 95% CI = [−0.1893, −0.0096]) (Figure 5e). Similarly, the association between FC strength of dlPFC.R_SMG.R and insomnia severity was also statistically mediated by divergent thinking performance (Fluency, 95% CI = [−0.2657, −0.0463]; Flexibility, 95% CI = [−0.2635, −0.0450]; Originality, 95% CI = [−0.1988, −0.0341]). In contrast, physical symptoms were not significantly associated with task performance. However, the beta value of the OFC.R was significantly related to both physical symptoms and task performance.
Discussion
This study revealed deficits in divergent thinking in real-world situations and altered fNIRS neural signatures in individuals with HUD. Behavioral results demonstrated that both HUD groups exhibited significantly lower scores than the HC group across four dimensions of fluency, flexibility, originality, and persistence. fNIRS findings revealed significantly higher task-related activations in the right OFC, right dlPFC, and left TPJ in the HUD groups compared to the HC group. In contrast, the HUD groups exhibited significant reduction in functional connectivity strength within the PFC and between the PFC and bilateral TPJ. Additionally, significant reductions in local topological features were observed in the left dlPFC and left FPC in the HUD groups, whereas significant increases were noted in the right TPJ and left IFG. Aberrant brain features during divergent thinking effectively predicted the severity of protracted withdrawal symptoms. Functional connectivity between the right dlPFC and TPJ was identified as a shared neural feature underlying divergent thinking deficits and protracted withdrawal symptoms.
Previous studies have focused more on cognitive functions related to self-control involving drug stimuli and drug craving. The present study provides solid evidence of drug-related impairment in higher-order social cognitive function from the perspective of divergent thinking. In the context of heroin addiction, we observed widespread cortical hyperactivation during the creative problem-solving task, accompanied by disrupted intercommunication within core functional areas. These findings support the hypothesis of compensatory network dysfunction patterns, suggesting functional impairments in brain regions associated with chronic heroin use. Hyperactivation is indicative of neural inefficiency and elevated cognitive load (Wang et al., Reference Wang, Wang, Xia, Liao, Evans and He2015). Prolonged brain hypoxia may impair the capacity of neural circuits in individuals with HUD to allocate resources effectively (Solis, Cameron-Burr, Shaham, & Kiyatkin, Reference Solis, Cameron-Burr, Shaham and Kiyatkin2017; Younger et al., Reference Younger, Chu, D’Arcy, Trott, Jastrzab and Mackey2011), resulting in inadequate support for tasks requiring high cognitive demands such as creative problem-solving. As a consequence, increased recruitment of neural resources elevates cortical activation as a compensatory response to neural damage. The reduction in connectivity reflects impaired functional signal transmission between regions, resulting in aberrant functional integration of information required for creative problem-solving. Hypo-connectivity within and between core cognitive control areas has been demonstrated in multiple behavioral addictions (Chen et al., Reference Chen, Wang, Tang, Chen, Xiao, Guo, Qi, Wang and Wang2024 ). This pattern of hyper-activation and hypo-connectivity caused by network dysfunction has also been observed in typical brain disorders, such as schizophrenia (Wadehra, Pruitt, Murphy, & Diwadkar, Reference Wadehra, Pruitt, Murphy and Diwadkar2013).
Opioid drugs induced excessive signaling of m-opioid receptors within the PFC, thereby altering its responsiveness to excitatory drive (Anand et al., Reference Anand, Li, Wang, Wu, Gao, Bukhari, Mathews, Kalnin and Lowe2005; Baldo, Reference Baldo2016). Building on previous research, the PFC is the central region impaired by drug addiction. We identified task-related abnormal activation predominantly within specific subregions of the PFC, particularly the right dlPFC and the right OFC. These findings are consistent with numerous fMRI studies demonstrating reduced gray matter volume in the right PFC among heroin users (Lin et al., Reference Lin, Wang, Wu, Ko, Yang and Yen2018; Liu et al., Reference Liu, Hao, Kaneko, Ouyang, Zhang, Xu, Xue and Liu2009). Moderate activation of the right dlPFC could facilitate goal-directed behavior and support successful exploration within problem spaces (Kleibeuker et al., Reference Kleibeuker, Koolschijn, Jolles, Schel, De Dreu and Crone2013). However, excessive activation of the right dlPFC may be associated with compulsive behaviors (Khedr et al., Reference Khedr, Elbeh, Saber, Abdelrady and Abdelwarith2022). The activity in the OFC may represent the conflict between behavioral options independently of the task (Mansouri, Buckley, & Tanaka, Reference Mansouri, Buckley and Tanaka2014; Stalnaker, Takahashi, Roesch, & Schoenbaum, Reference Stalnaker, Takahashi, Roesch and Schoenbaum2009). The OFC regulates compulsive behaviors, modulating reward-related preferences and seeking behaviors in HUD patients (Guillem, Brenot, Durand, & Ahmed, Reference Guillem, Brenot, Durand and Ahmed2018; Li et al., Reference Li, Hu, Gao, Cao, Zhang, Bu, Lu, Wang, Tang, Li, Yang, Biswal, Gong and Huang2020; Maltby et al., Reference Maltby, Tolin, Worhunsky, O’Keefe and Kiehl2005; Seifert et al., Reference Seifert, Magon, Sprenger, Lang, Huber, Denier, Vogel, Schmidt, Radue, Borgwardt and Walter2015). In HUD, heightened OFC activation may indicate impaired regulation between goal-directed and habitual behaviors, promoting drug-seeking tendencies and consequently constraining adaptive problem-solving behaviors under high cognitive demands (Hu et al., Reference Hu, Salmeron, Krasnova, Gu, Lu, Bonci, Cadet, Stein and Yang2019; Mansouri et al., Reference Mansouri, Buckley and Tanaka2014; Walter et al., Reference Walter, Denier, Gerber, Schmid, Lanz, Brenneisen, Riecher-Rössler, Wiesbeck, Scheffler, Seifritz, McGuire, Fusar-Poli and Borgwardt2015).
In the functional connectivity within the PFC, both HUD groups were observed to have reduced internal short-distance connectivity centered on the dlPFC and FPC. Previous studies have also noted reduced intrinsic functional connectivity within the PFC during rest in HUD patients (Chen et al., Reference Chen, Wang, Zhu, Li, Liu, Xue, Shi, Li, Li and Wang2021; Lin et al., Reference Lin, Wang, Wu, Ko, Yang and Yen2018). The dlPFC and FPC are pivotal nodes in the ECN involved in monitoring and regulation, further confirming impaired executive control in HUD patients (Dosenbach et al., Reference Dosenbach, Fair, Miezin, Cohen, Wenger, Dosenbach, Fox, Snyder, Vincent, Raichle, Schlaggar and Petersen2007). Reduced intra-PFC functional connectivity impairs sustained attention and the inhibition of task-irrelevant distractors, thereby limiting the simultaneous maintenance and manipulation of candidate ideas during idea generation (Benedek et al., Reference Benedek, Schickel, Jauk, Fink and Neubauer2014). Furthermore, this connectivity deficit limits the integration of goal-directed information, preventing high-order evaluation and systematic optimization, which ultimately leads to diminished performance in divergent thinking tasks (Beaty et al., Reference Beaty, Kenett, Christensen, Rosenberg, Benedek, Chen, Fink, Qiu, Kwapil, Kane and Silvia2018; Zabelina & Andrews-Hanna, Reference Zabelina and Andrews-Hanna2016).
The TPJ mainly regulates the processing of divergent thinking, including conceptual updating, schema violation, and recombination of problem representations (Benedek et al., Reference Benedek, Jauk, Fink, Koschutnig, Reishofer, Ebner and Neubauer2014). Abnormal activation in the TPJ was observed in this study. However, decreased functional connectivity was not found in short-range connections within the TPJ, but in the long-range connection between the FPC/dlPFC and the bilateral TPJ. Further network analysis revealed that these nodes exhibit significantly reduced efficiency, local efficiency, degree centrality, and clustering coefficient. Meanwhile, the nodal efficiency and centrality of the right TPJ were significantly increased. These findings further support an imbalance in the allocation of neural resources within the cognitive control network, indicating a strategic shift in cognitive control from top-down to bottom-up processing. This decreased long-range connectivity is also reflected in ineffective core nodal hubs (Y. Liu et al., Reference Liu, Yu, Zhang, Liu, Duan, Alexander-Bloch, Liu, Jiang and Bullmore2014). These findings further support a decoupling between the ECN and the DMN, accompanied by a reallocation of neural resources from the ECN toward the DMN (Ceceli et al., Reference Ceceli, Bradberry and Goldstein2022; Zhang & Volkow, Reference Zhang and Volkow2019). These network-level alterations may be driven by chronic drug-induced impairments in prefrontal dopaminergic signaling and executive control. This reduces the capacity of the ECN to suppress internally oriented processing, thereby weakening behavioral control while enhancing drug-related reward processing (Koob & Volkow, Reference Koob and Volkow2016; Zhang & Volkow, Reference Zhang and Volkow2019). While the heightened TPJ activity might support spontaneous associative processes (Benedek et al., Reference Benedek, Jauk, Fink, Koschutnig, Reishofer, Ebner and Neubauer2014), this ‘unfettered’ bottom-up input is unfiltered and poorly integrated due to the weakened PFC–TPJ coupling. Individuals with HUD may manifest as an inability to suppress task-irrelevant introspective states (e.g., mind-wandering and distraction) (Christoff et al., Reference Christoff, Irving, Fox, Spreng and Andrews-Hanna2016), which makes HUD individuals more prone to prematurely abandon active problem-solving efforts. As evidence, the behavioral data revealed diminished task persistence in HUD individuals.
Machine-learning-based biomarker discovery frameworks can further identify disease-sensitive and interpretable neural features (Zhang et al., Reference Zhang, Yang, Shang, Guo, Zhang, Du, Zhang, Yang, Shang, Guo, Zhang and Du2025, Reference Zhang, Yang, Shang, Guo, Zhang and Du2026). Functional dysconnectivity between ECN and DMN has also been recognized as a crucial neural basis underlying craving persistence and relapse vulnerability (Meng et al., Reference Meng, Wang, Qi, Fu, Li, Xu, Yuan and Duan2026; Zhang & Volkow, Reference Zhang and Volkow2019). Consistent with this, our machine-learning predictive models identified weakened rdlPFC–TPJ coupling as a significant predictor of insomnia and emotional withdrawal symptoms. These findings suggest the common dysregulation of multiple systems, such as individual cognition, emotion, and physiological arousal, in HUD caused by PFC dysfunction. The rdlPFC is a key region involved in cognitive control, suppression of irrelevant information, and emotional regulation (Cieslik et al., Reference Cieslik, Zilles, Caspers, Roski, Kellermann, Jakobs, Langner, Laird, Fox and Eickhoff2013; Feeser et al., Reference Feeser, Prehn, Kazzer, Mungee and Bajbouj2014; Jackson et al., Reference Jackson, Feredoes, Rich, Lindner and Woolgar2021). Reduced rdlPFC–TPJ coupling may indicate impaired regulation of emotion-related and self-referential cognitive processing by the executive control system, thereby increasing the persistence of negative affect and rumination. When confronted with negative emotions and ruminative thoughts during abstinence, individuals with HUD may lack effective cognitive regulation and alternative behaviors, thereby exacerbating emotional distress and insomnia symptoms (Demirbas et al., Reference Demirbas, Ilhan and Dogan2012; Gangal et al., Reference Gangal, Xie, Huang, Cheng, Wang, Lu, Zhuang, Essoh, Huang, Chen, Smith, Smith and Wang2023; Wang et al., Reference Wang, Li, Fu, Zhang, Dang, Li, Ball and Duan2026; Watkins & Roberts, Reference Watkins and Roberts2020). During the sustained recovery period following the acute withdrawal phase, such intensified psychological and physical withdrawal symptoms constitute key contributors to relapse and the development of psychiatric disorders. Furthermore, although no correlation was found between divergent thinking and somatic symptoms, a significant predictive effect of high task-state rOFC activation levels on somatic symptoms was discovered. This result further demonstrates the crucial role of OFC in behavioral and physiological control during drug addiction. In conclusion, the identified prefrontal cortical hubs and their functional alterations provide novel insights into the neural links between cognitive dysfunction and relapse vulnerability, suggesting that targeted modulation of rdlPFC and rOFC functions may represent promising strategies for facilitating cognitive recovery and maintaining long-term abstinence.
In this study, deficits in divergent thinking did not improve with longer abstinence periods, suggesting that these sustained cognitive impairments require more attention in detoxification treatments to help reduce heroin relapse rates. Notably, the left IFG showed significantly higher activity in the HUD group, especially in those with longer withdrawal times. Specifically, the nodal characteristics of the left IFG were significantly higher in HUD2 compared to the control group. The HUD2 group with longer abstinence also showed stronger functional connectivity between the left IFG and the OFC. Previous research has consistently shown an inhibitory effect of the left IFG on creativity scores (Hertenstein et al., Reference Hertenstein, Waibel, Frase, Riemann, Feige, Nitsche, Kaller and Nissen2019; Khalil, Karim, Kondinska, & Godde, Reference Khalil, Karim, Kondinska and Godde2020; Kleinmintz et al., Reference Kleinmintz, Abecasis, Tauber, Geva, Chistyakov, Kreinin, Klein and Shamay-Tsoory2018), and disconnecting the left IFG from the right TPJ through brain stimulation has been found to improve divergent thinking (Huang et al., Reference Huang, Fu, Song, Ren, Li and Zhao2024). Therefore, the increased local network connectivity efficiency in the IFG partially indicates a maladaptive brain-network development pattern related to divergent thinking in individuals with HUD following abstinence.
There are several limitations to the present study. First, while heroin-dependent individuals did not show differences in task performance or brain damage based on abstinence duration, a longitudinal follow-up study is needed to provide additional evidence of developmental changes over time. Accordingly, although the mediation model suggests a potential mechanism linking altered neural activity, divergent thinking impairment, and withdrawal symptoms, longitudinal studies are required to clarify the causal relationships among these factors. Second, this study identified abnormal activation and functional connectivity patterns in the cerebral cortex. However, it would be worthwhile to further investigate the damaged pathways in the neural circuits, including the deep brain nuclei and their impact on social cognitive function. Additionally, impairments in divergent thinking may act as a predisposing factor for addiction. Further research is needed to understand and clarify the causal relationship between drug addiction and cognitive impairment through the exploration of vulnerable groups or the establishment of animal models. Finally, this study found neural pathways similar to those associated with relapse behavior (Li et al., Reference Li, Liu, Wang, Wang, Li, Chen, Zhu, Yan, Li, Li, Ye and Wang2018; Zhang & Volkow, Reference Zhang and Volkow2019). Confirming the link between impaired realistic divergent thinking and high relapse behavior in HUD is critical for improving long-term abstinence outcomes.
Conclusion
In conclusion, the study demonstrated the detrimental impact of HUD on divergent thinking, and such impairment persists despite sustained abstinence. A pathological compensatory mechanism and an imbalance in neural resource allocation were elucidated, highlighting issues in flexible and sustained control of goal-directed behavior in chronic heroin users. The study deepens our understanding of advanced high-order cognitive deficits induced by neurological damage in individuals with drug addiction. Moreover, the results offer reliable neural biomarkers for identifying emotional and insomnia symptoms, paving the way for non-invasive brain stimulation as a potential treatment for drug withdrawal and cognitive dysfunction in individuals with drug addiction.
Supplementary material
The supplementary material for this article can be found at http://doi.org/10.1017/S003329172610614X.
Data availability statement
The datasets generated and/or analyzed and codes during the current study are available from the corresponding author on reasonable request.
Author contribution
Conceptualization: Y.W. and H.D.; Data curation: Y.W., W.F. and W.L.; Formal analysis: Y.W., W.F. and W.L.; Funding acquisition: H.D.; Methodology: Y.W., W.F., W.L. and A.C.; Project administration: H.D.; Resources: C.Y. and H.D.; Supervision: H.D.; Validation: Y.L., K.Y. and A.C.; Visualization: Y.W.; Writing – original draft: Y.W.; Writing – review and editing: Y.W., Y.L., K.Y., C.Y., L.B., A.C. and H.D.
Funding statement
This study was supported by the National Natural Science Foundation of China grant (32471114), the Special Support Program for Innovation Teams Led by High-level SanQin Talents of Shaanxi Province, the Fundamental Research Funds for the Central Universities (GK202502005), the Research Program Fund for the Youth Innovation Team of Shaanxi Universities, the Advantage Education and Rehabilitation Programme for drug addiction from the Ministry of Justice (SFBJYJZXM2023-21-06).
Competing interests
The authors declare no competing interests.
Ethical standard
All participants provided informed consent, and monetary compensation was given upon completing the experiment. This study adhered to the ethical guidelines outlined in the Helsinki Declaration (World Medical Association, 2013) and received approval from the Ethics Committee (No. L20231117–02). All participants provided written informed consent to participate in this study.



 Open access

