In the nineteenth century, the East India Company and later, the British Crown introduced a new state system of education in British India.Footnote 1 Beginning in 1858 the Crown via British administrators controlled education policy up until 1919, when education was transferred to the control of Indian ministers at the province level.Footnote 2 Over this period, numerous acts were passed, various recommendations were made, and both public and private funds were used to expand and improve the public education system. However, the new system was unable to achieve mass literacy: there were fewer than three primary schools for every ten villages and less than 10 percent of the population was able to read and write by 1911.Footnote 3
Why was there so little primary education in British India? One immediate explanation points to low public spending. Public investments in human capital in British India were among the lowest in the world and lagged behind other colonies of the English Empire and even behind the Indian Princely States that were under indirect colonial control. Moreover, what spending there was tended to go to secondary schooling at a high rate relative to international standards, with less than 40 percent of public education expenditures targeted to primary education. This suggests a misallocation of resources, because rates of return in developing countries are generally believed to be higher for primary education than for secondary education.Footnote 4
Low and misguided spending were thus important factors that constrained the development of primary education. However, the aggregate patterns provide only a partial answer because they are unable to explain if and how local factors contributed to these patterns. Were the British solely responsible for the lack of progress or did local factors such as the level of diversity or elite preferences also impede the development of primary schooling? How did private spending fit into the overall picture? Who developed private schools? How did colonial policy respond to the local development of schools? This article uses a new historical data set on district-level availability of schools to analyze what happened to spending on primary education. The main goal is to supplement the qualitative historical literature by quantifying the factors that disrupted local school provision and thus hindered India's progress in expanding literacy.Footnote 5
A better understanding of British India's poor schooling record can help shed light on the subcontinent's changing economic fortunes because of the consequences literacy has for economic growth. In particular, Theodore Schultz argues that primary education is an important determinant of growth for a traditional agricultural economy because literate farmers are quicker to adopt superior inputs and engage in greater information sharing, which in turn leads to higher productivity.Footnote 6 Jean Drèze and Amartya Sen also emphasize the substantial social returns to primary education because greater literacy can promote public discourse, increase the accountability of elected leaders, and generally improve democratic governance.Footnote 7 Consequently, India's low level of education may have hobbled economic growth both before and after independence.
In this article, I show that the high degree of diversity in Indian society had important and deleterious consequences for the private provision of primary schools at the local level. Other things being equal, districts with higher levels of caste and religious diversity (as measured by a Herfindahl index) had fewer private aided and unaided primary schools as well as a smaller ratio of primary to secondary private schools. The negative association between diversity and education confirms the findings of numerous studies across a variety of contemporary settings, ranging from sub-Saharan Africa to U.S. cities and counties.Footnote 8
In the Indian context, the results highlight the challenges of providing primary education in more diverse populations. The presence of different castes and religions with often heterogeneous preferences probably increased the coordination costs of mobilizing private resources for primary schooling. Moreover, hierarchical divisions between Hindu castes worsened the collective action problems because caste norms often discouraged communal interactions between upper and lower castes. In fact, upper-caste elites successfully directed private, and to a smaller extent, public resources toward establishing secondary schools for their children. Districts with larger populations of Brahmans, the traditional elite caste of Hindus, had more public and private secondary schools as well as a smaller ratio of primary to secondary schools. Social discrimination, greater poverty, and the opportunity cost of child labor may have also reduced the demand for education among marginalized groups more generally as well as in more diverse districts.
Was British policy cognizant of the stultifying effects of diversity at the primary level? Clearly, the British were aware that upper castes were generally disinclined to provide primary schools for other groups within the society. One policy prescription was to directly provide public secondary schools in areas heavily populated by minorities with below average literacy such as lower castes, tribal groups, and Muslims. Unfortunately, these attempts were unsuccessful at improving educational outcomes largely because literacy depended on the availability of primary schools, not secondary schools. Local factors that disrupted the provision of primary schools thus had very serious consequences for India's limited progress in achieving basic literacy and efforts by provincial governments to override local decisions were largely ineffectual.
My article begins by briefly describing India's institutional history and discussing aggregate enrollment, expenditure, and literacy patterns. This overview suggests that colonial policy created an important role for private funding in the development of the public school system. The third section lays out a theoretical framework to explore how local factors affected the supply of district-level schools. The various hypotheses put forward in the third section are then tested using a new historical data set on 82 Indian districts, which is described in the fourth section. The empirical results are discussed in the fifth section.
INSTITUTIONAL HISTORY
Colonial Policies
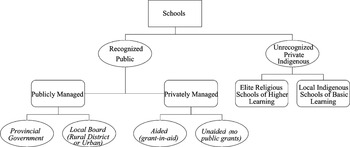
Over the course of the nineteenth century, the indigenous system of schooling in British India was replaced by the new state system of education developed by the East India Company till 1857 and was controlled by the British Crown from 1858 to 1919. Under the indigenous system, schools were of two types—elite religious schools geared toward students interested in a lifetime of higher learning and local elementary schools where village boys were introduced to the three Rs in the vernacular medium.Footnote 9 But without official patronage from the company, both elite schools and local indigenous schools declined over the nineteenth century.
Wood's Education Despatch of 1854, the first official document to present a national education policy, outlined the company's role in providing schooling in British India.Footnote 10 The despatch created an elaborate machinery of provincial education departments and established guidelines for the development of schools at the primary, secondary, and collegiate level. While earlier policies had promoted “a very high degree of education for a small number of natives”Footnote 11 in the English medium, the company now emphasized the importance of expanding vernacular primary education for the rural masses.Footnote 12 Given the high costs of building such a system, the despatch introduced public subsidies known as “grants-in-aid” to support schools under private management that came to be known as aided schools.Footnote 13 By encouraging grant-in-aids, the East India Company created an important role for private enterprise, and by the early twentieth century, public and private revenues contributed equally to total education spending.Footnote 14 Private revenues thus played a significant role in the expansion of the new school system.
Beginning in the 1860s, a new system of schooling emerged, which incorporated public schools managed by provincial governments and local boards (rural and urban) in addition to the privately managed schools, which could be aided or unaided. Figure 1 presents a breakdown of the different school types in this period. Provincial governments had direct control over provincial government schools, which focused on secondary education, although they did develop some high-quality primary schools. The provision of primary education was decentralized and left to local governments such as rural and urban municipal councils in the early 1880s. They directly managed board schools and provided grants to primary aided schools, although there was substantial heterogeneity across provinces in school systems, grant rules, and subsidy amounts. For example, Bombay focused on developing public board schools and public funds represented only 26 percent of total expenditures on aided primary schools in 1907. In Madras, the corresponding proportion was 52 percent and for Assam and Bengal, inclusive of Bihar and Orissa, it was 36 percent.Footnote 15 Because local boards were financed through public revenues, the British largely controlled these schools. However, upper-caste elites were disproportionately represented among the nonofficial board members of local councils and so in principle, they could influence public allocation decisions.Footnote 16
SCHOOLS BY MANAGEMENT

In comparison, aided schools received public subsidies or grant-in-aids but they were privately managed by Indians or missionaries. Although missionaries were an important private provider of education in the early nineteenth century, missionary activity declined over the second half of the nineteenth century due to lack of official support.Footnote 17 Consequently, Indians were largely responsible for the development of private aided schools in the late nineteenth and twentieth century. Although aided schools received partial public subsidies, the British had limited control over them because private individuals pooled the necessary resources, set up the school, applied for a grant-in-aid, and then managed the school. Some of the aided schools even functioned as unaided schools while they waited for public subsidies.
Unaided schools were purely private schools that did not receive public grants but were nonetheless classified under the public system because they were recognized by education departments, which allowed their students to take public examinations. Indians completely controlled these unaided schools as well as the small number of former indigenous schools that were unrecognized by official education departments.Footnote 18 Many of the indigenous schools disappeared over this period, some were successfully converted into recognized aided schools, and the rest were classified as private unrecognized schools because they were often religious and did not conform to official standards.Footnote 19
While the former indigenous system was in decline, there was a dramatic increase in the number of English language aided and unaided secondary schools and colleges beginning in the second half of the nineteenth century.Footnote 20 The increase was driven by a strong demand for these schools among educated Indian elites. British officials recognized that the growth of secondary education was outpacing primary education, and subsequent policy reports highlighted the need to increase mass primary schooling.Footnote 21 Local boards were encouraged to expand primary schooling by building new board schools or by offering public grants to aided schools. Various schemes were outlined to increase schooling among groups with below average literacy such as Muslims, tribal groups, lower castes, and women.Footnote 22 In addition, larger public revenues were targeted toward primary schooling in the early twentieth century despite the new focus on quality improvements and greater state control.Footnote 23 These positive measures notwithstanding, British officials largely resisted the idea of free primary education throughout this period and delayed the introduction of compulsory schooling laws till 1918.Footnote 24 Before the laws were enacted, education was transferred to the control of Indian ministers in provincial governments as part of the Montague-Chelmsford reforms of 1919, which marked the end of direct colonial responsibility toward education.
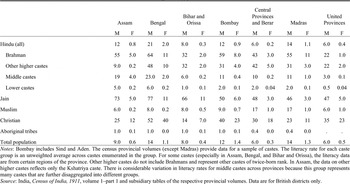
Despite the numerous policy recommendations, the goal of expanding mass education was largely unrealized over this period. Table 1 presents provincial literacy estimates, which starkly illustrate India's limited achievement in the field of basic primary education. Average literacy was 6 percent with substantial differences by gender and region
LITERACY BY PROVINCE IN 1911
(percentage)

Notes:
Bombay includes Sind and Aden. The census provincial volumes (except Madras) provide data for a sample of castes. The literacy rate for each caste group is an unweighted average across castes enumerated in the group. For some castes (especially in Assam, Bengal, and Bihar and Orissa), the literacy data are from certain regions of the province. Other higher castes do not include Brahmans and represent other castes of twice-born rank. In Assam, the data on other higher castes reflects only the kshatriya caste. There is considerable variation in literacy rates for middle castes across provinces because this group represents many castes that are further disaggregated into different groups.
Source:
India, Census of India, 1911, volume 1–part 1 and subsidiary tables of the respective provincial volumes. Data are for British districts only.
as well as across different social groups. Other than Christians, female literacy was almost nonexistent with one in 100 women recorded as literate on average. Christians and Jains were the most literate groups, but they represented less than 1 percent of the population, while literacy among Muslims, the dominant religious minority, generally lagged behind Hindus that represented 70 percent of the population. Literacy within Hindus largely mirrored the social hierarchy of the caste system despite substantial provincial heterogeneity in levels—male Brahman literacy ranged from 22 percent in United Provinces to 64 percent in Bengal, while lower-caste males had below average literacy that varied from 0.5 percent in United Provinces to 6 percent in Bengal.Footnote 25 Tribal groups were even more educationally backward than lower castes with literacy rates averaging less than 1 percent. Almost 60 years after the introduction of the new state system of education, only 6 percent of the population of British India could read and write.
Expenditures and Enrollment
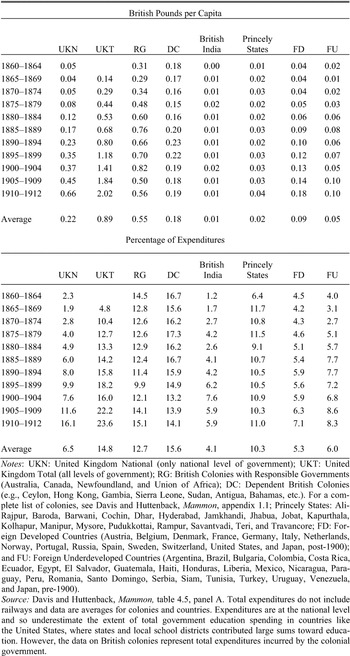
One immediate explanation for India's limited educational progress appears to be low absolute spending. Although the British created a new system of education, public investments on schooling were fairly low in British India relative to other colonies and states. According to the comparative data in table 2, spending on human capital in British India was among the lowest in the world.Footnote 26 Government expenditures per capita averaged less than 0.01 pounds in British India and were lower than average government spending in the Indian Princely States (0.02), in underdeveloped countries like Brazil and Mexico (0.05), and in other dependent British colonies (0.18). While spending on human capital increased in real terms across the world, government expenditures in
GOVERNMENT EXPENDITURES ON HUMAN CAPITAL

Notes:
UKN: United Kingdom National (only national level of government); UKT: United Kingdom Total (all levels of government); RG: British Colonies with Responsible Governments (Australia, Canada, Newfoundland, and Union of Africa); DC: Dependent British Colonies (e.g., Ceylon, Hong Kong, Gambia, Sierra Leone, Sudan, Antigua, Bahamas, etc.). For a complete list of colonies, see Davis and Huttenback, Mammon, appendix 1.1; Princely States: Ali-Rajpur, Baroda, Barwani, Cochin, Dhar, Hyderabad, Jamkhandi, Jhabua, Jobat, Kapurthala, Kolhapur, Manipur, Mysore, Pudukkottai, Rampur, Savantvadi, Teri, and Travancore; FD: Foreign Developed Countries (Austria, Belgium, Denmark, France, Germany, Italy, Netherlands, Norway, Portugal, Russia, Spain, Sweden, Switzerland, United States, and Japan, post-1900); and FU: Foreign Underdeveloped Countries (Argentina, Brazil, Bulgaria, Colombia, Costa Rica, Ecuador, Egypt, El Salvador, Guatemala, Haiti, Honduras, Liberia, Mexico, Nicaragua, Paraguay, Peru, Romania, Santo Domingo, Serbia, Siam, Tunisia, Turkey, Uruguay, Venezuela, and Japan, pre-1900).
Source:
Davis and Huttenback, Mammon, table 4.5, panel A. Total expenditures do not include railways and data are averages for colonies and countries. Expenditures are at the national level and so underestimate the extent of total government education spending in countries like the United States, where states and local school districts contributed large sums toward education. However, the data on British colonies represent total expenditures incurred by the colonial government.
British India stagnated at 0.01 pounds per capita, although it did increase as a proportion of the total budget (table 2). Education represented a smaller share of the total government budget in British India than in countries at comparable levels of development, such as the Indian Princely States and foreign underdeveloped countries (FU). Anecdotal evidence suggests that British officials were aware of low spending levels, but were reluctant to increase spending because of larger political economy concerns vis-à-vis the spread of mass education and its implications for British rule.Footnote 27
In addition to the low absolute levels on education as a whole, primary schools faced a second problem, for they received a relatively small share of public education funds. Expenditures on primary schools averaged only 34.3 percent of public education expenditures from 1891/92 to 1916/17.Footnote 28 The United States, by contrast, allocated more than 90 percent of public education expenditures to primary education from 1850 to 1890 and devoted larger public resources to secondary schooling only in the early twentieth century, when over 85 percent of the population was able to read and write. Similarly, the United Kingdom spent 73 percent of public education funds on primary schooling in 1890 and Japan 84 percent.Footnote 29 Historians have suggested that private demand for secondary education led Indian elites to lobby the colonial government against spending on primary vernacular education.Footnote 30
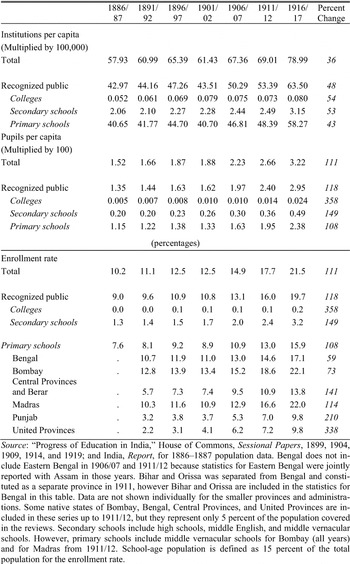
Aggregate enrollment patterns for the period 1886–1917 provide further evidence of India's limited achievement at the primary level, but relatively superior performance at the secondary level (table 3).Footnote 31 In a sense, secondary schools were an imperfect, but higher quality substitute for vernacular primary schools because they offered primary school classes. Although there was an increase in the number of schools and pupils from 1887 to 1917, only one out of every five children of school-age was enrolled as late as 1917. In fact, the number of primary schools and enrolled pupils actually declined from 1896/97 to 1901/02 before picking up in the early twentieth century, when larger public revenues were specifically allocated to primary education.
The enrollment rates are especially striking when placed in an international context. For example, in 1916/17 British India had a larger share of the population enrolled in secondary schools than either France or Japan and it was only marginally below England and Wales. The percentage of the population enrolled in secondary schools was 0.49 for India, 0.35 for Japan, 0.32 for France, and 0.62 for England. However, the Indian population enrolled in primary schools was 2.38—lower than Brazil (2.61), Russia (3.77), Sri Lanka (8.94), Japan (13.07), France (13.9), and England (16.5).Footnote 32 Furthermore, the differences are not entirely driven by differential demographic structures or enrollments in private schools. In 1900 the public primary school enrollment rate was 62.5 percent in France, 72 percent in the United Kingdom, 51 percent in Japan, and a mere 4.7 percent in British India. The gaps in enrollment rates were much smaller for public secondary schools: 1.1 percent in France, 0.7 percent in the United Kingdom, 1.3 percent in Japan, versus 0.9 percent in British India.Footnote 33 Secondary school enrollment in British India was thus comparable to that in developed countries, while primary education was far below average.
SCHOOLS AND ENROLLMENT

Source:
“Progress of Education in India,” House of Commons, Sessional Papers, 1899, 1904, 1909, 1914, and 1919; and India, Report, for 1886–1887 population data. Bengal does not include Eastern Bengal in 1906/07 and 1911/12 because statistics for Eastern Bengal were jointly reported with Assam in those years. Bihar and Orissa was separated from Bengal and constituted as a separate province in 1911, however Bihar and Orissa are included in the statistics for Bengal in this table. Data are not shown individually for the smaller provinces and administrations. Some native states of Bombay, Bengal, Central Provinces, and United Provinces are included in these series up to 1911/12, but they represent only 5 percent of the population covered in the reviews. Secondary schools include high schools, middle English, and middle vernacular schools. However, primary schools include middle vernacular schools for Bombay (all years) and for Madras from 1911/12. School-age population is defined as 15 percent of the total population for the enrollment rate.
One might believe that these differential enrollment patterns were driven by higher returns to secondary education in British India. Although private returns to secondary education may have been high in the nineteenth century due to the availability of jobs as government clerks and inspectors, anecdotal evidence suggests that returns were lower in the early twentieth century because of high unemployment among college graduates.Footnote 34 Data limitations prevent a calculation of private or social rates of return to education in the colonial period, but estimates of private and social returns for the decades following Indian independence indicate that returns to primary education were generally higher than to secondary education.Footnote 35 Given British India's low level of literacy and economic development, one would imagine that private and social returns to primary education were probably even higher in the colonial period.Footnote 36 Theoretical arguments by Schultz and Drèze and Sen for the Indian context further support this conjecture because they argue that social rates of return are very high for primary education. The relatively low public investments on primary education thus suggest an important misallocation of resources in this period.
This discussion broadly highlights that low and perhaps, misguided spending impeded the development of education. But, what factors were responsible for these aggregate patterns? Were public schools located in areas of short supply or high demand? Given private revenues were responsible for 50 percent of education spending, what was the distribution of private schools across local districts? Did the presence of numerous social groups affect the development of private schools? To answer these questions, we need to look further than just the national patterns and make use of microdata on the provision of schools.
THEORETICAL FRAMEWORK
The issue is how preferences for schooling may have interacted with the rules laid down by the British to determine the distribution of different school types across Indian districts.Footnote 37 The second section suggests that colonial preferences were the dominant factor in the development of provincial government and local board schools, although Indian elites in principle may have captured part of the policymaking process. However, preferences among different Indian social groups as well as local demand side factors were probably critical in accounting for the variation in privately managed aided and unaided schools across districts.
The literacy patterns from table 1 suggest that there was substantial heterogeneity in the demand for education across different social groups, perhaps due to varying rates of return and opportunity costs of schooling. Different castes and religions had different preferences for schooling, with Brahmans, the traditional elite caste of Hindus, likely preferring secondary schools with attached primary classes given their traditional occupation as priests and teachers as well their disproportionate representation among more literate occupations of the colonial period. Hence, we would expect Brahmans to be positively correlated with secondary schools. However, it is an empirical question as to whether elites relied on private revenues to develop their schools or whether they used political influence with provincial governments and local boards to divert public funds to districts heavily populated by them.
It is unclear a priori how the population shares of disadvantaged groups like the lower castes and tribes relate to school provision. Although these groups may have had a low demand for education due to poverty and the opportunity cost of child labor, colonial policy and missionaries played an active role in developing schools for them. Public schools managed by provincial governments or local boards thus may be positively correlated with disadvantaged groups. Moreover, privately managed aided and unaided schools may also be positively correlated with the size of these groups since missionaries were an important private provider of education for minorities. Official publications suggest that Muslims in this period preferred indigenous religious schools, so we would expect their population share to be positively associated with private schools and negatively associated with public schools. However, colonial policy encouraged provincial governments to provide schools for groups with below average literacy such as Muslims. If this policy was followed, we could expect Muslim population share to be positively correlated with provincial government schools.
The emerging ethnic fragmentation literature suggests that the high level of diversity among the numerous castes and religions of India may have negatively influenced the provision of education because more ethnically diverse populations are less successful in providing local services such as schooling.Footnote 38 Heterogeneous preferences between different Hindu castes and religions may have raised the costs of mobilizing necessary resources to establish schools in more diverse districts. Moreover, individual groups may have been more likely to support schooling when they were the direct beneficiaries, which would lead to underprovision of schools in more heterogeneous districts since the perceived benefits would be shared across multiple groups.Footnote 39 To test the impact of diversity on public and private provision of schools, the empirical analysis includes a Herfindahl-based caste and religious fragmentation index as a measure of diversity.
Besides social structures, different occupational groups may also have divergent preferences for schooling. Districts supported by larger populations of doctors, teachers, and lawyers (whom we will call professionals) may be more likely to promote and develop schools, while areas with larger agricultural populations may have placed a lower premium on education, particularly secondary schooling. In order to capture these effects, the analysis includes the share of the district population supported by agriculture, industry, commerce, and professional employment. In addition, wealthier districts may have stronger preferences for schools as well as the necessary resources to construct and operate private schools. Since there are no data on median district income or wealth, I use income tax collections as a proxy for income. Income taxes were generally collected from government employees and other workers who were part of the formal sector of the economy. They were collected from a small share of the population and thus reflect the upper tail of the formal income distribution.
Additional levies on land were an important fiscal constraint on rural boards and so we would expect the availability of land taxes to heavily influence the provision of board schools, particularly at the primary level.Footnote 40 Land tax revenues were based on the British assessments and so may capture, albeit very imperfectly, district income as well.Footnote 41 They could thus also represent an income effect on the provision of privately managed aided and unaided schools.
Given the tremendous heterogeneity across Indian provinces, the empirical analysis includes province fixed effects to capture time-invariant provincial characteristics including policies set at the national or province level. While province fixed effects absorb the variation across provinces in school systems and policies, they also control for differences in geography, caste structures, design of local boards, and other unobservable characteristics across provinces. These factors are likely to be correlated with schools and would bias the coefficients on the independent variables. Thus, including province fixed effects reduces potential concerns of omitted variables and allows for a cleaner interpretation of the explanatory variables.
DATA
For the empirical analysis, I assembled a new district-level data set for 82 districts, which links data from Indian district gazetteers to colonial censuses in 1901 and 1911. Although district gazetteers provide some statistics for the late nineteenth century, they are generally incomplete. Therefore, I begin the analysis in 1901 when uniform statistics are available for all districts in the sample. Moreover, I restrict the panel to the 1901 and 1911 cross sections to maintain consistency with the decennial censuses.
The district gazetteers are a unique source of schooling data for the colonial period.Footnote 42 Each district series has two parts, a and b: part a describes the history, geography, culture, administration, and economic situation of the district, while part b provides statistical tables to complement the discussion in part a. Although the tables contain data on a wide variety of district-level variables, they do have some shortcomings. First, detailed education data on different school types are only available for a subset of districts in Bengal, Bihar and Orissa, Bombay, and Madras provinces. Second, enrollment and, particularly expenditure data, are generally incomplete and not reported at the same level of detail as number of schools.Footnote 43 Despite these limitations, the data on number of schools is fairly complete, though in some instances detailed school data are unavailable for the 1901 and 1911 cross sections. For these cases, the analysis uses the nearest available year of school data.Footnote 44 Since there was some provincial heterogeneity in the reporting of school levels over time, I aggregated schools into primary and secondary using official classifications reported in the “Progress of Education,” House of Commons, Sessional Papers.Footnote 45 The econometric analysis focuses on schools as the outcome variable with the sample restricted to districts in Bengal, Bihar and Orissa, Bombay, and Madras with relatively complete data.Footnote 46 In addition to schooling variables, I also extracted data on income tax and land tax revenues from the gazetteers.
Using data from the colonial censuses, I constructed population, demographic, and occupational variables at the district level.Footnote 47 Because of concerns about the accuracy of finer occupational categories in the censuses, I constructed broad occupational types—agriculture, commerce, industry, and professions—to minimize measurement error. The 1901 census has province-level social precedence tables, which indicate specific castes enumerated as high and low based on local opinion. I used these tables to construct the population share of Brahmans and lower castes in 1901 and 1911.Footnote 48 Unfortunately, the 1911 Madras census only reports district-level data for a subset of castes, and therefore the 1911 caste variables for Madras are the same as 1901.Footnote 49 However, the econometric analysis clusters the standard errors to account for potential nonindependence of errors within districts.
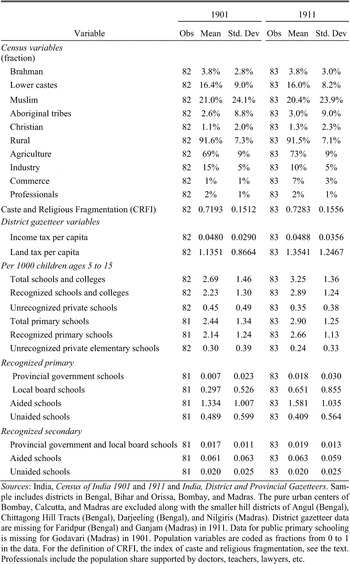
Finally, I used the colonial caste censuses to construct the caste and religious fragmentation index (CRFI), which is defined as CRFI = 1 –σsi 2, where si is the population share of each caste or religious group.Footnote 50 Following Abhijit Banerjee and Rohini Somanathan, the index includes Hindu castes with population shares greater than 1 percent of the province population, Muslims, Christians, tribes, Buddhists, Sikhs, Jains, and Others as individual groups.Footnote 51 The “Others” group aggregates the small number of Parsis along with Hindu castes that were less than 1 percent of the province population into a single group. The CRFI treats individual caste and religious groups as internally homogeneous and can be interpreted as the probability that two randomly drawn individuals from a district belong to different castes or religions. Table 4 presents summary statistics of the variables by year. Brahmans, the traditional elite caste, averaged less than 4 percent of the district population, while the lower castes accounted for 16 percent. The mean CRFI was quite high and indicates that the probability of selecting two random people in a district of different castes or religions was 72 percent. Many of the population and demographic variables were fairly stable from 1901 to 1911, while the number of public primary schools increased over the decade.
RESULTS
For the econometric analysis, I estimated the following reduced form equation with the number of schools per 1000 children of ages 5 to 15 as the dependent variable, Y.Footnote 52

Here i represents the district, p represents the province, and t represents the year—1901 or 1911. As mentioned earlier, I clustered the standard errors to account for potential nonindependence of errors with in districts. Share Religion includes the population share of the main religious groups, namely Muslims, Christians, and tribes. X includes a set of controls to capture district-level development, income, and occupational structures. λt is a dummy for the 1911 cross section and controls for temporal patterns that uniformly affect all districts, δp are province dummies to capture time-invariant province characteristics, and εipt is the district-specific error term.Footnote 53
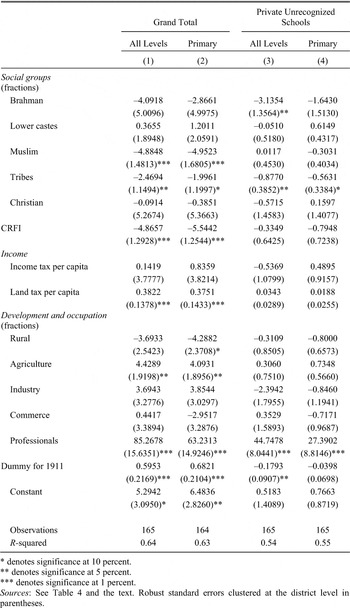
Table 5 presents the first set of results separately for total educational institutions and private unrecognized indigenous schools that were often religious in nature. The main findings suggest that districts with a higher degree of caste and religious diversity had fewer total schools and in particular, fewer primary schools. Within the sample context, the coefficients indicate that when CRFI increases by one standard deviation (from a mean of 0.72 to 0.87), total schools decrease by 0.74—a decrease of almost 25 percent in the mean number of schools. The effect is largely driven by primary schools, where a one-standard-deviation increase in CRFI decreases the average number of primary schools by almost 32 percent. There does not appear to be any statistically significant impact of diversity on private unrecognized schools at the aggregate or primary level, which suggests that local diversity was a more critical problem for the provision of recognized schools that emerged under the new state system of education.
In addition, the findings from table 5 also provide quantitative support for some of the aggregate literacy patterns observed in table 1. Minority groups such as Muslims and tribal groups are negatively associated with primary schools, suggesting that the unavailability of schools either due to demand or supply constraints can account for their low levels of literacy. By contrast, the strong negative correlation between Brahmans and private unrecognized schools suggests that the
SUMMARY STATISTICS

Sources:
India, Census of India 1901 and 1911 and India, district and provincial gazetteers. Sample includes districts in Bengal, Bihar and Orissa, Bombay, and Madras. The pure urban centers of Bombay, Calcutta, and Madras are excluded along with the smaller hill districts of Angul (Bengal), Chittagong Hill Tracts (Bengal), Darjeeling (Bengal), and Nilgiris (Madras). District gazetteer data are missing for Faridpur (Bengal) and Ganjam (Madras) in 1911. Data for public primary schooling is missing for Godavari (Madras) in 1901. Population variables are coded as fractions from 0 to 1 in the data. For the definition of CRFI, the index of caste and religious fragmentation, see the text. Professionals include the population share supported by doctors, teachers, lawyers, etc.
DEPENDENT VARIABLE

* denotes significance at 10 percent.
** denotes significance at 5 percent.
*** denotes significance at 1 percent.
Sources:
See table 4 and the text. Robust standard errors clustered at the district level in parentheses.
relatively high level of literacy among Brahmans was not due to the provision of private unrecognized schools. In fact, this pattern confirms qualitative evidence by historians that Brahmans and other upper-caste elites largely abandoned the former indigenous system of schooling over this period.
The development controls indicate that school availability was sensitive to demand side factors such as the rural population and the number of professionals in the district. Fraction professional has a substantially large positive effect on all types of schools with the coefficient indicating that a one-standard-deviation increase (from a mean of 1.6 percent to 2.4 percent) in professionals is associated with a 23 percent increase in the average number of total schools. Although fraction agriculture is positively correlated with total number of schools, this effect is relative to workers in domestic occupations and unskilled nonagricultural workers who represent the omitted occupational group. Lower castes and marginalized populations more generally accounted for a disproportionate share of these workers and their low level of education accounts for the positive sign on the aggregate agriculture category.Footnote 54 Taken together, these findings suggest that local factors were critical to the provision of primary schools in the colonial period. But it is unclear whether the effects are due to colonial policy or to local conflicts among Indians. Did colonial policy or lack of private Indian development lead to fewer primary schools in more diverse districts? Did colonial policy defer to or override local interests?
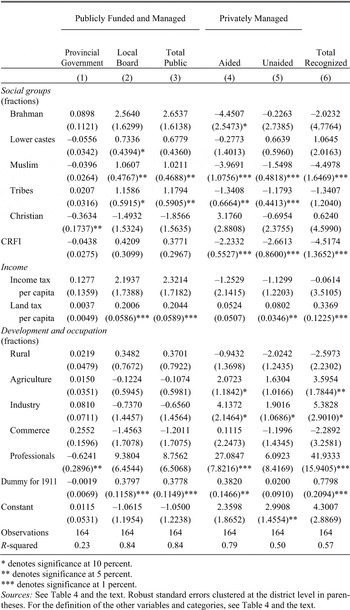
To answer these questions, table 6 focuses on the different types of recognized primary schools that developed over the nineteenth century, namely provincial government, local board, and private aided and private unaided schools. I have also created an additional category of total public schools, which is the sum of provincial government and local board schools. There were very few provincial government primary schools, and regression 1 in table 6 indicates that they were largely in- sensitive to local conditions. Local factors were an important determinant, however, of publicly funded and managed board schools, which
DEPENDENT VARIABLE

* denotes significance at 10 percent.
** denotes significance at 5 percent.
*** denotes significance at 1 percent.
Sources:
compromised 14 percent of recognized primary schools in 1901 and 25 percent in 1911.Footnote 55 Board schools are positively associated with land taxes, which were an important source of revenues for rural boards. The coefficient indicates that a 50 percent increase in average land taxes corresponds to a 26 percent increase in board schools. Public funds did therefore translate into more public schools, which suggest that low absolute public spending by the British did restrict the number of primary schools. Besides fiscal constraints, colonial policy appears to have developed schools in regions populated by minorities such as lower castes, tribal groups, and Muslims, in contrast to areas with high private demand, such as districts with many professionals or Brahmans. Upper castes were thus unable to override official policy concerns, at least at the local level, despite their unequal political representation on the district boards.
Aided primary schools numerically represent the largest category of recognized schools, and regression 3 in table 6 highlights that local heterogeneity significantly affected the ability of diverse districts to provide aided schools—a one-standard-deviation increase in CRFI is associated with a 23 percent decrease in the average number of aided schools. Although these schools received public grants of varying amounts, they were developed and managed by Indians privately. In some cases, they had even functioned for sometime as unaided schools before applying for a grant. This suggests that colonial policies were not responsible for fewer aided primary schools in more diverse districts because these schools could function without public grants. The effects of fragmentation observed in table 6 are thus reflective of local conflicts between different social groups. Heterogeneous preferences for school location, medium of instruction, and curriculum among different castes and religions probably undermined the collective ability of more diverse districts to mobilize the necessary resources, apply for public grants, and effectively manage aided schools. In addition to heterogeneous preferences, individual groups may have also been reluctant to provide money for schools unless their children were direct beneficiaries. While this emphasizes the role of nonhierarchical divisions within Indian society, the hierarchical structure of the Hindu caste system probably aggravated these problems. Upper-caste elites were more likely to establish schools and they may have been reluctant to develop primary schools for marginalized groups such as the lower castes due to caste norms that often prohibited interactions between groups.Footnote 56
The strong negative association between fragmentation and private unaided primary schools provides further evidence of the severity of collective active problems across heterogeneous Indian districts (table 6, regression 5). Given the importance of private funding for both aided and unaided schools, problems of coordination similar to those for aided schools probably plagued the development of unaided schools as well. While these interpretations stress supply-side constraints, low demand for education among minority populations may have also contributed to fewer privately managed schools in more diverse districts. British officials and contemporary historians alike have emphasized that lower caste populations had low demand for education because of poverty, discrimination, and higher opportunity costs due to the importance of child labor for rural agricultural households.Footnote 57 Although fraction lower castes is statistically insignificant for aided and unaided schools, CRFI is positively correlated with fraction lower castes in many provinces, which suggests that low demand may partially account for the observed negative relationship.
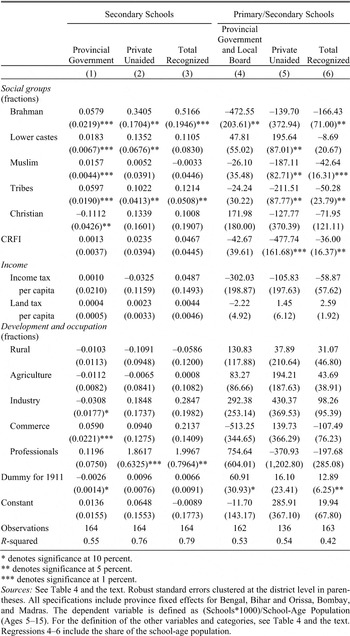
The findings thus far suggest that although low public spending was an obvious constraint on primary education, local coordination problems among different caste and religious groups were equally deleterious for private primary school funding. Another important factor limiting the expansion of primary education was the undue emphasis on secondary education. Table 7 analyzes secondary schools and the results illustrate that Indian elites successfully allocated public and private resources toward secondary schooling.Footnote 58 Districts with larger Brahman populations had more high-quality provincial government schools (table 7, regression 1), which suggests that upper castes may have captured the policymaking process at the secondary level to an extent. The
PRIMARY VERSUS SECONDARY SCHOOLS MISALLOCATION OF RESOURCES?

* denotes significance at 10 percent.
** denotes significance at 5 percent.
*** denotes significance at 1 percent.
Sources:
See Table 4 and the text. Robust standard errors clustered at the district level in parentheses. All specifications include province fixed effects for Bengal, Bihar and Orissa, Bombay, and Madras. The dependent variable is defined as (Schools*1000)/School-Age Population (Ages 5–15). For the definition of the other variables and categories, see Table 4 and the text. Regressions 4–6 include the share of the school-age population.
effects are both economically and statistically significant—a one-standard-deviation increase in fraction Brahman leads to a 31 percent increase in the average number of provincial government schools. Brahmans thus had more state-supported schools and also privately developed unaided schools.Footnote 59 The strong positive associations between Brahmans and secondary schools support the qualitative evidence that Indian elites were a significant force in the development of secondary education.
Although the availability of provincial government schools is strongly correlated with fraction Brahmans, elite groups did not completely capture the colonial policymaking process because provincial governments also created secondary schools in districts with larger populations of minorities such as lower castes, tribal groups, and Muslims that had below average literacy. Furthermore, these effects are economically significant as well—a 10 percent increase in the population share of Muslims increases the average number of provincial government schools by almost 6 percent. British officials knew that elites were unlikely to develop primary schools for marginalized groups, and official reports often allude to elite preferences for secondary schools and their general reluctance to support primary schooling.Footnote 60 By developing provincial government schools in both, districts with upper caste and minority populations, British officials were partially catering to the preferences of Indian elites, while also providing secondary schools for groups with relatively low educational backgrounds. The latter policy may have been an attempt to circumvent the detrimental effects of local diversity on the private provision of schools.
Regressions 4 through 6 in table 7 focus on the ratio of primary to secondary schools. I present the results separately for publicly financed and controlled schools (provincial government and local board schools), for private unaided schools, and for total schools. Brahmans are negatively correlated with the ratio of total primary to secondary schools (regression 6), which is largely driven by pure public schools (regression 4). This strong negative association provides additional evidence that elites preferred secondary schools as compared to vernacular primary schools. In addition to the findings on Brahmans, the CRFI coefficient is also negative and both economically and statistically significant for private unaided schools—a 10 percent increase in the mean value of CRFI decreases the average ratio of primary to secondary schools by almost 60 percent. This suggests that greater fragmentation cut private spending, which was likely given the potentially large social returns to primary education. The misguided allocation of resources is also apparent in the findings on minority groups such as Muslims and tribal populations. Both groups are negatively correlated with the ratio of primary to secondary unaided schools, which is largely driven by fewer unaided primary schools. Low demand was perhaps a significant factor in accounting for the inability of these groups to provide primary schools privately.
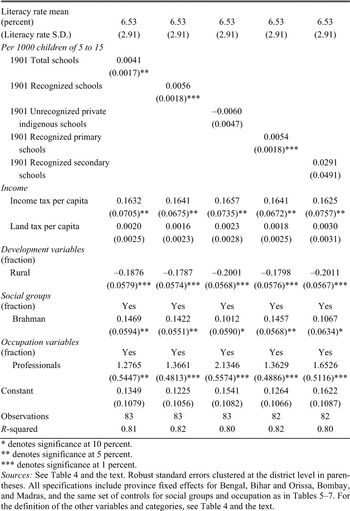
Table 8 broadly illustrates the importance of schools (or educational inputs) for literacy and highlights that the limited availability of primary schools had serious consequences for basic Indian educational development. Along with the standard set of district controls, these specifications include the number of schools per 1000 of school-age population. Due to concerns of reverse causality, I use 1901 data on schools versus the contemporaneous number of schools. Other things being equal, the supply of schooling was correlated with subsequent literacy. The large positive coefficient on total schools is due to the positive effect of recognized schools as compared to the unrecognized former indigenous schools. Moreover, recognized primary schools were the most relevant type of school for achieving greater literacy in this period—a one-standard-deviation increase in the number of recognized primary schools in 1901 is associated with an almost 11 percent increase in average 1911 literacy after we control for other economic and social differences across districts. The statistically insignificant effect of secondary schools confirms that colonial policies of providing secondary schools for minorities were largely ineffectual for literacy. A tighter focus on providing only primary schooling would have conferred larger social benefits to the society. Moreover, local factors such as greater
IMPACT OF SCHOOL AVAILABILITY ON LITERACY

* denotes significance at 10 percent.
** denotes significance at 5 percent.
*** denotes significance at 1 percent.
Sources:
See table 4 and the text. Robust standard errors clustered at the district level in parentheses. All specifications include province fixed effects for Bengal, Bihar and Orissa, Bombay, and Madras, and the same set of controls for social groups and occupation as in Tables 5–7. For the definition of the other variables and categories, see Table 4 and the text.
fragmentation that disrupted primary school provision had very important and negative consequences for the extension of basic literacy. Thus, the inability of more diverse districts to provide the right kind of schools (i.e., primary schools) was an important factor in accounting for the lackof educational progress in British India.
CONCLUSION
This article studies the provision of schooling in British India when education was under the direct authority of the British Crown. The analysis combines qualitative data from primary and secondary sources with previously underutilized quantitative data from the Indian district gazetteers and colonial censuses. Although colonial policy made numerous recommendations to develop mass primary schooling, public human capital expenditures in British India lagged behind colonies in the dependent British Empire and the Indian Princely States. Human capital expenditures in British India averaged 0.01 pounds per capita from 1860 to 1912 and represented a mere 4 percent of the total budget. Expenditures on primary education averaged 34 percent of public education expenditures as compared to other countries, where public investments in primary schooling exceeded at least half the education budget. The low level of funding was thus an important constraint on educational development in British India.
The econometric analysis identifies additional constraints beyond the limited availability of public resources. Private revenues were an important source of income for the expansion of the new educational system, but social heterogeneity in the population reduced the private provision of primary schools. There was an undue private emphasis on secondary education, and the ratio of primary to secondary schools was negatively correlated with caste and religious fragmentation and the population share of Brahmans.
The findings thus suggest that local problems of collective action diminished the supply of private primary schools. Heterogeneous preferences across different caste and religious groups affected the collective ability of more diverse districts to establish privately managed schools. Moreover, hierarchical differences between castes worsened the coordination problems, because upper-caste elites, such as Brahmans, favored secondary schools for their children and disregarded the potential spillovers from providing mass primary education. Despite potentially high returns to primary education, fragmentation across British Indian districts contributed to low and misguided spending by favoring secondary schools over primary schools. Given the strong association between the availability of primary schools and subsequent literacy, the underprovision of primary schools kept literacy low.