The US Senate is an unusual institution. It is among the most malapportioned legislative bodies in the world, yet it has extensive legislative powers (Matthews Reference Matthews, Campbell and Rae2001). For more than a century, political scientists have raised concerns about the effect of equal state representation in the US Senate (Dahl Reference Dahl1956; Lee and Oppenheimer Reference Lee and Oppenheimer1999; Moffett Reference Moffett1895; Woody Reference Woody1926). Studies have found that US Senate malapportionment affects campaigns, strategic calculations, partisan composition, and funding distribution (Lee Reference Lee2004; Lee and Oppenheimer Reference Lee and Oppenheimer1997). Other studies found that equal state representation underrepresents ideological liberals (Griffin Reference Griffin2006), biases outcomes in favor of rural and suburban areas over cities (Stephens Reference Stephens1996), and underrepresents ethnic and racial minorities (Baker and Dinkin Reference Baker and Dinkin1997; Griffin Reference Griffin2006; Malhotra and Raso Reference Malhotra and Raso2007).
Although these studies provide evidence that equal state representation has policy implications, a systematic analysis of the outcome of actual Senate votes on a wide range of topics still is needed. Such an effort was first undertaken by McCrone (Reference McCrone1990), who reconstructed the Senate based on a 100-seat institution with each state having at least one senator and the remainder of the seats divided by population. He then analyzed key votes during the Reagan administration and compared them to the outcomes that his reapportioned Senate would have produced. This “ingenious way to grasp the magnitude of Senate misrepresentation” produced “striking results” (Matthews Reference Matthews, Campbell and Rae2001, 168). In the first two years of Ronald Reagan’s presidency, 13 of 30 key votes—as determined by Congressional Quarterly (CQ)—would have been reversed in a Senate even modestly reapportioned to capture population size.
Given the voluminous recent research on asymmetries between the preferences of the American electorate and policy outcomes—as well as growing partisan polarization and legislative gridlock (Bartels Reference Bartels2008; Gilens and Page Reference Gilens and Page2014; Hacker and Pierson Reference Hacker and Pierson2010; Mann and Ornstein Reference Mann and Ornstein2013)—we believe that a new assessment of the type that McCrone (Reference McCrone1990) conducted is a timely and vital addition to the American politics literature. This current study describes an alternative method for calculating Senate representation, based on McCrone (Reference McCrone1990), which maintains the 100-member Senate, provides each state with at least one senator, and then reapportions the remaining number based on population using the method employed by the US House of Representatives (i.e., the Hill divisor method) to calculate the “weight” of the votes cast by actual senators.
We then assessed the policy implications of equal representation in the US Senate by recalculating Senate votes during a 58-year period: all 804 CQ key votes between 1961 and 2019 (Johnson and Miller Reference Johnson and Miller2022). We examined shifts in vote outcomes by presidential administration, presidential position, and issue type. To our knowledge, no other research has specifically reviewed key votes on major policy, presidential nominations, and veto overrides across the span of issues or length of time that our study did. We conclude that the outcomes of some highly consequential votes would have appeared very different were it not for equal state representation in the US Senate.
More strikingly, policy shifts are not distributed evenly across ideology or with respect to issue salience. Our research shows that conservative policy preferences have been the distinct winners of equal state representation during a lengthy period, particularly the past three decades, and that issues of high salience—including gun control, immigration, abortion, and social welfare—are among the issues most likely affected.
REAPPORTIONING THE US SENATE
We followed the only politically plausible alternative for allocating seats in the US Senate that the Framers of the Constitution could have—and, in fact, did—propose, which is the method for apportioning members of the US House of Representatives. That is, each state is guaranteed at least one seat, and seats then are allocated on the basis of population (McCrone Reference McCrone1990). A distinctive feature of the US Senate, relative to the US House of Representatives, is its small size. Thus, we retained the 100-seat Senate. The remaining 50 seats were allocated using the Hill divisor method, which is used to calculate seats in the House.
Assessing the impact of any reapportionment scheme is difficult because altering such representation clearly would have consequences for political behavior throughout the entire political system. We obviously cannot speculate about—much less account for—all of these consequences. Nevertheless, for three reasons, we are confident that our approach offers a valid assessment of the potential impact of Senate malapportionment. First, our weighting scheme is conservative in that we allocated one senator to each state before we weighted the votes. Under this scheme, 10 states would retain the equivalent of two senators, 29 states would decrease from two to the equivalent of one senator, leaving only 11 states where the change would be substantial. Moreover, the 21 smallest states (each with 1% or less of the US population) are home to only 11.3% of the population; however, our method of allocating at least one senator to each state gives them 21 senators. Thus, our method preserves the disproportionate influence of small states on Senate roll-call votes but to a smaller degree than present.Footnote 1
Second, the large number of roll-call votes (804) and the lengthy period under consideration (1961–2019) provided substantial variation so as to capture shifting partisan preferences, which—on the whole—gave us some idea of the partisan “lay of the land” in our reapportioned Senate.
Third, and crucially, one of the motivations for our research was that the emphasis placed on the role of individual political actors often comes at the expense of crucial institutional structures. We agree that individual and group strategic decision making—in the form of leadership, caucusing, and bipartisan negotiating—is crucial to understanding vote outcomes in the Senate. However, we believe that insufficient attention has been given to the impact of the fundamental structure of the US Senate on outcomes.
SOCIAL AND ECONOMIC CORRELATES
Our analysis begins by expanding on previous findings about the social and economic characteristics of the states. The online appendix lists the 50 states by population, grouped by size, and their weighted voting strength based on our reapportionment method using the 2010 US Census. The largest nine states, which account for 51.0% of the US population, would gain the equivalent of 27 Senate seats. The smallest 26 states, which currently have slightly more than half of the seats in the Senate (52), would lose 26 seats. The change in representation for middle-sized states would be minimal (–1).
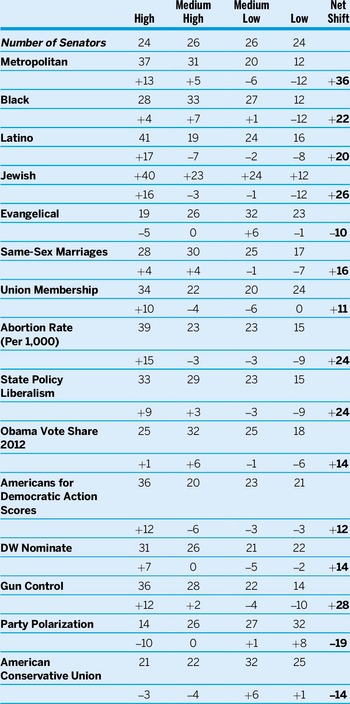
We then arrayed states into quartiles from high to low population and calculated how many seats each quartile would gain or lose according to various states’ social and economic characteristics. We also indicated the net shift at the median. Table 1 compares the degree of representation of traditional demographic and political categories based on the current equal representation and our reapportioned system.Footnote 2
Demographic and Political Shifts from Equal to Proportional Representation, by State Population Quartiles (2010 US Census)

Space does not permit a lengthy discussion; however, the shifts in virtually all cases were substantial. In particular, net shifts to states with higher percentages of Blacks and Latinos, metropolitan areas, union membership, and support for gun control were striking. The racial implications were particularly stark. Three quarters of the US Latino population (75.4%) and almost two thirds of Black Americans (64.3%) live in the 12 most populated states. The 25 least populous states are 71.5% white, well above the 60.1% national average. The population distribution of African Americans and Hispanics means that a winning Senate coalition can be constructed without needing to secure the support of any of the states that have sizeable Latino or Black populations. Whereas the Senate represents “the minority” in one sense (i.e., those living in overwhelmingly white, rural states), it vastly underrepresents two underserved minority groups (i.e., Blacks and Hispanics), who tend to live in high-population states.
…a winning Senate coalition can be constructed without needing to secure the support of any of the states that have sizeable Latino or Black populations.
KEY VOTES IN THE US SENATE, 1961–2019
Although the demographic analysis provides a strong prima facie case that equal state representation has important policy consequences, reapportionment weighting alone cannot determine the magnitude of such impact or whether reapportionment would matter more for some types of issues than others. To explore these questions, we applied our reapportioned weighted-voting scheme to the US Senate for every year since 1961 (i.e., the first full session of Congress with all 50 states in the Union). We used the relevant decennial US Census to calculate the equivalent number of senators that each state would receive under our reapportionment plan. For example, for the 89th Congress (1965–1966), we used state population data from the 1960 US Census.
We used the CQ key votes because of their salience and importance to that year’s political cycle and because they also identify key amendments, procedural votes, conference votes, votes on executive and judicial confirmations, and treaty ratifications. The CQ key votes are not a representative sample of all Senate votes, many of which pass with large majorities and absent any controversy. However, we believe our focus on these votes is merited because they are on the most controversial, highly contested policy subjects that bear substantial implications for the lives of ordinary Americans. The fate of these votes reveals more about the substantive consequences of equal state representation than if we analyzed uncontroversial procedural motions, continuing resolutions, and post office christenings.
Against each vote cast by individual senators, we used the multiplier of N/2, for which N is the number of senators that a state is allocated under our reapportionment model. For example, in the 111th Congress (2009–2010), Pennsylvania would be weighted the equivalent of four senators under our reapportionment. Therefore, each vote cast by Arlen Spector and by Bob Casey was multiplied by two to arrive at our new reapportioned vote outcomes. We then calculated the swing in “aye” votes from equal representation to reapportionment for each CQ vote in our dataset. (See the online appendix for more details about these calculations.)
To determine whether an outcome would have changed, we were sensitive to different thresholds for passage. When the President’s preference was known, we factored in the Vice President’s tie-breaking vote. For treaties and presidential nominations, we applied a higher threshold for passage. When the filibuster was involved, we applied the cloture threshold. Admittedly, it is possible that under a reapportioned Senate, the filibuster might be applied to more votes. However, if this counterfactual is correct, then it only further underscores the disproportionate policy influence held by the minority of Americans in low-population states.
FINDINGS
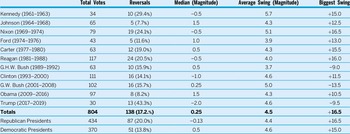
Table 2 illustrates total CQ key votes, reversals, and average swing in votes by presidential administration. Since the Kennedy administration, equal representation (as analyzed in this current study) was decisive in the outcome in 138 key Senate votes of 804 (17.2%). That is, after applying our reapportionment scheme to the Senate, the results of 138 roll-call votes would have been reversed (i.e., pass to fail or fail to pass). There was a slightly higher proportion of “fail to pass” (20.4%, N = 62/304) than “pass to fail” (15.2%, N = 76/500). We have greater confidence that equal state representation was decisive in these latter cases because a reapportioned Senate might generate systematic changes in the usage of the filibuster, and “fail to pass” votes might not have been subject to a simple majority vote.
Congressional Quarterly Key Votes, Reversals, and Swings by Presidential Administration
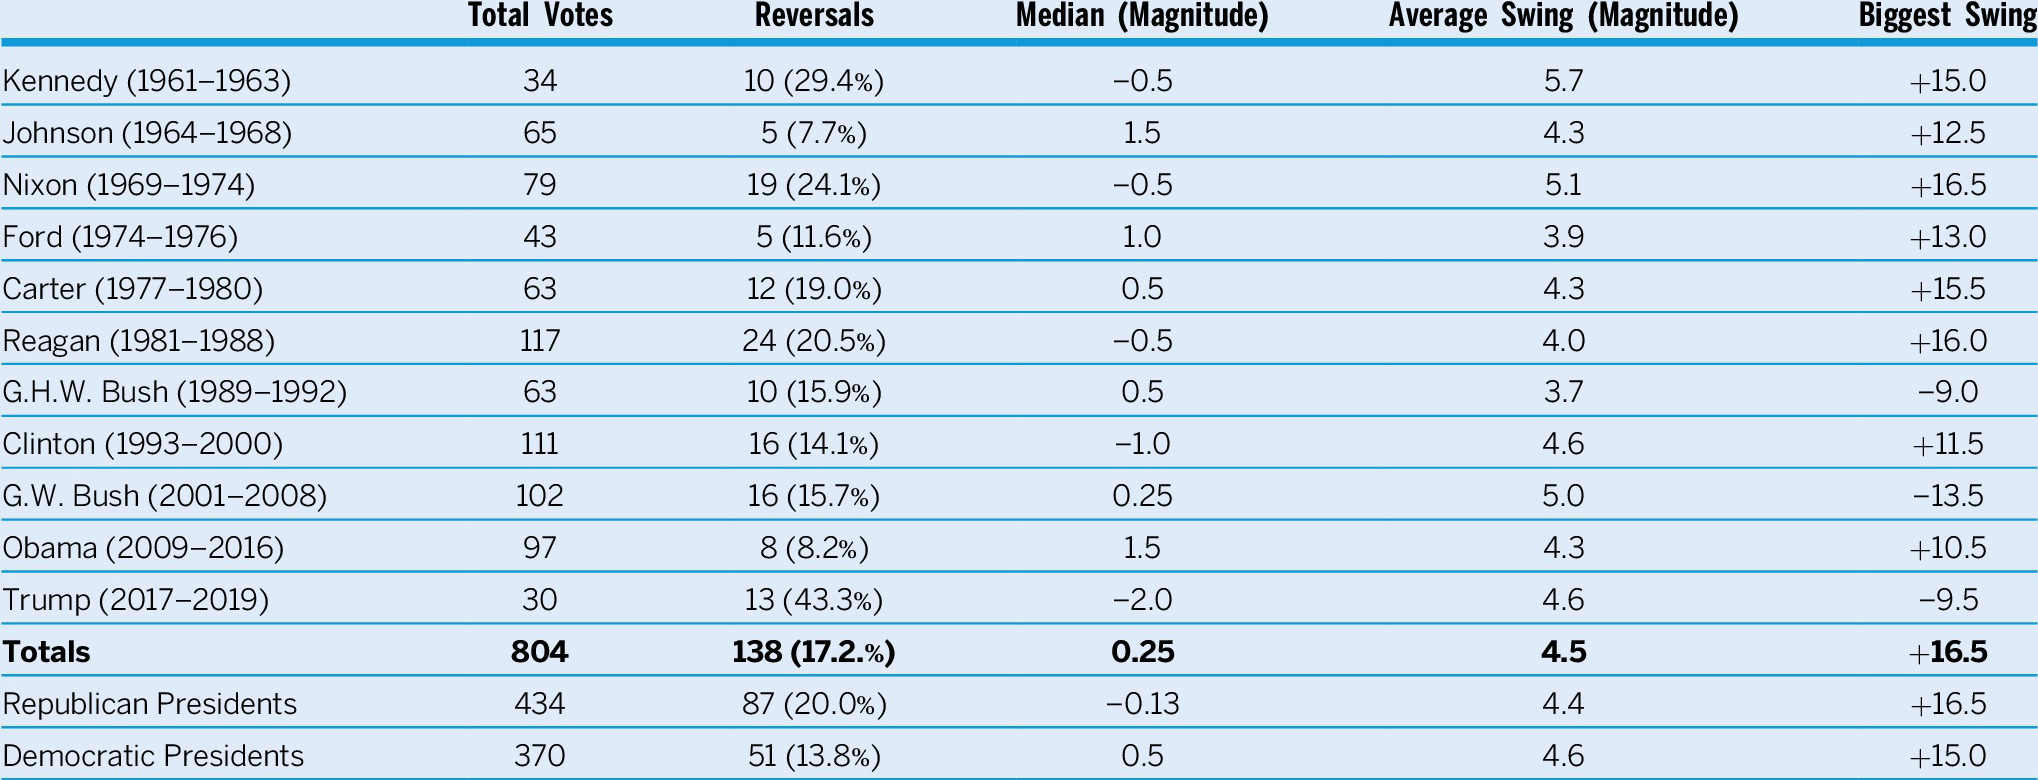
Reversals varied from a low of 7.7% (5/65) during the Johnson administration to a high of 43.3% (13/30) during the Trump administration. The magnitude of the average swing ranged from a low of 3.7 under George H. W. Bush to a high of 5.7 during the Kennedy presidency.
Approximately 20% of votes (86/434) were reversed under Republican administrations and 13.2% of votes (49/370) were reversed under Democratic administrations. Average swings were virtually identical (4.4 and 4.6, respectively). Both parties saw vote swings of +/–15 “aye” votes or more. From swings and reversals alone, it appears that reapportionment has only a modest effect on the outcome of Senate votes and seemingly does not have a substantial bias in terms of the two major political parties.
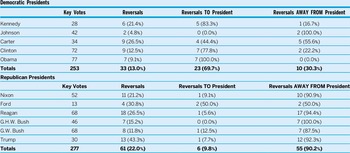
However, when incorporating the President’s position on the roll-call vote, distinct differences emerge. As shown in table 3, it is clear that malapportionment in the Senate overwhelmingly has aided the passage of Republican presidents’ agenda items when compared to Democratic presidents. We reviewed 94 key votes in which the President’s position was known and a reversal occurred after applying our weights. These reversals benefited Democratic presidents’ policy preferences 69.7% of the time. Under Republican administrations, reapportionment cost them votes in 90.2% of reversals.
Key Votes and Reversals with President’s Position

Note: Votes only when the president’s position was known.
In recent administrations, the partisan divide has been stark. During Barack Obama’s presidency, our reapportionment weights flipped seven roll-call results—all toward Obama’s policy position. In contrast, George W. Bush and Donald Trump experienced eight and 13 policy reversals, respectively. Only one key vote each accrued more support for the Republican position. Modestly taking state population differences into account reduced support for these Republican presidents’ policy preferences 90% of the time. The reversals during the Trump presidency are particularly stark. Although we cannot explain this using our current analysis, we suggest that the growing urban–rural divide—particularly after Obama’s election—offers a partial explanation (Mettler and Brown Reference Mettler and Brown2022). In addition, reversals under Trump were disproportionately appointments. It is possible that President Trump’s appointments were more controversial than previous administrations, making party-line votes more likely.
Modestly taking state population differences into account reduced support for these Republican presidents’ policy preferences 90% of the time.
SWINGS ACROSS ISSUE TYPE AND POLITICAL IDEOLOGY
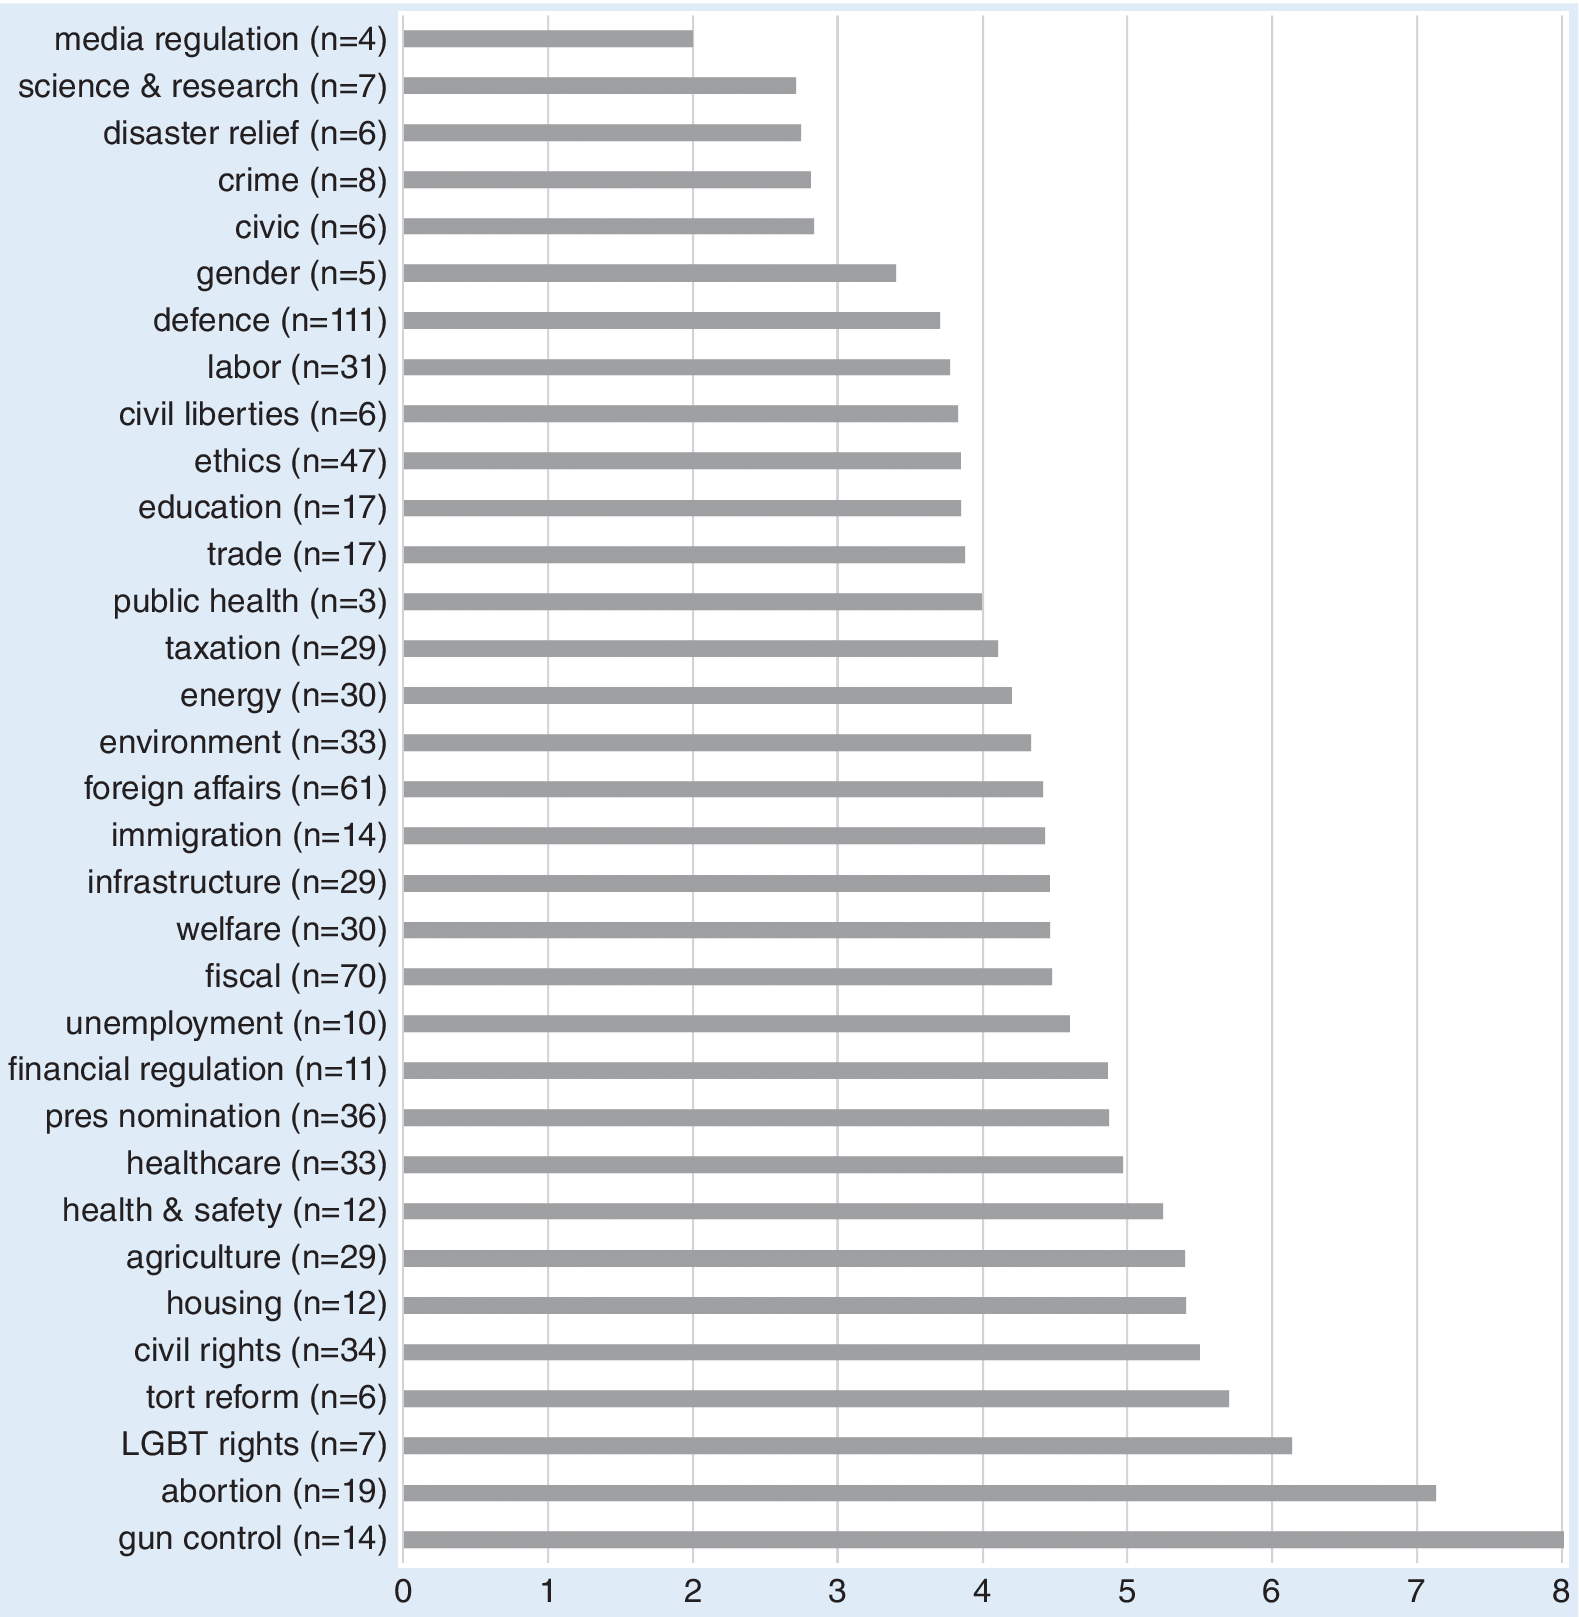
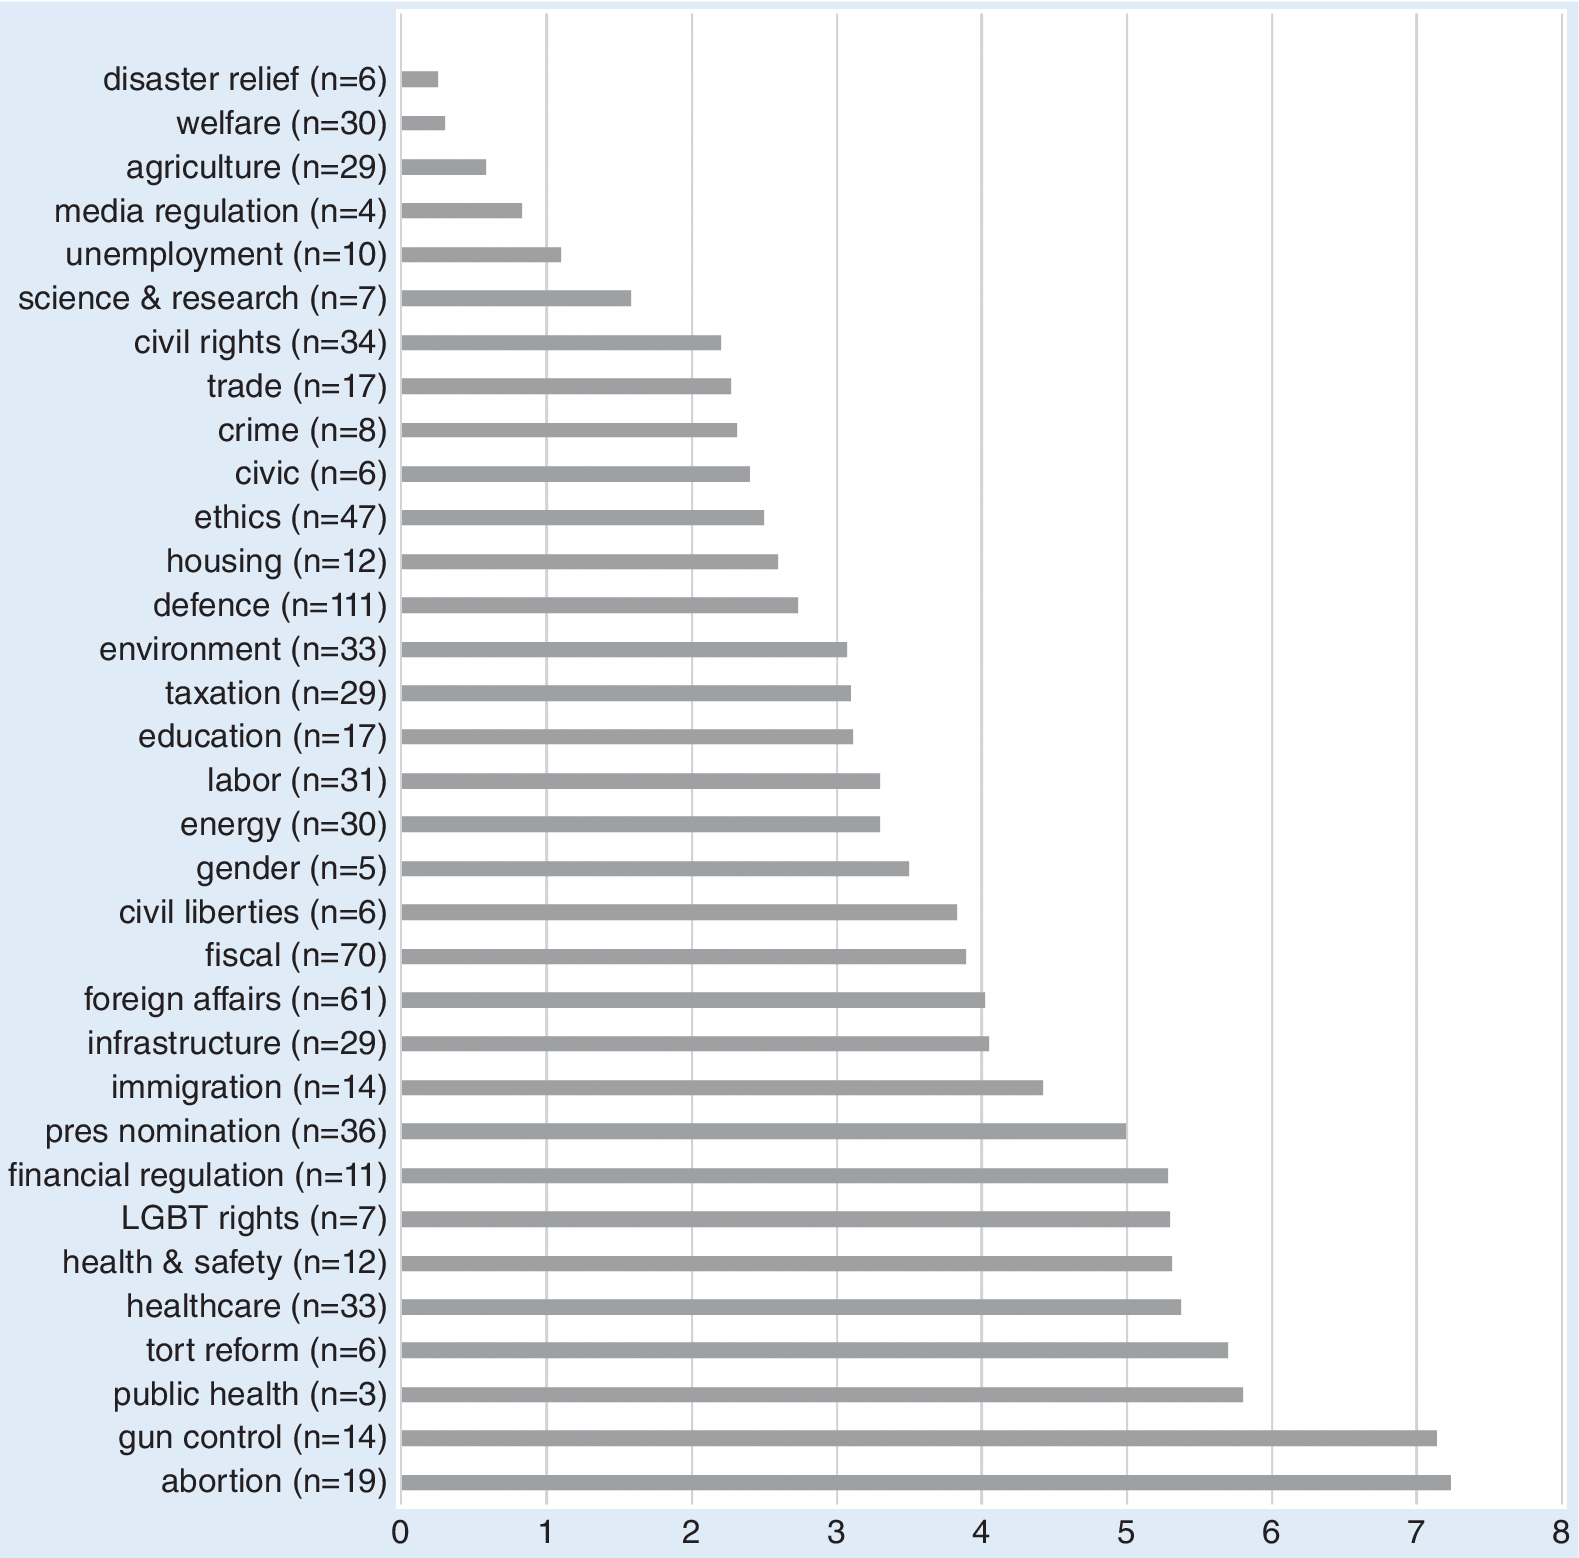
We next looked for systematic differences in the swing in votes across issue type and political ideology. Figure 1 illustrates average (i.e., absolute) swing in votes by issue. The top 10 issues with the highest average swing in votes were of high political salience: gun control, abortion, LGBTQ rights, tort reform, civil rights, housing, agriculture, health and safety, healthcare, and presidential appointments.
Change in the Number of “Aye” Votes for a Policy After Applying Reapportionment Weights (Absolute Value)
N=number of roll-call votes in the dataset.

To investigate whether reversals by issue would have benefited one or the other party, we coded every vote as Democratic or Republican on the basis of the President’s preference (when it was known), as indicated by the CQ. As illustrated in figure 2, the Democratic position gained votes across all policy areas. The greatest accruements to the Democratic position occurred on bills relating to healthcare and gun control, which is perhaps not surprising given that urban voters—who are underrepresented in the Senate—tend to be the most liberal in both of these policy areas. The average abortion and gun-control bills each gained seven more Democratic votes following reapportionment. The smallest change was in policies relating to disaster relief (i.e., negligible Democratic gains). We reiterate that our reapportionment formula is not fully proportional. Because each state receives a minimum of one senator, small states maintain a disproportionate influence. Even so, these changes are stark and the ideological pattern is unmistakable.
The greatest accruements to the Democratic position occurred on bills relating to healthcare and gun control.
Average Increase in Votes for Democratic Position After Applying Apportionment Weights, by Issue (1961–2019)
Key votes in which the President’s position was known.

We do not know whether these reversals would have been decisive in turning a bill into law or in permanently killing it. As noted previously, too many other factors would be altered if the Senate were reapportioned. However, veto overrides (i.e., when the House has voted to override) and presidential appointments minimize these counterfactual alternatives. These are situations in which a single Senate roll-call vote can determine the success or failure of the President’s agenda. In these cases, we can show where malapportionment was sufficiently decisive in outcomes.
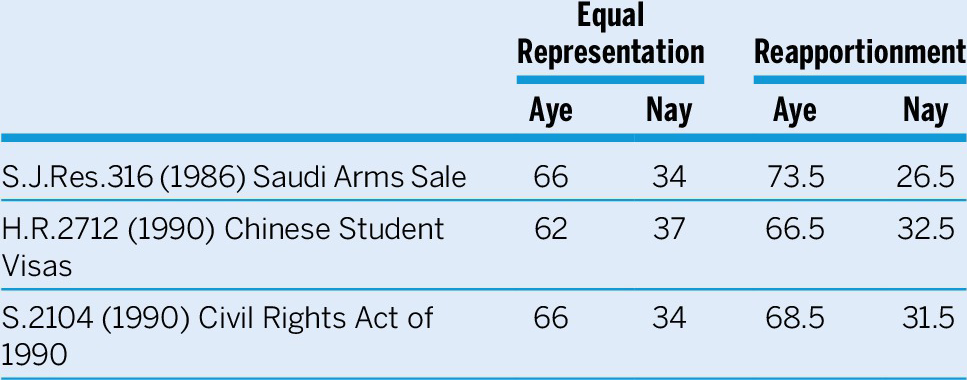
In our dataset, there were three times when Congress was unable to override the presidential veto because of equal representation but that under reapportionment would have had the requisite votes to do so. Table 4 shows that the veto overrides would have been successful in a modestly reapportioned Senate. All three occurred during the Reagan and Bush presidencies when a Democratic Senate attempted to pass legislation over the Republican president’s objections. One instance included the Civil Rights Act of 1990, which narrowly fell short of a veto override in the Senate but would have had enough support under the new apportionment scheme.
Bills Vetoed by President with Congressional Override Under Reapportionment

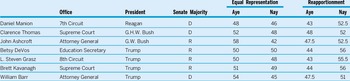
Finally, there were 36 presidential nominations in our dataset, of which we found seven outcomes that were reversed after applying our reapportionment weights. As shown in table 5, all nominees were appointed by Republican presidents, including two US Supreme Court Justices (i.e., Clarence Thomas and Brett Kavanagh). There were no equivalent examples under Democratic presidents.
Presidential Nominations Reversed Under Reapportionment (All Pass to Fail)

LIMITATIONS
Of course, this analysis cannot determine whether senators under our revised apportionment scheme, in fact, would behave as they do under equal state representation. Although we consider our reapportionment scheme to be relatively modest, we recognize that it is beyond the minimal rewrite rule of a counterfactual analysis (Levy Reference Levy2015). This limitation requires caution in interpreting our results.
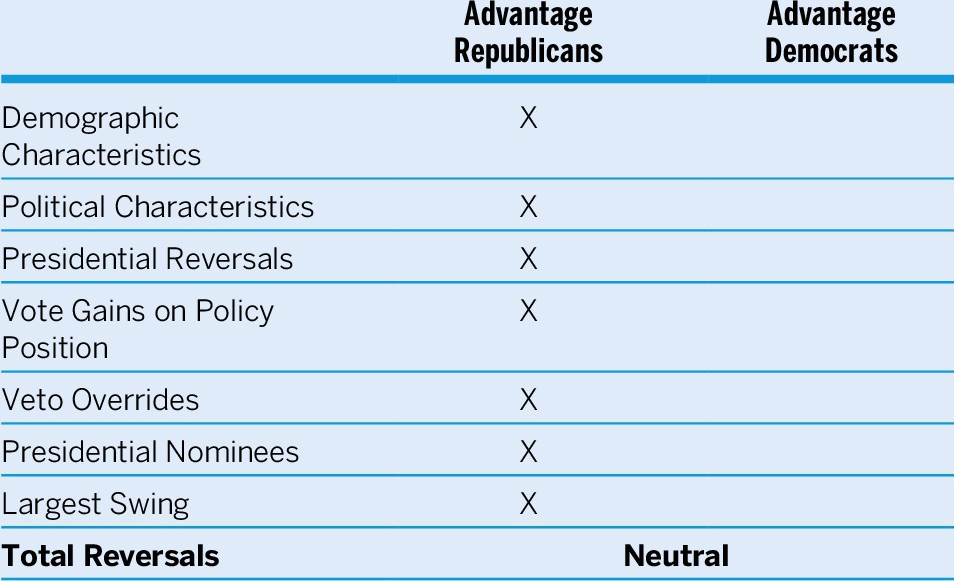
Nevertheless, as illustrated in table 6, we undertook eight different analytic approaches to examine whether equal representation in the US Senate has potential representational and policy consequences. Seven approaches revealed advantages for the conservative position under equal representation, whereas one—the sheer percentage of swings under a given presidential administration—did not appear to differ under either type.
Aggregate Advantage of Equal Representation, by Party

CONCLUSIONS
Our analysis strongly suggests that, in recent decades, equal representation in the Senate has overrepresented Republican preferences and underrepresented Democratic preferences. In every analysis, reapportionment likely would result in support for more liberal positions, which more accurately represents the political preferences of the majority of the American public. Perhaps most starkly, Democratic presidents would have experienced substantially more victories in the Senate on major policy initiatives.
Moreover, Democratic preferences issues of high political salience and deep political division (e.g., immigration reform, gun control, social welfare, and healthcare) received substantially more support under a modest reapportionment scheme. Several controversial Republican presidential appointments likely would have failed. There are exceptions to the benefits to Democratic preferences, but those exceptions largely prove the rule.
The equal representation of states in the Senate is unique in the United States and rare internationally, even among federal systems. Irrespective of the practical likelihood of reapportioning the Senate on a different basis, political scientists nevertheless should be interested in studying its effects, including whom it advantages and disadvantages.
Senate malapportionment weakens the democratic link between policy commitment and delivery. Electorates vote for policy changes at both congressional and presidential levels, only to see those initiatives fail due to the Senate’s institutional configuration. Over time, the inability for people to see the change for which they voted can undermine democratic legitimacy and trust in government.
The principle of one person/one vote is widely understood to be a keystone of representative democracies. Although some federal systems allow for departure from this principle to account for territorial or at-risk minority representation, such deviations ipso facto will diminish the representation of people in more populous parts of the country. Understanding who these citizens are is crucial to our understanding of which groups benefit most from the existing rules of the game. Under equal state representation, the minority views of largely white, conservative Americans are the winners.
DATA AVAILABILITY STATEMENT
Research documentation and data that support the findings of this study are openly available at the PS: Political Science & Politics Harvard Dataverse at https://doi.org/10.7910/DVN/GQ75UG.
SUPPLEMENTARY MATERIALS
To view supplementary material for this article, please visit http://doi.org/10.1017/S1049096522001111.
CONFLICT OF INTEREST
The authors declare that there are no ethical issues or conflicts of interest in this research.