Implications
Current approaches to determine the sole contribution of water soluble carbohydrate (WSC) to animal performance is limited by the fact that chemical components (e.g. nitrogen (N) and WSC) in feed are not independent, at least in pasture. Therefore, this study was designed to test the effect of increasing dietary WSC concentration, at a consistently high N concentration, on N utilisation and isotopic fractionation. Results showed inclusion of WSC neither improved microbial protein synthesis nor N utilisation. Further, the study failed to confirm the use of N isotopic fractionation as a simple indicator of N partitioning.
Introduction
It has been reported that temperate pasture fed to ruminants generally contains a high concentration of N (which ranges between 3.0% and 4.8% of dry matter (DM)) relative to energy supply (Litherland and Lambert, Reference Litherland and Lambert2007). This leads to a low efficiency of incorporating feed N into usable N (e.g. milk, meat); and large outputs of surplus N to the environment (Pacheco and Waghorn, Reference Pacheco and Waghorn2008). It has been suggested that production and N-use efficiency (NUE; milk N output (MN)/N intake (NI)) may be improved by providing more WSC relative to N in the diet (Rooke et al., Reference Rooke, Lee and Armstrong1987; Merry et al., Reference Merry, Lee, Davies, Dewhurst, Moorby, Scollan and Theodorou2006). Moreover, Edwards et al. (Reference Edwards, Parsons and Rasmussen2007) concluded that a benefit in reduction of urinary N output loss to the environment and improvement in NUE can be expected when the dietary ratio of WSC to N (WSC : N ratio; g/g) increased from 4.4 to 8.1. However, a metadata analysis demonstrated that there may be concentrations of N (~3.7%) beyond which NUE is insensitive to increases in WSC concentrations (Pacheco et al., Reference Pacheco, Lane, Burke and Cosgrove2007). Furthermore, in vitro studies suggested that WSC concentrations >24% of the DM may affect rumen fermentation negatively due to a rapid drop in pH (Burke et al., Reference Burke, Pacheco and Cosgrove2011). Experimental approaches to determine optimum WSC : N ratios are limited by the fact that WSC and N in a forage sward are not independent (Ellis et al., Reference Ellis, Dijkstra, Bannink, Parsons, Rasmussen, Edwards, Kebreab and France2011). Therefore, this study was designed to test the effect of increasing dietary WSC concentration at a consistently high level of N concentration, on the partitioning of N among feed, milk, urine and faeces.
The most widespread method used to measure NUE is N balance (NB; MacRae et al., Reference MacRae, Walker, Brown and Lobley1993). Also, urea N concentrations in milk have been proposed as proxies for NUE (Broderick and Clayton, Reference Broderick and Clayton1997; Cheng et al., Reference Cheng, Dewhurst, Larkin, Buckley, Thackaberry and Edwards2010). However, the NB method is difficult to conduct, particularly with large number of animals (MacRae et al., Reference MacRae, Walker, Brown and Lobley1993) and urea N is subject to substantial diurnal variations (Gustafsson and Palmquist, Reference Gustafsson and Palmquist1993). Earlier studies identified that fractionation of N isotopes occurs during digestion and metabolism of dairy cows, notably during utilisation of N by ruminal bacteria fermenting different types of carbohydrates (Wattiaux and Reed, Reference Wattiaux and Reed1995). Cheng et al. (Reference Cheng, Kim, Merry and Dewhurst2011 and Reference Cheng, Nicol, Dewhurst and Edwards2013) suggested that N isotopic fractionation could potentially be used to quantify N partitioning of ruminants. However, this information is limited to few data sets, and more knowledge is required on how dietary changes affect N isotopic fractionation. Therefore, the two objectives of this study were to examine the N partitioning of dairy goats offered a high N diet with increasing concentrations of WSC; and also evaluate the use of N isotopic fractionation as a simple indicator of N partitioning.
Material and methods
The study used eight multiparous goats aged between 3 and 4 years; weighing 51 (SD=5.0) and 52 (SD=4.5) kg at the start of two collection periods. The goats were selected from a commercial herd and had started lactation within a week of each other. Mean days-in-milk at the beginning of the experiment was 98 (SD=1.8) days. Four dietary treatments were evaluated in an incomplete cross-over design with two periods of 3 weeks (the first 2 weeks were used as dietary adaptation and the last week was used for measurement). Two goats were randomly allocated to each treatment in the first period and maintained as a pair for the second period. One goat receiving the medium low treatment in period 1 was replaced with a spare goat due to a metabolic disorder the day before starting the NB of period 2.
Diets
A sample of lucerne (Medicago sativa) cubes was analysed to formulate the experimental diets to meet the energy and protein requirements of lactating dairy goats (Agricultural and Food Research Council (AFRC), 1993). All diets formulated were deemed adequate to meet the requirements of metabolisable energy (ME; diets ranging from 97% to 105% of the goat’s requirements) and metabolisable protein (ranging from 134% to 140% of the requirements).
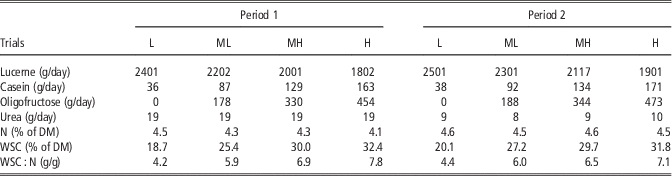
Four dietary treatments were designed to provide increasing concentrations of WSC (low, medium low, medium high and high WSC : N ratio); all with a consistently high concentration of N (~4.5%) and constant feed allowance (2500 g/day). The main component of the diet was lucerne pellets (Dunstan Horsefeeds; Camtech Nutrition Ltd, Hamilton, New Zealand). Additional WSC was provided from oligofructose powder containing 5% glucose/fructose and 95% oligofructose (Orafti®P95; BENEO-Orafti S.A., Tienen, Belgium). N concentrations were equalised across treatments (Table 1) by adding acid casein (NZMP™; Fonterra Ltd, Auckland, New Zealand) and non-protein N as urea (N-rich™; Ballance Agri-Nutrients Ltd, Tauranga, New Zealand).
Feed formulation and composition of the diets to provide different ratios of water soluble carbohydrates (WSC) to nitrogen (N)

L=low dietary WSC : N; ML=medium low dietary WSC : N; MH=medium high dietary WSC : N; H=high dietary WSC : N; DM=dry matter.
Values are given separately for the two periods of the cross-over experimental design.
Formulated rations for each treatment were prepared daily before feeding. In comparison with period 1, an extra quantity of lucerne pellet was included in the feed to avoid limiting milk production in period 2. In addition, the amount of dietary urea was reduced as a result of the high milk urea N (MUN) measured in period 1 (Table 1).
Animal measurements
This study was undertaken at AgResearch Grasslands Research Centre, Palmerston North, New Zealand. All animal manipulations described were approved by the Grasslands Animal Ethics Committee (approval no. 11894). Goats were housed individually in metabolism crates and fed every 2 h using automatic feeders. The goats were adapted to each of the experimental diets for 14 days in pens. After adaptation, the measurement period consisted of 2 days adaptation to metabolism crates, 5 days of NB study, followed by 1 day for insertion of two jugular catheters, 2 days of infusion of double 15N-labelled urea (15N-urea) at 1.15 mmol/h for 4 h/day to determine the whole-body production rates of urea (results will be reported separately). After conclusion of the first period, the goats were allowed to adapt to the second treatment for a further 2 weeks before commencing the measurement in the second period, which followed the same timetable as presented above.
Feed, faeces, urine and milk samples were collected during the 5 days of each NB period. The goats were weighed on the day before and after the NB study. Blood was sampled into 10 ml ethylenediaminetetraacetic acid tube from individual animals on the last day of each NB period. Plasma was harvested by centrifugation at 4°C at 1300 r.p.m. for 15 min.
Sampling of feed (~130 g/goat per day) was done in the morning before feeding and samples were oven dried at 65°C (100 g) and flash frozen in liquid N2 for WSC determination (30 g). Milk yield (MY) and milk samples were recorded and collected, respectively, twice per day throughout the whole study. Daily faeces production was recorded after each morning milking. Faeces were collected in a stainless steel tray under the metabolism crates and samples were oven dried at 60°C until constant weight. Urine collection was carried out continuously, weighed and sampled after each morning milking. To avoid contamination with faeces and to give quantitative urine collection, a separator was glued over the vulva with an attached hose directing the urine flow to a plastic bucket containing 50 ml of 6 M hydrochloric acid. A measurement of pH was conducted after each sampling to confirm that urine pH was below 4.5. All 5 days samples were stored at −20°C and pooled together per goat per period before chemical analysis. N retention was calculated as the difference between NI and N output (urine, milk and faeces).
Analytical methods
The concentration of feed WSC was analysed following the method described by Rasmussen et al. (Reference Rasmussen, Parsons, Bassett, Christensen, Hume, Johnson, Johnson, Simpson, Stacke, Voisey, Xue and Newman2007). Oven dried feed, acidified urine and oven dried faeces were analysed for N concentration using an Elementar (Variomax CN Analyser, Elementar Analysensysteme, Germany). Milk samples were analysed for fat, protein and lactose concentrations using Fourier transform infrared spectroscopy (FT120; Foss Electric, Hillerød, Denmark). The MUN was analysed using a urease UV kinetic assay (Roche Modular P800, Roche Instruments, Germany). Urinary purine derivatives (PD) (allantoin and uric acid) were analysed using the method described by George et al. (Reference George, Dipu, Mehra, Singh, Verma and Rangaokar2006). All samples were freeze-dried and analysed for δ 15N following the procedure described by Cheng et al. (Reference Cheng, Kim, Merry and Dewhurst2011).
Statistical analysis
The GenStat statistical package (version 12.2; VSN International Ltd, Hemel Hempstead, UK) was used to perform the statistical analysis using the ANOVA, general linear regression analysis and multiple range testing (Student–Newman–Keuls). Dietary treatment and period effect on N partitioning and isotopic fractionation were examined by including ‘treatment+period’ as treatment factor in ANOVA. Infusion of 15N-urea effect on N isotopic fractionation was examined by including ‘treatment+infusion’ as treatment factor in ANOVA.
Results
Feed formulation and composition
The feed formulation and composition are shown in Table 1, separately for the two periods. Average oligofructose intake increased from 0 g/day (low treatment) to 464 g/day (high treatment) across diets. The WSC : N ratio increased progressively from 4.3 to 7.5 from low to high treatment (Table 1).
Intake, MY, digestibility and urinary excretion of PD
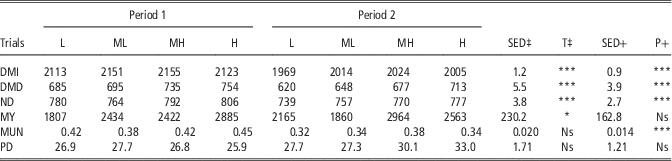
There was a dietary treatment effect on DM intake (DMI; g/day; P<0.001). On average, DM digestibility (DMD) and N digestibility (ND) increased by 12% and 4% from the low to high treatment, respectively (Table 2). As WSC : N increased, MY (P<0.05) increased from 1833 g/day (low) to 2724 g/day (high). No dietary effect on urinary excretion of PD was observed (Table 2).
Effect of increased dietary ratios of water soluble carbohydrate (WSC) to nitrogen (N) on dry matter intake (DMI; g/day), milk yield (MY; g/day), dry matter digestibility (DMD; g/kg DM) and N digestibility (ND; g/kg N), milk urea N (MUN; g/l) and urinary excretion of purine derivatives (PD; mM/day)

L=low dietary WSC : N; ML=medium low dietary WSC : N; MH=medium high dietary WSC : N; H=high dietary WSC : N.
Values are given separately for the two periods of the cross-over experimental design.
‡ Treatment effect.
+ Period effect.
*P<0.05, ***P<0.001, Ns=non-significant.
N partitioning and weight changes
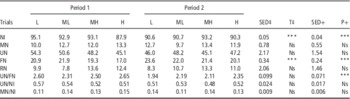
There was a dietary effect on NI and faecal N output (FN) (P<0.001), but not on either MN or urinary N output (UN). The range in NUE (0.11 to 0.15 g/g) and UN/NI (0.48 to 0.57 g/g) were narrow, no effect was observed from dietary treatment (Table 3).
Effect of increased dietary ratios of water soluble carbohydrate (WSC) to nitrogen (N) on N intake (NI; g/day), milk N output (MN; g/day), urinary N output (UN; g/day), faecal N output (FN; g/day), retained N (RN; g/day), UN/FN (g/g), UN/NI (g/g) and MN/NI (g/g)

L=low dietary WSC : N; ML=medium low dietary WSC : N; MH=medium high dietary WSC : N; H=high dietary WSC : N.
Values are given separately for the two periods of the cross-over experimental design.
‡ Treatment effect.
+ Period effect.
***P<0.001, Ns=non-significant.
Overall, there was no change in BW, though BW from individual goats changed between −110 and+140 g/day.
N isotopic fractionation
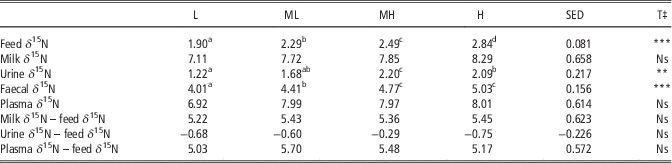
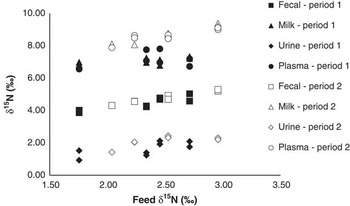
Milk, plasma and faeces were enriched in 15N compared with feed. In contrast, urine was depleted in 15N relative to feed (Table 4). No significant linear relationship was detected between N partitioning and isotopic fractionation. However, there were significant linear relationships between faecal δ 15N, urine δ 15N and feed δ 15N (equations (1) and (2)):
 $$\eqalignno{ {\rm Faecal}\,\delta ^{{{\rm 15}}} {\rm N}\,{\rm (}{‰}{\rm ){\,=\,}} & {\rm 1}.{\rm 1}\,{\rm (SE{\,=\,}}0.{\rm 14;}\,\,P\,\lt\,0.001{\rm )}{\times}{\rm feed}\,\,\delta ^{{{\rm 15}}} {\rm N}\,{\rm (}{‰}{\rm )} \cr & {\rm {\plus}2}.0\,({\rm SE{\,=\,}}0.{\rm 34;}\,\,P\,\lt\,0.001) $$
(n=16; r 2=0.80; P<0.001; SE=0.20).
 $$\eqalignno{ {\rm Urine}\,\delta ^{{{\rm 15}}} {\rm N}\,{\rm (}{‰}{\rm ){\,=\,}} & 0.{\rm 9}\,({\rm SE{\,=\,}}0.{\rm 25\,;\,\,}\,P{\rm {\,=\,}}0.002){\rm {\times}feed}\,\,\delta ^{{{\rm 15}}} {\rm N}\,{\rm (}{‰}{\rm )} \cr & {\minus}0.{\rm 5}\,{\rm (SE{\,=\,}}0.{\rm 59\,;}\,\,P{\rm {\,=\,}}0.{\rm 45)} $$
(n=16; r 2=0.48; P=0.002; SE=0.35).
Effect of increased dietary ratios of water soluble carbohydrate (WSC) to nitrogen (N) on N isotopic fractionation of lactating goats (‰, mean of the two periods from the cross-over experimental design)

L=low dietary WSC : N; ML=medium low dietary WSC : N; MH=medium high dietary WSC : N; H=high dietary WSC : N.
a,b,c,dMeans with different superscripts are significantly different at the 5% confidence level.
‡ Treatment effect.
**P<0.01, ***P<0.001, Ns=non-significant.
Period and infusion effects
Period had significant effects on DMI, DMD, ND and MUN (P<0.001) (Table 2). On average, MUN was 20% higher in period 1 than period 2. Goats infused with 15N-urea at the end of the first period had slightly higher levels of 15N in all of their body N sinks (i.e. urine, faeces, milk and plasma) compared with non-infused goats (Figure 1).
Relationship between feed δ 15N (‰) and δ 15N in milk, plasma, faeces and urine (‰) in period 1 (n=8) and period 2 (n=7) of lactating goats.

Discussion
N metabolism
This study provided a good base to examine the effect of changing WSC alone on N partitioning, with a relatively constant NI across dietary treatments (Table 3). The mean NI was 91.8 g/day of that 13%, 52% and 23% were excreted in milk (non-significant dietary effect), urine (non-significant dietary effect) and faeces (P<0.001), respectively. The relatively small and non-significant dietary effect on NUE contrasted with results from cows fed a diet of around 3.2% N with elevated WSC in the diet, which showed improvement in NUE (Miller et al., Reference Miller, Moorby, Davies, Humphreys, Scollan and MacRae2001). In this study, the proportion of NI excreted in urine (UN/NI) was high (on average >48%; Table 3) compared with results from lactating dairy cows studies (Miller et al., Reference Miller, Moorby, Davies, Humphreys, Scollan and MacRae2001; Moorby et al., Reference Moorby, Evans, Scollan, MacRae and Theodorou2006). Our results are in contrast to the suggestion from the review of Edwards et al. (Reference Edwards, Parsons and Rasmussen2007) that increased NUE and decreased UN/NI of dairy cows should be observed when WSC : N increased from 4.4 to 8.1 g/g. We consider the high dietary N (on average 4.5% of DM) and high WSC (on average 26.9% of DM) concentrations in current study were the main reasons for the absence of responses in N partitioning of UN/NI and NUE (Table 3). Pacheco et al. (Reference Pacheco, Lane, Burke and Cosgrove2007) conducted a metadata analysis (n=129) and found no improvement in NUE when dietary N concentration was above 3.7% of DM. An explanation for finding such a threshold is that high dietary N concentration exceeding the limit for rumen microbes to capture N for microbial protein synthesis (Broderick and Clayton, Reference Broderick and Clayton1997). In addition, evidence obtained from an in vitro study in which increased WSC concentration in fresh forages were obtained by harvesting at different time of the day suggests that there may be a concentration of WSC (~24%) that optimises rumen fermentation processes (Burke et al., Reference Burke, Pacheco and Cosgrove2011). Owens et al. (Reference Owens, Secrist, Hill and Gill1998) suggested that the synthesis of microbial protein in the rumen may also be reduced by acidosis from feeding high level of WSC. This is partly evident from the low PD for medium high and high treatments in period 1. Notably, these two treatments also received the highest WSC : N (i.e. 6.9 and 7.8 g/g). Furthermore, estimation of the yield of microbial CP (MCP) per MJ of fermentable ME (FME) based on AFRC (1993); MCP/FME (g/MJ)=7+6×[1−e(−0.35 l)] suggested an average 10.9 g of MCP was synthesised from per MJ of FME (SED=0.16; non-significant) across the diets, irrespective of WSC : N ratio changes. Overall, dietary treatment had little effect on PD in the current study (Table 2), which implies no differences in rumen microbial protein synthesis (Dewhurst et al., Reference Dewhurst, Mitton, Offer and Thomas1996; Cheng et al., Reference Cheng, Kim, Merry and Dewhurst2011).
A recent focus in ruminant research is to redirect UN to FN through feeding animals with diets containing high level of WSC. Results from feeding cows on 3.2% dietary N (in the DM) showed that it was possible to decrease UN/FN by around 27% (Miller et al., 2001). Such change of N excretion was achieved either through increasing FN, as a function of increasing DMI (Moorby et al., Reference Moorby, Evans, Scollan, MacRae and Theodorou2006) or decreasing UN, as a function of increasing rumen microbial protein synthesis (Miller et al., Reference Miller, Moorby, Davies, Humphreys, Scollan and MacRae2001). Our goats were fed high dietary N (on average 4.5% of DM) and high WSC (on average 26.9% of DM), and there was no effect on UN/FN (Table 3). Again, the most likely explanation is the lack of improvement in microbial protein synthesis (van Vuuren et al., Reference van Vuuren, van der Koelen, Valk and de Visser1993). In addition, decreased FN resulted from increasing DMD with inclusion of WSC in the diets.
On average, goats retained 11 g N/day from feed in this study. Converting 11 g N/day into protein by adopting a coefficient of 6.25 (i.e. assuming a body protein N concentration of 16%), a protein gain of about 68 g/day was obtained and as body protein associates with water in an average ratio of 1 : 3, gives 272 g/day of lean tissue gain during the study. This estimation was not realistic for goats fed on around 2000 g of DM/day, and also inconsistent with the weight change data (0 g/day on average). Spanghero and Kowalski (Reference Spanghero and Kowalski1997) suggested that overestimation of retained N is commonly observed in NB studies. The possible sources of errors for high N retention value include the incomplete collection of materials, volatile N losses from faeces and urine as well as scurf and dermal losses.
MUN
Measurement of MUN is widely used to indicate the efficiency of N utilisation of animals (Broderick and Clayton, Reference Broderick and Clayton1997). Oltner et al. (Reference Oltner, Emanuelson and Wiktorsson1985) postulated that MUN was more closely related to the ratio of dietary energy to protein than the absolute protein intake. MUN concentrations from this study were higher than in many previous studies (Bonanno et al., Reference Bonanno, Todaro, Grigoli, Scatassa, Tornambé and Alicata2008), though there were no significant dietary treatment effects on MUN (Table 2). This may be caused by similar reasons to the lack of dietary treatment effect on NUE (van Vuuren et al., Reference van Vuuren, van der Koelen, Valk and de Visser1993), namely that N supply to the rumen was well in excess of the requirements for microbial protein synthesis.
N isotopic fractionation
On average, faeces, plasma and milk were enriched in 15N by 2.18‰, 5.35‰ and 5.37‰ compared with the diet, whilst urine was depleted in 15N relative to the diet by 0.58‰ (Table 4). This is consistent with findings from Sponheimer et al. (Reference Sponheimer, Robinson, Ayliffe, Roeder, Hammer, Passey, West, Cerling, Dearing and Ehleringer2003), who suggested that the main reason for the enrichment of 15N in faeces is the presence of enriched endogenous material. The majority of N in milk and plasma exists as true protein, which has been reported to be enriched in 15N (Sick et al., Reference Sick, Roos, Saggau, Haas, Meyn, Walch and Trugo1997; Cheng et al., Reference Cheng, Dewhurst, Larkin, Buckley, Thackaberry and Edwards2010). In contrast, urea is the main N source of urine and is reported to be depleted in 15N (Steele and Daniel, Reference Steele and Daniel1978).
Regression analysis demonstrated that urine and faecal δ 15N were linearly related to feed δ 15N (equations (1) and (2)). In addition, feed (r 2=0.80; P<0.001), urine (r 2=0.49; P=0.001) and faecal δ 15N (r 2=0.67; P<0.001) responded to increased WSC : N ratio linearly. Therefore, these observed relationships (equations (1) and (2)) would be related to isotopic fractionation during digestion and absorption of feed components (i.e. WSC and N) (Sutoh et al., Reference Sutoh, Obara and Yoneyama1993; Wattiaux and Reed, Reference Wattiaux and Reed1995) or a possible common effect of the endogenous N contribution to urine and faeces from feed (Cheng et al., Reference Cheng, Kim, Merry and Dewhurst2011).
The current study provided little support for relationship between N partitioning and N isotopic fractionation, in contrast to the report of Sick et al. (Reference Sick, Roos, Saggau, Haas, Meyn, Walch and Trugo1997) with rats. Several possible causes exist for the absence of the expected relationship. First, changes in N partitioning among body N sinks were small (e.g. NUE ranged between 0.11 and 0.15 g/g) and did not respond to dietary treatment in this study (Table 3). Second, previous study suggested microbial protein synthesis contributes to N isotopic fractionation (Cabrita et al., Reference Cabrita, Fonseca and Dewhurst2014). However, there was little effect of dietary treatments on microbial protein synthesis, as indicated by both PD and MCP/FME calculations in this study. Third, feed N supplied in this study across treatments was similar, which would lead to limited changes in N isotopic fractionation (Balter et al., Reference Balter, Simon, Foiillet and Lecuyer2006).
Period and infusion effect
Lower MUN was observed in period 2 compared with period 1 (P<0.001), which is believed to be associated with a reduced urea intake in period 2 (Table 1).
The difference in apparent fractionation (e.g. milk δ 15N – feed δ 15N) effects between periods 1 and 2 (Figure 1) is unlikely to be related to the difference in basal diet, as statistical analysis showed no difference in feed δ 15N between periods 1 and 2 (non-significant). Feed for period 1 had almost twice as much as urea in the feed compared with period 2; this high level of urea may have a negative impact on ruminal microbe growth/population, which in turn would reduce deamination and N isotopic fractionation (Chen et al., Reference Chen, Wang, Wu and Liu2008). However, the reductions in PD excretion for the medium high and high treatments in period 1 were not statistically significant; which does not support a limitation on microbial protein synthesis. An alternative explanation is a reduced milk δ 15N – feed δ 15N results when more ammonia is incorporated into microbial protein (Wattiaux and Reed, Reference Wattiaux and Reed1995). This may be related to an increased proportion of microbial protein synthesised from ammonia N and greater activity by hyper-ammonia-producing bacteria with high-urea diet (Maeng and Baldwin, Reference Maeng and Baldwin1976; Cherdthong and Wanapat, Reference Cherdthong and Wanapat2010). Although the enrichment and depletion effects were consistent with literature, the levels of enrichment in body N sinks were generally higher than previously observed (Koyama, Reference Koyama1985; Sponheimer et al., Reference Sponheimer, Robinson, Ayliffe, Roeder, Hammer, Passey, West, Cerling, Dearing and Ehleringer2003; Cheng et al., Reference Cheng, Kim, Merry and Dewhurst2011). Caution is needed to interpret the 15N results from period 2, as there may be a carry-over effect from infusion 15N-urea into blood at the end of period 1, which led to body N sinks in period 2 (excluding one replacement goat) being slightly enriched in 15N compared with non-infused goats from period 1 (Figure 1).
Conclusions
There was little change in N partitioning and isotopic fractionation in response to increasing WSC : N ratio, when N concentration was consistently high in the diet. The absence of dietary effects on apparent microbial protein synthesis may be associated with high dietary N, and the increase in WSC concentrations did not provide any advantage in terms of N capture in the rumen. This study failed to confirm the potential to use N isotopic fractionation as an indicator of N partitioning in dairy goats, at least in cases when N supply markedly exceeds the animal requirements. The association between N partitioning and isotopic fractionation at different dietary N and WSC concentrations need further clarification.
Acknowledgements
The authors acknowledge the financial support of the AgResearch’s Research and Capability Fund, the Ministry of Science and Innovation, New Zealand (Project DRCX 0802, Dairy Systems for Environmental Protection). Dr L. C. acknowledges the financial support of AGMARDT Post-Doctoral Fellowship. Thanks go to Kate Lowe and Emiel de Bruijn (AgResearch Grasslands Research Centre) for their contribution to the animal experimental phase of this work. Also thanks to Roger Cresswell, Diane Keaney, Jenny Zhao and Jeffery Thackwell (Lincoln University) for the contribution to laboratory analysis.