




1. Introduction
Creativity is essential for innovation to take place in the field of engineering design (Cascini et al. Reference Cascini, Nagai, Georgiev, Zelaya, Becattini, Boujut, Casakin, Crilly, Dekoninck, Gero, Goel, Goldschmidt, Gonçalves, Grace, Hay, Le Masson, Maher, Marjanović, Motte, Papalambros, Sosa, Srinivasan, Štorga, Tversky, Yannou and Wodehouse2022). Innovative products have the capability to capture a substantial market share (Ottosson Reference Ottosson1995) and thereby allow an organization to have a competitive edge over its rivals. So, it is important to assess the degree of creativity to help (a) identify creative and innovative outcomes (Sarkar & Chakrabarti Reference Sarkar and Chakrabarti2011) and (b) recognize creative and innovative designers (Sundström & Zika-Viktorsson Reference Sundström and Zika-Viktorsson2003). Assessing creativity reliably is a critical concern in engineering design research and practice (Christian, Zheng & Miller Reference Christian, Zheng and Miller2017).
Creativity in design has multiple definitions, with some overlapping elements. Weisberg (Reference Weisberg1993) defined creativity as the ‘capacity to produce novel and valuable products’. Sternberg & Lubart (Reference Sternberg and Lubart1998) defined creativity as that which ‘produce(s) work that is both novel (i.e., original, unexpected) and appropriate (i.e., useful, adaptive, and concerning task constraints)’. Sarkar & Chakrabarti (Reference Sarkar and Chakrabarti2008, Reference Sarkar and Chakrabarti2011, Reference Sarkar and Chakrabarti2015) proposed a common definition of design creativity after analyzing 164 definitions of creativity: ‘Occurs through a process by which an agent uses its ability to generate ideas, solutions, or products that are novel and valuable; novel means new and original, and value refers to utility or usefulness in the context of technical or engineered products’.
Researchers proposed multiple measures to assess the creativity of design outcomes (Howard, Culley & Dekoninck Reference Howard, Culley and Dekoninck2008; Oman et al. Reference Oman, Tumer, Wood and Seepersad2013; Sarkar & Chakrabarti Reference Sarkar and Chakrabarti2015). For instance, novelty and value (Newell, Shaw & Simon Reference Newell, Shaw, Simon, Gruber, Terrell and Wertheimer1962), usefulness and unusualness (Moss Reference Moss1966), and novelty and appropriateness (Brown Reference Brown1989), to name a few. Surprise, arising from novelty, is also used as a measure of creativity (Ludden, Schifferstein & Hekkert Reference Ludden, Schifferstein and Hekkert2008). However, in the reviews conducted in Howard et al. (Reference Howard, Culley and Dekoninck2008); Sarkar & Chakrabarti (Reference Sarkar and Chakrabarti2008, Reference Sarkar and Chakrabarti2015); Ranjan, Siddharth & Chakrabarti (Reference Ranjan, Siddharth and Chakrabarti2018); Fiorineschi & Rotini (Reference Fiorineschi and Rotini2021); Berni, Borgianni & Basso (Reference Berni, Borgianni and Basso2024); Singh & Chakrabarti (Reference Singh and Chakrabarti2025), novelty (newness, originality) and value (appropriateness, realizability, usefulness and requirement satisfaction) are identified as the measures of design creativity. Therefore, in this research, novelty and value are considered as the primary measures of creativity in design, assessed independently and creativity is calculated as the mathematical product of novelty and value. This infers that an outcome is considered creative only if it is both novel and valuable (Sarkar & Chakrabarti Reference Sarkar and Chakrabarti2011).
The process of engineering design consists of four phases – task clarification, conceptual design, embodiment design and detailed design (Pahl & Beitz Reference Pahl, Beitz and Wallace1996). Creativity can potentially manifest across all these phases (Ranjan, Siddharth & Chakrabarti Reference Ranjan, Siddharth and Chakrabarti2018; Singh & Chakrabarti Reference Singh and Chakrabarti2025), and therefore, assessing it in all the phases is important to support innovative and competitive product development. However, effective assessment of creativity throughout all design phases remains challenging (Christian, Zheng & Miller Reference Christian, Zheng and Miller2017). Creativity manifests differently as design outcomes evolve, and early design phases are characterized by abstract problem formulations, preliminary solutions and fuzzy information. Creative designs can extend beyond creative ideas and concepts. Gero (Reference Gero1990) described creative design as a transformational process in which existing designs, including prototypes, are modified by introducing new elements or features, resulting in new designs or prototypes. Creativity thus develops through a sequence of transformations – from problems to concepts, prototypes and detailed designs – until the final design emerges.
A prototype is defined as ‘a physical, virtual, or combined representation of some or all aspects of a product, service, system, or their combinations, to assess various parameters such as fit, form, and functionality’ (Jaiswal & Srinivasan Reference Jaiswal, Srinivasan, Chakrabarti and Singh2023). Prototyping is the process of developing prototypes and is a critical activity in product development (Wall, Ulrich & Flowers Reference Wall, Ulrich and Flowers1992; Camburn et al. Reference Camburn, Viswanathan, Linsey, Anderson, Jensen, Crawford, Otto and Wood2017). In this research, the word ‘prototype’ refers to an outcome that is developed after conceptual solutions are generated, evaluated, modified and the best ones selected for prototyping. It has multiple purposes, such as to help: identify needs and requirements (Kang et al. Reference Kang, Crilly, Ning and Kristensson2023), generate new and original ideas (Viswanathan et al. Reference Viswanathan, Atilola, Esposito and Linsey2014) and communicate ideas with other stakeholders such as users, buyers and manufacturers (Lauff et al. Reference Lauff, Knight, Kotys-Schwartz and Rentschler2020). Prototypes exist at various levels of fidelity. Prototypes can be physical or virtual and can be developed using multiple prototyping tools and methods. Reviews of metrics to evaluate physical and virtual prototypes reveal that multiple metrics (such as form, time to (dis-)assemble, unit cost, comfort, no. of functions, dimensional accuracy, no. of parts, weight, mechanical stress, effectiveness and ease of use) that span various aspects (such as appearance, assembly fit, cost, ergonomics, fidelity, functionality, geometry, level of presence, maintainability, manufacturability, part count, performance, physical properties, time and user interaction and experience) are used depending on the type, fidelity and tools used (Jaiswal & Srinivasan Reference Jaiswal, Srinivasan, Chakrabarti, Singh, Onkar and Shahid2025a,Reference Jaiswal and Srinivasanb). Please note that not all metrics or aspects are applicable to any kind or type of prototype. The metrics and aspects will depend on the type, fidelity and the tools used to build a prototype (Jaiswal & Srinivasan Reference Jaiswal, Srinivasan, Chakrabarti, Singh, Onkar and Shahid2025a,Reference Jaiswal and Srinivasanb,Reference Jaiswal and Srinivasanc).
Assessment of novelty and value in the early phases of design is a work in progress. In conceptual design, assessments of creativity, novelty and value are based on information pertaining to functions, working principles and preliminary structure. Ideas/concepts provide limited, incomplete, or no information on many aspects of designs, such as manufacturability, assemblability, ergonomics, user experience, to name a few. Novelty, value and creativity (NVC) of designs can manifest in one or many of these aspects. Consequently, assessment at the conceptual phase may fail to capture the creative potential as designs are detailed. Importantly, creativity identified at the conceptual stage does not necessarily transfer directly to embodied outcomes (Christian, Zheng & Miller Reference Christian, Zheng and Miller2017).
At the prototyping phase, design solutions, that is, prototypes, encompass information on materials, part interfaces, assembly approaches, manufacturing constraints and user interactions, often leading to the emergence of aspects that are either not identified or limited during the conceptual phase. Creative choices are made in how designers resolve multiple constraints, explore alternative arrangements, adapt structures, or transform interactions. At the prototyping phase, more requirements are identified and existing requirements are decomposed to understand and test more and finer aspects of designs (Menold et al. Reference Menold, Jablokow, Simpson and Seuro2017b; Ranjan, Siddharth & Chakrabarti Reference Ranjan, Siddharth and Chakrabarti2018). Therefore, assessing NVC of prototypes using information, features and aspects pertinent to them is important. Further, it is important to assess these aspects with prototypes and make changes, if necessary, before developing final products because any changes made later in the process tend to be expensive in terms of time and resources (Berliner & Brimson Reference Berliner and Brimson1988; Menold et al. Reference Menold, Jablokow, Simpson and Seuro2017b).
Notwithstanding these advancements, limited attention has been given to developing methods specifically for assessing the NVC of prototypes based on prototype-specific features instead of abstract conceptual representations. This research aims to develop and validate a method for assessing the novelty and value and calculating creativity from these assessments of prototypes. This paper is structured as follows. In Section 2, relevant literature is reviewed to identify gaps, and from these, the objectives of this research are formulated. In Section 3, a method to assess novelty and value, and from these to calculate creativity, is proposed, and the application of this method is demonstrated in Section 4. The results of the evaluation of the proposed method are presented in Section 5. In Section 6, implications and limitations of this research, areas for further refinement and future plans are discussed. In Section 7, the summary and conclusions of this research are presented.
2. Review of prototypes and creativity assessments, identified gaps and objectives
In this section, we review the following: (a) the multiple metrics, their associated aspects and a computer-based ‘framework of metrics’ to evaluate prototypes, and (b) existing methods to evaluate NVC of design outcomes at various levels of abstraction. From these, limitations of the existing methods are identified to motivate the need for a method to assess NVC of prototypes. The objectives of this research are formulated at the end of this section.
2.1. Metrics, aspects and framework of metrics to evaluate prototypes
Prototypes are evaluated to test how well a design works, to collect feedback from various stakeholders, including potential users, to identify problems early and to compare design alternatives (Codner & Lauff Reference Codner and Lauff2024; Vang & Lauff Reference Vang and Lauff2025). Several metrics are proposed in the literature to assess physical and virtual prototypes in product design (Jaiswal & Srinivasan Reference Jaiswal, Srinivasan, Chakrabarti, Singh, Onkar and Shahid2025a,Reference Jaiswal and Srinivasanb). These metrics are used for various types of prototypes of varying fidelities, purposes and tools used to build prototypes. Aspects, such as functionality, ergonomics, level of presence, performance, physical properties, user interaction and experience, to name a few, are used to evaluate multiple dimensions of physical and virtual prototypes (Camburn et al. Reference Camburn, Dunlap, Gurjar, Hamon, Green, Jensen, Crawford, Otto and Wood2015; Jensen, Birkeland & Steinert Reference Jensen, Birkeland and Steinert2016; Menold, Jablokow & Simpson Reference Menold, Jablokow and Simpson2017a; Menold et al. Reference Menold, Jablokow, Simpson and Seuro2017b; Schölkopf et al. Reference Schölkopf, Lorenz, Stamer, Albrecht, Klimant, Hammer and Tümler2021; Chu et al. Reference Chu, Chen, Huang and Lee2022; Jaiswal & Srinivasan Reference Jaiswal, Srinivasan, Chakrabarti, Singh, Onkar and Shahid2025a,Reference Jaiswal and Srinivasanb). Product success depends on multiple factors and characteristics of a design, and these are assessed using a comprehensive set of metrics incorporating multiple aspects (Menold et al. Reference Menold, Jablokow, Simpson and Seuro2017b).
Jaiswal & Srinivasan (Reference Jaiswal, Srinivasan, Chakrabarti, Singh, Onkar and Shahid2025a,Reference Jaiswal and Srinivasanb), through an extensive literature review, identified metrics to assess physical and virtual prototypes in product design, and by clustering these metrics based on the similarity of their definition, constituted multiple evaluation aspects. For physical prototypes, 14 evaluation aspects were created by clustering 98 metrics identified from the literature; for virtual prototypes, 15 evaluation aspects were created by clustering 144 metrics identified from the literature. Table 1 shows the constituted evaluation aspects and representative metrics (Jaiswal & Srinivasan Reference Jaiswal, Srinivasan, Chakrabarti, Singh, Onkar and Shahid2025a,Reference Jaiswal and Srinivasanb).
Evaluation aspects and representative metrics for physical and virtual prototypes

Table 1. Long description
The table consists of four columns: Authors (year), Key indicators/metrics, Design outcomes, and Limitations of key indicators/metrics/methods.* Moss (1966): Metrics are Usefulness and Unusualness; Outcomes are Ideas/Concepts; Limitations include unusualness measured only within a session and usefulness restricted to minimal principal requirements.* Jansson and Smith (1991): Metric is Originality; Outcome is Ideas; Limitations include penalizing participants who generate more ideas and lack of validation against expert judgments.* Chakrabarti and Khadilkar (2003): Metric is Novelty; Outcome is Products; Limitations include focus on task/function and lack of empirical validation.* Shah, Vargas-Hernandez and Smith (2003): Metrics are Novelty, Variety, Quality, and Quantity; Outcomes are Ideas/concepts; Limitations include novelty metrics not validated against expert judgments.* Saunders and Gero (2004): Metric is Novelty; Outcome is Ideas (Patterns); Limitations include focus on patterns and computational model constraints.* Lopez-Mesa and Vidal (2006): Metric is Novelty (non-obviousness); Outcome is Ideas; Limitations include restriction to function- and structure-level similarity within a session.* Tseng et al. (2008): Metric is Novelty; Outcome is Ideas; Limitations include function similarity focus and lack of expert validation.* Sarkar and Chakrabarti (2007, 2008, 2011): Metrics are Novelty and Usefulness; Outcome is Products; Limitations include novelty based on working principles and usefulness requiring extrapolation.* Srinivasan and Chakrabarti (2010a, b, 2011): Metrics are Novelty, Variety, Quantity, and Fluency; Outcomes are Ideas and concepts; Limitations include novelty based on S A P P h I R E model abstraction levels.* Peeters et al. (2010): Metric is Novelty; Outcome is Ideas; Limitations include restriction to session-generated ideas and lack of expert validation.* Oman et al. (2013): Metrics are Novelty, C C A, and M P C A; Outcome is Ideas; Limitations include function-based novelty and team-specific idea sets.* Grace et al. (2015): Metrics are Novelty, Value, and Surprise; Outcome is Ideas; Limitations include strong data dependency on large datasets.* Ranjan, Siddharth and Chakrabarti (2018): Metrics are Novelty and Requirement Satisfaction (D R S); Outcomes are Ideas and prototypes; Limitations include binary requirement satisfaction.* Jagtap (2019): Metric is Novelty; Outcome is Products; Limitations include novelty limited to function, working principle, and structure.* Singh and Chakrabarti (2025): Metrics are Novelty and Usefulness; Outcome is Problems; Limitations include inability to capture embodied characteristics via semantic textual similarity.
Physical Prototypes section:
* Appearance: Attractiveness, aesthetics, pleasantness.
* Assembly fit: Fit.
* cost: Unit cost, cost of each prototype, optimal cost.
* Ergonomics: Comfort, ease, manual labor required, tremor severity.
* Functionality: Functional testing, functionality, technical quality.
* Maintainability: Maintainability: Ease of maintenance.
* Manufacturability: Manufacturability, implementability, Manufacturing.
* Originality: Uniqueness, originality.
* Part count: Part count, number of parts, complexity: Number of parts.
* Performance: Performance: Task completion time, distance covered and water consumption rate.
* Physical properties: Mass, weight, displacement, stress, fracture load, strength, weight.
* Geometry: Dimensional accuracy, geometry deviations, physical dimensions.
* Time: Lead time, time spent, time to finish.
* User interaction and experience: Ease of use, interaction, overall user experience, usability.
Virtual Prototypes section:
* Appearance: Aesthetic properties, pleasantness/attractiveness.
* Assembly Fit: Assembly operation evaluation, assembly fitness evaluation, ease of insertion.
* Cost: Cost reduction, cost-effectiveness, cost of machining.
* Ergonomics: Posture evaluation index (P E I), rapid upper limb assessment (R U L A).
* Fidelity: Fidelity, consistency.
* Functionality: Task simulation, task support, information availability.
* Geometry: Dimensions, distances and clearances.
* Level of presence: Interaction realism, sense of presence, level of presence, immersion.
* Manufacturability: Number of operations, ease of machining.
* Originality: Uniqueness.
* Part count: Number of items, reduction in scrap parts.
* Performance: Quality prediction accuracy, success rate, completion time.
* Physical properties: Stiffness, materials, material decision influence, torque, strain.
* Time: Timing analysis, build time, time to machine.
* User interaction and experience: Usability, user perception of usefulness, User satisfaction, user preference.
Source: Adopted from Jaiswal and Srinivasan (Reference Jaiswal, Srinivasan, Chakrabarti, Singh, Onkar and Shahid2025a,Reference Jaiswal and Srinivasanb).
Jaiswal & Srinivasan (Reference Jaiswal, Srinivasan, Chakrabarti, Singh, Onkar and Shahid2025a,Reference Jaiswal and Srinivasanb) reported through an empirical study that design practitioners (novice and experienced designers) and faculty members used only a subset of these metrics and evaluation aspects while evaluating prototypes. To bridge this gap and to assist designers in choosing relevant metrics from an encompassing list, a computer-based ‘framework of metrics’ was developed (Jaiswal & Srinivasan Reference Jaiswal and Srinivasan2025c). The computer-based ‘framework of metrics’ allows designers to select: (a) kind of prototype (physical or virtual), (b) prototyping tools and materials (for instance, cardboard, LEGO kits, foam, etc.) and (c) evaluation aspects (for instance, functionality, ergonomics, user interaction and experience, to name a few). Based on these selections, the framework provides the relevant metrics with their details, such as definitions of metrics, their evaluation processes explained with examples, and their original sources. A comparative evaluation, without and with this framework, with novice designers evaluating a given prototype showed that these designers were able to identify a significantly higher number of relevant metrics and evaluation aspects with the framework than without the framework (Jaiswal & Srinivasan Reference Jaiswal and Srinivasan2025c).
2.2. Methods to assess NVC
Multiple methods to assess NVC of design outcomes at various levels of abstraction are proposed in the literature. These are reviewed in this section.
Moss (Reference Moss1966) assessed the creativity of products developed by students through unusualness and usefulness. In this work, Moss means ideas or concepts when referring to ‘products’. Unusualness of a product was defined as ‘the probability of occurrence; the less the probability of an occurrence, the more unusual a product’. To measure unusualness, the frequency of similar products developed by students was compared. Teachers evaluated the number of similar products developed by different students on a 0–3 scale, where 0 represented a product that is very common and 3 represented a product that is extremely new. Here, unusualness was assessed by comparing outcomes generated within a design session and not against a universe of solutions that existed before the session commenced. Usefulness of a product was defined as the ability to ‘satisfy the minimal principal requirements of the problem situation; to some degree it (sic. outcome) must ‘work’ or be potentially workable’. Usefulness was also rated on a 0–3 scale, where 0 signified that the product did not satisfy the principal requirements and 3 signified that it exceeded the minimal principal requirements. A product must meet the minimum principal requirements and be unusual to be considered creative. So, a mathematical product of unusualness and usefulness was considered to assess creativity. The creativity assessment procedure in this paper was demonstrated and validated by the training of teachers (raters) to consistently evaluate the unusualness and usefulness of student products in industrial arts classes. These ratings had a significant correlation with peer (students) and teacher evaluations, thereby corroborating the construct validity and reliability of the unusualness and usefulness ratings.
Jansson & Smith (Reference Jansson and Smith1991) assessed originality based on the ability to measure new and original ideas generated by subjects. The ‘
$ \mathrm{o} $
 ’ score represented the ‘originality’ assessment for each idea and can be calculated using the given formula (see Equation A):

In the scoring system, lower originality ratings were assigned to ideas when multiple participants created identical ones. The originality score became higher when an idea showed distinct differences from other ideas generated by participants. In the assessment of originality, ideas generated within a session were analyzed, not the universe of ideas that existed for the given problem. The final originality score for each subject resulted from dividing their total ‘
$ \mathrm{o} $
 ’ scores by the total number of generated ideas. This way of normalization penalizes subjects who generated more ideas. The use of the metric was demonstrated by applying it to cases involved in experiments to study the effect of design fixation on creative performance.
Chakrabarti & Khadilkar (Reference Chakrabarti and Khadilkar2003) proposed a method to measure novelty of products. This method entailed comparing a given product with existing products that solved the same problem. Novelty was assessed using vertical criteria related to the fundamental characteristics of a product, such as need, task, subsystem structure (principle), technology, sub-technology and implementation, along with horizontal criteria related to a product’s relative importance at the main, supplementary and additional levels. Each difference was rated for novelty based on the weights of vertical and horizontal criteria. The weighting at the vertical level was multiplied by the corresponding horizontal weighting to calculate the novelty value for each difference. This process was then cascaded to continue the weightings from different vertical levels up to the highest level. The novelty values of all the differences were added to obtain a single novelty score for the given product. The method was validated by comparing novelty scores obtained using this method with those from 13 participants (engineers or architects either pursuing or holding a master’s degree) who assessed novelty based on their expertise. It was found that the assessment of these designers matched the scores from the method. In this proposed method, the functionality and structure of a product were used to assess novelty.
Shah, Vargas-Hernandez & Smith (Reference Shah, Vargas-Hernandez and Smith2003) used quantity, quality, novelty and variety as the key indicators of ideation effectiveness. Quantity was taken as the number of ideas generated. Variety was defined as the extent of exploration of a solution space. Novelty of an idea was considered a measure of its unexpectedness with respect to existing ideas. Two approaches were proposed for assessing novelty of an idea: (a) comparing a given idea with the universe of ideas and (b) comparing a given idea with the ideas generated within a design session for a given function. Quality was defined as a measure of feasibility and conformance of ideas to design specifications. Novelty and quality of ideas were assessed by taking into consideration the various abstraction levels (functions, principles and structures) and the importance of functions. Shah, Vargas-Hernandez & Smith (Reference Shah, Vargas-Hernandez and Smith2003) demonstrated the use of metrics by applying them to designs generated in a competition. The novelty metric was calculated by correlating the scores from the proposed method with the peer evaluations of designs by students. The novelty metric comprising the universe of ideas is not demonstrated.
Saunders & Gero (Reference Saunders and Gero2004) used a computational approach to determine the degree to which an agent’s recent experience aligned with its prior observations to gauge how novel or distinct a pattern was. Novelty was assessed using three facets: how frequently an agent observed similar patterns, how closely they matched and how recently those experiences occurred. The computational framework grouped related concepts in a map-like fashion. The ‘distance’ on this map between a novel experience and well-known examples illustrated how unique or unexpected the novel experience was. The novelty of a pattern increased with the distance. The computational framework was also demonstrated to calculate the novelty of patterns by mapping experiences.
Lopez-Mesa & Vidal (Reference Lopez-Mesa and Vidal2006) proposed a method to calculate the novelty scores of solutions at three hierarchical levels: action Function (F), Conceptual Structure (S) and Detail Structure (D). Novelty in the context of this study means the non-obviousness of solutions – that is, how uncommon a solution is with respect to those generated by different teams. Novelty was assessed by comparing the similarity of design solutions generated by different teams. Each solution was denoted as Xy, where ‘X’ and ‘y’ represented a global solution and a specific instance, respectively. To evaluate novelty at the action Function level, the given formula was used: NF,Xy = nF,Xy + 1, where, NF,Xy denoted the total number of teams with similar solutions to Xy at the F level (ranges from 1 to 4 teams), and nF,Xy denoted the number of other teams that generated a similar solution (ranges from 1 to 3). A score of 1 indicated that only one out of four teams produced a specific solution, inferring that the solution was highly unique and so exhibited a high level of novelty. The novelty score decreased as more teams generated similar solutions. A similar procedure was followed to calculate novelty scores at the Conceptual Structure (S) and Detail Structure (D) levels. In the assessment of novelty, only the set of solutions generated in a session was used. Lopez-Mesa & Vidal (Reference Lopez-Mesa and Vidal2006) demonstrated the novelty metric in an experiment involving four teams.
Tseng et al. (Reference Tseng, Moss, Cagan and Kotovsky2008) utilized the ‘originality’ metric proposed by Jansson & Smith (Reference Jansson and Smith1991) to assess the novelty of ideas. The novelty score for a specific participant was calculated by dividing the sum of the ‘n’ scores for that specific participant’s ideas by the total number of ideas generated by that specific participant. The ‘n’ score for each idea was estimated using the following formula (see Equation B):

Tseng et al. (Reference Tseng, Moss, Cagan and Kotovsky2008) seemed to be considering similarity with ideas generated in a session only at the function-level to assess novelty. By using the novelty metric on the participants’ design ideas, this study demonstrated its effectiveness and revealed that higher novelty scores were obtained in situations where information pertinent to the problem was given.
Sarkar & Chakrabarti (Reference Sarkar and Chakrabarti2007, Reference Sarkar and Chakrabarti2011) proposed a method to measure creativity of final products in terms of novelty and usefulness. Novelty was assessed by comparing a given product with existing products in terms of the entities of the function–behavior–structure (FBS) model and the SAPPhIRE (State–Action–Part–Phenomenon–Input–oRgan–Effect) model (Srinivasan & Chakrabarti Reference Srinivasan and Chakrabarti2009). If the functions of a given product differed from existing products, it was considered very highly novel. If the functions were similar, but the structure of the given product differed from existing products, it had some degree of novelty. If the structure of the given product was identical to existing products, the given product had no novelty. To assess other degrees of novelty, the SAPPhIRE model was used. If the given product differed from existing products at the (State change- or Input-) and (Physical Effect- or Phenomenon-) and (Organ- or Part-) levels, it was considered highly novel. If the given product differed at the (Physical Effect- or Phenomenon-) and (Organ- or Part-) levels, it had medium novelty. If the given product differed at the (Organ- or Part-) level, it had low novelty. In this method, novelty was assessed in terms of functionality and structure. Sarkar and Chakrabarti assessed the usefulness of a given product as a mathematical product of its usage, importance, popularity and frequency of use. Here, usefulness was assessed in terms of utility. They proposed creativity of a product as the mathematical product of its novelty and usefulness, as both these entities are needed for creativity. To validate these methods, the scores estimated with the proposed method were compared with the assessments by experienced designers based on their collective intuition, for some products. The findings revealed that Sarkar and Chakrabarti’s method aligned with the collective and intuitive notion of experienced designers. The use of the method to assess novelty and usefulness was demonstrated on ideas. Though the novelty assessment is valid, the assessment of usefulness of ideas based on their utility and this will involve forecasting.
Srinivasan & Chakrabarti (Reference Srinivasan and Chakrabarti2010a,Reference Srinivasan and Chakrabartib) refined the novelty assessment method of Sarkar & Chakrabarti (Reference Sarkar and Chakrabarti2007, Reference Sarkar and Chakrabarti2011) and proposed methods to assess novelty and variety of ideas, concepts, idea-space and concept-space. Ideas were perceived as the constituting elements of concepts. Novelty of a concept was assessed by comparing this concept with the concepts produced earlier in the concept space and the existing products for the given problem. This assessment was in terms of the differences ascertained through the entities of the SAPPhIRE model, which was used to describe the concepts and existing products. Variety of a concept was assessed by comparing the concept with the concepts produced earlier in that concept space and the differences are ascertained in terms of the entities of the SAPPhIRE model; the first concept in a concept space is assigned a variety of 0. Variety of idea-space is ascertained in terms of the weighted sum of (number of ideas-1) at each abstraction level and the weighting of an abstraction level. Their method to assess novelty and variety was demonstrated by applying it to eight problem-solving sessions. Srinivasan & Chakrabarti (Reference Srinivasan and Chakrabarti2011) used novelty, variety, quantity and fluency to assess the impact of a framework for designing developed to improve novelty and variety of concepts and ideas. Quantity was ‘the total number of concepts produced’ and fluency was defined as the ‘ratio of the total number of concepts developed to the time taken to develop these’. Novelty and variety were assessed in terms of the various abstraction levels which can be used to explain the functionality of designs.
Peeters et al. (Reference Peeters, Verhaegen, Vandevenne and Duflou2010) assessed novelty of ideas using a metric that classified ideas into three hierarchical levels: original, adaptive and variant. Original ideas provide unique solutions to problems by the unique arrangement of existing principles, leading to the highest degree of novelty. Adaptive ideas modify parts to meet new design needs while keeping the core solution principles unchanged. Variant ideas differ only in terms of sizes and arrangements of parts and assemblies from existing designs. The overall novelty score for each idea was calculated by evaluating the functions or characteristics it satisfied and weighing these based on their importance in the context of the design problem solved by the idea. The novelty metric was demonstrated in controlled experiments involving the use of an ideation tool.
Oman et al. (Reference Oman, Tumer, Wood and Seepersad2013) proposed comparative creativity assessment (CCA) and multi-point creativity assessment (MPCA) methods. The CCA method assessed how likely each subfunction is to be the only one present in a set of design concepts. In CCA, concepts were dissected into their constituent parts to enable a detailed assessment of creative worth on an elemental basis. The MPCA was developed to provide a detailed and concise method of assessing creativity by having judges evaluate concepts on seven factors that defined creativity. These seven factors are original/unoriginal, well-made/crude, surprising/expected, ordered/disordered, astonishing/common, unique/ordinary and logical/illogical. This method incorporated aspects of NASA’s Task Load Index and the Creative Product Semantic Scale (CPSS) by introducing a rating system that included judges’ preferences for different aspects of creativity. This study used two mechanical engineering student design projects to demonstrate and validate the proposed creativity assessment methods. While some limitations in statistical correlation and interrater reliability were acknowledged, indicating the need for further validation and refinement, the CCA and MPCA methods were used in conjunction with judge ratings to analyze concept creativity, offering insightful information and preliminary evidence of effectiveness.
Grace et al. (Reference Grace, Maher, Fisher and Brady2015) developed and implemented a computational framework for assessing design creativity through novelty, value and surprise. This framework used a clustering algorithm to capture the knowledge structure within a conceptual space of designs, permitting the identification of new designs. Novelty was calculated based on the similarity of a design to prior examples, value was computed based on performance measures or users’ ratings, and surprise was estimated based on predictive models to generate expected distributions over design features. The framework was demonstrated by applying it to a dataset of around 4,000 mobile devices. The results showed the framework’s effectiveness; validation with assessment using human experts is proposed as a future research step.
Ranjan, Siddharth & Chakrabarti (Reference Ranjan, Siddharth and Chakrabarti2018) developed a systematic way of assessing creativity with novelty and requirement satisfaction, with the latter used as a proxy of value. To evaluate novelty and requirement satisfaction of solutions, the method used requirement-solution (RS) pairs as assessment units. Novelty was calculated using the SAPPhIRE model for the selected RS-pair, while requirement satisfaction involved determining the weightage of requirements and their level of fulfillment. The novelty assessment started with the identification of existing designs that are related to a proposed design, followed by a systematic internet search across the different abstraction levels of the SAPPhIRE model for the selected RS-pair. For each abstraction level, the new design was compared with an existing design to identify the key differences. Each identified difference was assessed against a set of criteria, such as functionality, and the novelty score was calculated to reflect how different the proposed design was from existing designs. Degree of requirement satisfaction (DRS) was assessed by decomposing the overall requirements into sub-requirements. Each requirement was assigned a weight to signify its importance, and evaluators rated how well the proposed design fulfilled each requirement on a 2-point scale – 0 (not satisfied) or 1 (satisfied). The individual scores were combined using weighted averages to obtain an overall requirement satisfaction score. By comparing the proposed creativity assessment method’s scores to those of expert judges, the method was shown to have a strong correlation and external validity. It was also demonstrated through case studies and detailed examples that illustrated its use in design.
Jagtap (Reference Jagtap2019) proposed an approach to assess the novelty of products. This approach was claimed to address four shortcomings in the method to assess novelty of Sarkar & Chakrabarti (Reference Sarkar and Chakrabarti2011). The following three modifications focused on the novelty of a given product with respect to existing products that: (a) defined novelty in terms of inputs to assess whether a product has low novelty, (b) defined novelty in terms of inputs and organs or parts to assess whether a given product has medium-low novelty and (c) defined novelty in terms of input and physical effect or physical phenomenon to assess whether a product has medium novelty. The fourth modification stated that a product is not novel if it has the same inputs and organ or parts as existing products. The novelty scores obtained from the proposed method and the method of Sarkar & Chakrabarti (Reference Sarkar and Chakrabarti2011) were compared with the novelty scores assigned by experienced designers to evaluate efficacy. The results validated that the proposed method offered a better means to assess the novelty of products.
Singh & Chakrabarti (Reference Singh and Chakrabarti2025) assessed the creative potential of design problems using novelty and usefulness at the task clarification phase. To assess novelty, the SAPPhIRE abstraction levels are used to find the differences between new problems and existing problems using textual semantic similarity at each abstraction level. To assess the potential usefulness, the parameters such as prevalence, level of importance and frequency are adopted from Sarkar & Chakrabarti (Reference Sarkar and Chakrabarti2011). Then, the overall creative potential of a design problem is calculated as the mathematical product of its novelty and usefulness.
Table 2 shows the comparison of the metrics, assessed design outcomes and key limitations.
Comparison of creativity evaluation methods with respect to indicators, outcomes and limitations
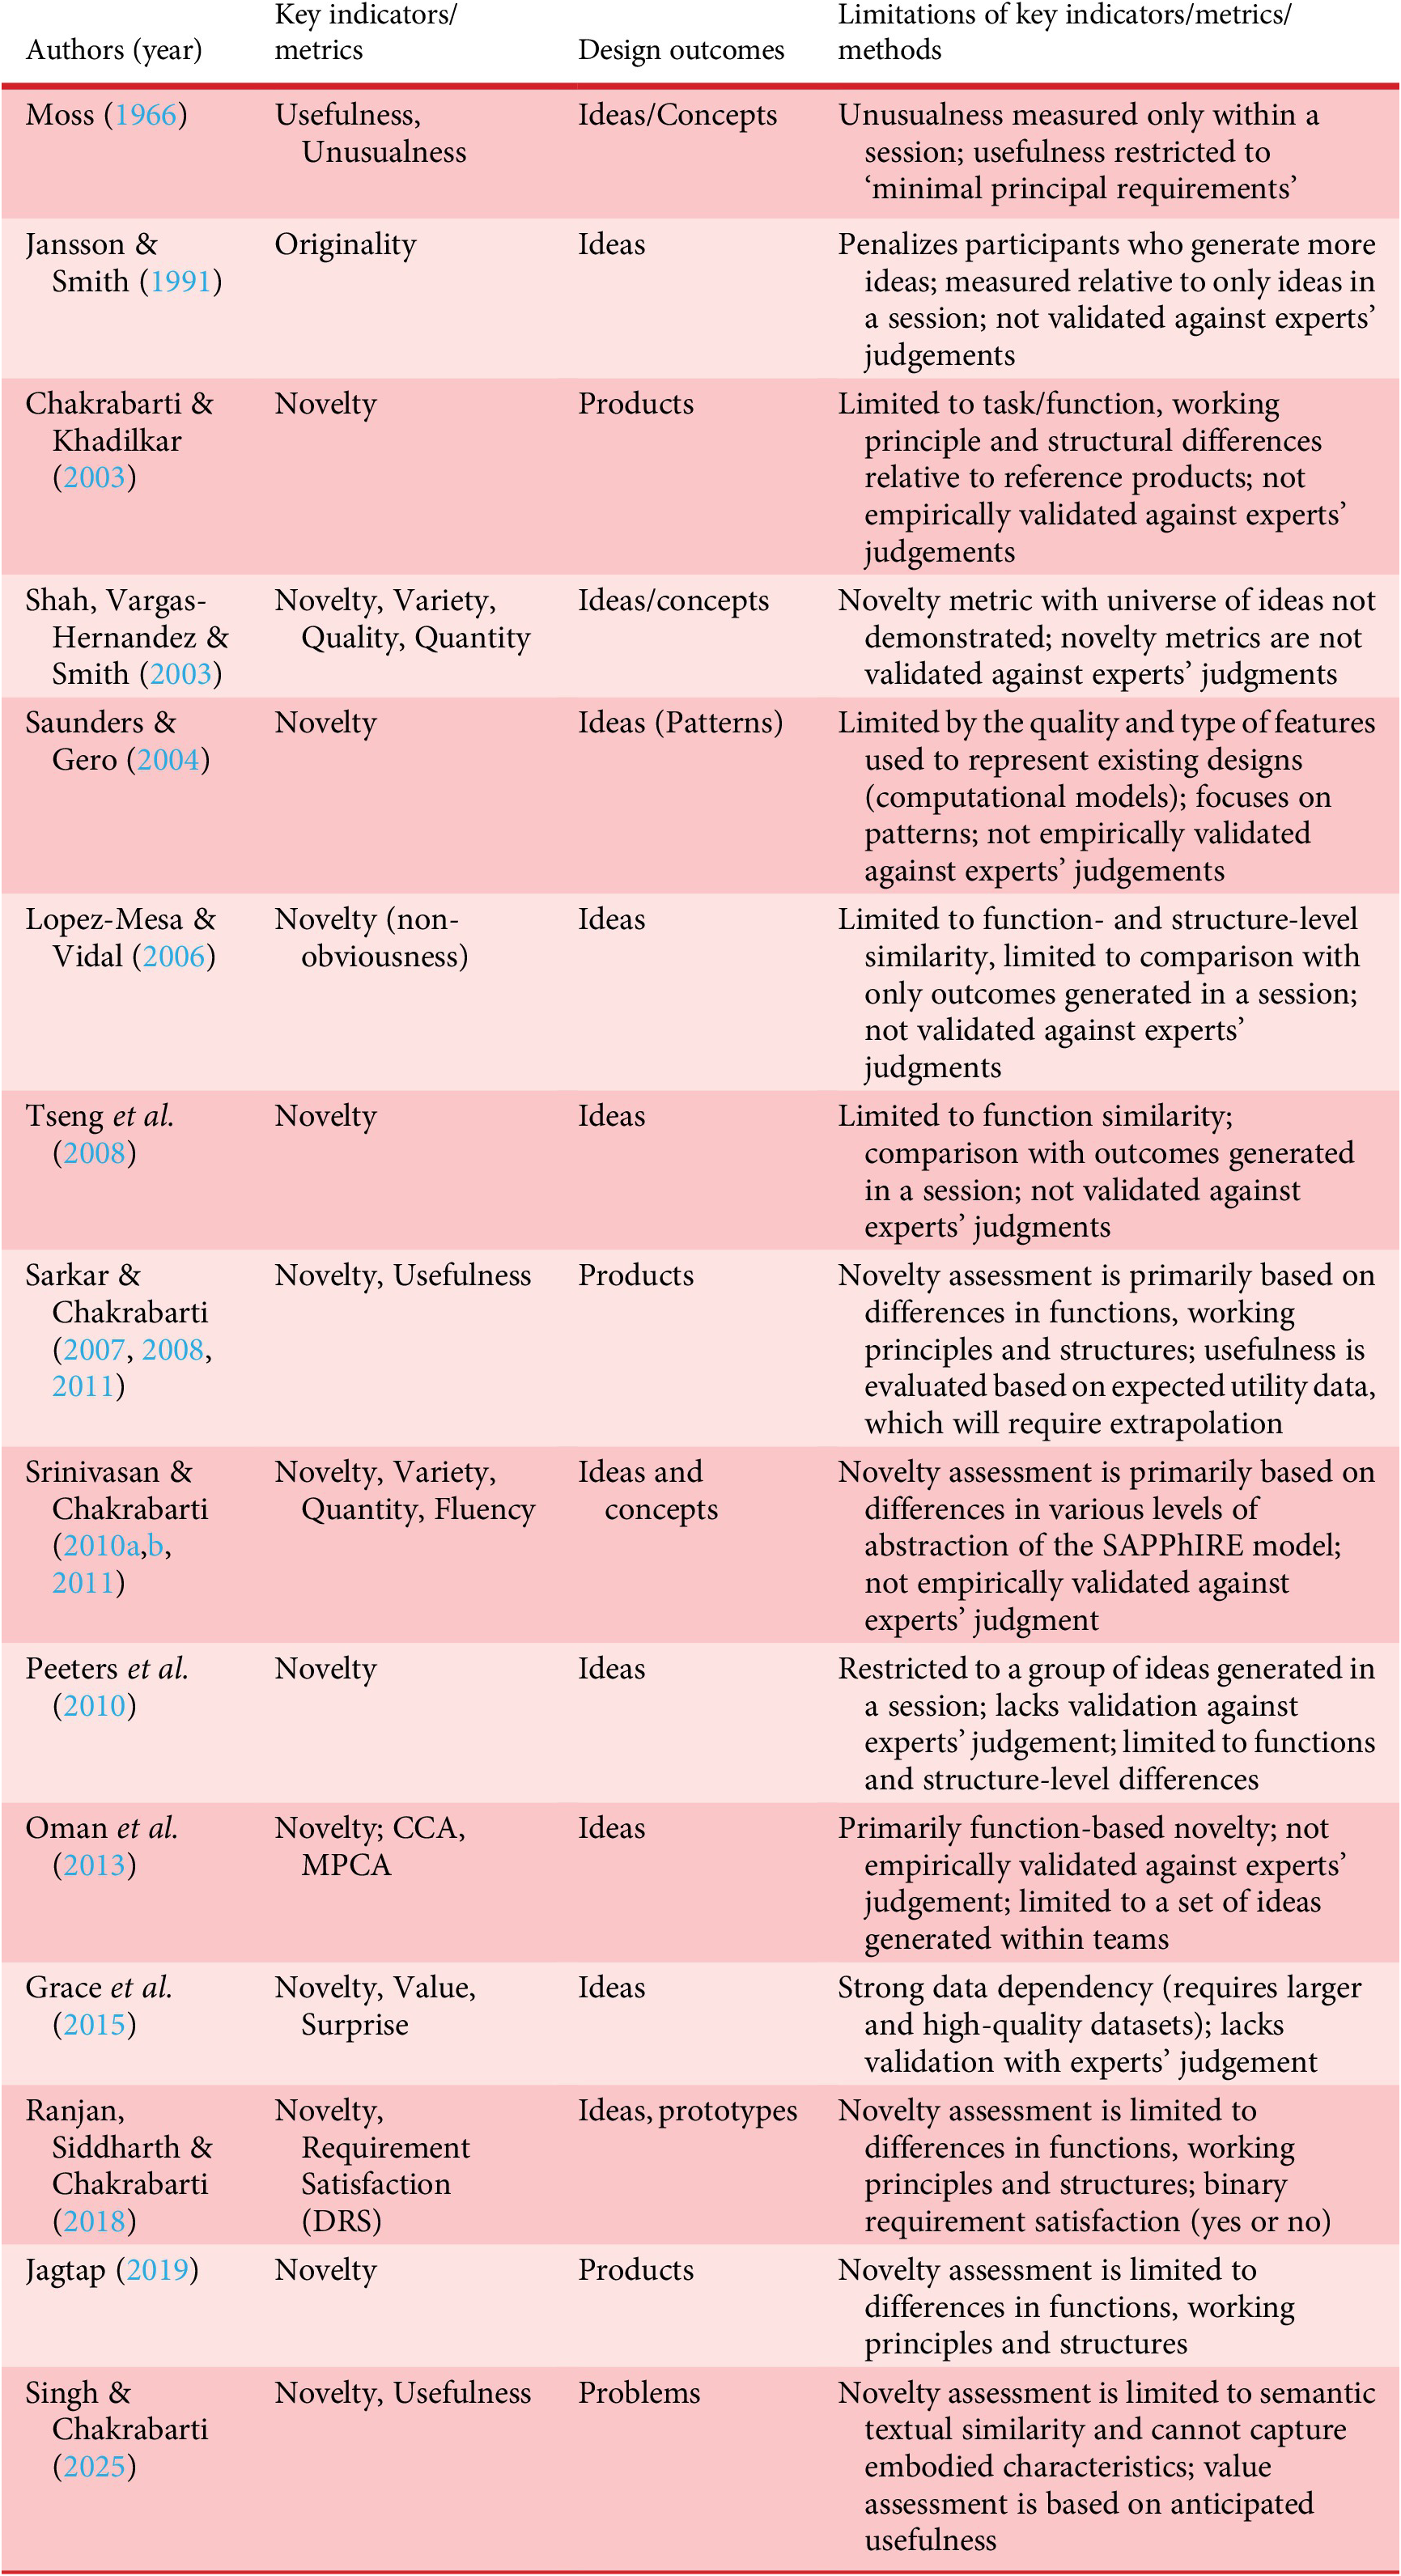
Table 2. Long description
The table consists of four columns: Authors (year), Key indicators/metrics, Design outcomes, and Limitations of key indicators/metrics/methods.
* Moss (1966): Usefulness and Unusualness of ideas/concepts. Limitations include unusualness measured only within a session and usefulness restricted to minimal principal requirements.
* Jansson and Smith (1991): Originality of ideas. Limitations include penalizing participants who generate more ideas and lack of expert validation.
* Chakrabarti and Khadilkar (2003): Novelty of products. Limited to task/function, working principle, and structural differences.
* Shah et al. (2003): Novelty, Variety, Quality, and Quantity of ideas/concepts. Novelty metrics are not validated against expert judgments.
* Saunders and Gero (2004): Novelty of ideas (patterns). Limited by the quality of features used in computational models.
* Lopez-Mesa and Vidal (2006): Novelty (non-obviousness) of ideas. Limited to function- and structure-level similarity within a session.
* Tseng et al. (2008): Novelty of ideas. Limited to function similarity and session-specific outcomes.
* Sarkar and Chakrabarti (2007, 2008, 2011): Novelty and Usefulness of products. Novelty is based on functions and structures; usefulness requires extrapolation.
* Srinivasan and Chakrabarti (2010a, b, 2011): Novelty, Variety, Quantity, and Fluency of ideas and concepts. Based on the S A P P h I R E model abstraction levels.
* Peeters et al. (2010): Novelty of ideas. Restricted to session-specific ideas and lacks expert validation.
* Oman et al. (2013): Novelty, C C A, and M P C A of ideas. Primarily function-based and limited to team-generated ideas.
* Grace et al. (2015): Novelty, Value, and Surprise of ideas. Strong data dependency on large datasets.
* Ranjan et al. (2018): Novelty and Requirement Satisfaction (D R S) of ideas and prototypes. Binary requirement satisfaction.
* Jagtap (2019): Novelty of products. Limited to differences in functions, working principles, and structures.
* Singh and Chakrabarti (2025): Novelty and Usefulness of problems. Novelty is limited to semantic textual similarity and cannot capture embodied characteristics.
2.3. Major findings, identified gaps and objectives
A review of literature on metrics for evaluating physical and virtual prototypes reveals that multiple evaluation aspects and metrics are applicable depending on the type, fidelity and tools used to build a prototype. While some of these metrics may be relevant for assessing ideas or concepts, the limited and abstract nature of design information at the conceptual phase makes it difficult to assess ideas or concepts with these metrics. At this early stage, information on functions, working principles, (preliminary) structure and some requirements are identified. So, assessment of novelty and value is mostly limited to these aspects. During the prototyping phase, new requirements may be identified, the design information gets more detailed and new features emerge. These details enable multiple evaluation aspects – such as assembly fit, ergonomics, user interaction and experience, performance and manufacturability – to become explicit and testable. This increasing maturity of design information makes it viable to characterize NVC in terms of aspect-specific metrics that are pertinent to prototypes, depending on their type, fidelity and tools used to build them.
Multiple methods have been developed to assess NVC of problems, ideas/concepts and products, and in limited cases, both ideas and prototypes. In these methods, prototype-specific aspects are not evaluated. Furthermore, several methods equate novelty with rarity or low frequency of occurrence of ideas within a design, despite the fact that rarity does not necessarily imply conceptual originality or historical novelty. For instance, an idea may be novel in a design session based on its rarity, but it does not mean this idea is novel in comparison to the universe of existing ideas for that problem. Similarly, value or usefulness assessment is often restricted or indirect. For example, Sarkar & Chakrabarti (Reference Sarkar and Chakrabarti2011) rely on usage-related parameters that require extrapolation for ideas and concepts; and Ranjan, Siddharth & Chakrabarti (Reference Ranjan, Siddharth and Chakrabarti2018) employ binary satisfaction scoring. Most methods provide single aggregate NVC scores, offering limited investigative insight. These methods indicate the overall novelty or value but do not reveal which specific aspects of an outcome are novel, valuable or creative. Another major limitation of many methods is the lack of validation for reliability or effectiveness. Many existing methods may be adaptive enough to assess NVC of prototypes, but their potency has not been demonstrated or empirically validated yet.
To the best of our knowledge, existing work does not comprehensively assess NVC using prototype-related metrics that span multiple aspects. Therefore, the work proposed in this paper contributes toward addressing this limitation by developing a method to assess the novelty and value of prototypes using evaluation aspects and metrics that are specific to prototypes. In the proposed method, attention is paid to the features embodied in prototypes, rather than assessing underlying concepts independently of their materialization. The specific objectives of this research are as follows:
-
1. to develop a method to assess novelty and value of prototypes, and from these to calculate their creativity, by incorporating multiple, relevant aspects and metrics,
-
2. to demonstrate the application of the method, and
-
3. to validate the method for its precision, reliability and effectiveness.
3. Development of method
In this section, the development of a method to assess the novelty and value of prototypes, and from these the calculation of their creativity, is described. This method is divided into three parts: novelty assessment, value assessment and creativity calculation.
3.1. Novelty assessment
In design processes, (some) requirements are identified, and their relative importance ascertained before developing any solutions (ideas, concepts, prototypes, etc.). Requirements and their relative importance are used in the assessment of novelty and value. The following are the steps in the assessment of novelty:
-
Step 1: Identify requirements that are pertinent to a given prototype.
-
Step 2: Identify the various evaluation aspects of the prototype from the requirements in Step 1. Each evaluation aspect considers a unique facet of the prototype being assessed, and so contributes to NVC. The framework of metrics in Jaiswal & Srinivasan (Reference Jaiswal and Srinivasan2025c) contains a checklist of evaluation aspects for physical and virtual prototypes, and so can help identify the relevant evaluation aspects from the pertinent requirements. Each evaluation aspect is assigned a weighting ( $ {\mathrm{W}}_{\mathrm{ea}} $
 ) by the evaluators depending on their relative importance to the problem. The weightings are assigned so that the sum of weightings is 1, to normalize the calculation (see Equation 1).


where ‘ea’ represents an evaluation aspect and ‘EA’ represents the total number of evaluation aspects, and ‘
$ {\mathrm{W}}_{\mathrm{ea}} $
 ’ represents the weighting of an evaluation aspect ‘ea’.
-
Step 3: For each evaluation aspect, identify relevant metrics. Metrics of an evaluation aspect are observable or measurable characteristics related to the evaluation aspect and help in the assessment of prototypes. The framework of metrics in Jaiswal & Srinivasan (Reference Jaiswal and Srinivasan2025c) contains various metrics linked to evaluation aspects, and so, this framework can also help identify the relevant metrics for the given evaluation aspects. For each metric within an evaluation aspect, assign a weighting ( $ {\mathrm{W}}_{\mathrm{ea},\mathrm{m}} $
) according to its relative importance. The weightings are assigned to the metrics within an evaluation aspect such that the sum of weightings is 1, to normalize the calculation (see Equation 2).


where ‘m’ represents a metric within an evaluation aspect ‘ea’, ‘Wea,m’ represents the weighting of the mth metric under evaluation aspect ‘ea’ and ‘Mea’ represents the total number of metrics within an evaluation aspect ‘ea’.
-
Step 4: Novelty is the degree of difference of a given prototype from existing products that solve the same problem, from the perspective of the identified evaluation aspects and metrics. These differences are assessed by comparing the given prototype with the existing products one after another, from the perspective of the identified metrics. These differences are measured on a 3-point (0–2) scale, where 0 represents no differences, 1 represents minor differences and 2 represents major differences. Existing products for a given problem can be identified, for instance, using patent repositories and product catalogues. If there are ‘e’ number of existing products, there will be ‘e’ comparisons of the given prototype with the existing products for a metric, resulting in as many difference scores. The novelty score of the given prototype for a metric of an evaluation aspect will be the minimum value among these difference scores (see Equation 3). The minimum value is chosen because the minimum difference score corresponds to the greatest differences between the given prototype and an existing product.

where ‘
$ {\mathrm{D}}_{\mathrm{ea},\mathrm{m},1} $
 ’ represents the difference score obtained by comparing the given prototype with the first existing product from the perspective of a metric ‘
$ \mathrm{m} $
 ’ within an evaluation aspect ‘e
$ \mathrm{a} $
 ,’ ‘
$ {\mathrm{D}}_{\mathrm{ea},\mathrm{m},\mathrm{e}} $
 ’ represents the difference score obtained by comparing the given prototype with the eth existing product from the perspective of a metric ‘m’ within an evaluation aspect ‘ea,’ and ‘
$ {\mathrm{N}}_{\mathrm{ea},\mathrm{m}} $
 ’ represents the novelty of the given prototype for metric ‘m’ and evaluation aspect ‘ea’.
-
Step 5: Novelty of an evaluation aspect ( $ {\mathrm{N}}_{\mathrm{ea}} $
) is calculated as a weighted sum of the novelty scores (
$ {\mathrm{N}}_{\mathrm{ea},\mathrm{m}} $
) of all the metrics ‘Mea’ that belong to an evaluation aspect ‘ea’ (see Equation 4).


-
Step 6: The overall novelty ( $ {\mathrm{N}}_{\mathrm{overall}} $
) of the given prototype is calculated as a weighted sum of the novelty scores of all the evaluation aspects ‘EA’ (see Equation 5).


3.2. Value assessment
The following are the various steps in the assessment of the value of a given prototype.
-
Steps 1–3: Same as in the assessment of novelty. (see Section 3.1).
-
Step 4: Value is estimated as the degree of fulfillment of a given prototype to its requirements. The degree of conformance is assessed on a 3-point (0–2) scale, from the perspective of the metrics. A score of 0, 1 and 2 indicates that a requirement is not fulfilled, partially fulfilled and fulfilled, respectively (see Equation 6).

where Vea,m represents the value of the given prototype for a metric ‘m’ under evaluation aspect ‘ea’.
-
Step 5: The value ( $ {\mathrm{V}}_{\mathrm{ea}} $
) of the prototype for an evaluation aspect ‘ea’ is calculated as the weighted sum of value of the prototype for all the metrics ‘Mea’ under an evaluation aspect ‘ea’ (see Equation 7).


-
Step 6: The overall value score ( $ {\mathrm{V}}_{\mathrm{overall}} $
) of the given prototype is calculated as a weighted sum of the value scores of all the evaluation aspects ‘EA’ (see Equation 8).


3.3. Creativity calculation
Creativity of a design outcome is calculated as the mathematical product of its novelty and value, as advocated by Sarkar & Chakrabarti (Reference Sarkar and Chakrabarti2011). This ensures that for an outcome to be considered creative, it is novel and valuable. Creativity (C) of the given prototype is calculated as (see Equation 9):

Creativity from the perspective of an evaluation aspect or a metric can also be calculated by multiplying the novelty and value of an evaluation aspect (see Equation 10) or a metric (see Equation 11).


4. Application of method
To demonstrate the application of the proposed method, a set of functional prototypes developed in a course called ‘Engineering for Designers’ is assessed for novelty and value, and creativity is calculated from these assessments. This semester-long course runs during July–November with an emphasis on theory and practical application of: (a) engineering mechanisms, (b) basics of electrical and electronics engineering and (c) AI in design, through project-based learning. The course includes 4 teams (T1–T4) comprising 5 second-year undergraduate (Bachelor of Design) students each. The student participants are enrolled in a design program that imparts training in product design, interaction design and communication design. These students have completed courses on design processes, prototype development and testing prior to this course. As part of the course, the students are tasked with designing, developing and demonstrating a functional prototype of a novel ride in an amusement park. The students are provided with some initial needs: (a) suitable for people >12 years, (b) comply with safety for all kinds of users, (c) accommodate only users; users’ belongings (wallet/purse, phone, camera, etc.) are not allowed and (d) fun, amusement and immersion in a theme are not ignored. The tasks for this course project include defining a theme for the amusement park ride, identifying requirements, generating at least 20 concepts (sketches with annotations), evaluating the solutions and selecting the best solution(s), followed by developing, testing and demonstrating a functional prototype of the selected solution. Each team is provided with a LEGO Mindstorm Robotics kit and is also allowed to use additional resources such as Arduino, motors and structural members (by developing CAD models and 3D printing them) for building their prototype. The teams are given 1 month to complete these tasks and are instructed to document the outcome of the design process. The purpose of the course project is to assess whether the students are able to apply the contents taught in the course to design and prototype functional systems. The proposed method in the paper is developed after the culmination of the project, and the students are not informed of the specific systems used for benchmarking but are free to explore literature and the Internet to identify existing solutions to the given problem and identify their pros and cons before generating ideas/concepts for the problem. Their outputs in the course project are rated on different parameters (diversity and quantity of conceptual solutions and performance of prototypes). These metrics are communicated before their project commences.
The functional prototypes (P1–P4) (see Figure 1) developed by the teams (T1–T4) are demonstrated and tested as part of the final evaluation. The descriptions of the prototypes are as follows: (a) Prototype 1 (P1), named ‘Archimedes Trammel’, is a three-track oscillating system of cars that move in sync with each other, seemingly about to collide but missing at the last moment, (b) Prototype 2 (P2), named ‘Gear of Tear’, is two inclining gears that move the seats forward while rotating them simultaneously, (c) Prototype 3 (P3), named ‘Randomized Maze’, where the whole maze changes when pressure sensors are activated; the walls appear and disappear, causing a sense of being lost and (d) Prototype 4 (P4) where retracting motion makes a bouncing effect to increase interactivity with the elements, making the ride exciting with multiple degrees of movement to increase unpredictability.
Prototypes developed by T1–T4 for a course design project.

The novelty and value of the functional prototypes (P1–P4) are assessed by the first author using the proposed method, and from these, their creativity is calculated. The following tasks are undertaken: (a) identification of requirements pertinent to the developed prototypes and assignment of importance to the requirements, (b) identification of evaluation aspects from these requirements, (c) identification of evaluation metrics from these aspects, (d) assignment of weights to the evaluation aspects and metrics, (e) assessment of differences between the developed prototypes and existing products and (f) degree of conformance to requirements, based on his knowledge and understanding of the prototype, the need of the problem and the design process undertaken by the students in the course. The first author worked as a Teaching Assistant in this course. He holds a Bachelor’s degree in Mechanical Engineering and a Master’s degree in Computer-Aided Design, Manufacturing and Automation, with 5+ years of experience in engineering and product design.
Steps 1–3 are the same for both novelty and value assessment.
-
Step 1: The pertinent requirements and their importance are identified for the prototypes (P1–P4) (see Table 3).
-
Step 2: The evaluation aspects of the prototypes (P1–P4) and their weights are determined from the identified requirements (see Table 4). The rationale for the weights is provided through justifications.
-
Step 3: The evaluation metrics and their weights are determined from the identified evaluation aspects. The justifications for the weights are also provided (see Table 5).
Table 3.Identified requirements and their importance
Table 3. Long description
The table consists of three columns: Requirement, Importance, and Justification.
* R sub 1: Attain intended motion effectively. Importance: 0.3. Justification: Ensures the prototype delivers the required ride motion.
* R sub 2: Provide feasible and controlled motion. Importance: 0.2. Justification: Ensures motion can be recognized and safely controlled.
* R sub 3: Provide enough motion performance. Importance: 0.2. Justification: Covers motion intensity appropriate to ride.
* R sub 4: Ensure minimum risks with maximum safety. Importance: 0.15. Justification: Important for user trust.
* R sub 5: Be comfortable and easy to use. Importance: 0.1. Justification: Important for user trust.
* R sub 6: Deliver a thrilling, enjoyable and immersive experience. Importance: 0.05. Justification: Important for user satisfaction and experience.
Table 4.Identified evaluation aspects and their weights
Table 4. Long description
The table consists of four columns: Evaluation aspect (E A), Requirement, Weight, and Justification.
* Row 1: E A sub 1: Performance. Requirements include Intended motion (R sub 1), feasible and controlled motion (R sub 2), and motion performance (R sub 3). Weight is 0.5. Justification: Motion supports the ride experience.
* Row 2: E A sub 2: Ergonomics. Requirements include Safety (R sub 4), comfort and ease of use (R sub 5). Weight is 0.3. Justification: Confirms overall users’ safety.
* Row 3: E A sub 3: User interaction and experience. Requirements include Thrill, enjoyment, immersiveness (R sub 6). Weight is 0.2. Justification: Increases user satisfaction and experience.
Table 5.Identified metrics and their weights.
Table 5. Long description
The table consists of four rows of data under four headers.
* Row 1: Metric M sub 1,1 is Velocity. Evaluation aspect is Performance E A sub 1. Weight is 1.0. Justification: Represents motion intensity and performance.
* Row 2: Metric M sub 2,1 is Safety. Evaluation aspect is Ergonomics E A sub 2. Weight is 0.7. Justification: Risk minimization is important.
* Row 3: Metric M sub 2,2 is Comfort. Evaluation aspect is Ergonomics E A sub 2. Weight is 0.3. Justification: Minor but still important.
* Row 4: Metric M sub 3,1 is Fun or Amusement. Evaluation aspect is User interaction and Experience E A sub 3. Weight is 1.0. Justification: Increases user satisfaction and experience.


4.1. Novelty assessment for P1–P4
-
Step 4: The novelty of each prototype (P1–P4) is estimated in relation to the existing amusement park rides. In this research, three existing rides (ER), namely roller coasters (ER1), Ferris wheels (ER2) and carousels (ER3), are considered. The descriptions of the existing rides are gathered from the internet (“Amusement Park Physics – Carousel” n.d.; “Ferris Wheel - Customized Heights | Cabins | Lightings” n.d.; “How Carousel Is Made – History, Used, Parts, Structure, Product, Industry, Machine” n.d.; “How Roller Coasters Work: A Thrilling Journey” n.d.; “Roller Coaster Safety Features: A Deep Dive” n.d.; “Safety Mechanisms Of Ferris Wheels: A Closer Look – Crivva” n.d.). This set of existing rides is not exhaustive. Evaluators can systematically search for existing products using relevant keywords in patent repositories and product catalogues. The intention of this section is to demonstrate the proposed method by selecting a few existing products and then applying the method. The description of the prototypes from the teams’ documentation and the prototypes are used to identify the various features in the prototypes. The features of the existing rides and the developed prototypes are compared from the perspectives of the identified metrics (see Table 6).
Comparison of three existing rides with developed prototypes w.r.t. identified metrics

Table 6. Long description
The table consists of five columns and eight rows.
Column headers from left to right are: Rides and prototypes, Velocity, Safety, Comfort, and Fun/amusement.
Row 1: Roller coaster (E R sub 1). Velocity: Very high. Safety: Requires chains, controlled speeds. Comfort: Chains can be tight; strong movements cause strain. Fun/amusement: Adrenaline rush, exciting elements.
Row 2: Ferris wheel (E R sub 2). Velocity: Low. Safety: Slow speed, covered cabins, emergency stop arrangements. Comfort: Spacious cabins, smooth motion. Fun/amusement: Calming, great views, not very exciting.
Row 3: Carousel (E R sub 3). Velocity: Low-medium. Safety: Calm ride with safety belts. Comfort: Relaxed seating, smooth drive. Fun/amusement: Amusing, visually attractive, family-friendly.
Row 4: P sub 1. Velocity: Medium. Safety: Steady base with safety belts. Comfort: Anticipates better comfort and user ergonomics. Fun/amusement: Immersive experiences using heights, speed, lights and music.
Row 5: P sub 2. Velocity: Medium-high. Safety: Stable seats with uniformly spread loads. Comfort: Enfolded cabins and controlled acceleration. Fun/amusement: Height-based thrill, scenic views.
Row 6: P sub 3. Velocity: Low. Safety: Movement at user’s own pace; minimizes risks. Comfort: Navigating across the maze requires walking/running. Fun/amusement: Engaging and interactive.
Row 7: P sub 4. Velocity: Medium. Safety: Controlled motion within a protected environment. Comfort: Slight vibrations. Fun/amusement: Engaging, focused on unique movement than thrill.
The differences between the existing rides and the developed prototypes from the perspective of the metrics are assessed on a 3-point scale (0–2). Each prototype (P1–P4) is compared individually against all the three rides (ER1–ER3) for each metric in Table 5: M1,1, M2,1, M2,2, M3,1. Table 7 outlines the differences by comparing P1 with ER1–ER3 for M1,1, M2,1, M2,2 and M3,1, with justifications that are enclosed in brackets.
Differences between P1 and existing rides from the metrics’ perspective

Table 7. Long description
The table consists of four columns and five rows. The header row contains the column labels M, E R sub 1, E R sub 2, and E R sub 3.
Row 2: Metric M sub 1,1. E R sub 1 is 1 (slower). E R sub 2 is 1 (faster). E R sub 3 is 1 (more dynamic).
Row 3: Metric M sub 2,1. E R sub 1 is 1 (less restrictive but with safety belts). E R sub 2 is 1 (more motion-based risks). E R sub 3 is 1 (comparable protection).
Row 4: Metric M sub 2,2. E R sub 1 is 1 (less intense). E R sub 2 is 0 (similar cabins). E R sub 3 is 1 (more structured).
Row 5: Metric M sub 3,1. E R sub 1 is 2 (more immersive with lights and music). E R sub 2 is 2 (more engaging). E R sub 3 is 2 (sufficiently more thrilling).
Table 8 outlines the differences by comparing P2 with ER1–ER3 for M1,1, M2,1, M2,2 and M3,1.
Differences between P2 and existing rides

Table 8. Long description
The table consists of four columns and five rows.
Header Row: The first column is labeled M. The subsequent columns are E R sub 1, E R sub 2, and E R sub 3.
Row 2: M sub 1,1. E R sub 1 is 1 (slower). E R sub 2 is 2 (much faster). E R sub 3 is 1 (faster).
Row 3: M sub 2,1. E R sub 1 is 2 (more safety with controlled motion). E R sub 2 is 0 (similar cabins and seats). E R sub 3 is 1 (extra protection).
Row 4: M sub 2,2. E R sub 1 is 1 (less intense). E R sub 2 is 0 (similar cabins). E R sub 3 is 1 (different, not greater).
Row 5: M sub 3,1. E R sub 1 is 1 (less intense). E R sub 2 is 0 (similar experience). E R sub 3 is 2 (more intense).
Table 9 outlines the differences by comparing P3 with ER1–ER3 for M1,1, M2,1, M2,2 and M3,1.
Difference score between P3 and existing rides

Table 9. Long description
The table consists of four columns and five rows including the header.
Header Row: The first column is labeled M. The second, third, and fourth columns are labeled E R sub 1, E R sub 2, and E R sub 3 respectively.
Row 2 (Metric M sub 1,1):
- E R sub 1: 2 (walking vs. ride speed)
- E R sub 2: 2 (fundamentally different)
- E R sub 3: 2 (no ride-induced velocity)
Row 3 (Metric M sub 2,1):
- E R sub 1: 2 (self-movement eliminates rides)
- E R sub 2: 2 (less control but has less risk)
- E R sub 3: 2 (more safety)
Row 4 (Metric M sub 2,2):
- E R sub 1: 1 (requires navigation)
- E R sub 2: 1 (more effort)
- E R sub 3: 1 (similar but engaging)
Row 5 (Metric M sub 3,1):
- E R sub 1: 2 (interactive and engaging)
- E R sub 2: 2 (more dynamic)
- E R sub 3: 2 (sufficiently immersive)
Table 10 outlines the differences by comparing P4 with ER1–ER3 for M1,1, M2,1, M2,2 and M3,1.
Difference score between P4 and existing rides

Table 10. Long description
The table consists of four columns and five rows. The header row contains the column labels M, E R sub 1, E R sub 2, and E R sub 3.
Row 1: M sub 1,1 is compared against E R sub 1 as 1 slower, E R sub 2 as 1 faster, and E R sub 3 as 1 more dynamic.
Row 2: M sub 2,1 is compared against E R sub 1 as 1 controlled motion and safe, E R sub 2 as 1 similar, and E R sub 3 as 1 more safety.
Row 3: M sub 2,2 is compared against E R sub 1 as 1 less intense with some vibrations, E R sub 2 as 1 less smooth, and E R sub 3 as 1 structured but similar.
Row 4: M sub 3,1 is compared against E R sub 1 as 1 engaging but not as thrilling, E R sub 2 as 1 unique movement, and E R sub 3 as 1 engaging but similar.
The novelty score from the perspective of metrics M1,1, M2,1, M2,2 and M3,1 for P1–P4 is the minimum value among these scores of differences (see Table 11). The novelty of P1 from the perspective of M1,1 is 1, which is the minimum among (1, 1, 1) (see Table 7).
-
Step 5: Novelty from the perspective of the evaluation aspect (EA1–EA3) is calculated as a weighted sum of the novelty scores of all the respective metrics (M1,1, M2,1, M2,2 and M3,1).
Novelty of P1–P4 from metrics perspective (M1,1, M2,1, M2,2 and M3,1)

Table 11. Long description
The table consists of five columns and five rows.
Header Row: The first column is labeled M. The subsequent columns are labeled P sub 1, P sub 2, P sub 3, and P sub 4.
Row 2: Metric M sub 1,1 has values of 1 for P sub 1, 1 for P sub 2, 2 for P sub 3, and 1 for P sub 4.
Row 3: Metric M sub 2,1 has values of 1 for P sub 1, 0 for P sub 2, 2 for P sub 3, and 1 for P sub 4.
Row 4: Metric M sub 2,2 has values of 0 for P sub 1, 0 for P sub 2, 1 for P sub 3, and 1 for P sub 4.
Row 5: Metric M sub 3,1 has values of 2 for P sub 1, 0 for P sub 2, 2 for P sub 3, and 1 for P sub 4.
For P 1 :
-
NEA1-P1 = (WM1,1 × NM1,1-P1) = (1 × 1) = 1
-
NEA2-P1 = (WM2,1 × NM2,1-P1) + (WM2,2 × NM2,2-P1) = (0.7 × 1) + (0.3 × 0) = 0.7
-
NEA3-P1 = (WM3,1 × NM3,1-P1) = (1 × 2) = 2
For P 2 :
-
NEA1-P2 = (WM1,1 × NM1,1-P2) = (1 × 1) = 1
-
NEA2-P2 = (WM2,1 × NM2,1-P2) + (WM2,2 × NM2,2-P2) = (0.7 × 0) + (0.3 × 0) = 0
-
NEA3-P2 = (WM3,1 × NM3,1-P2) = (1 × 0) = 0
For P 3 :
-
NEA1-P3 = (WM1,1 × NM1,1-P3) = (1 × 2) = 2
-
NEA2-P3 = (WM2,1 × NM2,1-P3) + (WM2,2 × NM2,2-P3) = (0.7 × 2) + (0.3 × 1) = 1.7
-
NEA3-P3 = (WM3,1 × NM3,1-P3) = (1 × 2) = 2
For P 4 :
-
NEA1-P4 = (WM1,1 × NM1,1-P4) = (1 × 1) = 1
-
NEA2-P4 = (WM2,1 × NM2,1-P4) + (WM2,2 × NM2,2-P4) = (0.7 × 1) + (0.3 × 1) = 1
-
NEA3-P4 = (WM3,1 × NM3,1-P4) = (1 × 1) = 1
-
Step 6: The overall novelty of P1–P4 is calculated as a weighted sum of the novelty scores of all the evaluation aspects (EA1–EA3).
-
N overall-P1 = (WEA1 × NEA1-P1) + (WEA2 × NEA2-P1) + (WEA3 × NEA3-P1) = (0.5 × 1) + (0.3 × 0.7) + (0.2 × 2) = 1.11
-
N overall-P2 = (WEA1 × NEA1-P2) + (WEA2 × NEA2-P2) + (WEA3 × NEA3-P2) = (0.5 × 1) + (0.3 × 0) + (0.2 × 0) = 0.5
-
N overall-P3 = (WEA1 × NEA1-P3) + (WEA2 × NEA2-P3) + (WEA3 × NEA3-P3) = (0.5 × 2) + (0.3 × 1.7) + (0.2 × 2) = 1.91
-
N overall-P4 = (WEA1 × NEA1-P4) + (WEA2 × NEA2-P4) + (WEA3 × NEA3-P4) = (0.5 × 1) + (0.3 × 1) + (0.2 × 1) = 1
4.2. Value assessment for P1–P4
-
Step 4: The degree of conformance to the requirements of each prototype (P1–P4) is estimated on a 3-point (0–2) scale, from the perspective of each identified metric (M1,1, M2,1, M2,2 and M3,1) (see Table 12).
-
Step 5: The value of each prototype (P1–P4) for each evaluation aspect (EA1–EA3) is calculated as the weighted sum of the value of the prototype for each metric (M1,1, M2,1, M2,2 and M3,1) under the respective evaluation aspect.
Value score for P1–P4 from metrics’ perspective

Table 12. Long description
The table consists of five columns and five rows. The header row lists the metric column M followed by parameters P sub 1, P sub 2, P sub 3, and P sub 4.
Row 1: Metric M sub 1,1. P sub 1 is 2 (planned motion intensity). P sub 2 is 2 (medium-high speed motion). P sub 3 is 1 (user-paced motion). P sub 4 is 2 (dynamic motion effects).
Row 2: Metric M sub 2,1. P sub 1 is 2 (stable base with safety belts). P sub 2 is 2 (balanced seats with equally distributed loads, enclosed cabins). P sub 3 is 2 (minimum risks with self-paced motion). P sub 4 is 2 (controllable motion within protected settings).
Row 3: Metric M sub 2,2. P sub 1 is 1 (expected better comfort). P sub 2 is 2 (enclosed cabins with controlled acceleration). P sub 3 is 1 (requires walking/running, not comfortable). P sub 4 is 1 (less comfort due to vibrations).
Row 4: Metric M sub 3,1. P sub 1 is 2 (immersive experiences with speed, lights and music). P sub 2 is 1 (height-based thrill but limited). P sub 3 is 2 (engaging and interactive). P sub 4 is 1 (more motion than thrill).
For P 1 :
-
VEA1 = (WM1,1 × VM1,1-P1) = (1 × 2) = 2
-
VEA2 = (WM2,1 × VM2,1-P1) + (WM2,2 × VM2,2-P1) = (0.7 × 2) + (0.3 × 1) = 1.7
-
VEA3 = (WM3,1 × VM3,1-P1) = (1 × 2) = 2
For P 2 :
-
VEA1 = (WM1,1 × VM1,1-P2) = (1 × 2) = 2
-
VEA2 = (WM2,1 × VM2,1-P2) + (WM2,2 × VM2,2-P2) = (0.7 × 2) + (0.3 × 2) = 2
-
VEA3 = (WM3,1 × VM3,1-P2) = (1 × 1) = 1
For P 3 :
-
VEA1 = (WM1,1 × VM1,1-P3) = (1 × 1) = 1
-
VEA2 = (WM2,1 × VM2,1-P3) + (WM2,2 × VM2,2-P3) = (0.7 × 2) + (0.3 × 1) = 1.7
-
VEA3 = (WM3,1 × VM3,1-P3) = (1 × 2) = 2
For P 4 :
-
VEA1 = (WM1,1 × VM1,1-P4) = (1 × 2) = 2
-
VEA2 = (WM2,1 × VM2,1-P4) + (WM2,2 × VM2,2-P4) = (0.7 × 2) + (0.3 × 1) = 1.7
-
VEA3 = (WM3,1 × VM3,1-P4) = (1 × 1) = 1
-
Step 6: The overall value of P1–P4 is calculated as a weighted sum of the value scores of all the evaluation aspects (EA1–EA3).
-
V overall-P1 = (WEA1 × VEA1-P1) + (WEA2 × VEA2-P1) + (WEA3 × VEA3-P1) = (0.5 × 2) + (0.3 × 1.7) + (0.2 × 2) = 1.91
-
V overall-P2 = (WEA1 × VEA1-P2) + (WEA2 × VEA2-P2) + (WEA3 × VEA3-P2) = (0.5 × 2) + (0.3 × 2) + (0.2 × 1) = 1.8
-
V overall-P3 = (WEA1 × VEA1-P3) + (WEA2 × VEA2-P3) + (WEA3 × VEA3-P3) = (0.5 × 1) + (0.3 × 1.7) + (0.2 x 2) = 1.41
-
V overall-P4 = (WEA1 × VEA1-P4) + (WEA2 × VEA2-P4) + (WEA3 × VEA3-P4) = (0.5 × 2) + (0.3 × 1.7) + (0.2 × 1) = 1.71
4.3. Creativity calculation for P1–P4
The overall creativity of P1–P4 is given below:
-
C P1 = Noverall-P1 × Voverall-P1 = 1.11 × 1.91 = 2.12
-
C P2 = Noverall-P2 × Voverall-P2 = 0.5 × 1.8 = 0.9
-
C P3 = Noverall-P3 × Voverall-P3 = 1.91 × 1.41 = 2.69
-
C P4 = Noverall-P4 × Voverall-P4 = 1 × 1.71 = 1.71
5. Validation of method
The proposed method is validated for its precision, reliability and effectiveness. Precision is defined as the degree of closeness of the values of NVC of a given prototype for a given problem as estimated by the method when multiple people apply this method. Reliability is defined as a measure of the trustworthiness of the values of NVC of a prototype for a given problem. It is estimated by comparing the scores from the proposed method for a given prototype when a trained person uses it with the scores estimated by experienced designers based on their experience and intuition. Effectiveness is defined as a measure of the performance of the method, assessed by comparing the values of NVC of a prototype obtained from the proposed method, an existing method and experienced designers.
5.1. Methodology to validate precision
To check precision, 15 postgraduate students (S1–S15) from the Department of Design of a Centrally Funded Technical Institute in India are asked to apply the methods to assess novelty and value and, from these, to calculate creativity of a given prototype. The students are either pursuing their Master’s in Design or PhD in Design and have undertaken courses on using systematic design processes, including development and testing of prototypes.
A prototype of a package to hold a cup of beverage and a sandwich, with one hand, and to carry both the items securely so that they do not spill or fall out (see Figure 2), is given to the students. The students are instructed to estimate its novelty and value using the proposed method, and from these, calculate its creativity. The students are provided with a cardboard-based model. The prototype is functional and manipulable. Existing products to hold a sandwich and a cup of beverage are made from paper-based material. So, this given prototype can be considered a good approximation of the final product. The first author of this paper shares the details of the objective of the exercise, given prototype, such as its features and how it solves the envisaged problem. The objective of the exercise is to ‘Estimate the novelty and value, and from these calculate creativity scores of a given prototype of a package that can hold both a sandwich and a cup of beverage (coffee/milk/tea), subject to the following (size of sandwich: 125 mm × 125 mm × 50 mm, weight of sandwich: 100–300 g, quantity of beverage: 300 ml, beverage can be warm or cold), allowing a user to carry both with one hand while ensuring that the food and drink remain secure and do not spill or drop’. The proposed method and the various steps in it are also explained to the students with an example by the first author. The definitions of prototypes, novelty, value and design creativity are also shared with the students. The students are also recommended to use the ‘framework of metrics’ (Jaiswal & Srinivasan Reference Jaiswal and Srinivasan2025c) to identify relevant evaluation aspects and metrics from the formulated requirements. The steps to use the ‘framework of metrics’ are also explained to the students. The students are instructed to document the process of using the proposed method and are encouraged to seek clarification if they have any doubts about the method, the objective of the exercise, or the given prototype. Participation in this study is voluntary, and informed consent is obtained from the students before commencing the assessment. The precision of the method is calculated as a measure of the variance of NVC. This is calculated using the function ‘VAR.S’ in Microsoft Excel.
Prototype of a package to carry a cup of beverage and a sandwich.

5.2. Findings for precision validation
The 15 students (S1–S15) estimated the novelty and value of the given prototype and, from these scores, calculated its creativity using the proposed method. The students required 30–40 minutes to estimate the values using the method. Table 13 shows the findings reported by S1; see Appendix A for responses from the remaining 14 students (S2–S15).
Identified requirements, evaluation aspects and metrics along with their weights and estimated novelty and value scores, by S1

Table 13. Long description
The table consists of five columns and five data rows.
Row 1: Requirement R sub 1 is to carry both a sandwich and a cup of coffee (0.4). Evaluation Aspect E A sub 1 is Functionality (0.35) for R sub 1, R sub 3, and R sub 4. Metrics for E A sub 1 are Function (0.7), Effectiveness (0.25), and Applicability (0.05). Novelty scores are Function (2), Effectiveness (1), and Applicability (0). Value scores are Function (2), Effectiveness (1), and Applicability (2).
Row 2: Requirement R sub 2 is to have a food plus drink carry package for taking daily to workplace (0.27). Evaluation Aspect E A sub 2 is Assembly fit (0.10) for R sub 1. Metric for E A sub 2 is Fit (1). Novelty score is Fit (2). Value score is Fit (1).
Row 3: Requirement R sub 3 is to avoid spillage of coffee (0.12). Evaluation Aspect E A sub 3 is Ergonomics (0.20) for R sub 5. Metrics for E A sub 3 are Comfort (0.6), Easiness (0.3), and Ergonomics (0.1). Novelty scores are Comfort (0), Easiness (1), and Ergonomics (2). Value scores are Comfort (1), Easiness (0), and Ergonomics (1).
Row 4: Requirement R sub 4 is to keep the food secure (0.12). Evaluation Aspect E A sub 4 is Performance (0.25) for R sub 3 and R sub 4. Metrics for E A sub 4 are Efficiency (0.5) and Performance (0.5). Novelty scores are Efficiency (2) and Performance (1). Value scores are Efficiency (2) and Performance (1).
Row 5: Requirement R sub 5 is to carry the package with free hand (0.09). Evaluation Aspect E A sub 5 is User interaction and experience (0.10) for R sub 2 and R sub 5. Metrics for E A sub 5 are Usability (0.75) and Satisfaction (0.25). Novelty scores are Usability (2) and Satisfaction (1). Value scores are Usability (2) and Satisfaction (1).
The scores of novelty and value from the various perspectives of metrics and evaluation aspects can be seen in Appendix A. The overall values of NVC scores are shown in Table 14. Figure 3 shows the variance for NVC scores.
Novelty, value and creativity of the given prototype estimated by S1–S15

Table 14. Long description
The table consists of four columns: Student, Overall novelty, Overall value, and Creativity.
* S 1: Novelty 1.20, Value 1.40, Creativity 1.68.
* S 2: Novelty 1.10, Value 1.71, Creativity 1.88.
* S 3: Novelty 1.60, Value 1.66, Creativity 2.65.
* S 4: Novelty 1.64, Value 1.46, Creativity 2.39.
* S 5: Novelty 1.14, Value 1.23, Creativity 1.40.
* S 6: Novelty 0.50, Value 1.87, Creativity 0.93.
* S 7: Novelty 0.64, Value 1.69, Creativity 1.08.
* S 8: Novelty 1.84, Value 1.56, Creativity 2.87.
* S 9: Novelty 0.96, Value 1.04, Creativity 0.99.
* S 10: Novelty 0.71, Value 0.89, Creativity 0.63.
* S 11: Novelty 1.10, Value 1.30, Creativity 1.43.
* S 12: Novelty 0.83, Value 1.21, Creativity 1.00.
* S 13: Novelty 0.79, Value 1.12, Creativity 0.88.
* S 14: Novelty 1.43, Value 1.60, Creativity 2.28.
* S 15: Novelty 1.22, Value 1.72, Creativity 2.09.
Variance of novelty, value and creativity scores for S1–S15.

The coefficient of variation for novelty, value and creativity is 0.35, 0.20 and 0.44, respectively. Since the coefficient of variation is a relative measure of dispersion without universally accepted categorical thresholds, these values are interpreted in comparison (Montgomery Reference Montgomery2017).
5.3. Methodology to validate reliability
To assess the reliability of the proposed method, the NVC scores calculated by a design researcher using the proposed method for a given prototype are compared with the corresponding scores estimated by experienced designers based on their knowledge. This is because the opinions of experts are considered as a standard to validate creativity metrics (Amabile Reference Amabile1983; Csikszentmihalyi Reference Csikszentmihalyi1997; Sarkar & Chakrabarti Reference Sarkar and Chakrabarti2011). The design researcher has more than 3 years of research experience. The researcher is instructed to follow all the steps of the proposed method to assess the novelty and value, and from these, calculate the creativity of the given prototype. The researcher is instructed/explained about the steps of the proposed method, the objective of the study, and the description of the prototype by the first author of this paper. The researcher is allowed to clarify doubts before applying the method. Also, the first author uses the proposed method to estimate novelty and value, and from these to calculate the creativity of the given prototype. The purpose of including the first author is to compare and understand how the method is used by different evaluators. For this study, five experienced designers (ED1–ED5) are used. They have a minimum of 3 years of working experience in product or industrial design. They are instructed by the first author of this paper to evaluate the prototype of a package to carry a cup of beverage and a sandwich (see Figure 2) for NVC. The definition of prototypes, NVC is shared with them. The first author also shares the details of the given prototype, such as its features and how it solves the envisaged problem. The experienced designers are encouraged to clarify any doubts about the given prototype. For the assessment, they are instructed to use their judgment and experience but are not informed about the method proposed in this paper. The experienced designers are instructed to document their evaluation process. The following elements are expected: (a) the evaluation aspects and metrics they considered when estimating NVC scores (the relationship among novelty, value and creativity is not informed), (b) the scoring scales and (c) the procedure they followed to arrive at their final scores.
5.4. Findings for reliability validation
The novelty and value of the given prototype are assessed, and from these, creativity is calculated by the researcher and the first author using the proposed method. Table 15 shows the requirements, evaluation aspects and metrics identified along with their relative weights by the researcher. The overall NVC scores for the given prototype are found to be 1.28, 1.84 and 2.35, respectively, by the researcher. Table 16 shows the requirements, evaluation aspects, and metrics identified along with their relative weights by the first author. The overall NVC scores for the given prototype are found to be 1.5, 2.0 and 3.0, respectively, for the first author.
Identified requirements, aspects, metrics, weights, novelty and value scores assessed by an independent researcher

Table 15. Long description
The table consists of five columns: Requirements R with weights, Evaluation Aspects E A with weights, Metrics with weights, Novelty scores, and Value scores.
* Row 1: R sub 1 is durable material (0.1). E A sub 1 is Physical Properties (0.4) for R sub 1, R sub 2, R sub 4, R sub 5. Metrics for E A sub 1 include Mass (0.3), Weight (0.3), Durability and reliability (0.2), and Material Properties (0.2). Novelty scores are Mass (0), Weight (0), Durability (1), Material Properties (0). Value scores are Mass (2), Weight (2), Durability (1), Material Properties (1).
* Row 2: R sub 2 is temperature retention (0.3). E A sub 2 is User Interaction and Experience (0.3) for R sub 3. Metrics for E A sub 2 are User satisfaction (0.5) and Ease of use (0.5). Novelty scores are User satisfaction (2) and Ease of use (2). Value scores are User satisfaction (2) and Ease of use (2).
* Row 3: R sub 3 is easy to carry (0.2). E A sub 3 is Ergonomics (0.3) for R sub 3. Metrics for E A sub 3 are Physical comfort (0.6) and Grip quality (0.4). Novelty scores are Physical comfort (2) and Grip quality (2). Value scores are Physical comfort (2) and Grip quality (2).
* Row 4: R sub 4 is lightweight (0.1). The remaining columns for this row are empty as they relate back to E A sub 1.
* Row 5: R sub 5 is temperature isolation between beverage and sandwich (0.3). The remaining columns for this row are empty as they relate back to E A sub 1.
Identified requirements, aspects, metrics, weights, novelty and value scores assessed by the first author

Table 16. Long description
The table consists of five columns.
Column 1 lists Requirements R sub 1 through R sub 7 with weights:
- R sub 1: Hold coffee and sandwich comfortably (0.1).
- R sub 2: Feasible prototype creation (0.2).
- R sub 3: Balance weight (0.1).
- R sub 4: Allow different sizes (0.1).
- R sub 5: Pleasing appearance (0.1).
- R sub 6: Secure items from spilling (0.2).
- R sub 7: Maintain temperature (0.2).
Column 2 lists Evaluation Aspects E A sub 1 through E A sub 4:
- E A sub 1: Functionality (0.5) for R sub 3, R sub 4, R sub 6, R sub 7.
- E A sub 2: Ergonomics (0.2) for R sub 1.
- E A sub 3: Part count (0.15) for R sub 2.
- E A sub 4: Appearance (0.15) for R sub 5.
Column 3 lists Metrics with weights:
- Number of functions (1) for E A sub 1.
- Comfort (1) for E A sub 2.
- Number of parts (1) for E A sub 3.
- Color (0.5) and Shape/form (0.5) for E A sub 4.
Column 4 lists Novelty scores:
- Number of functions (2).
- Comfort (1).
- Number of parts (1).
- Color (0) and Shape/form (2).
Column 5 lists Value scores:
- Number of functions (2).
- Comfort (2).
- Number of parts (2).
- Color (2) and Shape/form (2).
The experienced designers individually need 15–20 minutes to assess the given prototype. The scores estimated by the experienced designers are normalized to a 0–1 scale for NVC, as they use different scales (e.g., 0–5 or 0–20) in their assessment. This normalization enables comparison with the scores obtained through the proposed method by the researcher and the first author. The scores obtained by the researcher and first author are also normalized on a 0–1 scale. The Min-Max normalization method is used to normalize. To compare scores estimated from the proposed method and experienced designers, scores in dissimilar scales are standardized to a 0–1 scale as done in previous research (Ranjan, Siddharth & Chakrabarti Reference Ranjan, Siddharth and Chakrabarti2018). Although normalization allows for comparisons across scales, differences in scoring granularity and underlying evaluation methodologies may impact the interpretation of results. Therefore, this comparison is only for preliminary and indicative evaluation. The scores from the five experienced designers, along with their average, are presented in Table 17. Additionally, the scores obtained by the researcher using the proposed method are included, along with their root mean square error (RMSE) and normalized RMSE (nRMSE).
Normalized scores from the five experienced designers and the proposed method, with average score, RMSE and nRMSE(%)

Table 17. Long description
The table consists of 10 columns and 4 rows.
Column headers from left to right: Category (unlabeled), E D 1, E D 2, E D 3, E D 4, E D 5, Average of E D, Proposed method by the researcher, R M S E, and n R M S E (%).
Row 1, Novelty: E D 1 (0.59), E D 2 (0.50), E D 3 (0.75), E D 4 (0.65), E D 5 (0.58), Average (0.61), Proposed (0.64), R M S E (0.087), n R M S E (8.7).
Row 2, Value: E D 1 (0.62), E D 2 (1), E D 3 (0.75), E D 4 (0.91), E D 5 (0.87), Average (0.83), Proposed (0.92), R M S E (0.158), n R M S E (15.8).
Row 3, Creativity: E D 1 (0.44), E D 2 (0.58), E D 3 (0.62), E D 4 (0.65), E D 5 (0.58), Average (0.58), Proposed (0.59), R M S E (0.071), n R M S E (7.1).
Table 18 compares the scores obtained by the first author using the proposed method and the scores obtained by the experienced designers, along with their RMSE and nRMSE.
Comparison between scores from the five experienced designers and the proposed method, with average score, RMSE and nRMSE(%)

Table 18. Long description
The table consists of 10 columns and 4 rows.
Columns from left to right: Metric, E D 1, E D 2, E D 3, E D 4, E D 5, Average of E D, Proposed method used by the first author, R M S E, and n R M S E percent.
Row 1 (Novelty): E D 1: 0.59, E D 2: 0.50, E D 3: 0.75, E D 4: 0.65, E D 5: 0.58, Average: 0.61, Proposed: 0.75, R M S E: 0.159, n R M S E: 15.9.
Row 2 (Value): E D 1: 0.62, E D 2: 1, E D 3: 0.75, E D 4: 0.91, E D 5: 0.87, Average: 0.83, Proposed: 1.00, R M S E: 0.21, n R M S E: 21.5.
Row 3 (Creativity): E D 1: 0.44, E D 2: 0.58, E D 3: 0.62, E D 4: 0.65, E D 5: 0.58, Average: 0.58, Proposed: 0.75, R M S E: 0.19, n R M S E: 19.
The comparison between the normalized average scores for NVC obtained from five experienced designers and those obtained from the proposed method applied by the researcher indicates reasonably close alignment, with nRMSE of 8.7%, 15.8% and 7.1% for novelty, value and creativity, respectively. However, the scores obtained from the proposed method applied by the first author show a reasonable level of alignment with the expert evaluations, with nRMSE of 15.9%, 21.5% and 19% for novelty, value and creativity, respectively. Literature suggests that nRMSE below 10% is considered excellent, while values between 10% and 20% are considered good (Singh et al. Reference Singh, Knapp, Arnold and Demissie2005; Alexander, Tropsha & Winkler Reference Alexander, Tropsha and Winkler2015). These findings provide a preliminary and indicative evaluation of the proposed method and suggest its potential as a complementary alternative to expert evaluation.
5.5. Methodology to validate effectiveness
To validate the effectiveness of the proposed method, the NVC scores obtained using the proposed method, the method of Ranjan, Siddharth & Chakrabarti (Reference Ranjan, Siddharth and Chakrabarti2018) and experienced designers are compared. The method by Ranjan, Siddharth & Chakrabarti is selected for comparison because, to the best of our knowledge, it is the only method that explicitly assesses the novelty and value of embodiments or prototypes. The NVC scores estimated by the design researcher and experienced designers of the given prototype are used for the comparison (see Section 5.4). The design researcher uses the method proposed by Ranjan, Siddharth & Chakrabarti (Reference Ranjan, Siddharth and Chakrabarti2018) to estimate novelty, value (assessed in terms of degree of requirement-satisfaction) and creativity of the given prototype of a package to carry both a cup of beverage and a sandwich with one single hand (see Figure 2).
5.6. Findings for effectiveness validation
The novelty, value and creativity scores are found to be 0.23, 0.40 and 0.092, respectively, through the Ranjan, Siddharth & Chakrabarti (Reference Ranjan, Siddharth and Chakrabarti2018)’s method (see Appendix B). Table 19 shows the differences in novelty, value and creativity scores obtained from (a) the proposed method and the experienced designers (see columns 3–4) and (b) the Ranjan, Siddharth & Chakrabarti (Reference Ranjan, Siddharth and Chakrabarti2018)’s method and the experienced designers (see columns 6–7). The comparatively smaller differences observed for the proposed method show more alignment with the judgment of the experienced designers. These findings provide preliminary evidence that the proposed method offers improved capability in estimating the novelty and value scores, and in calculating the creativity score of the given prototype compared to the selected existing method.
RMSE and nRMSE between the proposed method, Ranjan, Siddharth & Chakrabarti (Reference Ranjan, Siddharth and Chakrabarti2018)’s method and experienced designers

Table 19. Long description
The table consists of seven columns and four rows including the header.Columns from left to right are:1. Metric (Novelty, Value, Creativity).2. Proposed method (used by the design researcher).3. R M S E (proposed and experts).4. n R M S E percentage (Proposed and Experts).5. Ranjan, Siddharth and Chakrabarti 2018.6. R M S E (Ranjan, Siddharth and Chakrabarti 2018 and experts).7. n R M S E percentage (Ranjan, Siddharth and Chakrabarti 2018 and experts).Data rows:* Novelty: Proposed method 0.64, R M S E 0.086, n R M S E 8.6 percent. Ranjan et al. 0.23, R M S E 0.39, n R M S E 39 percent.* Value: Proposed method 0.92, R M S E 0.158, n R M S E 15.8 percent. Ranjan et al. 0.40, R M S E 0.45, n R M S E 45 percent.* Creativity: Proposed method 0.59, R M S E 0.071, n R M S E 7.1 percent. Ranjan et al. 0.092, R M S E 0.48, n R M S E 48 percent.
Column headers from left to right are: Metric, Proposed method used by the design researcher, R M S E proposed and experts, n R M S E percent Proposed and Experts, Ranjan et al. 2018, R M S E Ranjan et al. 2018 and experts, and n R M S E percent Ranjan et al. 2018 and experts.
Data rows:
* Novelty: Proposed method 0.64, R M S E 0.086, n R M S E 8.6 percent; Ranjan et al. 0.23, R M S E 0.39, n R M S E 39 percent.
* Value: Proposed method 0.92, R M S E 0.158, n R M S E 15.8 percent; Ranjan et al. 0.40, R M S E 0.45, n R M S E 45 percent.
* Creativity: Proposed method 0.59, R M S E 0.071, n R M S E 7.1 percent; Ranjan et al. 0.092, R M S E 0.48, n R M S E 48 percent.
6. Practical criteria and possible deviations while applying the proposed method
When evaluators individually apply the proposed method for a given prototype, they may not all arrive at the same outcomes. In this section, we list plausible reasons at each step of the proposed method for the deviations among the evaluators from the expected outcomes. The experience and domain expertise of evaluators, which influence their understanding of the design problem being solved and its consequent outcomes, play a crucial role in the decisions they take in the various steps of the proposed method. Table 20 summarizes the expectations and the plausible reasons for deviations from the expectations. We believe making these explicit enhances the interpretation and applicability of the proposed method.
Expectations and possible deviations for applying the proposed method

Table 20. Long description
The table consists of three columns: Step in proposed method, Expectations, and Plausible causes for deviations. It contains five rows of data.* Row 1: Identification of pertinent requirements. Expectations: Evaluators identify requirements related to the prototype and their relationships. Deviations: Relationships may not be explicit, leading to different sets of requirements identified by different evaluators.* Row 2: Selection of evaluation aspects from identified, pertinent requirements. Expectations: Evaluators identify aspects with one-to-one, one-to-many, or many-to-one relationships. Deviations: Aspects may not be explicitly stated, making identification dependent on domain expertise and prototype interpretation.* Row 3: Selection of metrics from identified evaluation aspects. Expectations: Evaluators select relevant metrics appropriate for prototype fidelity using the Jaiswal and Srinivasan 2025c framework. Deviations: Metric choice depends on problem understanding; the framework is not exhaustive and relies on evaluator experience.* Row 4: Weighting of identified evaluation aspects and metrics. Expectations: Evaluators assign weights based on relative importance to the design problem. Deviations: Weighting is subjective based on problem interpretation and domain expertise.* Row 5: Identification of existing products. Expectations: Evaluators must be thorough in identifying products for the design problem. Deviations: Use of different resources like patents or catalogues and varying search terms can result in different comparison sets.
* Identification of pertinent requirements: Expectations are for evaluators to identify requirements related to the prototype and their relationships. Deviations occur because relationships may not be explicit, leading to different sets of requirements being identified.
* Selection of evaluation aspects from identified, pertinent requirements: Expectations involve identifying aspects with one-to-one, one-to-many, or many-to-one relationships. Deviations stem from aspects not being explicitly stated, relying instead on evaluator expertise and prototype fidelity.
* Selection of metrics from identified evaluation aspects: Expectations are to select appropriate metrics using the Jaiswal and Srinivasan 2025 a, b, c framework. Deviations occur because the framework is not exhaustive and selection depends on the evaluator’s understanding of the problem.
* Weighting of identified evaluation aspects and metrics: Expectations are to assign weights based on relative importance. Deviations are caused by the subjective nature of weighting based on domain expertise and problem interpretation.
* Identification of existing products: Expectations are for a thorough identification of products for the design problem. Deviations result from different search resources (patents, catalogues) or search terms used by different evaluators.
In the proposed method, we utilize a 3-point scale (0–2) to represent the differences in a given prototype from existing products for novelty assessment and the degree of conformance of the given prototype with the pertinent requirements for value assessment. The operating guidelines for the scale are shown in Table 21 and are intended to provide clarity when using the proposed method.
Scoring criteria for novelty and value assessment

Table 21. Long description
The table is organized into four columns: Assessment, Score, Decision, and Rationale. It is divided into two primary assessment sections.
Novelty Assessment Section:
* Score 0: Decision is No difference. Rationale states the prototype exhibits the same or similar features as existing products.
* Score 1: Decision is Minor differences. Rationale states the prototype has some differences, but the majority of features are identical to existing products.
* Score 2: Decision is Major differences. Rationale states a majority of the prototype’s features are different from existing products.
Value Assessment Section:
* Score 0: Decision is Does not fulfill. Rationale states the prototype does not conform to pertinent requirements.
* Score 1: Decision is Partially fulfills. Rationale states the prototype either partially fulfills requirements or fulfills only some requirements.
* Score 2: Decision is Fulfills. Rationale states the prototype fulfills all pertinent requirements.
7. Discussion
A method to assess novelty and value, and from these to calculate creativity of prototypes, is developed, demonstrated and validated in this paper. The method proposed in this study is aligned with existing research (Sarkar & Chakrabarti Reference Sarkar and Chakrabarti2011; Ranjan, Siddharth & Chakrabarti Reference Ranjan, Siddharth and Chakrabarti2018; Berni, Borgianni & Basso Reference Berni, Borgianni and Basso2024; Singh & Chakrabarti Reference Singh and Chakrabarti2025) that uses novelty and value as metrics for assessing design creativity of problems, ideas, concepts or prototypes.
Creativity in design manifests across all phases and assessing it at all phases is important. To develop a creative (novel and valuable) product, a creative concept must be converted into a creative prototype before it can be developed into a creative product (Christian, Zheng & Miller Reference Christian, Zheng and Miller2017; Menold et al. Reference Menold, Jablokow, Simpson and Seuro2017b). Not all creative concepts are converted into creative prototypes and eventually creative products (Christian, Zheng & Miller Reference Christian, Zheng and Miller2017). As designs are detailed, new features are added, and existing features are compromised or traded off for alternative features or eliminated. In addition, new requirements are also identified and existing requirements are discarded, modified, or decomposed (Srinivasan & Chakrabarti Reference Srinivasan and Chakrabarti2010a,Reference Srinivasan and Chakrabartib; Ranjan, Siddharth & Chakrabarti Reference Ranjan, Siddharth and Chakrabarti2018). Consequently, the values of NVC of the outcomes are bound to change. We conjecture that assessing the novelty and value, and from these calculating creativity, of prototypes will help assess whether the novel, valuable and creative elements from ideas are retained or not, and further, whether these elements can be detailed into novel, valuable and creative features in the final product.
Prototypes allow designers to test more aspects of designs than ideas or concepts. So, it is necessary to consider relevant design aspects during assessment of creativity. Further, it is helpful to assess the creativity of prototypes before developing further, because any changes made later in the development process are more expensive (Berliner & Brimson Reference Berliner and Brimson1988; Menold et al. Reference Menold, Jablokow, Simpson and Seuro2017b). So, to help ascertain the NVC of prototypes before they are developed into products, the method can help identify features that have been compromised or enhanced. The proposed method helps estimate novelty and value, and calculate creativity from these scores using multiple evaluation aspects that are relevant to the problem and prototype at hand. The proposed method helps ascertain features that contribute (or do not contribute) to NVC of prototypes. This can help designers decide the features that they would like to retain or eliminate in the prototypes before moving to the next phase in the process.
In many existing methods to assess novelty (Chakrabarti & Khadilkar Reference Chakrabarti and Khadilkar2003; Sarkar & Chakrabarti Reference Sarkar and Chakrabarti2011; Jagtap Reference Jagtap2019), the given ideas, concepts, or products are compared with the existing products that perform the same function or solve the same problem. The method proposed in this paper also uses the space of existing products that solve the same problem for comparison. However, in the existing methods to assess novelty, the comparison is primarily based on function-, working principle- or preliminary structure-level. But novelty can also be perceived from other evaluation aspects such as appearance, ergonomics, manufacturability, user interaction and experience, and so forth. All the relevant evaluation aspects must be considered in the assessment of novelty. In the method proposed in this paper to assess novelty, multiple and relevant evaluation aspects along with the related metrics are considered for comparison of given prototypes with existing products.
Existing methods (Shah, Vargas-Hernandez & Smith Reference Shah, Vargas-Hernandez and Smith2003; Ranjan, Siddharth & Chakrabarti Reference Ranjan, Siddharth and Chakrabarti2018) assess value by using requirement satisfaction and feasibility as proxy measures. The method proposed to assess the value of prototypes considers conformance to requirements from various perspectives (evaluation aspects and metrics). The proposed method to assess novelty and value enables assessment of not only the overall novelty and value (by accounting for weights according to importance) but also novelty and value from the perspective of one or several relevant evaluation aspects and metrics. This contributes to the uniqueness of the proposed method. The proposed method is also applicable to ideas, concepts and final products. However, we conjecture that, given the paucity of information for ideas or concepts, the proposed method will be as good as the existing methods for assessing novelty and value, and from these to calculate creativity in ideas or concepts. This part needs to be validated through empirical tests.
The proposed method has potential not only as an evaluation tool but also as a means of guiding prototype development. In particular, the identification of evaluation aspects and their associated metrics can be used prior to prototyping to inform designers about which aspects are important and what criteria prototypes can address. This can help focus prototyping efforts, reduce iterations and improve efficiency. In this context, the framework of metrics proposed in Jaiswal & Srinivasan (Reference Jaiswal and Srinivasan2025c) can serve as a guiding reference during prototype development.
While existing methods do not comprehensively address the evaluation of creativity of prototypes, the proposed method contributes toward addressing this limitation. However, this research also has certain limitations. Ideally, while assessing the novelty of a given prototype, a prototype must be compared against existing prototypes that solve the same or similar problem. However, in the proposed method, existing products that solve the same problem are considered. This is because data on prototypes that solve the same problem are not available. The choice of scales is a point of contention. In this research, a 3-point scale (0–2) is used for assessing novelty and value. This is because a 3-point scale allows easy and clear selection of a rating at the expense of not being able to distinguish fine differences. Bigger scales allow finer differences, but the selection of a suitable rating, especially when the desired value is close to adjacent ratings, is difficult and can be subjective. Another limitation is the subjectivity arising from the weights used for evaluation aspects and metrics depending on their importance. The choice of weights for evaluation aspects and metrics depends on their relative importance to a given design problem. The relative importance of requirements from which the evaluation aspects and metrics are derived can help choose suitable weights.
Prototypes contain more information than ideas or concepts but less information than final products. So, it is expected that prototypes will contain more evaluation aspects than ideas or concepts but fewer evaluation aspects than final products. Prototypes can be of different fidelities, depending on their closeness to the final products; high-fidelity prototypes are closer to finished products than low-fidelity prototypes. So, it is expected that the number of evaluation aspects and the associated metrics in the estimate of NVC increase as the fidelity level increases. Some evaluation aspects may be compromised due to lack of information, depending on the nature and fidelity of prototypes. In this method, evaluation aspects and associated metrics are selected based on the relevance of requirements to a given prototype.
Prototypes have multiple aspects that can be evaluated. In the assessment of novelty and value, the relevant evaluation aspects are systematically identified from the requirements, and from these, pertinent metrics are identified. The proposed method attempts to evaluate novelty and value and, from these, to calculate creativity in terms of all the relevant aspects systematically extracted from the requirements. It is conjectured that this mode of identification, instead of directly identifying metrics from requirements as in the House of Quality (Hauser & Clausing Reference Hauser and Clausing1988), will enable a more thorough identification of relevant metrics and ensure no relevant metrics are missing. This approach of identifying metrics also bridges the gaps identified in several existing creativity assessment methods (for instance, Shah, Vargas-Hernandez & Smith Reference Shah, Vargas-Hernandez and Smith2003). The framework of metrics (Jaiswal & Srinivasan Reference Jaiswal and Srinivasan2025c) contains a checklist of evaluation aspects, and each evaluation aspect encompasses related metrics (see Table 1). So, this framework of metrics can assist in the identification of relevant evaluation aspects and metrics from the requirements.
The developed method is validated for precision by checking whether the values of NVC fall within an acceptable range of variance when the method is used by post-graduate students of design to evaluate a given prototype. Value shows the least relative variability among NVC, whereas creativity exhibits the highest due to the multiplicative effect. This is due to: (a) differences in consideration of multiple and different requirements identified from the problem definition, (b) identification of different evaluation aspects and metrics, (c) subjectivity in assessment of weights of metrics and evaluation aspects based on their relative importance, (d) individual interpretations of the differences of the given prototype from the existing products and (e) varied understanding of conformance to various evaluation aspects.
We acknowledge the divergence in the evaluation aspects and metrics of the evaluators (including the students, the first author and the independent design researcher) when they used the method. A given prototype can be evaluated using multiple evaluation aspects. Each evaluation aspect has its own set of metrics. In this study, where only the prototype and the problem were shared with the evaluators, the evaluators identified their list of relevant evaluation aspects and metrics to evaluate the prototype. We conjecture that this divergence can be reduced by sharing an explicit list of requirements along with the problem and the prototype. The requirements will help the evaluators focus on the relevant evaluation aspects and metrics. However, the weightings assigned to the evaluation aspects and metrics, depending on their importance to the problem, can still be subjective among the evaluators. By sharing the relative importance of requirements, we can mitigate the subjectivity of weightings in metrics. The divergence in the choice of evaluation aspects, metrics and weightings will affect the values of NVC evaluation.
Our intention in allowing evaluators to independently identify these criteria is to evaluate the method’s precision in a realistic scenario where designers would typically initiate the assessment process by interpreting the problem and prototype themselves. This study aims to assess the precision of the method when applied from a common starting point (the problem statement and prototype), allowing for the natural variability that arises from individual interpretations of the design problem and the resulting selection of evaluation criteria. Thus, the variance reported reflects not just the precision of the scoring mechanism itself, but also the precision of the entire application process, including the initial problem decomposition and criterion identification, which is an inherent part of using such a method. In design, it is a common phenomenon to observe that given a problem statement to multiple designers, they will arrive at different kinds of requirements lists with varying degrees of relative importance of requirements. Consequently, the solution set will also be different.
The method is tested for reliability by checking whether the NVC scores obtained by using the method match or correlate with scores from people with domain expertise (such as experienced designers) who assign the scores based on their knowledge. It is found that the proposed method in this paper shows a reasonable degree of consistency and shows potential as a fairly accurate alternative for preliminary expert evaluation. Sarkar & Chakrabarti (Reference Sarkar and Chakrabarti2011) benchmarked the method they proposed to assess design creativity by comparing the scores from the method against the intuition of experienced designers. Amabile (Reference Amabile1983) and Csikszentmihalyi (Reference Csikszentmihalyi1997) suggested the use of experts to validate creativity. So, Sarkar & Chakrabarti (Reference Sarkar and Chakrabarti2011) argued that for any measure of NVC to be valid, their scores need to match the collective notion of experts.
The method is tested for effectiveness by comparing the NVC scores obtained from the proposed method, one of the existing methods and experienced designers. It is found that the scores obtained from the proposed method closely align with the scores obtained from the experienced designers. This alignment supports the effectiveness of the proposed method to systematically evaluate the creativity of prototypes. This alignment also supports our objective to develop a new method to assess the creativity of prototypes, as existing methods are not reliable in general and for prototypes. The comparison is meant to: (a) illustrate the applicability of the proposed method, and (b) provide initial insights into its preliminary and indicative evaluations relative to the existing methods and expert evaluations. This comparison also presents an indicative and qualitative comparison between the method of Ranjan et al. and the proposed method based on expert evaluations and provide insight on the differences between them regarding several aspects: (a) granularity of assessment, (b) representation of partial satisfaction, (c) traceability of evaluation aspects and metrics and (d) structure of the evaluation process, rather than as a strict quantitative equivalence between scales.
We also clarify that the importance assigned to requirements and the weights of evaluation aspects are not intended to have a direct mathematical mapping. In this context, the importance of requirements is used to identify and structure the relevant evaluation aspects, while the weights of evaluation aspects reflect the evaluators’ judgment of the relative importance of different evaluation aspects (e.g., performance, ergonomics, user experience) in assessing novelty and value. Thus, the importance of requirements is implicitly considered in: (a) the selection and formulation of evaluation aspects, and (b) the judgment-based assignment of their weights, but it is not used as a direct numerical input for computing these weights.
The selected prototypes in Sections 4 and 5 differ in nature. This difference is intentional, as the two sections serve distinct purposes in the paper. Section 4 presents a set of student-developed prototypes used to demonstrate the applicability of the proposed method in a realistic, multi-aspect design context. These prototypes are more complex and were included to illustrate how the method can accommodate a wide range of evaluation aspects. Section 5, in contrast, focuses on validating the precision, reliability and effectiveness of the method through multiple controlled experiments involving larger groups of evaluators, comprising 15 design students, five expert designers and a design researcher, respectively. Since these participants are not willing to spare much time, a simpler prototype of a sandwich-beverage holder is selected. This separation of purposes – demonstration in Section 4 and validation in Section 5 – is designed to show both the generalisability of the method across different types of prototypes and the robustness of the method when applied in a controlled evaluation setting.
We acknowledge that this research focuses on functional prototypes, and accordingly, the findings and demonstration are directly applicable to this type of prototyping. At the same time, the proposed method is structured around evaluation aspects and metrics, which can be adapted depending on the type of prototype (e.g., functional, experiential, look-alike). Therefore, while the current study demonstrates the method using functional prototypes, its application to other types of prototypes would require appropriate selection and weighting of evaluation aspects and metrics.
The assessment of novelty and value, and calculation of creativity from these values of prototypes using the proposed method is time-consuming. This is evident from the time taken by the postgraduate students to evaluate the given prototype (see Section 5.2). To reduce the time taken by designers to evaluate their prototypes using the proposed method, there is a plan to semi-automate some parts of the proposed method. The task will be undertaken by developing a computer-based framework of the method and integrating it with the already developed framework of metrics (Jaiswal & Srinivasan Reference Jaiswal and Srinivasan2025c). It is expected that this semi-automated tool will help designers to: (a) identify requirements that are pertinent to the given prototype from the keywords or needs of the given problem statements, (b) identify relevant evaluation aspects and metrics based on their requirements, (c) assign weights based on relative importance to each requirement, aspect and metric, (d) identify existing products based on the keywords or requirements of the given problem statements and (e) estimate the score of novelty and value from the perspective of each metric and evaluation aspect.
We also acknowledge that we have not undertaken studies to compare the assessment of novelty and value, and the calculation of creativity from these values, with and without the evaluation aspects. The current focus is on incorporating the evaluation aspects and metrics that are relevant to a design problem in the assessment of novelty and value, and the calculation of creativity from these scores of prototypes. We believe that the estimation of novelty and value, and calculation of creativity in terms of evaluation aspects and metrics, is relevant for prototypes and has not been addressed before. We find that it improves the accuracy of assessment of novelty and value, and calculation of creativity of prototypes. The test of reliability and effectiveness of the proposed method shows that the values estimated by the method match reasonably closely with the estimates of the experienced designers. However, the accuracy of this method is at the expense of time and effort. To reduce this expenditure, we are working on automating some steps of the method.
We were constrained by the availability of subjects for the experiment. However, this homogeneity of 15 students from the same program with a similar level of training ensures that all participants have a comparable understanding of the problem, the prototype and the evaluation procedure. This allows us to more reliably examine the precision of the method itself rather than differences attributable to evaluator background. We agree that future studies involving participants from more diverse educational and professional backgrounds would strengthen the generalizability of the findings.
In design science literature, there are multiple prototyping methods, such as iterative, parallel, scaling, subsystem isolation and requirement relaxation (Camburn et al. Reference Camburn, Viswanathan, Linsey, Anderson, Jensen, Crawford, Otto and Wood2017), and tools and materials, such as 3D printers, CNC machines, clay, cardboard, foam, computer-aided design and virtual reality, to name a few (Mathias Reference Mathias2020; Jaiswal & Srinivasan Reference Jaiswal and Srinivasan2025c), that are mentioned, and their influence on the overall outcome of design. It is also important to know the influence of various prototyping methods and tools to understand the NVC in prototypes. In future work, the proposed method will also be used to understand the influence of different prototyping methods and tools to identify the effectiveness of these methods and tools.
8. Summary and conclusions
In this research, a method to assess novelty and value, and from these to calculate creativity of prototypes, is developed, demonstrated and validated for precision, reliability and effectiveness. The assessment of novelty and value accounts for relevant evaluation aspects and metrics of prototypes based on their relative importance; creativity is calculated as a mathematical product of novelty and value.
The method is demonstrated by applying it to estimate the novelty and value, and from these, creativity is calculated for four functional prototypes developed in a project of a design course. The method is validated for precision by checking whether the sets of scores of NVC, obtained by 15 postgraduate students of design by applying the method individually to estimate the novelty and value, and from these creativity is calculated for a given prototype, have an acceptable variance.
The method is validated for reliability by comparing the values of NVC obtained by a researcher and the first author when applying the method to a given prototype with the set of scores estimated by five experienced designers independently assessing the NVC of the same prototype based on their expertise. It is found that there is a reasonable degree of consistency between the scores obtained by the experienced designers and the proposed method.
The method is validated for effectiveness by comparing the values of NVC obtained from the proposed method, one of the existing methods and experienced designers. The obtained scores highlight that the proposed method better aligns with the scores obtained from the experienced designers. This also proves that the proposed method is more effective in evaluating the creativity of prototypes, therefore also supporting this paper’s objective to develop a new method to evaluate the creativity of prototypes.
The features, limitations and directions for further improvements of the method are also proposed. The proposed method will help practitioners and educators to systematically measure the NVC of prototypes by considering relevant evaluation aspects and metrics. This can help assess whether the novel, valuable and creative features of ideas or concepts have been translated into novel, valuable and creative features of prototypes or whether new novel, valuable and creative features have been introduced in the transition from ideas or concepts to prototypes before developing further. This can also help to identify not only the overall creative prototypes but also the specific aspects of a design that lack creativity to improve.
Acknowledgments
The authors of this paper thank all the anonymized participants (the students, the design researcher and the experienced designers) for their contributions to this research.
Appendix A
Identified requirements, evaluation aspects and metrics along with their weights and estimated novelty and value scores by S2

Table A1. Long description
The table consists of five columns and five data rows.
Column 1: Requirements (R) with weights.
- R 1: Size of the sandwich and cup matches with cut out of the solution (0.25).
- R 2: Have enough carrying capacity so that it does not break when a filled sandwich and cup are loaded into the product (0.3).
- R 3: Non biohazard/Food quality material (0.1).
- R 4: The grip size would be enough that the hand easily fits and is ergonomic to carry (0.1).
- R 5: Weight distribution should be such that it does not tilt so coffee might leak (0.25).
Column 2: Evaluation aspects (E A) with weights.
- E A 1: Fit (0.3) for R 1, R 4.
- E A 2: Ergonomics (0.1) for R 1, R 5.
- E A 3: User interaction (0.1) for R 1, R 4, R 5.
- E A 4: Material (0.2) for R 1, R 2, R 3, R 5.
- E A 5: Functionality (0.3) for R 1, R 4, R 5.
Column 3: Metrics with weights for respective aspects.
- For E A 1: Size (0.6), Cut out (0.4).
- For E A 2: Hand grip (0.3), Weight distribution (0.5), Positive/Negative Spaces (0.2).
- For E A 3: Ease of holding (0.5), Ease of taking out or putting in (0.5).
- For E A 4: Holding Capacity (0.7), Biodegradability (0.1), Non-carcinogenic (0.2).
- For E A 5: Ability to meet functionality (0.8), Multipurpose (0.2).
Column 4: Novelty scores in brackets.
- Size (1), Cut out (1).
- Hand grip (0), Weight distribution (2), Positive/Negative Spaces (1).
- Ease of holding (0), Ease of taking out or putting in (2).
- Holding Capacity (1), Biodegradability (1), Non-carcinogenic (1).
- Ability to meet functionality (1), Multipurpose (0).
Column 5: Value scores in brackets.
- Size (2), Cut out (1).
- Hand grip (2), Weight distribution (2), Positive/Negative Spaces (1).
- Ease of holding (1), Ease of taking out or putting in (2).
- Holding Capacity (1), Biodegradability (1), Non-carcinogenic (1).
- Ability to meet functionality (2), Multipurpose (1).
Identified requirements, evaluation aspects and metrics along with their weights and estimated novelty and value scores, by S3

Table A2. Long description
The table consists of five columns and five data rows.
Row 1:
- Requirement R 1: Simple cardboard material can be used without too much care about getting lost (0.2).
- Evaluation Aspect E A 1: Functionality (0.4) for R 3, R 2.
- Metrics: Balance (0.7), space (0.3) for E A 1.
- Novelty: Balance (2), space (1).
- Value: Balance (2), space (1).
Row 2:
- Requirement R 2: Triangle design will be easy to carry with balance in the cinema hall and/or picnic (0.4).
- Evaluation Aspect E A 2: Ergonomics (0.3) for R 2.
- Metrics: Equal weight distribution (0.6), Easiness (0.4) for E A 2.
- Novelty: Equal distribution weight (1), Easiness (2).
- Value: Equal distribution weight (2), Easiness (1).
Row 3:
- Requirement R 3: Can be further used for multiple purposes also - gardening, pen stand, etc. (0.3).
- Evaluation Aspect E A 3: Geometry (0.1) for R 2.
- Metrics: Form (0.8), Shape (0.2) for E A 3.
- Novelty: Form (1), Shape (1).
- Value: Form (2), Shape (1).
Row 4:
- Requirement R 4: Cardboard is a sustainable material, easy to discard (0.1).
- Evaluation Aspect E A 4: Cost (0.1) for R 4.
- Metrics: Material quality (1) for E A 4.
- Novelty: Material quality (2).
- Value: Material quality (2).
Row 5:
- Requirement: (Empty).
- Evaluation Aspect E A 5: Physical properties (0.1) for R 1, R 4.
- Metrics: Light (0.8), Strength (0.2) for E A 5.
- Novelty: Light (2), Strength (2).
- Value: Light (1), Strength (2).
Identified requirements, evaluation aspects and metrics along with their weights and estimated novelty and value scores, by S4

Table A3. Long description
A five-column table structured as follows:
* Column 1: Requirements (R) with weights. R 1: Functional balance (0.4). R 2: Appearance (0.1). R 3: Necessity (0.3). R 4: Cost-effectiveness (0.2).
* Column 2: Evaluation aspects (E A) with weights. E A 1: Functionality (0.25) for R 1. E A 2: Performance (0.15) for R 1. E A 3: Assembly (0.15) for R 1 and R 2. E A 4: Ergonomics (0.15) for R 1. E A 5: Appearance (0.05) for R 2. E A 6: U I U X (0.15) for R 2 and R 3. E A 7: Cost (0.1) for R 2 and R 3.
* Column 3: Metrics with weights. Performance (0.4), Effectiveness (0.3), and Significance (0.3) for E A 1. Efficiency (0.6) and Technical Quality (0.4) for E A 2. Fit (1) for E A 3. Comfort (0.5) and Labor Required (0.5) for E A 4. Aesthetics (1) for E A 5. Satisfaction (0.6) and Feedback (0.4) for E A 6. Sales price (1) for E A 7.
* Column 4: Novelty scores. Performance (2), Effectiveness (2), Significance (2), Efficiency (1), Technical Quality (1), Fit (2), Comfort (2), Labor Required (2), Aesthetics (1), Satisfaction (2), Feedback (2), Price (2).
* Column 5: Value scores. Performance (1), Effectiveness (1), Significance (2), Efficiency (1), Technical Quality (1), Fit (2), Comfort (2), Labor Required (2), Aesthetics (1), Satisfaction (2), Feedback (2), Price (2).
Identified requirements, evaluation aspects and metrics along with their weights and estimated novelty and value scores, by S5

Table A4. Long description
A five-column table detailing the design evaluation of a coffee and snack holder.
Row 1: Requirement R 1 focuses on a convenient coffee cup angle and spill prevention (weight 0.25). It maps to Evaluation Aspect E A 1 (User Friendly/Functionality, weight 0.25). Metrics include Comfort (0.2), Scale and Proportion (0.3), and Material quality (0.5). Novelty scores are 0, 1, 1 respectively; Value scores are 1, 1, 1.
Row 2: Requirement R 2 focuses on eco-friendly, durable, and reusable material (weight 0.4). It maps to E A 2 (Eco-friendly, weight 0.25). Metrics include Reusable material (0.2), Biodegradable (0.5), and Recyclable (0.3). Novelty scores are 1, 2, 2; Value scores are 1, 2, 2.
Row 3: Requirement R 3 focuses on ergonomic handle design (weight 0.1). It maps to E A 3 (Ergonomics, weight 0.05). Metrics include Inclusive (0.5) and Ease of travel (0.5). Novelty scores are 2, 1; Value scores are 1, 1.
Row 4: Requirement R 4 focuses on breathable space for sandwiches (weight 0.05). It maps to E A 4 (Assembly fit, weight 0.1). Metrics include Reassemble (0.5) and Disassemble (0.5). Novelty and Value scores are all 0.
Row 5: Requirement R 5 focuses on table placement and parcel portability (weight 0.2). It maps to E A 5 (Physical Properties, weight 0.1). Metrics include Strength (0.4), Compact (0.3), and Storable (0.3). Novelty scores are 1, 2, 2; Value scores are 2, 2, 2.
Additional Evaluation Aspects listed without specific R-links include E A 6 (Geometry, weight 0.1) with Size and Shape metrics, and E A 7 (Portability, weight 0.15) with Shape, Volume, and Durability metrics.
Identified requirements, evaluation aspects and metrics along with their weights and estimated novelty and value scores, by S6

Table A5. Long description
The table consists of five columns.
Row 1: R 1: Able to hold coffee and sandwich (0.3) maps to E A 1: Appearance (0.1) for R 4. Metrics include Aesthetics (0.3), Attractiveness (0.3), and Form (0.4). Novelty scores are 1 for all three metrics. Value scores are Aesthetics (2), Attractiveness (1), and Form (2).
Row 2: R 2: Easy to carry in one hand (0.3) maps to E A 2: Ergonomics (0.2) for R 2, R 3. Metrics include Easiness (0.5) and Manual labor required (0.5). Novelty scores are 0 for both. Value scores are 2 for both.
Row 3: R 3: Stability while carrying and resting (0.2) maps to E A 3: Functionality (0.2) for R 1. Metric is Ability to carry multiple things (1). Novelty score is 0 and Value score is 2.
Row 4: R 4: Aesthetic (0.1) maps to E A 4: Assembly fit (0.1) for R 5. Metrics are Number of parts (0.4) and Ease of assembly (0.6). Novelty scores are 2 for both. Value scores are 2 for both.
Row 5: R 5: Manufacturability (0.1) maps to E A 5: Manufacturability (0.1) for R 5. Metric is Material (1). Novelty score is 2 and Value score is 2.
Row 6: No requirement listed. E A 6: Originality (0.1) for R 4. Metric is Uniqueness (1). Novelty score is 0 and Value score is 1.
Row 7: No requirement listed. E A 7: Geometry (0.2) for R 4. Metric is Form (0.4). Novelty score is 0 and Value score is 2.
Identified requirements, evaluation aspects and metrics along with their weights and estimated novelty and value scores by S7

Table A6. Long description
The table consists of five columns and four data rows.
Column 1: Requirements R with weights in brackets.
- R 1: Easy to carry with one hand (0.2).
- R 2: Can be carried by different age groups (0.3).
- R 3: Enough storage for the products it is made for (0.4).
- R 4: Aesthetic (0.1).
Column 2: Evaluation aspects E A with weights in brackets.
- E A 1: Appearance (0.1) for R 4.
- E A 2: Functionality (0.4) for R 3.
- E A 3: Ergonomics (0.5) for R 1, R 2.
Column 3: Metrics with weights in brackets with respective aspects.
- For E A 1: Visual (0.3), Shape, form (0.4), Space for branding (0.3).
- For E A 2: Material quality (0.4), Production (0.3), Effectiveness (0.3).
- For E A 3: Comfort (0.3), Size (0.2), Interaction (0.5).
Column 4: Novelty in brackets from the perspective of metrics.
- Visual (0), Shape, form (0), Space for branding (2).
- Material quality (0), Production (2), Effectiveness (2).
- Comfort (0), Size (1), Interaction (0).
Column 5: Value in brackets from the perspective of metrics.
- Visual (1), Shape, form (2), Space for branding (1).
- Material quality (2), Production (2), Effectiveness (2).
- Comfort (1), Size (1), Interaction (2).
Identified requirements, evaluation aspects and metrics along with their weights and estimated novelty and value scores by S8

Table A7. Long description
The table is organized into five columns.
Column 1: Requirements (R) with weights.
- R 1: It should be lightweight (0.2).
- R 2: It should have a balance so that it does not get tilted (0.5).
- R 3: The grip should be in such a manner that it does not hurt the fingers (0.3).
Column 2: Evaluation aspects (E A) with weights.
- E A 1: Manufacturability (0.1) for R 1.
- E A 2: Ergonomics (0.1) for R 2, R 3.
- E A 3: Physical Properties (0.4) for R 1.
- E A 4: User interaction and experience (0.2) for R 3.
- E A 5: Robustness (0.2) for R 2.
Column 3: Metrics with weights.
- Material (1) for E A 1.
- Grip (0.6) and Size (0.4) for E A 2.
- Mass (1) for E A 3.
- Surface Finish (0.7) and Types of Material (0.3) for E A 4.
- Fracture Load (1) for E A 5.
Column 4: Novelty scores.
- Material (1).
- Grip (1), Size (2).
- Mass (2).
- Surface Finish (2), Types of Material (2).
- Fracture Load (2).
Column 5: Value scores.
- Material (2).
- Grip (2), Size (1).
- Mass (2).
- Surface Finish (2), Types of Material (2).
- Fracture Load (0).
Identified requirements, evaluation aspects and metrics along with their weights and estimated novelty and value scores by S9

Table A8. Long description
The table is structured into five columns.
Column 1: Requirements (R) with weights.
- R 1: The package should be leak-free (0.3).
- R 2: Ability to be held with one hand without strain (0.3).
- R 3: Comfort to hold (0.1).
- R 4: Ease of pouring (0.1).
- R 5: How presentable is it? (0.2).
Column 2: Evaluation aspects (E A) with weights.
- E A 1: Functionality (0.4) for R 1 and R 4.
- E A 2: User interaction and experience (0.4) for R 2 and R 3.
- E A 3: Appearance (0.2) for R 5.
Column 3: Metrics with weights for respective aspects.
- For E A 1: Leak-free (0.4), Durability (0.4), Simplicity of function (0.2).
- For E A 2: Comfort (0.5), Time taken to learn for the first time (0.2), Strain caused on hand (0.3).
- For E A 3: Aesthetics of form (0.4), Choice of color (0.3), Product as status symbol (0.3).
Column 4: Novelty scores from the perspective of metrics.
- Leak-free (1), Durability (0), Simplicity of function (2).
- Comfort (1), Time taken to learn (2), Strain (1).
- Aesthetics (2), Color (0), Status symbol (0).
Column 5: Value scores from the perspective of metrics.
- Leak-free (1), Durability (1), Simplicity of function (2).
- Comfort (1), Time taken to learn (2), Strain (1).
- Aesthetics (1), Color (0), Status symbol (0).
Identified requirements, evaluation aspects and metrics along with their weights and estimated novelty and value scores by S10

Table A9. Long description
The table consists of five columns.
Column 1: Requirements (R) with weights.
- R 1: Resemblance with actual scale of product (0.3).
- R 2: Usability in terms of interaction with product (0.3).
- R 3: Look and feel of product (desirability) (0.2).
- R 4: Originality and depth of thought (0.2).
Column 2: Evaluation aspects (E A) with weights and their associated requirements.
- E A 1: Appearance (0.1) for R 1 and R 3.
- E A 2: Ergonomics (0.2) for R 2.
- E A 3: Functionality (0.1) for R 2.
- E A 4: Geometry (0.1) for R 1.
- E A 5: User interaction and experience (0.2) for R 2.
- E A 6: Originality (0.2) for R 4.
- E A 7: Assembly fit (0.1) for R 2.
Column 3: Metrics with weights for respective aspects.
- For E A 1: Look alike (0.4), Feel alike (0.4), Material resemblance (0.2).
- For E A 2: Comfort (0.4), Constraints (0.2), Affordance (0.3).
- For E A 3: Weight (0.3), Easy to carry (0.4), Spillage resistance (0.3).
- For E A 4: Form evolution (0.4), Styling (0.2), Joinery (0.4).
- For E A 5: Usability criteria (0.4), Sequence of use (0.4), Opening process (0.2).
- For E A 6: Unique idea (0.3), Graphics (0.4), Material (0.3).
- For E A 7: Joinery (0.6), Ease to disassemble (0.2), Ease to assemble (0.2).
Column 4: Novelty scores for each metric, ranging from 0 to 2.
Column 5: Value scores for each metric, ranging from 0 to 2.
Identified requirements, evaluation aspects and metrics along with their weights and estimated novelty and value scores by S11

Table A10. Long description
The table consists of five columns: Requirements (R) with weights, Evaluation aspects (EA) with weights, Metrics with weights, Novelty, and Value.
* Row 1: R 1 is ‘Not spill the contents inside’ (0.4). This maps to E A 1: Ergonomics (0.4). Metrics include Balance (0.2), Wrist position (0.3), and Comfort (0.5). Novelty scores are Balance (1), Wrist position (1), and Comfort (2). Value scores are Balance (2), Wrist position (2), and Comfort (1).
* Row 2: R 2 is ‘Durable in any case of spillage or impact’ (0.5). This maps to E A 2: Durability (0.2). Metrics include Impact deformation (0.5), Shear deformation (0.2), and Wear/Tear (0.3). Novelty scores are Impact deformation (2), Shear deformation (1), and Wear/Tear (1). Value scores are Impact deformation (2), Shear deformation (1), and Wear/Tear (1).
* Row 3: R 3 is ‘Well balanced when held’ (0.1). This maps to E A 3: Manufacturability (0.2). Metrics include Less Steps (0.6) and Material Availability (0.4). Novelty scores are Less Steps (1) and Material Availability (1). Value scores are Less Steps (2) and Material Availability (2).
Identified requirements, evaluation aspects and metrics along with their weights and estimated novelty and value scores, by S12
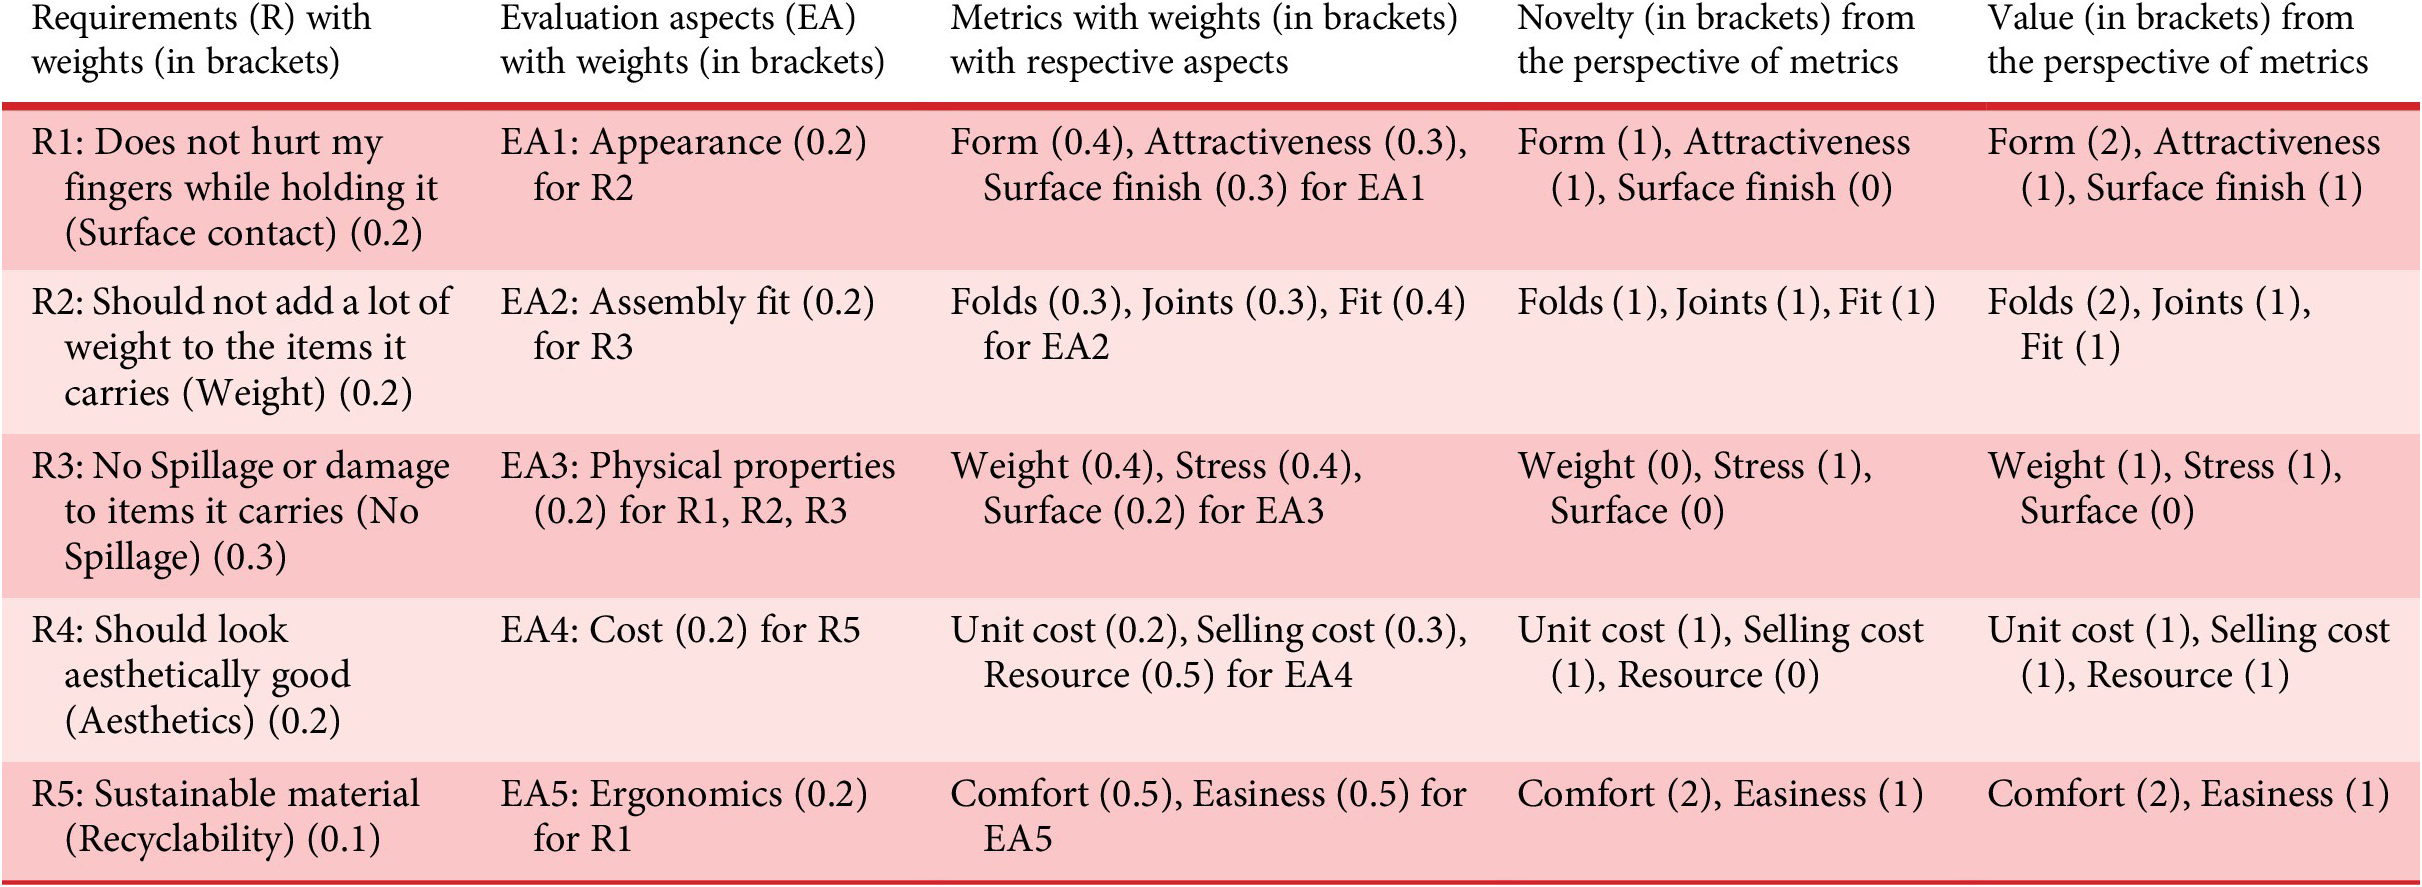
Table A11. Long description
The table consists of five columns and six rows including the header.
Column 1: Requirements (R) with weights.
- R 1: Does not hurt my fingers while holding it (Surface contact) (0.2).
- R 2: Should not add a lot of weight to the items it carries (Weight) (0.2).
- R 3: No Spillage or damage to items it carries (No Spillage) (0.3).
- R 4: Should look aesthetically good (Aesthetics) (0.2).
- R 5: Sustainable material (Recyclability) (0.1).
Column 2: Evaluation aspects (E A) with weights.
- E A 1: Appearance (0.2) for R 2.
- E A 2: Assembly fit (0.2) for R 3.
- E A 3: Physical properties (0.2) for R 1, R 2, R 3.
- E A 4: Cost (0.2) for R 5.
- E A 5: Ergonomics (0.2) for R 1.
Column 3: Metrics with weights for respective aspects.
- For E A 1: Form (0.4), Attractiveness (0.3), Surface finish (0.3).
- For E A 2: Folds (0.3), Joints (0.3), Fit (0.4).
- For E A 3: Weight (0.4), Stress (0.4), Surface (0.2).
- For E A 4: Unit cost (0.2), Selling cost (0.3), Resource (0.5).
- For E A 5: Comfort (0.5), Easiness (0.5).
Column 4: Novelty scores in brackets.
- Row 1: Form (1), Attractiveness (1), Surface finish (0).
- Row 2: Folds (1), Joints (1), Fit (1).
- Row 3: Weight (0), Stress (1), Surface (0).
- Row 4: Unit cost (1), Selling cost (1), Resource (0).
- Row 5: Comfort (2), Easiness (1).
Column 5: Value scores in brackets.
- Row 1: Form (2), Attractiveness (1), Surface finish (1).
- Row 2: Folds (2), Joints (1), Fit (1).
- Row 3: Weight (1), Stress (1), Surface (0).
- Row 4: Unit cost (1), Selling cost (1), Resource (1).
- Row 5: Comfort (2), Easiness (1).
Identified requirements, evaluation aspects and metrics along with their weights and estimated novelty and value scores by S13

Table A12. Long description
The table is organized into five columns.
1. Requirements R with weights in brackets.
- R 1. Ergonomic 0.2.
- R 2. Less hassle while carrying and easy to handle 0.2.
- R 3. Easy to place things 0.2.
- R 4. Manufacturability 0.2.
- R 5. Should hold the things placed in it 0.2.
2. Evaluation aspects E A with weights in brackets.
- E A 1. Ergonomics 0.3 for R 1, R 2, R 3.
- E A 2. Functionality 0.3 for R 2, R 3, R 5.
- E A 3. Manufacturability 0.4 for R 4.
3. Metrics with weights in brackets with respective aspects.
- For E A 1. Easiness 0.6, Manual labor required 0.4.
- For E A 2. Technical quality 0.5, Effectiveness 0.5.
- For E A 3. Manufacturable 0.3, Less steps to make 0.3, Less wastage 0.4.
4. Novelty in brackets from the perspective of metrics.
- Easiness 0, Manual labor required 1.
- Technical quality 0, Effectiveness 1.
- Manufacturable 1, Less steps to make 2, Less wastage 1.
5. Value in brackets from the perspective of metrics.
- Easiness 1, Manual labor required 1.
- Technical quality 1, Effectiveness 1.
- Manufacturable 1, Less steps to make 2, Less wastage 1.
Identified requirements, evaluation aspects and metrics along with their weights and estimated novelty and value scores by S14

Table A13. Long description
The table is organized into five columns.
Row 1: R 1 Ease of use (0.3) maps to E A 1 Ergonomics (0.2). Metrics include Comfort (0.2), Less Easy to handle (0.4), and Shape (0.4). Novelty scores are 1, 1, and 2 respectively. Value scores are 1, 1, and 2 respectively.
Row 2: R 2 Cost (0.2) maps to E A 2 Cost (0.1). Metrics include Sales price (0.3), cost of each prototype (0.3), and Manufacturing price (0.4). Novelty scores are 1, 0, and 1. Value scores are 2, 0, and 1.
Row 3: R 3 Market Need (0.3) maps to E A 3 Functionality (0.3). Metrics include Quality (0.5), Applicability (0.3), and Number of function (0.2). Novelty scores are 2, 2, and 1. Value scores are 2, 2, and 1.
Row 4: R 4 Sustainable (0.1) maps to E A 3 User interaction and experience (0.2) for R 3. Metrics include Easy to use (0.3), Interaction (0.3), and Satisfaction (0.4). Novelty scores are 1, 2, and 1. Value scores are 1, 2, and 2.
Row 5: R 5 Manufacturability (0.1) maps to E A 5 Manufacturability (0.2) for R 4 and R 5. Metrics include Manufacturability (0.3), Implementability (0.3), and Material waste (0.4). Novelty scores are 1, 1, and 2. Value scores are 2, 1, and 2.
Identified requirements, evaluation aspects and metrics along with their weights and estimated novelty and value scores by S15

Table A14. Long description
The table consists of five columns: Requirements R with weights, Evaluation aspects E A with weights, Metrics with weights, Novelty, and Value.
Row 1: Requirement R 1 focuses on carrying capacity (weight 0.6). It maps to Evaluation aspect E A 1: Ergonomics (weight 0.2) for R 3. Metrics include Hand grip (0.5) and Weight distribution (0.5). Novelty scores are 1 for both metrics. Value scores are 2 for Hand grip and 1 for Weight distribution.
Row 2: Requirement R 2 focuses on non-biohazard/food quality material (weight 0.2). It maps to Evaluation aspect E A 2: Material (weight 0.2) for R 2. Metrics include Biodegradability (0.7) and Non-carcinogenic (0.3). Novelty scores are 0 for Biodegradability and 1 for Non-carcinogenic. Value scores are 2 for Biodegradability and 1 for Non-carcinogenic.
Row 3: Requirement R 3 focuses on grip size and ergonomics (weight 0.2). It maps to Evaluation aspect E A 3: Functionality (weight 0.6) for R 1. Metrics include Number of functions (0.8) and Ability to use for other purposes (0.2). Novelty scores are 2 for Number of functions and 0 for other purposes. Value scores are 2 for Number of functions and 1 for other purposes.
Appendix B
The steps of the Ranjan, Siddharth & Chakrabarti Reference Ranjan, Siddharth and Chakrabarti2018’s method is listed as: (a) identification of requirements and decomposition into lowest-level, (b) construction of requirement-solution (RS) tree, (c) assignment of weights to the requirements, (d) assessment of requirement satisfaction (DRS), (e) assessment of novelty using SAPPhIRE at the lowest-level RS pairs and (f) calculation of creativity as a mathematical product of novelty and value.
Identified requirements and degree of requirement satisfaction (DRS) based on the cardboard-based prototype. All the identified requirements are considered as a lowest-level RS pair because no sub-requirements are identified.
Requirements, weightage and satisfaction scores

Table B1. Long description
The table consists of five columns and five data rows.
* Row 1: Requirement R 1, Durable material, Weightage 0.1, Satisfaction score 1. Justification: The prototype provides adequate durability.
* Row 2: Requirement R 2, Retain temperature, Weightage 0.3, Satisfaction score 0. Justification: The prototype lacks insulation, so it does not retain heat.
* Row 3: Requirement R 3, One-hand carry, Weightage 0.2, Satisfaction score 1. Justification: The prototype explicitly enables a one-hand carrying option.
* Row 4: Requirement R 4, Lightweight, Weightage 0.1, Satisfaction score 1. Justification: The prototype is lightweight.
* Row 5: Requirement R 5, Thermal isolation, Weightage 0.3, Satisfaction score 0. Justification: The prototype does not provide any thermal separation.
Therefore, DRS = (1 × 0.1) + (0 × 0.3) + (1 × 0.2) + (1 × 0.1) + (0 × 0.3) = 0.4 (0–1 scale).
Novelty is assessed for every lowest-level RS pair, and the scores are assigned on the SAPPhIRE scale (0–7). The R2 and R5 are not filled by this cardboard-based prototype; therefore, novelty is not attributed when the requirements are not fulfilled.
SAPPhIRE novelty assessment

Table B2. Long description
The table consists of six columns labeled S A P P h I R E, R 1, R 2, R 3, R 4, and R 5.
Row 1: Action. R 1 is Same. R 3 is Difference (holding both items with one hand is not in most existing solutions). R 4 is Same. R 2 and R 5 are empty.
Row 2: State change. R 1, R 3, and R 4 are all Same.
Row 3: Input. R 1, R 3, and R 4 are all Same.
Row 4: Phenomenon. R 1, R 3, and R 4 are all Same.
Row 5: Effect. R 1, R 3, and R 4 are all Same.
Row 6: Organ. R 1 and R 4 are Same. R 3 is Difference (new-integrated approach).
Row 7: Part. R 1 and R 3 are Same material class. R 4 is Same material class, but lightweight can also be achieved.
Row 8: Normalized Novelty. R 1 is 0/7 = 0. R 2 is 0. R 3 is 7/7 = 1. R 4 is 1/7 = 0.143. R 5 is 0.
The lowest-level RS pairs are R1–R5. Since the total number of RS pairs is 5, each contributes a ratio of 1/5 to the overall novelty score (zi = 1/5 = 0.20). Novelty = (Normalized novelty for R1 × 0.20) + (Normalized novelty for R2 × 0.20) + (Normalized novelty for R3 × 0.20) + (Normalized novelty for R4 × 0.20) + (Normalized novelty for R5 × 0.20) = (0 × 0.20) + (0 × 0.20) + (1 × 0.20) + (0.143 × 0.20) + (0 × 0.20) = 0.23 (0–1 scale) Creativity = DRS (0.4) × Novelty (0.23) = 0.092.


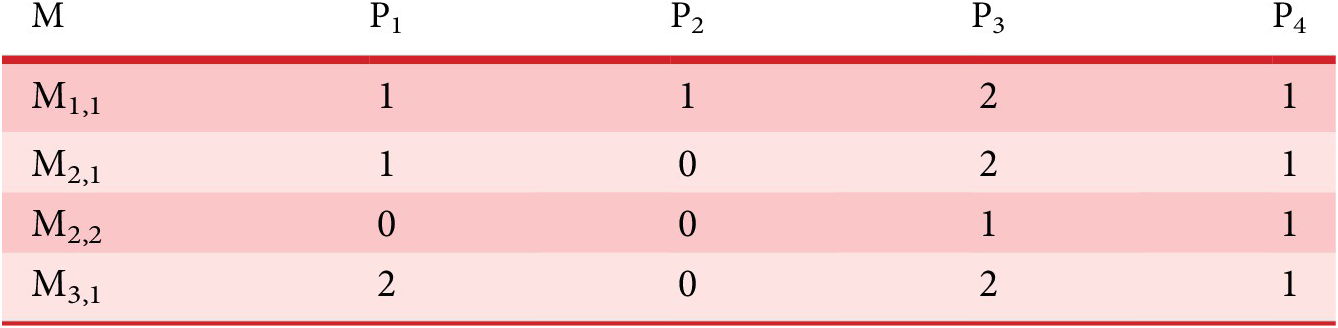


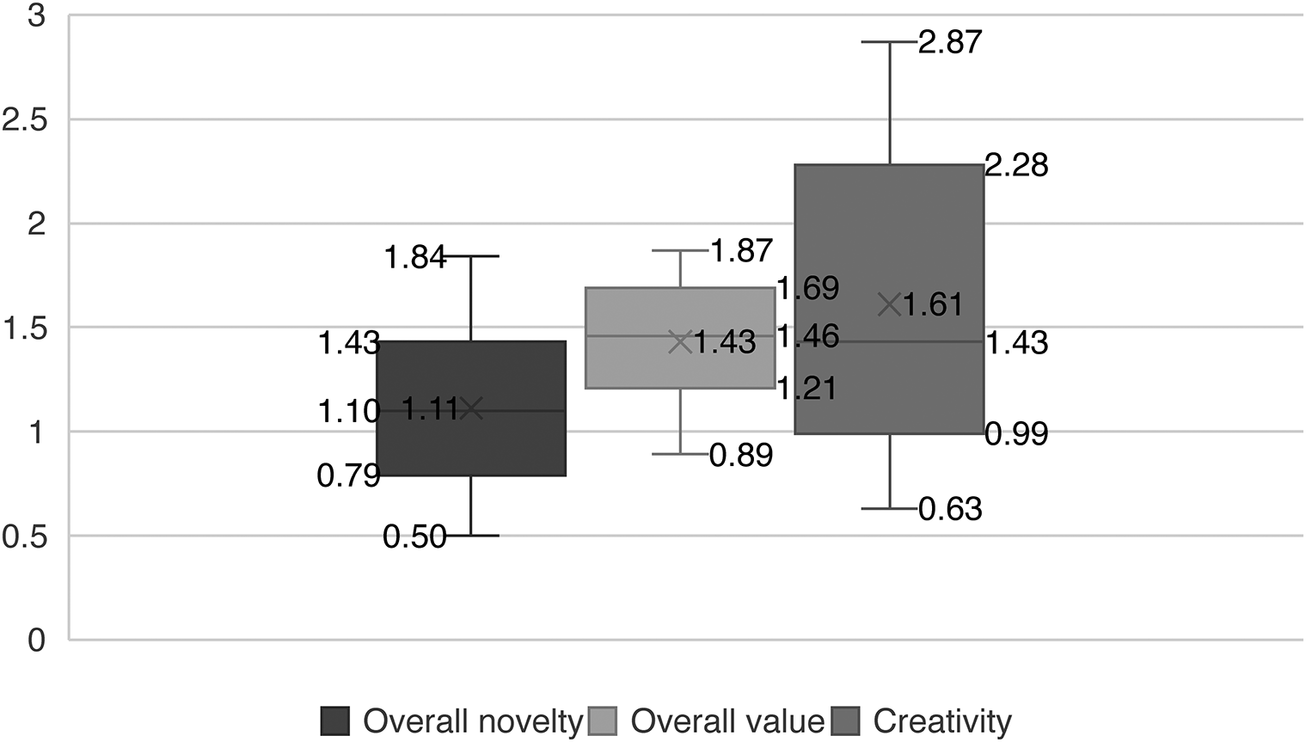





 Open access

