Implications
To obtain a high litter weight at weaning the sow must consume high amounts of feed, but a high milk yield often causes a high BW loss. Counterproductive, body mobilization is positive for the offspring, but might be harmful to the sow. This study showed that sows with the highest milk production and litter gain had both a high feed intake and large mobilization. The sows might have reached their upper physical limit for how much feed they could ingest and therefore future research should focus on correct nutrient concentrations of lactation diets of hyper-prolific sows.
Introduction
Milk production in sows is affected positively by feed intake during lactation (Koketsu et al., Reference Le Cozler, David, Beaumal, Johansen and Dourmad1997; Vadmand et al., Reference van den Brand, Heetkamp, Soede, Schrama and Kemp2015). Many sows turn catabolic during the lactation period to maintain their milk production, because they are unable to increase the feed intake at the same rate as milk production is increasing (van den Brand et al., Reference Zak, Cosgrove, Aherne and Foxcroft2000; Hansen et al., Reference Hansen, Strathe, Kebreab, France and Theil2012a). However, possibly due to differences in the number of nursing piglets, studies on sows show contradicting results when it comes to linking body mobilization and milk production, and whether a high feed intake (5.0 to 7.6 kg/day) can prevent excessive BW loss (Eissen et al., Reference Eissen, Apeldoorn, Kanis, Verstegen and de Greef2003; Mosnier et al., Reference Pluske, Williams, Zak, Clowes, Cegielski and Aherne2010). A low sow feed intake (2.8 to 3.0 kg/day) and great body mobilization (38 to 40 kg) during lactation can have a negative effect on the following reproductive cycle by increasing weaning-to-estrus interval (WEI) and decreasing the number of total born piglets (Baidoo et al., Reference Baidoo, Aherne, Kirkwood and Foxcroft1992; Koketsu et al., Reference Koketsu, Dial, Pettigrew and King1996; Zak et al., Reference Hansen, Lauridsen, Sørensen, Bach Knudsen and Theil1998). In addition, parity of the sow also influences milk production and reproductive performance. First parity sows give birth to fewer piglets and have a lower feed intake compared with multiparous sows (Eissen et al., Reference Eissen, Kanis and Kemp2000). First parity sows might therefore have a different interplay between feed intake, body mobilization, milk yield and reproduction than older sows according to Dourmad et al. (Reference Dourmad, Étienne, Valancogne, Dubois, van Milgen and Noblet1996). Hyper-prolific sows are pushed to the limit and beyond during lactation to increase milk yield, however, more knowledge is needed to clarify the connection between milk production, feed intake, body mobilization and subsequent reproduction in hyper-prolific sows nursing large litters of 12 to 14 piglets. The aim of this study was, therefore, to characterize hyper-prolific sows with high milk production. We hypothesized that milk yield would be influenced by number of nursing piglets, parity, feed intake and body mobilization.
Material and methods
This study was conducted with the approval of the Danish Animal Experimentation Inspectorate (Authorization No. 2013-15-2934-00961).
Animals and diets
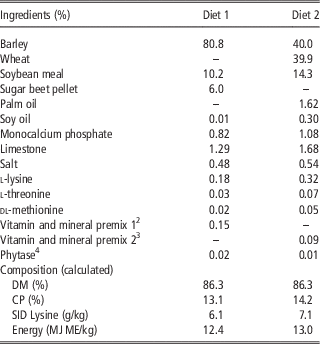
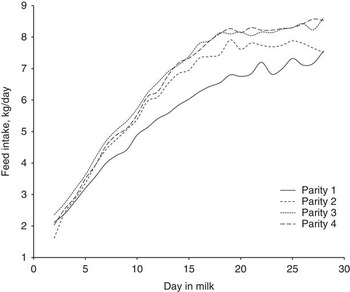
The study was conducted in a commercial Danish herd using 565 parity 1 to 4 sows (Landrace×Yorkshire) mated with Duroc semen (Hatting KS, Horsens, Denmark). Originally the study was conducted to test the effect of six dietary valine-to-lysine ratios for lactating sows (see Strathe et al., Reference Trottier and Easter2016), but no treatment effects were seen on any of the measured parameters and therefore data was pooled for this assessment. Each week, a block of 18 sows were selected for the trial based on parity and in total 32 blocks of sows were included. The animals were studied from 1 week prepartum until weaning (day 26 postpartum). Twenty four hours postpartum (day 2), the litters were standardized to 14 medium or large piglets (1.78±0.24 kg). Sows were fed using a SpotMix feeding system (Schauer Agrotronic, Prambachkirchen, Austria) that enabled individual feeding curves for each sow. From 7 days prepartum to 2 days postpartum all sows were fed the same diet (Table 1). From day 2 postpartum, sows were allotted to six dietary treatments only varying in valine concentration (Table 1). Gilts were fed 2.3 kg from day 2 postpartum and feed allowance was increased to a maximum of 7.6 kg at day 17. Multiparous sows were fed 2.3 kg from day 2 postpartum and feed allowance was gradually increased to a maximum of 8.6 kg at day 17. These feeding curves were used as a guideline for the maximum daily allowance of the sows; and were the curves normally used in the herd, as it was the experience that they were close to the maximum intake capacity of the sows. The feed allowance was adjusted for the individual sows daily and when feed residuals were present in the trough the allowance was downgraded with 0.25 kg. Feed residuals were not recorded.
Ingredients and dietary composition (as-fed) of the lactation dietsFootnote 1

SID=standardized ileal digestible; DM = dry matter; ME = metabolizable energy.
Diet 1 was fed from day 80 of gestation until the day after farrowing and diet 2 was fed from day 2 postpartum and until weaning of the litter.
1 In the original six dietary treatments (Strathe et al., Reference Trottier and Easter2016) l-valine was included in diet 2 from 0.00% to 0.43%, respectively.
2 Provided per kg of the diet: 8130 IU vitamin A; 810 IU vitamin D3; 101.6 mg dl-alfa tocoferol, 4.06 mg vitamin K3; 2.03 mg vitamin B1; 5.08 mg vitamin B2; 3.05 mg vitamin B6; 0.02 mg vitamin B12; 15.24 mg d-pantothenic acid; 20.32 mg niacin; 1.52 mg folic acid; 81.30 mg iron (FeSo4); 13.00 mg copper (CuSO4); 40.65 mg manganese (MnO); 0.20 mg iodine (Ca(IO3)2); 0.36 mg selenium (Na2SeO3).
3 Provided per kg of the diet: 9070 IU vitamin A; 910 IU vitamin D3; 170.1 mg dl-alfa tocoferol, 4.32 mg vitamin K3; 2.27 mg vitamin B1; 5.67 mg vitamin B2; 3.40 mg vitamin B6; 0.02 mg vitamin B12; 17.01 mg d-pantothenic acid; 22.68 mg niacin; 1.70 mg folic acid; 90.72 mg iron (FeSo4); 13.00 mg copper (CuSO4); 45.36 mg manganese (MnO); 0.23 mg iodine (Ca(IO3)2); 0.38 mg selenium (Na2SeO3).
4 Phyzyme XP provided 500 phytase activity (FTU) per kg of diet (Danisco Animal Nutrition, Marlborough, UK)
Records and sampling
Sows were weighed and back fat (BF) thickness of sows was measured by ultrasound at the P2 site (Sono-Grader II; Renco Corporation, Minneapolis, MN, USA) at day 7 prepartum, day 2 postpartum and at weaning. Litter weight was recorded at litter standardization and at weaning. On a subsample of 72 second parity sows, additional measurements of BW and BF were made on day 17 and litter weight at days 10 and 17 postpartum. Blood samples were collected from the jugular vein of these sows at days 2, 10, 17 and 26 postpartum. Spot samples of urine were collected on the same days as blood samples, and milk samples were obtained at day 17 postpartum. Detailed description of sampling and chemical analysis of feed, blood, urine and milk are given in Strathe et al. (Reference Trottier and Easter2016).
Calculations and statistical analysis
All calculations and statistical analyses were carried out in R (R Core Team, Vienna, Austria) with the individual sow as the experimental unit. Milk yield was estimated from equations by Hansen et al. (Reference Hughes, Smits and Xie2012b). Changes in body pools of fat and protein were estimated using equations by Dourmad et al. (Reference Dourmad, Etienne and Noblet2008).The descriptive statistics of data was reported as a mean and SD and results of analysis were reported as least squares mean and SE.
The effect of parity was analyzed using the following model:
 $$Y_{{ij}} \, {\equals}\, \mu {\plus}\alpha _{i} {\plus}\gamma _{j} {\plus}{\varepsilon}_{{ij}} $$
where Y ij is the response variable, µ the overall mean, α i the effect of parity (i=1, 2, 3, 4), γ j the random effect of block (j=1, 2, … , 32) and ε ij the random error component which was assumed to be N (0,σ 2). When analyzing the effect on sow BW and BF thickness, the interaction between parity and stage of lactation was also included in the model. Multiple comparisons were made when the ANOVA indicated that there were significant differences. Tukey’s test was used in multiple comparisons of means to adjust the P-values. The multiple comparisons were done using the multcomp package in R. Statistical significance was declared at P<0.05. Relationships between response variables (average daily gain (ADG) of litter, BW and BF loss of sow during lactation, total born piglets in next litter and WEI) and explanatory variables were evaluated by Pearson correlation coefficients to determine which variables should be used in the multiple regression analysis. All explanatory variables that were significant at the 5% level were offered in multiple regression models. Multiple regression models were developed for the ADG of the litter, BW loss of the sow during lactation and total born piglets in next litter for parity 1 to 4, respectively, using a backward elimination approach for reduction of the model. Multiple coefficient of determination (adjusted R 2) and parameters of the explanatory variables and their SE were estimated.
Results
Descriptive analysis of data and time effects
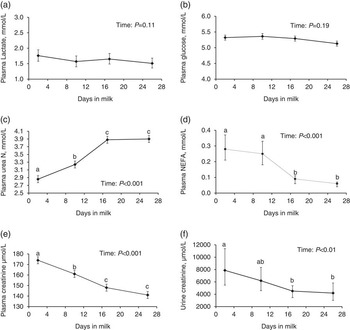
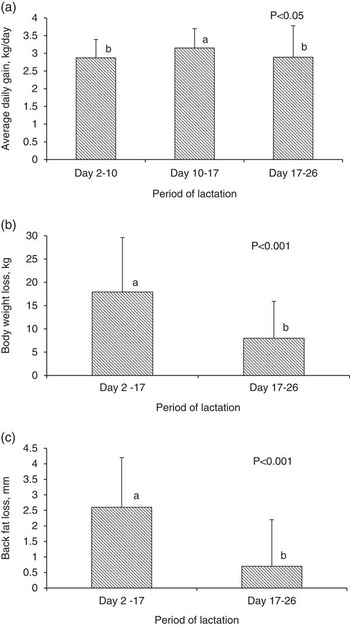
The sows had an average daily feed intake (ADFI) at 6.1 kg/day during lactation (Figure 1). In average sows weaned 13.0±1.1 piglets and the ADG of the litter was 2.92±0.53 kg/day. Sows in average lost 22.1±12.7 kg of BW and 2.9±1.7 mm of BF from day 2 postpartum until weaning, respectively. Milk contents of lactose, fat and protein were 5.58±0.89%, 7.17±2.07% and 4.71±0.71%, and the daily outputs of these nutrients were 648±115, 832±184 and 544±74.3 g/day, respectively. Sow plasma concentrations of glucose (5.27±0.64 mmol/l; P=0.19) and lactate (1.76±0.75 mmol/l; P=0.11) were similar on all sampling days, whereas concentrations of non-esterified fatty acid (NEFA) decreased, plasma urea nitrogen increased and plasma and urine creatinine decreased during lactation (P<0.001, Figure 2). The ADG of the litter was highest in mid-lactation (3.15±0.55 kg/day; days 10 to 17) compared with early (2.87±0.52 kg/day; days 2 to 10) and late (2.89±0.89 kg/day; days 17 to 26) lactation (Figure 3; P<0.05). The loss of BW and BF in sows was highest from days 2 to 17 (17.9±11.7 kg and 2.6±1.6 mm) compared with days 17 to 26 (8.0±7.9 kg and 0.7±1.5 mm; Figure 3; P<0.001).
Feed allowance was registered daily for individual sows and feed allowances (kg/day) for parity 1 to 4 sows are given from litter standardization to weaning.

Plasma and urine samples were collected 4 h after the morning feeding on days 3, 10, 17 and 26 postpartum. Plasma was analyzed for (a) lactate, (b) glucose, (c) plasma urea N, (d) non-esterified fatty acids (NEFA) and (e) creatinine, and urine was analyzed for (f) creatinine. Results for plasma urea N, glucose and creatinine was given as means and SD and results for plasma NEFA and lactate and urine creatinine was given as means and 95% confidence intervals. a,b,cMeans without a common superscript differ (P<0.005).

Changes in (a) average daily gain of the litter, (b) BW loss of the sow and (c) back fat loss of sow during different periods of lactation. Results are gives as mean and SD. a,bMeans without a common superscript differ (P<0.005).

Sow parities
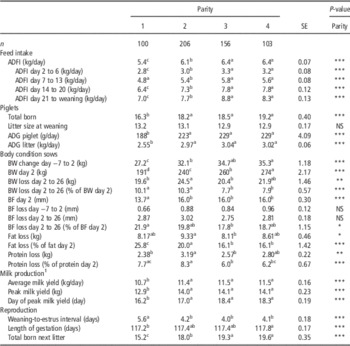
The highest ADFI was recorded for the parity 3 and 4 sows, whereas parity 1 sows had the lowest ADFI (P<0.001; Figure 1). All parities weaned the same number of piglets (P=0.15), but parity 1 sows had a lower ADG of the litter compared with multiparous sows (2.55 v. 2.97 to 3.04 kg/day, P<0.001). The total BW loss (kg) during lactation was lowest in parity 1 and 3 compared with 2 and 4 (P<0.01), but the total BF loss (mm) was similar among all parities (P=0.45). On average, first parity sows lost 10% of their BW and 7.7% of body protein during lactation, which was the same as second parity sows, but first parity sows lost 26% of the body fat compared with 20% in second parity and 16% in parity 3 or 4 (P<0.001). In the subsequent reproductive cycle, parity 1 sows had a longer WEI (P<0.001) and a drop from 16.2 to 15.2 piglets in the next litter compared with the multiparous sows which had the same or increased litter size (P<0.001; Table 2).
Effects of parity on sow and piglet performance

NS=not significant; ADFI=average daily feed intake; ADG=average daily gain; BF=back fat.
a,b,cMeans within a row with different superscript letters are different.
1 Milk yield was estimated from litter gain (g/day) and litter size using equations by Hansen et al. (Reference Hansen, Strathe, Kebreab, France and Theil Reference Hughes, Smits and Xie2012b).
*P⩽0.05, **P⩽0.01, ***P⩽0.001.
Correlations
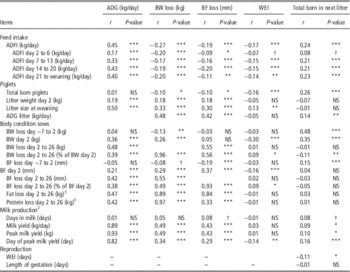
The ADG of the litter was positively correlated with BW and BF loss during lactation, respectively (P<0.001, Table 3). The ADFI during the entire lactation period and the weekly ADFI (ADFI 1 to 4) most likely had a positive effect on ADG of the litter (P<0.001; Table 3). Increased outputs of the individual nutrients in milk (lactose (r=0.72), fat (r=0.58) and protein (r=0.64)) was positively related to ADG (P<0.001) of the litter. A high plasma creatinine (r=0.28 to 0.49) throughout lactation seemed to have a positive effect on ADG (P<0.05), whereas plasma NEFA had a positive effect in the last week (r=0.35; P<0.01), and plasma urea N had a negative effect in the 1st week (r=−0.38; P<0.01). A higher litter size and ADG of the litter was related to increased body mobilization during lactation (P<0.001, Table 3). The ADFI was negatively correlated to BW loss or BF loss during lactation (P<0.001, Table 3). Total daily output of fat in milk was positively correlated to the BF loss (r=0.40; P<0.01). High concentrations of NEFA (r=0.30 and 0.28; P<0.05) or creatinine (r=0.36 and 0.37; P<0.01) at days 10 and 17 was correlated with increased BW loss, whereas a high plasma urea N at day 2 was linked to a decreased BW (r=−0.36) and BF (r=−0.32) loss (P<0.01). A shorter WEI was associated with a high ADFI during the entire lactation period, and WEI was also positively correlated to a high number of born piglets in the next litter (P<0.001, Table 3). In contrast, WEI was correlated with a higher proportional loss of BW and BF during lactation (P<0.05; Table 3), a high number of weaned piglets (P<0.01, Table 3) or higher daily outputs of protein (r=0.31; P<0.05) or lactose (r=0.29; P<0.05) in milk. Weaning-to-estrus interval was likely negatively affected by plasma NEFA at day 17 (r=−0.27; P<0.05), plasma creatinine at day 10 (r=−0.36; P<0.01) and urine creatinine at day 10 (r=−0.50; P<0.01) and day 17 (r=−0.29; P<0.05). The ADFI of weeks 2 to 4 was positively correlated to number of total born piglets in next litter (P<0.001; Table 3).
Pearson correlation coefficients between variables (n=565)

NS=not significant; WEI=weaning-to-estrus interval; ADFI=average daily feed intake; ADG=average daily gain; BF=back fat.
ADG of the litter, BW and BF loss of the sow, WEI and total born in next litter were used as response variables.
1 Estimated with equations by Dourmad et al. (Reference Dourmad, Etienne and Noblet2008).
2 Estimated with equations by Hansen et al. (Reference Hughes, Smits and Xie2012b).
† P⩽0.10, *P⩽0.05, **P⩽0.01, ***P⩽0.001.
Regression analysis
The results of the multivariate regression analysis are shown in Table 4. The variables included in the regression models of parity 1 to 4 sows explained 55%, 63%, 68% and 73% of the variation in ADG of the litter, respectively. Average daily feed intake and BW loss of the sow during lactation was incorporated in the regression models for all four parities. The parameters for ADFI were highest among the variables in the regression models and varied from 0.22 to 0.44 kg/day meaning that increasing the ADFI with 1 kg/day would increase the ADG of the litter with 220 to 440 g/day provided that other variables were held fixed. An increase in BW loss of 1 kg only increased ADG with 20 to 30 g/day, and an extra piglet in the litter increased ADG by 70 to 150 g/day. In total 70%, 69%, 65% and 73% of the variation in BW loss of the sows during lactation was explained by the models for parity 1 to 4, respectively. Average daily feed intake, BW at standardization, BF loss during lactation and milk yield were included in models for all four parities. Increasing the ADFI by 1 kg/day decreased the BW loss by 6.6 to 13.9 kg during lactation, whereas increasing the average milk yield with 1 kg/day raised the BW loss by 4.3 to 21.0 kg during lactation. In models for the number of total born piglets in next litter no variables were included in all four models which only explained 8%, 6%, 4% and 14% of the variation in the number of total born piglets in next litter for parity 1 to 4, respectively. For parity 2 to 4 one extra pig born would increase litter size in the subsequent reproductive cycle with 0.18 to 0.26 piglets.
Regression models for average daily gain (ADG) of the litter, BW loss of sows during lactation and total born piglets in next litter for parity 1 to 4 (n=565)Footnote 1

The adjusted R 2 is given for each model.
1 ADG=average daily gain of the litter (kg/day); ADFI=average daily feed intake (kg/day); ADFI1=ADFI from standardization to day 6 (kg/day); ADFI2=ADFI from day 7 to 13 (kg/day); ADFI3=ADFI from day 14 to 20 (kg/day); ADFI4=ADFI from day 21 to weaning (kg/day); BWL=BW loss during lactation (kg); BFL=back fat loss during lactation (mm); BFL%=back fat loss (% of BF at day 2); LS=litter size at weaning (n piglets); TBP=total born piglets (n piglets); BWS=BW sow at standardization (kg); BFS=back fat at standardization (mm); BFF=back fat loss day −7 to 2 (mm); WEI=weaning-to-estrus interval (days); TBNL=total born piglets in next litter (n piglets); TPM=time of peak milk yield (day postpartum); MY=milk yield (kg); PMY=peak milk yield (kg); LWS=litter weight at standardization (kg).
Discussion
Average daily gain of the litter
This study clearly showed that the ADG of the litter was positively affected by the ADFI of the sow, litter size and the BW loss of the sow during lactation. Average daily feed intake seemed to have the highest impact on ADG compared with litter size and BW loss. It might be difficult to increase the ADFI by 1 kg/day, but an increase in ADFI by 100 g/day could potentially increase the litter weaning weight by 0.5 to 1.0 kg. Milk production has the highest priority for the sow during lactation, which means that almost all dietary nutrients are directed toward the mammary glands. When the sow increases feed intake, more energy and nutrients become available for the synthesis of milk, which is converted into piglet growth (Koketsu et al., Reference Le Cozler, David, Beaumal, Johansen and Dourmad1997; Eissen et al., Reference Eissen, Apeldoorn, Kanis, Verstegen and de Greef2003). The ADFI in individual weeks of lactation also had a positive correlation to the ADG of the litter, especially in weeks 3 and 4 even though the effect of the total ADFI for the entire lactation period was more pronounced. This makes sense because around days 16 to 18 postpartum the sows reach their maximum milk production and therefore has the highest energy and nutrient requirement (Strathe et al., Reference Strathe, Strathe, Theil, Hansen and Kebreab2015); Koketsu et al., (Reference Le Cozler, David, Beaumal, Johansen and Dourmad1997) also investigated the effect of ADFI in individual weeks of lactation on litter weight at weaning; and similarly found that ADFI of weeks 2 and 3 had a higher impact than ADFI in week 1. It is nevertheless important to mention that the sows in the current study did not have ad libitum access to feed, but an upper limit was set on the feed allowance. Consequently, it is not possible to determine for how long the positive effect of feed intake on ADG will continue to increase linearly before an upper limit will be reached. However, because both the ADFI and the body mobilization of the sows was high in litters with the highest ADG, it could be speculated that the feed allowance might have been very close to the physical limit for how much the sows could ingest. If this is the case, then it emphasizes the importance of investigating optimal daily requirements of energy and nutrients instead of feed allowances to ensure high productivity of hyper-prolific sows.
Sow body mobilization during lactation
The BW loss of all sows during lactation decreased with increasing feed intake, whereas an increased milk yield enlarged the BW loss. Again, it might be unrealistic to increase the ADFI with 1 kg/day, but a lower increase at for instance 200 g/day could potentially decrease the BW loss with 1.3 to 2.8 kg. A high milk yield is needed to ensure a high litter gain and it does, therefore, not from a production point of view make sense to decrease milk yield. Several studies have shown that increased litter size and ADG of the litter increased the BW and BF loss of the sows during lactation (Auldist et al., Reference Auldist, Morrish, Thompson and King1994; Kim and Easter, Reference Koketsu, Dial, Pettigrew and King2001; Eissen et al., Reference Eissen, Apeldoorn, Kanis, Verstegen and de Greef2003), because the sow compensates for the inadequate feed intake to maintain a high milk production. It is expensive for the sow to mobilize excessively from body reserves, because the body reserves must be reconstituted during the following gestation resulting in an increased feed cost. According to Dourmad et al. (Reference Dourmad, Étienne, Valancogne, Dubois, van Milgen and Noblet1996), sows were capable of regaining BW and BF lost during lactation through the following gestation when sows lost between 12 or 35 kg BW and 2.5 and 4 mm BF, but only if fed a high-energy level (10.0 Mcal ME/day v. 7.1 and 8.5 Mcal ME/day). Several older studies showed that increasing the feed allowance of the sow can minimize the body mobilization (Clowes et al., Reference Clowes, Williams, Baracos, Pluske, Cegielski, Zak and Aherne1998; Pluske et al., Reference Quesnel, Meunier-Salaün, Hamard, Guillemet, Etienne, Farmer, Dourmad and Père1998; Eissen et al., Reference Eissen, Apeldoorn, Kanis, Verstegen and de Greef2003), but if the physical upper limit for feed intake of the sow is already reached focus should be shifted toward optimizing nutrient concentrations of the feed instead and in this way try to limit the mobilization of body reserves.
Sow productivity and metabolism
Differences were seen between sows of different parities regarding milk production and body mobilization. First parity sows might be more sensitive to nursing large litters and mobilizing high proportions of body fat reserves could have caused the second litter drop seen in the current study. First parity sows mobilized 26% of their body fat and Schenkel et al. (Reference Strathe, Bruun, Zerrahn, Tauson and Hansen2010) showed that first litter sows dropped in second litter, when mobilizing >20% of their body fat, whereas mobilization of body protein did not affect litter size. In addition, first parity sows had a prolonged WEI compared with multiparous sows. This indicates that the metabolism of primiparous sows might differ from multiparous sows during lactation because they are not fully grown. Therefore, other feeding strategies or dietary compositions than used for older sows could help prevent negative effects of excessive mobilization on the subsequent reproductive cycle of these first parity sows.
Urea N in plasma increased during the first 3 weeks of lactation as a reflection of increased catabolism of amino acids caused by the higher protein intake (Le Cozler et al., Reference Lucia, Dial and Marsh1998; Mosnier et al., Reference Pluske, Williams, Zak, Clowes, Cegielski and Aherne2010), which was in accordance with Mosnier et al. (Reference Pluske, Williams, Zak, Clowes, Cegielski and Aherne2010) and Quesnel et al. (Reference Schenkel, Bernardi, Bortolozzo and Wentz2009). The decrease in plasma creatinine throughout lactation matches the higher BW loss during the 1st weeks of lactation compared with the last week before weaning. In contrast, Mosnier et al. (Reference Pluske, Williams, Zak, Clowes, Cegielski and Aherne2010) reported a constant concentration of creatinine in plasma, but in that study the sows did not lose weight during lactation. A higher mobilization of body protein increases plasma creatinine and the mobilized protein is to a great part redirected toward milk protein. In the current study, a higher daily protein output in milk resulted in a higher litter gain. A large protein mobilization during lactation is not desirable, because it is expensive for the sow to restore muscle protein in the following gestation (Dourmad et al., Reference Dourmad, Étienne, Valancogne, Dubois, van Milgen and Noblet1996), and this study indicates that milk production has a great impact on protein metabolism of the sow, and therefore an important focus of future research should be optimization of protein and amino acid requirements during lactation. The plasma concentration of NEFA, which is likely an indirect measurement of body fat mobilization (Le Cozler et al., Reference Lucia, Dial and Marsh1998; Mosnier et al., Reference Pluske, Williams, Zak, Clowes, Cegielski and Aherne2010) was highest during the first 2 weeks and then decreased to almost zero in the last 2 weeks of lactation, which is in accordance with observations made by Trottier and Easter (Reference Vadmand, Krogh, Hansen and Theil1995). This conforms with the higher BF loss during the 1st week compared with the last week of lactation as reported in the current study.
Sow reproduction in the following cycle
A higher feed intake during lactation was associated with a shorter WEI, which is in accordance with findings in previous studies (Koketsu et al., Reference Le Cozler, David, Beaumal, Johansen and Dourmad1997; Zak et al., Reference Zak, Williams, Foxcroft, Pluske, Cegielski, Clowes and Aherne1997) that reported a higher frequency of LH pulses after weaning in sows with a high feed intake during lactation. Luteinizing hormone pulses are a prerequisite for the sow to return to estrus after weaning. The regression models with total born piglets in next litter as response variable only explained very little of the variation (4% to 14%) in our data. The reason could be that many factors besides the ones measured in the current study in-between mating and farrowing have a great influence on litter size. Sows giving birth to many piglets in the first litter are prone to give birth to a high number of piglets in the subsequent litter (Lucia et al., Reference Mosnier, Etienne, Ramaekers and Père2000; Hughes et al., Reference Kim and Easter2010), and in the regression models for parity 2 to 4 a positive effect of number of born piglets in the preceding litter was seen. A positive Pearson correlation coefficient was found between ADG of the litter, and the litter size in the subsequent litter and sows nursing large litters similarly had the highest ADFI during lactation. Studies have shown that feed intake especially during the last week before weaning, can have a positive effect on embryo survival (Baidoo et al., Reference Baidoo, Aherne, Kirkwood and Foxcroft1992; Zak et al., Reference Zak, Williams, Foxcroft, Pluske, Cegielski, Clowes and Aherne1997).
In conclusion, primiparous sows had a lower feed intake, ADG of the litter and a lower litter size in the next reproductive cycle, which was likely caused by a higher degree of body mobilization compared with multiparous sows. Both a high feed intake and a high mobilization of body reserves were a prerequisite for a high milk production. A low feed intake increased body mobilization and had negative effects on the subsequent reproduction, although a large increase in daily feed intake is perhaps not realistic. Instead, future research should focus on optimizing the dietary energy and nutrient concentrations of diets for lactating hyper-prolific sows and herein distinguish between primiparous and multiparous sows.
Acknowledgments
The project was funded by the Danish Pig Research Centre and the Faculty of Health and Medical Sciences, University of Copenhagen.