


Introduction
The ongoing destruction of heritage sites in the Middle East and North Africa is a well-known problem; the impact of the current conflicts and political instability on cultural heritage across the region is clear and is often highlighted in media reports. However, conflict is not the only threat to archaeology in the MENA region. Urban expansion, agricultural development, natural resource prospection and extraction, pollution, vandalism, looting, and even natural deterioration all pose major threats to the region's archaeological heritage. The situation in Libya is no exception. Since the revolution of 2011, the lack of regulations controlling these types of activities has only accelerated the rate at which these problems are increasing (Abdulkariem and Bennett Reference Abdulkariem and Bennett2014; Ensoli Reference Ensoli2012; Fitzgerald and Megerisi Reference Fitzgerald and Megerisi2015; Kane Reference Kane2015). In addition, acts of vandalism and looting are on the rise (see for instance Belzic and Mugnai et al., this volume). Libyan archaeologists and officials are doing all they can to protect and maintain their country's heritage, often with only very limited resources available and at great personal risk (Abdulkariem Reference Abdulkariem2013; Hussein Reference Hussein2013). However, their work is becoming more and more difficult and it is all but impossible for international teams to enter the country. Despite these serious problems, archaeologists in Libya and elsewhere are continuing to document heritage by employing new technologies, in particular remote sensing techniques (Nebbia et al. Reference Nebbia, Leone, Bockmann, Hddad, Abdouli, Masoud, Elkendi, Hamoud, Adam and Khatab2016; see also Kane, this volume, on capacity building).
The Endangered Archaeology of the Middle East and North Africa Project (EAMENA; www.eamena.org) has developed a methodology and database for the rapid documentation of archaeological sites and the disturbances and threats affecting them. Established in 2015 and funded by the Arcadia Fund, the purpose of the EAMENA Project and the database is to provide a platform to record and disseminate data and information about archaeological sites of all periods across the MENA region, from Mauritania to Iran, to those people responsible for cultural heritage in each of the countries involved, to aid them in their efforts to protect and maintain these sites (Bewley et al. Reference Bewley, Wilson, Kennedy, Mattingly, Banks, Bishop, Bradbury, Cunliffe, Fradley, Jennings, Mason, Rayne, Sterry, Sheldrick, Zerbini, Campana, Scopigno, Carpentiero and Cirillo2016).
The EAMENA methodology
The EAMENA Project uses an interdisciplinary methodology to identify and record archaeological sites as well as any disturbances and threats affecting them. Our primary methodology emphasises remote sensing and image interpretation, but also incorporates field survey, aerial photography and data from existing published and unpublished material (Bewley et al. Reference Bewley, Wilson, Kennedy, Mattingly, Banks, Bishop, Bradbury, Cunliffe, Fradley, Jennings, Mason, Rayne, Sterry, Sheldrick, Zerbini, Campana, Scopigno, Carpentiero and Cirillo2016). This type of approach has been used by a number of significant projects in Libya since the 1980s, for example the UNESCO Libyan Valleys Surveys Project (Barker et al. Reference Barker, Gilbertson, Jones and Mattingly1996a; see also Allan and Richards Reference Allan and Richards1983; Dorsett et al. Reference Dorsett, Gilbertson, Hunt and Barker1984), and more recently the ERC-funded Trans-Sahara Project (University of Leicester). Many other projects throughout the MENA region have also used similar methodologies to good effect, for example the Fragile Crescent Project in Syria, Iraq, and Turkey (University of Durham), and the Aerial Archaeology in Jordan Project (Universities of Western Australia and Oxford, www.apaame.org). Since January 2015, the EAMENA Project has recorded over 150,000 sites across the MENA region, from earliest prehistory until the mid-twentieth century, using this methodology. These data are recorded in a database that was designed and customised using the open-source Arches platform, developed by the Getty Conservation Institute and the World Monuments Fund (archesproject.org; ZerbiniReference Zerbini2016).
The increasing availability of higher resolution imagery, especially via free open-access platforms such as Google Earth, allows mapping and interpretation to be undertaken in locations where fieldwork is restricted due to outside factors such as conflict, at a speed and scale not previously possible. As a result, more and more archaeological projects have begun to take advantage of remote sensing for recording archaeology in Libya (e.g. Cuttler et al. Reference Cuttler, Gaffney, Gaffney, Goodchild, Howard and Sears2009; LeQuesne et al. Reference LeQuesne, Basell and Sheibani2010; Mattingly and Sterry Reference Mattingly and Sterry2013; Sheldrick Reference Sheldrick2016; Sterry and Mattingly Reference Sterry and Mattingly2011; White et al. Reference White, Brooks, Drake, Charlton and McLaren2003). Examples of the types of imagery used by EAMENA for this paper are summarised in Table 1.
Image datasets used for the analyses presented in this paper.
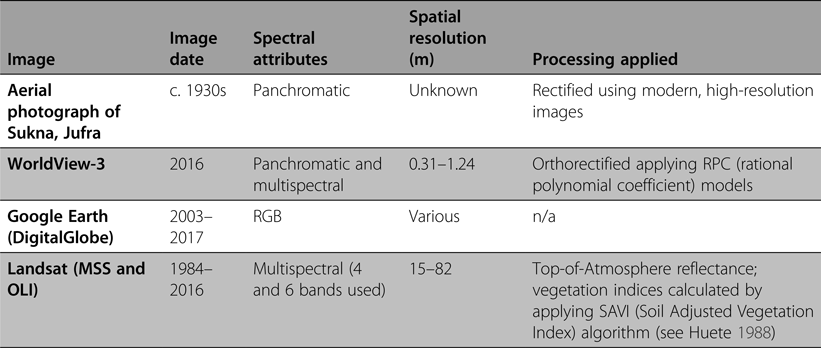
Lower resolution multispectral imagery such as Landsat makes it possible to quickly examine changes in modern activities, including agriculture and development, that directly threaten cultural heritage. For our work in Libya in particular, Landsat images from 1984 to 2016 were processed to obtain values of Top-of-Atmosphere reflectance, and vegetation indices were calculated using the image metadata and applying the SAVI (Soil Adjusted Vegetation Index) algorithm to highlight areas containing vegetation to track changes in the spread of agriculture and vegetation over large areas and long periods of time (Huete Reference Huete1988). Historical imagery such as declassified Cold War spy satellite images from the 1960s and 1970s was used by projects working in the Middle East (Donoghue et al. Reference Donoghue, Galiatsatos, Philip, Beck, Bewley and Raczkowski2002; Wilkinson Reference Wilkinson1997) and is now being employed in North Africa by various groups including EAMENA and the Trans-Sahara Project. Historic aerial photographs are also important sources and make it possible to identify and map sites which have since been badly damaged or completely destroyed.
EAMENA's principal methodology for data collection is based on the systematic examination and interpretation of free satellite imagery via sources such as Google Earth and Bing. There are two important issues to bear in mind when dealing with the identification and interpretation of features visible on imagery. First, the many different types of modern and historic imagery we employ vary widely in their quality and resolution; features that might be clear on one image may be invisible on another. We are constantly obtaining and analysing new sources and types of imagery, historic and modern, meaning that the information contained in our database is continuously evolving; new sites may be discovered and previously identified sites may be reassessed.
Second, image interpretation is highly dependent on the knowledge, previous experience and specific expertise of the individual doing the interpretation. It is impossible to completely eliminate this kind of subjectivity, but there are several ways in which our approach and the design of the database minimise these biases. Most importantly, training in image interpretation and data entry is provided to all new users in order to establish a degree of consistency in recording (see ‘Conclusion’ for more discussion about EAMENA's training initiatives). The EAMENA database also employs controlled vocabularies with specific definitions, available in both English and Arabic and applicable across the MENA region, to help people choose the most appropriate terms for what they are describing.
Another way that our methodology addresses both the problem of variable image quality and human subjectivity is our employment of certainty levels, which allow us to indicate how certain we are about our interpretation of the overall significance of a potential site and its different aspects. Thus, even when the interpreter is very uncertain about an interpretation, it can still be entered into our database. One of the advantages of this kind of approach is that when and if fieldwork becomes possible, these sites will be flagged up for investigation, which will in turn enable and encourage future archaeologists to update and enhance the original record with new data or indeed even to delete it if a feature turns out not to be of archaeological significance. The primary purpose of the EAMENA database is to serve as an inventory for heritage management applications and so for this reason our database and the resulting datasets may appear to differ significantly from other archaeological research projects.
It is also important to emphasise that although the primary method by which the EAMENA team identifies and interprets sites is through analysis of high-resolution satellite imagery, we also incorporate as much data from previous and active surveys, excavations and archives as possible, such as the Society for Libyan Studies archive housed at the University of Leicester (Leitch and Nikolaus Reference Leitch and Nikolaus2015). One of the most important aspects of our work is collaboration with other archaeologists and active field projects in the regions under study to confirm, enhance and, where necessary, correct data collected from satellite imagery. For example, in the case studies presented below, we were fortunate to be able to work directly with a Libyan archaeologist, Dr Mftah Ahmed (az-Zaytouna University and Department of Antiquities, Libya), who contributed dating material and information from field surveys to our analyses of the archaeology in the Zliten and Jufra regions.
Drawing on all of the resources described above, for each site identified we first record its physical and archaeological characteristics, including morphology, shape, extent, function, date, form and interpretation. Detailed data from previous surveys or excavations is incorporated when available, but more often than not sites located using remote sensing and imagery interpretation are previously unknown. Therefore, the structure of the EAMENA database has been designed in a manner that allows us to record the physical details of a site even when no clear interpretation or function is discernable from the available imagery. Again, from a heritage management standpoint, this is important because it allows us to make at least a basic record of potentially significant sites, even when we have little information about them, which can be enhanced later when better imagery can be obtained or fieldwork becomes possible.
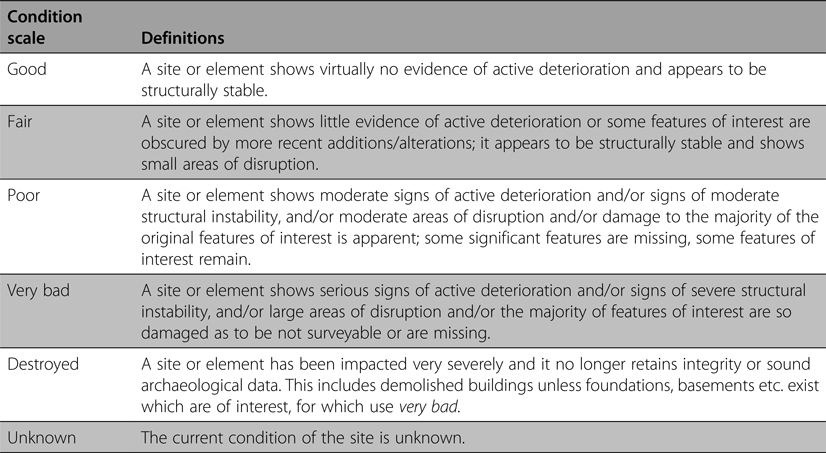
Once the basic characteristics of a site have been entered, their most recent known overall condition is assessed (Table 2) and the extent, type (including specific causes and effects where known) and dates of any known disturbances are recorded. Additionally, any issues that will continue to affect the site, or that could affect it within five years of the date of assessment judged on the basis of past activity in a given area, are also identified and recorded as threats.
Condition states and definitions as employed in the EAMENA database and throughout this paper.
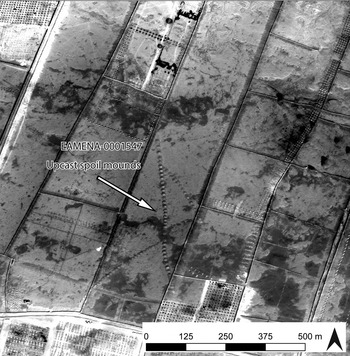
An example from the Jufra region of Libya presents a useful demonstration of the methodologies described above. A number of significant archaeological sites south-east of the town of Waddan were originally identified by Dr Martin Sterry in the context of his work for the Trans-Sahara Project (see Wilson et al., Reference Wilson, Mattingly, Sterry, Cuénod, Duckworth, Mattingly and Mattinglyforthcoming); these data were subsequently shared with EAMENA and entered into our database. Figure 1 shows a recent satellite image of one of these sites and Table 3 outlines the details entered in the EAMENA database for this site.
Heritage Resource EAMENA-0001547, identified as a foggara and damaged by fields. (Image: WorldView-3, 12 November 2016, © DigitalGlobe, Inc.)
Data recorded for Heritage Resource EAMENA-0001547, identified as a foggara and damaged by field boundaries.

The satellite imagery shows a series of mounds, each marking a deep shaft, arranged in straight lines. The site has been interpreted as a type of subterranean groundwater-collecting conduit known as a foggara (or qanat), with three tributary branches. The construction of the regularly spaced shafts created the upcast spoil mounds which give this type of feature its distinctive appearance when viewed from above. Our certainty of this interpretation is high because it is supported by comparison with examples recorded by surveys and excavations in Libya and throughout the MENA region (e.g. Mattingly et al. Reference Mattingly, Daniels, Dore, Edwards and Hawthorne2007; Wilkinson and Rayne Reference Wilkinson and Rayne2010; Wilson Reference Wilson and Wilson2009; Wilson and Mattingly et al. Reference Wilson, Mattingly and Mattingly2003), as well as the expertise of our image interpreters, many of whom have personal expertise with recording these features in the field. This experience has also allowed the team to add further detail to the record, such as the fact that each individual shaft must connect to an underground canal, even though the tunnel is not visible on the imagery. Because this site has not been confirmed on the ground, no dates can be assigned to it.
In addition to the archaeological feature itself, also clearly visible on the imagery in Figure 1 are features that can be interpreted as modern field boundaries, which appear to have been constructed using heavy machinery directly over the lines of the foggara. Therefore, the record reflects that the site has been disturbed by clearance activities, undertaken by bulldozers, for an agricultural purpose. Based on the past activity in the area, it seems likely that these kinds of activities could continue within the next five years, so the threat of further disturbance has also been recorded.
Case studies
Case studies were undertaken by the authors in four different regions of western Libya: the coastal hinterlands around Zliten, a section of the Wadi Sofeggin and the Bir Scedua basin in the Tripolitanian pre-desert, the Jufra oases of Sukna, Hun and Waddan, and an area in the region of Murzuq in Fazzan (Figure 2). Each case study investigates one or more ‘squares’ covering an area one-quarter degree latitude by one-quarter degree longitude, which is the standard area of survey employed by EAMENA in our remote sensing activities.
Overview map showing locations of case studies presented in this paper. (Background: Landsat 8 from ArcGIS Online. Source: Esri, USGS/NASA Landsat.)

Zliten
This case study focuses on an area of c. 600 km2, centred on the modern settlement of Zliten and its surrounding agricultural lands. The well-known coastal Roman villa at Zliten (also known as Dar Buk Ammara) is located in this square, having been excavated in the early twentieth century and from which several spectacular mosaics were recovered (Aurigemma Reference Aurigemma1926; Foucher Reference Foucher1964; Parrish Reference Parrish1985). However, apart from the villa excavation and a small unpublished survey of a number of coastal sites in the surrounding area by Dr Mftah Ahmed in 2013 (Ahmed, pers. comm.), there has been little archaeological investigation undertaken in this region. However, a number of zones in the hinterlands of Lepcis Magna (approximately 30 km north-west of Zliten) immediately to the west of this area have been the focus of investigations by an Italo-Libyan team from the Università Roma Tre (Cifani et al. Reference Cifani, Munzi, Felici, Cirelli and Khanoussi2003; Cirelli et al. Reference Cirelli, Felici, Munzi and Galetti2012; Fontana et al. Reference Fontana, Munzi and Ricci1996; Munzi Reference Munzi, Tantillo and Bigi2010; Munzi et al. Reference Munzi, Felici, Cifani, Cirelli, Gaudiosi, Lucarini and Matug2004; Reference Munzi, Felici, Cifani and Lucarini2005; Reference Munzi, Felici, Cirelli, Schingo and Zocchi2010; Reference Munzi, Felici, Sjöström and Zocchi2014; Reference Munzi, Felici, Matoug, Sjöström and Zocchi2016; Musso et al. Reference Musso, Baldoni, Bianchi, Calì, Davidde, Di Vita-Evrard, Munzi, Petriaggi, Pinna Caboni, Ponti and Shebani2010). They identified a wide landscape of Roman and Islamic rural settlement and agriculture, which provides useful comparanda for many of the archaeological sites identified by the EAMENA team.
We recorded 278 certain or potential archaeological sites within the Zliten square. Of these, ten were previously known from the investigations mentioned above, while the rest were identified using Google Earth imagery dating between 2003 and 2017. The majority of the sites recorded were interpreted as buildings or enclosures, most of which were probably related to agricultural activities, the primary land use today. There was a much greater density of sites identified in the southern part of the square (Figure 3), probably a reflection of the current extent of modern settlement and agriculture rather than ancient reality. While the c. 8–10 km wide strip along the coast is almost entirely built up or under intense cultivation, south of that agricultural activity and settlement is largely confined to the wadi systems with relatively undisturbed areas remaining between. It is probable that many archaeological sites once existed, or indeed still exist, in the area closer to the coast, but these have already been destroyed or disturbed to an extent that they are not visible on satellite imagery. Analysis of Landsat imagery suggests that the extent of agricultural activity has not expanded much between 1987 and 2016, so it is likely that any disturbance to sites nearer the coast occurred before the 1980s. Further investigations on the ground or using historical imagery can be undertaken in the future to identify any such sites.
Distribution of sites around Zliten divided by condition state. (Background: Landsat 8. Data available from the U.S. Geological Survey.)
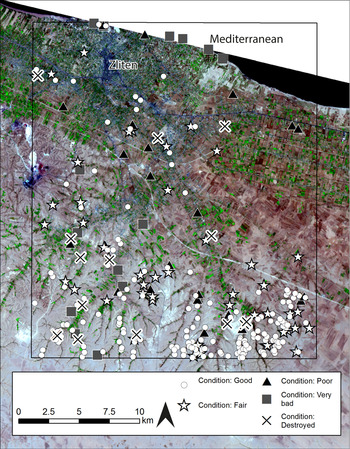
Of the 278 sites recorded in the EAMENA database in this area, 170 were recorded as being in good condition, with a further 50 recorded as fair. A large proportion of these are located at the southern end of the square and their good preservation can probably be related to their distance from the main areas of modern settlement and cultivation. Twenty-four sites have been identified as in poor condition, 15 in very bad condition, and 16 were recorded as having been completely destroyed, leaving three unknown (Figure 3). Sites recorded as being in poorer condition were observed throughout the square, emphasising that even sites further away from modern activity are not completely immune to disturbance.
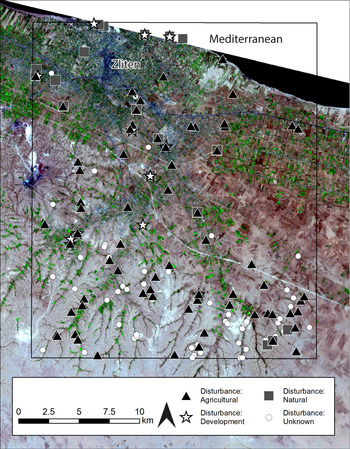
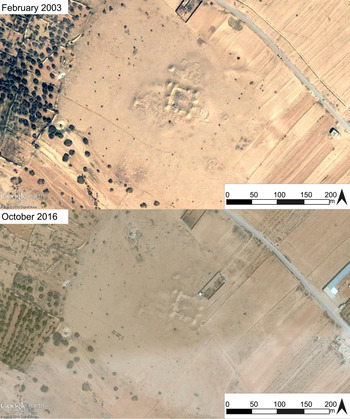
It was not always possible to identify the category of disturbance with certainty from satellite imagery. Nevertheless, our analyses suggest that the greatest threats to the archaeology of this area are agricultural activity, such as ploughing and the cultivation of crops, and modern development, including the clearance of land and construction of new buildings (Figure 4). In Figure 5, we see an ancient fortified building with traces of settlement around it. In 2003 there is already some disturbance in the form of bulldozer tracks and active agricultural fields are visible all around the site. By 2016, a large compound has been constructed immediately adjacent to the eastern edge of the fortified structure and settlement. In addition, a number of new field boundaries have been constructed. It is probable that these activities have already damaged or destroyed structures at the edges of the settlement and the imminent threat to the rest of the site is clear.
Distribution of sites around Zliten divided by main disturbance categories. (Background: Landsat 8. Data available from the U.S. Geological Survey.)
Site EAMENA-0113569, in 2003 and 2017, showing agricultural buildings and fields encroaching on archaeological structures. (© DigitalGlobe, via Google Earth.)
Although the vast majority of sites in this square have been classified as in good or fair condition, the future threat to these sites is significant. Of the 278 sites recorded, 158 were also judged as being under possible or probable threat from future disturbances within the next five years. In most cases this is likely to take the form of continued agricultural activities where sites are already within cultivated lands or where, based on previous patterns of activity observed in the imagery, agricultural or urban expansion appears likely to take place.
Pre-desert
The next case study investigates an area of the Tripolitanian pre-desert, encompassing a section of the middle Wadi Sofeggin and a number of its tributaries, in the region of the modern town of Nasmah. A large number of the sites within this square were already known from previous studies, primarily the UNESCO Libyan Valleys Survey (ULVS) which had undertaken field survey in select areas along the main course of the Wadi Sofeggin and the Bir Scedua basin in the 1980s (Barker et al. Reference Barker, Gilbertson, Jones and Mattingly1996b; see also Gentilucci Reference Gentilucci1933; Goodchild Reference Goodchild1950; Mattingly et al. Reference Mattingly, Sterry and Leitch2013, 183–84). The sites they identified largely dated to the first to fifth centuries AD and could generally be classed as rural, agricultural and pastoral settlements, including large fortified structures, open farm buildings and enclosures, and other associated features such as cemeteries and wadi walls. The remote sensing survey undertaken by the EAMENA team using imagery accessed via Google Earth dating between 2003 and 2016 has increased the number of known sites in this square from 103 identified by the ULVS team to 1030 within an area of 660 km2 (Figure 6).
Distribution of sites recorded by the UNESCO Libyan Valleys Survey and those recorded by EAMENA. (Background: Landsat 8. Data available from the U.S. Geological Survey.)
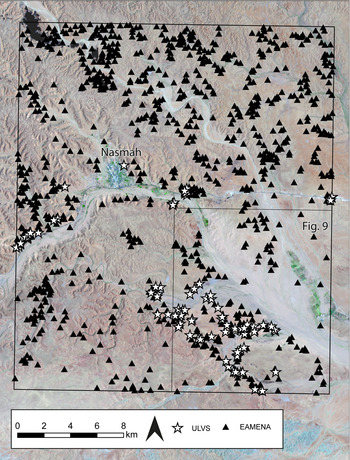
The features and sites identified by the EAMENA team largely seem to correspond to those identified by the previous investigations mentioned above. The most commonly identified features were interpreted as buildings and enclosures of varying type and size. In most cases, the function of these structures cannot be determined with complete confidence based on the imagery alone. However, comparison with what we know from the examples identified by the ULVS and other earlier studies suggests that the majority were probably also related to agricultural and pastoral activities. In addition, many other features associated with agricultural and pastoral settlement were also identified, including hilltop settlements, wadi walls and field systems, cisterns and cemeteries.
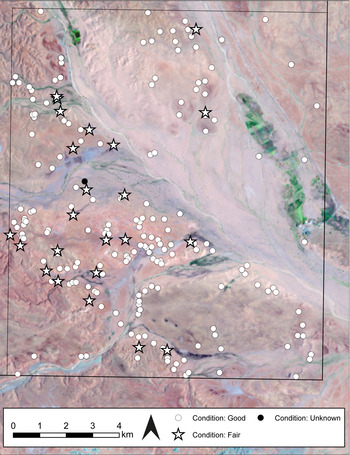
In this case, our analysis of the sites in this square is still in progress, but it is possible to present the results from the south-east quarter of the square, an area of c. 165 km2, which covers a large part of an area known as the Bir Scedua basin. All of the sites in this area were recorded as being in good or fair condition, with the exception of a single example for which the condition is currently unknown (Figure 7). Analysis of Landsat images from 1987 and 2016, with the areas of vegetation highlighted in white, emphasises that comparatively little development has occurred in this area over the last 30 years (Figure 8). With the exception of the area in the immediate vicinity of the town of Nasmah, overall the landscape of this square appears largely undisturbed by modern activity.
Distribution of sites in the area of the Bir Scedua basin divided by condition state. (Background: Landsat 8. Data available from the U.S. Geological Survey.)
Vegetation indices (SAVI) produced from Landsat imagery from 1987 and 2016 for the pre-desert square. The brightest areas represent vegetation. (Background: Landsat 8. Data available from the U.S. Geological Survey.)

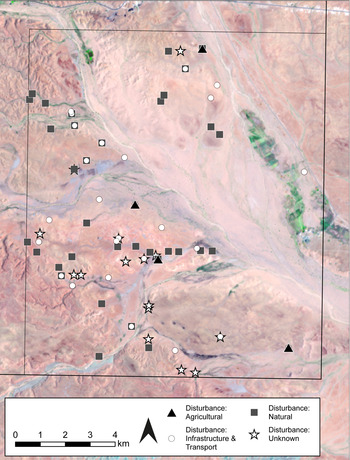
While the threat of modern disturbances to archaeological sites therefore appears to be relatively low in this region, some form of disturbance was still recorded at 64 of the 203 sites analysed so far, and 113 were identified as being possibly or probably under threat in coming years. The most frequently recorded source of disturbance or likely threat was natural, commonly water action causing erosion, particularly of ancient field walls which are located very close to the edges of the wadis or in the wadi beds themselves (Figure 9). The second most common form of disturbance was roads or tracks indicating that vehicles, including in some cases bulldozers, had been driven over the site. In a few cases, modern agricultural activity had also affected sites, but this was less common.
Distribution of sites in the area of the Bir Scedua basin divided by category of disturbance. (Background: Landsat 8. Data available from the U.S. Geological Survey.)
Jufra
The Jufra area is located in the Sahara and consists of three oases (Sukna, Hun and Waddan) around which modern activity and traces of ancient occupation are clustered, facilitated by access to groundwater, essential in this hyper-arid environment. The Jufra chain of oases is an area of significant archaeology of several types and periods. The historic centres of the oases were described by travellers passing through in the nineteenth century (Rohlfs Reference Rohlfs1881; Scarin Reference Scarin1938), but until recently the area has been relatively under-studied. Together with the Trans-Sahara Project, we have now been able to undertake a detailed remote sensing-based analysis using a range of datasets (Wilson et al., Reference Wilson, Mattingly, Sterry, Cuénod, Duckworth, Mattingly and Mattinglyforthcoming). Both EAMENA and the Trans-Sahara Projects are also collaborating with Dr Mftah Ahmed, who has recorded a range of archaeological sites in the Jufra area, including settlements, cairn cemeteries and cultivation supported by foggara irrigation systems, all ranging from the first millennium BC to early modern times.
Since the 1970s, agricultural activities have expanded greatly in the oases, in large part thanks to large-scale groundwater extraction programmes (e.g. the Great Man-Made River Project; Fookes et al. Reference Fookes, Stoner and Mackintosh1993). The three main settlement centres have also expanded in tandem with the agriculture, with new constructions and associated infrastructure. As a result, these areas have been particularly badly damaged and, in some cases, it is only possible to record data about the now destroyed heritage of these areas using legacy data such as historic aerial photographs.
A striking example of this is the post-medieval town of Sukna (Figure 10). Historical aerial photographs and declassified Corona satellite images show a walled settlement containing densely packed buildings and some larger structures; one of these, a central castle, is still partially preserved. The only other feature to survive is a cleared area that corresponds in its shape to the space the historic town formerly occupied. Based on image interpretation of different datasets, it appears that the damage to the historic town occurred sometime between the 1990s and 2004.
The old town of Sukna in the 1930s (from Scarin Reference Scarin1938) and in 2010. (ArcGIS World Imagery: Source: Esri, DigitalGlobe, GeoEye, Earthstar Geographics, CNES/Airbus DS, USDA, USGS, AeroGRID, IGN, and the GIS User Community.)

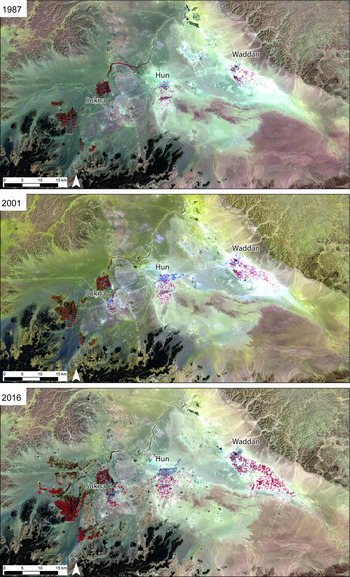
Analysis of Landsat images show how land use in the area has changed between 1987 and 2016. The false-colour composites (Figure 11) show how the oases have expanded to the west and the south, particularly in recent years. The conflict and instability since 2011 have not halted the intensification of agriculture; rather, it is continuing in an unregulated way.
Landsat false colour composites showing how the oases have expanded since 1987. (Data available from the U.S. Geological Survey.)
In addition to the Landsat analysis, three squares covering the Jufra area were surveyed remotely, covering an area of just over 2,000 km2. From west to east, the number of sites recorded in the EAMENA database in each square were 34, 40 and 17 respectively, totalling 91 across these three squares.
Of the 91 sites recorded, one was recorded as in good condition and 12 as fair (Figure 12). The single site with no clear evidence of disturbance is a fortification of fairly recent date (probably nineteenth or twentieth century) in the centre of Hun; the site may have been restored or protected, but it is not possible to determine this with certainty from the satellite imagery alone. Another site with more definite evidence of restoration work is the historic post-medieval town of Hun; although it was preserved, parts of the site were removed during the twentieth century and so its condition has been recorded as fair. Several other early medieval towns to the north of the modern oasis centres and areas of field systems were also described as being in fair condition. Although their walls are eroded and they are partially obscured by wind-blown sand, we are not aware of any specific instances of disturbance that have affected these sites.
Distribution of sites in the Jufra oases divided by condition. (Background: Landsat 8. Data available from the U.S. Geological Survey.)

A number of sites of all types were identified as being in poor condition, distributed across all areas of the oases. This was the largest category represented in the condition assessment (35 of 91 sites), revealing that there are many sites which have been badly damaged and are at risk, but are not completely destroyed, and are therefore in most urgent need of protection. Many of these were foggaras to the south of Waddan and medieval settlements and field systems near each oasis. Other sites were either very badly damaged or were completely destroyed. Again, some of these were found close to the modern centres but there were also several further out towards the periphery of the oases.
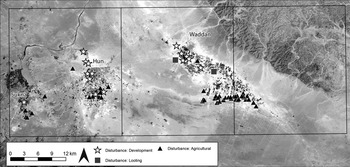
Figure 13 shows the distribution of sites disturbed by activities that fall into the categories of development, agriculture and looting. Our remote sensing methodology is more useful for recording disturbance caused by activity that takes place on a wider scale and is thus more visible, such as construction work and agriculture. In the Jufra area, we found that 15 sites had been damaged by development activities, including construction and bulldozing. A further 47 had been damaged by agricultural activity, such as ploughing and field clearance and the construction of field boundaries; at least nine of these were destroyed before 2000. In particular, the areas where modern agriculture is expanding correspond to areas where agriculture was practised in the past, causing features including ancient field boundaries and foggaras to be damaged and destroyed.
Distribution of sites in the Jufra oases divided by main causes of disturbance. (Background: Landsat 8. Data available from the U.S. Geological Survey.)
Our assessment of the forms and condition of cultural heritage in the Jufra oases shows that on the whole sites of all types and periods have been damaged and are at risk of further disturbance or even destruction. While many sites closest to the modern centres are at particular risk of being damaged by construction and development-related activities, sites on the periphery of the oases are also under significant threat, especially from agricultural and infrastructure-related expansion.
Murzuq
This case study focuses on a square in Fazzan in the south of Libya which contains the oasis town of Murzuq and the surrounding area. This region shows some of the most rapid agricultural and domestic development in Libya and subsequently a large number of archaeological sites are severely endangered or are already destroyed. Overall, 153 archaeological sites were recorded in the EAMENA database within the square using satellite imagery from Google Earth dated between 2003 and 2016.
This area around Murzuq is of particular archaeological interest because the distribution of settlement in the past has been shown to be very different from modern habitation patterns (Edwards Reference Edwards2001, 57–58; Sterry and Mattingly Reference Sterry and Mattingly2011, 105; Sterry et al. Reference Sterry, Mattingly and Higham2012, 127). This shift in settlement patterns over time has made the area particularly rich in archaeological remains that elsewhere are often covered by later settlements. Parts of this region were surveyed on the ground by Charles Daniels in 1968 (Edwards Reference Edwards2001; Mattingly et al. Reference Mattingly, Daniels, Dore, Edwards and Hawthorne2007) and by the Leverhulme Trust-funded Peopling the Desert Project in 2011 (University of Leicester: Sterry and Mattingly Reference Sterry and Mattingly2011; Reference Sterry and Mattingly2013; Sterry et al. Reference Sterry, Mattingly and Higham2012); satellite imagery survey has also been undertaken in recent years by Dr Martin Sterry as part of his work for both the Peopling the Desert and Trans-Sahara Projects. However, the area still remains relatively underexplored despite its rich archaeological heritage.
The presence of numerous abandoned ancient villages, large fortified buildings, abandoned field systems and cemeteries demonstrate that Murzuq was settled over a long period of time, from the prehistoric and Garamantian to the medieval and Ottoman periods (Sterry and Mattingly Reference Sterry and Mattingly2013 and Sterry et al. Reference Sterry, Mattingly and Higham2012 for radiocarbon dates). This development bears similarities to the situation in the Wadi al-Ajal, just to the north, where agricultural and village-based societies advanced on a large scale during the Garamantian periods (Mattingly and Sterry Reference Mattingly and Sterry2013; Sterry and Mattingly Reference Sterry and Mattingly2011, 103; Reference Sterry and Mattingly2013, 103–104; see also Mattingly et al. Reference Mattingly, Dore, Edwards and Hawthorne2003; Mattingly et al. Reference Mattingly, Daniels, Dore, Edwards and Hawthorne2007). Traces of abandoned wells and foggaras suggest a sophisticated farming community with complex systems of water supply (Sterry and Mattingly Reference Sterry and Mattingly2011, 112–13). The town of Murzuq is the largest settlement in the area, situated in the centre of the oasis belt. It was probably founded in the fifteenth or sixteenth centuries and was made the capital under both Awlad Muhammad and Qaramanli rule in the region (el-Hesnawi Reference el-Hesnawi1990, 135–54; Mattingly et al. Reference Mattingly, Dore, Edwards and Hawthorne2003, 98–106; Sterry and Mattingly Reference Sterry and Mattingly2013, 133).
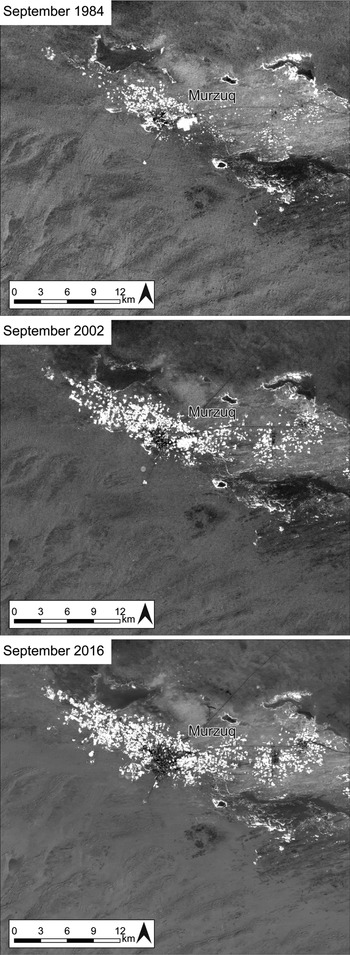
As in the Jufra region discussed above, one of the main causes of disturbance to sites in the region of Murzuq is the agricultural expansion that has taken place over the last 30 years and is particularly visible on vegetation indices produced from Landsat images taken between 1984 and 2016 (Figure 14; cf. also Eldblom Reference Eldblom1968, 83–100, especially figs 24 and 25, which map the oasis in 1958 and 1963). The rapid development of agriculture since the 1980s suggests that many ancient sites may have been destroyed prior to 2003, the date of the earliest high-resolution satellite imagery available in Google Earth for the area. Investigation of historical aerial photographs in the future will add more details and may refine this chronology.
Vegetation indices (SAVI) produced using Landsat images showing the agricultural expansion in the Murzuq oasis between 1984 and 2016. The brightest areas represent vegetation. (Background: Landsat 8. Data available from the U.S. Geological Survey.)
Until recently, most agricultural development has taken place around the modern town of Murzuq and along the main oasis belt, which allowed some extraordinary remains of fortified buildings and abandoned villages located slightly outside this zone to survive. Since the Arab Spring in 2011, agricultural and housing developments have expanded rapidly in this region, threatening and destroying many sites that were still in existence when the Peopling the Desert team recorded them in 2011.
Of the 153 sites recorded, none was recorded as being in good condition and only two were given a condition of fair. These latter two show clear signs of repair and continuous upkeep, but are nevertheless damaged to some degree. For instance the castle in the old town of Murzuq appears to be in a fair state of repair, but parts of the defensive surrounding walls have almost disappeared. Forty sites were assigned a poor state of preservation, 66 were classed as very bad, 19 as destroyed, and 26 as unknown (Figure 15).
Distribution of sites in the Murzuq area divided by condition state. (Background: Landsat 8. Data available from the U.S. Geological Survey.)
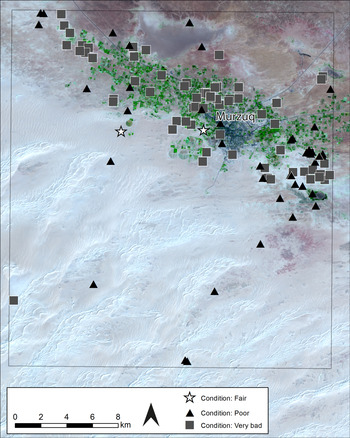
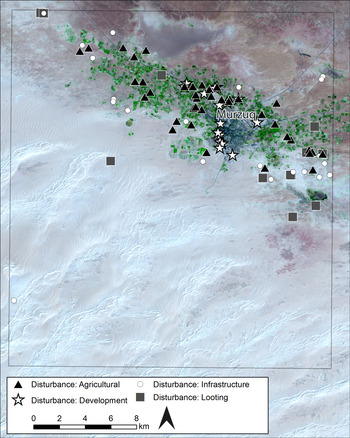
Unfortunately, the majority of sites recorded in this square are therefore in a poor or very bad state. This is partly due to natural causes such as wind action, where moving sands cover and slowly erode the abandoned mudbrick constructions. Another major threat to the region's cultural heritage is the rapid agricultural and urban expansion along the stretch of oasis (Figure 16). Modern irrigation techniques are enabling farmers to move further and further away from the oasis centre. The remains of abandoned settlements, fortified structures and cemeteries that were previously at a safe distance from any agricultural activity or urban expansion are now threatened by bulldozing, ploughing and cultivation, as well as the modern farm buildings and enclosures that frequently accompany this expansion.
Distribution of sites in the Murzuq area divided by main categories of disturbance. (Background: Landsat 8. Data available from the U.S. Geological Survey.)
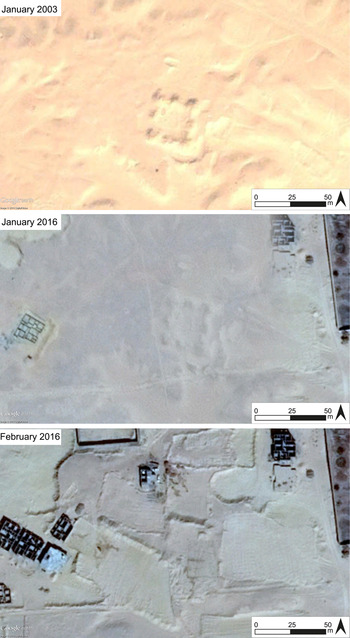
The town of Murzuq has expanded substantially over the last decade, particularly since 2011. Large areas on the outskirts of the town have been bulldozed, levelling post-medieval buildings, cemeteries and field systems to provide room for new housing. Recently, sometime in January or February 2016, the fortified building recorded as MZQ002, about 3 km north-east of Murzuq town centre, was bulldozed (Figure 17; Mattingly et al. Reference Mattingly, Daniels, Dore, Edwards and Hawthorne2007, 278).
MZQ002 in January 2003, showing increasing disturbances in January 2016, and a major bulldozing event in February 2016. (© DigitalGlobe, via Google Earth.)
Much larger modern dwellings are slowly replacing the post-medieval town of Murzuq (MZQ001) with its small and densely packed buildings. Between 2012 and 2016, large parts of the post-medieval town, which was abandoned at some point before the nineteenth century (Mattingly et al. Reference Mattingly, Daniels, Dore, Edwards and Hawthorne2007, 78; Sterry and Mattingly Reference Sterry and Mattingly2013, 133), has been bulldozed and has now almost completely disappeared under newly constructed houses. The fifteenth- or sixteenth-century wall circuit with its D-shaped towers has almost entirely disappeared (Figure 18).
Abandoned medieval town of Murzuq (MZQ001) in January 2003, July 2013, and February 2016 showing construction of modern structures over the old town. (© DigitalGlobe, via Google Earth.)

Due to the domestic and agricultural expansion as well as developing infrastructure and transport beyond the central oasis belt, 83 of the 153 sites recorded in this square are now under threat of experiencing new or further disturbance or being completely destroyed in the near future (see also Bennett and Barker Reference Bennett and Barker2011, 13–14, and Mattingly Reference Mattingly and Ensoli2012 for an overview of the threats affecting the archaeology of Fazzan).
Discussion
In the sections above, we have presented data and analyses of cultural heritage sites recorded by the EAMENA Project across six survey squares in four areas of western Libya. These case studies represent several different environments present in Libya, from the coastal and pre-desert areas to oases in the Sahara, and the different densities of archaeology recorded, ranging from 17 to over 1,000 sites in a single square, demonstrate the wide variability of Libya's archaeological landscapes.
These analyses have begun to reveal the scale and wide variety of threats to Libya's heritage. Damage caused directly by armed conflict, such as the destruction of medieval Islamic tombs at Zuwila or the mosques in Tripoli (Kingsley Reference Kingsley2015), often receives the most media attention. The analyses undertaken here serve to highlight the many causes of disturbance and threats beyond this particular problem. In three of our four case studies, the largest threat to cultural heritage is agricultural expansion and development, particularly within and immediately surrounding modern settlements. Examination of Landsat imagery over the long term also allows us to predict areas where sites might be most at risk, often where urbanism and cultivation are expanding out from the current centres.
Agricultural expansion was the main cause of disturbance in the Jufra and Murzuq squares, and also a significant issue in the Zliten square. In the Jufra region, 47 sites were damaged by agricultural expansion as a result of an extension from areas where cultivation has been taking place since the 1980s. In the region of Murzuq, 42 sites were recorded as being disturbed by agriculture, and 68 in the Zliten area. The conflict in 2011 has not halted these activities in any of these areas. In the Saharan region in particular, there appears to be little regulation controlling agricultural expansion and increasing use of modern techniques to extract groundwater for irrigation has facilitated expansion of modern fields at the expense of archaeology (see e.g. Mattingly et al. Reference Mattingly, al-Aghab, Ahmed, Moussa, Sterry and Wilson2010).
Development proved to be a significant cause of disturbance to archaeology in all the areas assessed, particularly in the historic towns of the Jufra and Murzuq oases. Development pre-dating the modern satellite images available through Google Earth has probably already destroyed many sites in the coastal zone of Zliten. These can now only be mapped using historical imagery, emphasising the importance of incorporating historic aerial photographs and declassified Cold War spy satellite imagery into investigations of Libya's archaeology to try to recover data about what has already been lost.
Disturbance by wind and water action can also erode and obscure sites and this is a significant cause of damage to archaeological heritage in the pre-desert square where high peak flows have eroded sites along the edge of wadis. Sites obscured and eroded by wind-blown sand were also recorded in the Jufra and Murzuq squares. This ‘benign neglect’ of heritage should also be recorded because sites could be protected from natural decline in the future just as they can be protected from deliberate damage.
The vast majority of sites in the Murzuq region (125 of 153) and in the Jufra area (78 of 91) were recorded as being in poor or worse condition; in the Zliten area, 55 of 278 fell within these categories. It is clear that archaeological sites closest to modern activity are at highest risk of damage. There appears to be less urgency of active disturbances and threats to archaeology in the pre-desert, where all of the 203 sites analysed so far were in fair or good condition, and it appears that development activities in that area are currently limited. However, there is little doubt that in all areas of Libya, as populations and demands for land and resources grow, even currently marginal areas will also come under threat.
While the types of problems identified and discussed above seem more mundane than damage caused by conflict, they are no less urgent. Indeed, agricultural expansion and development are often still indirectly connected to the conflict. In Libya, the ongoing political instability after the Arab Spring led to a lack of regulations controlling the development of housing and agriculture. Furthermore, the regulations concerning the identification and protection of archaeological sites that do exist are very difficult to enforce. Prior to 2011, construction that would impact on known ancient sites was strictly regulated and the Gaddafi regime had exceptionally restrictive policies in place that prohibited people from expanding their properties. Since many of these restrictions are no longer observed and controlled, agricultural and domestic development has increased on a previously unprecedented scale (Fitzgerald and Megerisi Reference Fitzgerald and Megerisi2015). This recent development is particularly noticeable in Murzuq and Jufra, where many sites were damaged or destroyed after 2011, as in the example of the post-medieval town of Murzuq. Work to record archaeological features before they are gone, and to protect those at risk, needs to take into account all of these different modern activities. In addition, sites in and around the peripheries of modern centres are particularly vulnerable to development and it is important that work not be overly focused around the better-known centres at the expense of sites on the margins of current occupation.
Conclusion
The work of the EAMENA Project in Libya is only in its early stages and it is clear that much important work remains to be done. However, the value of using satellite imagery and aerial photography to remotely record and monitor sites is evident. Especially during times when travel to Libya is difficult or impossible, remote sensing is an important means by which foreign archaeologists can continue to support the work of Libyan colleagues working within the country. Archaeological sites within or close to areas of current occupation have already suffered varying amounts of disturbance and many more are threatened by future development. The potential for answering major research questions concerning both the distribution of different types of archaeological sites and landscapes and also the different factors that are disturbing and posing immediate threats to those landscapes, has increased as a result of these surveys. In particular, the potential for our database to investigate these issues on a MENA-wide scale, incorporating current ideas surrounding ‘big data’ in archaeology and beyond (cf. Cooper and Green Reference Cooper and Green2016), will, it is hoped, provide new and interesting insights into the issue of heritage recording, disturbances and threats across the region.
The most important purpose of the EAMENA Project and our database, however, is to be a tool that can be utilised by our colleagues in MENA countries, to help them to identify and protect heritage sites that are under immediate threat. Over the next three years, thanks to a grant provided by the British Council's Cultural Protection Fund, EAMENA will collaborate with Libyan colleagues and other international teams to provide training to heritage officials and scholars within the country in our remote sensing techniques and database and recording methodologies. The case studies discussed in this paper emphasise how urgent the threat to the archaeology of Libya is, but also provide a demonstration of one approach that can be used to address these issues and which can be easily taught and replicated. It will not be possible to protect all the heritage sites across the country; however, it is essential to raise awareness of both the immediate and long-term threats, and to continue to develop the strategies, tools and relationships that will make it possible to monitor and record Libya's heritage sites before they are lost forever.
Acknowledgements
The EAMENA Project is a partnership between the Universities of Oxford, Leicester and Durham under the leadership of Dr Robert Bewley (Project Director, Oxford), Professor Andrew Wilson (Principal Investigator, Oxford), Professor David Mattingly (Co-Investigator, Leicester) and Professor Graham Philip (Co-Investigator, Durham). We are funded by the Arcadia Fund for documentation, database development and fieldwork, as well as the British Council's Cultural Protection Fund (2017–2020) to train heritage professionals from six countries in the EAMENA methodology.
EAMENA's research in North Africa is directed by Professor David Mattingly and primarily based at the University of Leicester; we have thus been able to share data and expertise with the Leicester-based ERC-funded Trans-Sahara and Leverhulme Trust-funded Peopling the Desert Projects, also directed by Professor Mattingly. We are particularly grateful to Dr Martin Sterry (Leicester) who, as image analyst on both of these projects and Affiliate Research Fellow with EAMENA, shared data and locations of a number of sites in the Jufra and Murzuq regions he identified using Google Earth. We are similarly grateful to Dr Mftah Ahmed (az-Zaytouna University and Department of Antiquities, Libya) for sharing data from his fieldwork in the Jufra and Zliten regions.
This paper was developed from a presentation delivered at the Libyan Antiquities at Risk workshop in March 2016 by Professor Andrew Wilson (Oxford), Dr Louise Rayne (Leicester) and Dr Nichole Sheldrick (Oxford), and we are grateful to the organisers, Dr Niccolò Mugnai (Leicester) and Dr Julia Nikolaus (Oxford), for asking EAMENA to be a part of the day and its subsequent publication. We would like to thank all the members of the EAMENA team for their work and contributions and we are grateful to all those who commented on drafts of this paper; any errors remain our own.
The World Imagery basemap for Figure 10 was created using ArcGIS® software by Esri. ArcGIS® and ArcMap™ are the intellectual property of Esri and are used herein under licence. Copyright © Esri. All rights reserved. For more information about Esri® software, please visit www.esri.com.



