



No CrossRef data available.
Article contents
- Abstract
- Economic Openness and Sustainability
- Measuring Weak Sustainability
- Statistical Methods and Data
- Results
- Conclusion
- Appendix 1. Definitions of Components of the Adjusted Net Savings (Genuine Savings)
- Appendix 2. Genuine savings rates, ecological footprints and their changes (mean period values)
- Appendix 3. Summary statistics and bivariate correlation matrix
- References
False Prophet, or Genuine Savior? Assessing the Effects of Economic Openness on Sustainable Development, 1980–99
Published online by Cambridge University Press: 09 August 2005
Article contents
- Abstract
- Economic Openness and Sustainability
- Measuring Weak Sustainability
- Statistical Methods and Data
- Results
- Conclusion
- Appendix 1. Definitions of Components of the Adjusted Net Savings (Genuine Savings)
- Appendix 2. Genuine savings rates, ecological footprints and their changes (mean period values)
- Appendix 3. Summary statistics and bivariate correlation matrix
- References
Abstract
While many herald globalization—the increasing interconnectedness of national economies—to be associated with rising standards of living across the globe, others fear its effects on sustainability. Antiglobalization forces and environmentalists view these developments as a threat to the welfare of future generations because of profligate and excessive current consumption. This study is the first to estimate the effects of dependence on trade, foreign direct investment (FDI), and an index of economic freedom on the World Bank's measure of sustainability (the genuine savings rate), which measures the rate at which investment in the total stock of manufactured, human, and natural capital exceeds its depreciation. Contrary to pessimists' fears, our indicators of economic openness show positive effects on sustainability, results that are robust to sample size, testing procedure, and several alternative specifications. The results support those who suggest that distorted economies tend to be both inefficient and damaging to future generations. If increasing trade, FDI, and economic freedom are hallmarks of globalization, then worries about its effects on future well-being are misplaced.Equal authorship. We are grateful to Erich Weede, Rick Auty, Simon Dietz, Paul Hensel, Jonathan Moses, Ragnar Torvik, Jostein Vik, Paivi Lujala, two reviewers, and the editor for comments and suggestions. The anonymous reviewers were extraordinarily constructive. Any remaining errors are entirely our fault. The data are available at 〈http://www.svt.ntnu.no/iss/Indra.de.Soysa/default.htm〉.
Information
- Type
- Research Article
- Information
- Copyright
- © 2005 The IO Foundation and Cambridge University Press
Although many view growing economic interdependence as good for global prosperity, others fear its effects on sustainability.1
See Mikesell 1992; Neumayer 2003; Pearce and Warford 1993; and World Commission on Environment and Development 1987.
This study will examine the effects of openness to trade and foreign direct investment (FDI) on an index of economic freedom on national genuine savings (GS) rates (adjusted net savings), a broad indicator of (weak) sustainability with wide coverage spanning a period of twenty years.4
See Atkinson and Hamilton 2003; Hamilton 2001; and World Bank 1997. The term “genuine savings” was coined by Kirk Hamilton and subsequently appears as “net adjusted savings” in the World Development Indicators.
Atkinson and Hamilton 2003, 1804.
Today, the World Bank and other organizations devoted to development distinguish between “good” and “bad” growth.8
The World Bank's GS rate is a result of this new thinking. Because the assumption of this approach is that substitutability between various forms of capital is high, this measure is admittedly one that captures “weak sustainability.”9 In contrast, strong sustainability is the view that all natural capital should be kept intact and that substitutability between forms of capital is not possible. Strong sustainability arguments in the globalization debate, however, are less prevalent given the preoccupation of both the right and left with the creation of jobs, economic growth, and concerns over relative economic well-being. In fact, strong environmentalism, largely prevalent in developed countries, views sustainable development to be a contradiction in terms. One popular measure of strong sustainability is the concept of ecological footprints (EF). This concept relates to the amount of environmental resources, defined as the available area of land (habitat), required for sustaining the current levels of consumption as well as for absorbing waste and pollution resulting from consumption.10 This concept gives little room for the substitution of environmental resources with manufactured capital, nor can it adequately account for trade as a substitute for scarcity. For example, Singaporeans have more (and better) water resources at their disposal than large resource wealthy states such as Nigeria, the Democratic Republic of Congo, or Angola because human and manufactured capital compensate for natural resource scarcity. In this article, we mainly focus on how increasing globalization determines a state's chances for achieving weak sustainability. We believe that any conception of sustainability must leave at least some room for substitutability (we do not think that universities should not be built if trees have to be destroyed). Also, weak sustainability is a necessary condition for achieving strong sustainability. In addition, we also briefly address the issue of strong sustainability.Estimating the effect of globalization and economic freedom on weak sustainability is not just an academic question. Policymakers at many levels seek to harmonize urgent societal requirements, such as growth of income, employment, and general well-being, while ensuring intra- and intergenerational equity. Many recognize that current economic accounting does not fully reflect the trade-offs among various forms of capital.11
For example, economic rents derived from resource extraction and tree cutting do not fully represent income, in that part of the rents represent depreciation of the natural capital stock. Similarly, economic development that comes at the expense of environmental harm may reduce future well-being. The green accounting program within economics seeks to value investment and depreciation of all forms of capital so that trade-offs among various forms of capital can be better accounted for. The maintenance of all forms of capital that are valuable for production and consumption is regarded as a desirable goal, a notion widely accepted by the pioneers in the profession who seek to measure sustainability so as to translate knowledge into policy.12 This article is organized as follows: first, we examine arguments about globalization and economic sustainability; next we examine the relevance of GS as an important empirical indicator measuring the concept of sustainability; then we present our results; and finally we conclude.Economic Openness and Sustainability
This study approaches the question of globalization and sustainability from a national perspective by measuring the degree to which states are exposed to, or are connected with, the global economic system. It is standard practice to measure globalization as “interconnectedness” through trade and FDI penetration.13
According to Mikesell, “[A] comprehensive treatise on sustainable development should integrate the macroeconomics of conventional development with the special concern of natural resource sustainability and environmental protection.”14Mikesell 1992, 141.
Supporters of globalization argue that greater interdependence between rich and poor states and the liberalization of markets from the clutches of profligate governments will enhance wealth, increase efficiency, and destroy the barriers against international environmental cooperation.15
Some scholars estimate the impact of globalization on government spending to assess whether governments “race to the bottom.” Much evidence seems to suggest that governments adapt to the increasing competition by compensating society with public goods, such as education. See Adserà and Boix 2002; Garrett 1998; and Rodrik 1996.
See Krueger 1998; Greenaway, Morgan, and Wright 1998; Frankel and Romer 1999; and Wacziarg and Welch 2003.
See Bhagwati 2004; and Frankel 2003.
See Borensztein, de Gregorio, and Lee 1998; Cooper 2001; de Mello 1999; de Soysa and Oneal 1999; and Klein, Aaron, and Hadjimichael 2001.
In addition to the income effect, trade and FDI allow the efficient allocation of resources across the world, where a country specializes in those activities it has an advantage in so that countries with an abundance of one resource can trade with those that are abundant in another, thereby achieving maximum output for a given input—in other words, movement toward sustainability because waste is minimized.21
Openness to trade is also associated with getting prices right and ending distortions, which enhances sustainability. Governments are likely to subsidize economic activity for political reasons, thereby increasing waste, a policy that is highly costly and becomes increasingly untenable the more exposed a country is to global markets.22See Birdsall and Wheeler 1993; and Yu 1994.
The German decision to make catalytic converters mandatory in new cars, for example, was largely because car manufacturers were already tooled to produce cars for the U.S. market, which had required catalytic converters almost a decade previously. This effect is called the trading-up of environmental standards. See Vogel 1995.
The Aral sea catastrophe makes one wonder whether any planner in the USSR asked whether the cotton was worth the sea. Possibly, fish and tourism, among other activities, might have been more economical, not to mention beneficial in other respects too, for the people of the area. Such examples of environmental waste are quite numerous across the globe. See Ascher 1999.
Finally, while both camps recognize that protecting the global commons requires real international cooperation, with some even calling for a World Environment Organization to rival the World Trade Organization, free traders view the interdependence among countries as a potent driver of environmental cooperation.27
Countries more open to trade are more likely to have signed and ratified important multilateral environmental agreements.28 In this light, states that trade more with each other potentially have common cause and incentive to cooperate, an age old precept articulated most thoroughly by such philosophers as Immanuel Kant, Montesquieu, and the Manchester school.29Critics counter these arguments by stating that globalization exploits poor countries and constrains the degree to which they are able to achieve sustainability. Some highly popularized, anecdotal and journalistic arguments suggest that globalization leads to “global pillage.”30
Antiglobalization activists successfully scuttled the Multilateral Agreement on Investment (MAI) on the basis that it would allow corporations to destroy the global commons. Giant corporations are accused of “stealing” the patrimony of the poor and the unborn for conspicuous consumption by the rich and globalization leads to cost-cutting, not efficient allocation of resources, and to downward pressure on environmental and social standards:31
The pursuit of high and rising consumption in the North and of development in the South have together led to the increasing exploitation of natural resources in unsustainable ways, often by TNC investment in resource-extractive industries in developing countries…. Policies focusing on liberalization, deregulation and export orientation respond to the logic of short-term profit maximization and international competition that intensifies the need for cost-cutting. The result is the rapacious exploitation and wasteful use of natural resources.32
Zammit 2003, 137.
Some critics of globalization also assert that increasing trade and specialization may work against efficiency viewed in terms of the dependent nature of most poor countries on the export of primary commodities. Increased trade may snare the poor countries in a “specialization trap” that locks them into servicing a world market growing ever more hungry for resources.33
Others have argued that political structures within countries favor capital at the expense of resource protection, which leads to the subsidization of foreign investors at the expense of sustainability.34 More generally, critics of globalization argue that trade agreements bind countries to standardized laws and regulations that will reduce the ability for governments and societies to make autonomous decisions by addressing local problems with local solutions. Moreover, critics argue that the systemic interdependence takes away agency from governments of less developed countries (LDCs). Greater integration of developing countries in market relations diminishes their capacity to act independently, because those countries become locked in dependent relations with the rich. Countries more dependent on trade and investment are expected not to be able to follow sustainable paths of development, because it would be against the interests of international capital.35Many pessimists argue that increasing income alone will not automatically take care of environmental problems, because the level of income of many poor countries is so low that increased consumption in rich areas will place too great a burden on an already overloaded planet, long before the poor get rich.36
See Daily and Ehrlich 1996; and Daly 1993.
The debate between defenders and critics of globalization mirrors older theoretical splits in the social sciences, which pitted dependency/world systems theorists against liberals and modernization theorists concerning the fundamental nature of whether or not closer contact between rich and poor results in exploitative outcomes such as poverty, the export of pollution, and environmental degradation.39
For a review of long-standing theoretical debates and empirical evidence in political science and sociology concerning the effects of MNCs on development, see de Soysa 2003.
For an excellent treatment of the differing perspectives, see Gilpin 2000.
We contend that the longer-term effects of market globalization and economic openness on sustainability can be judged by examining the effects of trade dependence, dependence on FDI, and the level of economic freedom on patterns of savings of physical, human, and natural capital over time.45
This study asks to what extent globalization promotes or hinders the achievement of weak sustainability. If globalization represents an extractive, exploitative, top-down project, as the critics claim, then its effect on the accumulation of physical, human, and natural capital stocks over time should provide some indication of the expected harm.Measuring Weak Sustainability
There are several operational definitions of sustainable development and methods for calculating measures and indexes of sustainability.46
This study's definition is close to the sprit of the original, which is “development that meets the needs of the present without compromising the ability of future generations to meet their own needs.”47 In other words, the steady depletion, or degradation of physical, natural, or human capital without offsetting gains may be deemed unsustainable. As some claim quite simply, savings of all forms of capital is the essence of sustainability.48Until quite recently, economists viewed the growth of gross domestic product (GDP) as a measure of development. GDP and the investment required for the growth of output were thought of as involving merely manufactured and, perhaps, human capital. The degradation of natural capital in the process of economic activity was unaccounted in GDP statistics. Green accounting processes began as an important corrective for making GDP reflect the degradation of the natural environment as a consequence of economic production. As a result, the World Bank embarked on estimating the “Wealth of Nations” to include manufactured, human, and natural capital of countries as a first step toward monitoring the progress of nations in terms of sustainability.49
The changes in the redefined estimates of wealth, therefore, indicate the sustainability/unsustainability of a development trajectory of any given country over time. Importantly, however, these data also show that the most important component of most nations' capital stocks is human capital (unfortunately, social capital is left out of the calculations because of the complex issues surrounding its measurability).Our calculations based on these data reveal that the poorest countries have much natural capital, but a relative lack of human capital.50
These data are constructed for about 100 countries for the year 1994 and represent the first disaggregated measure of the actual wealth of nations. The data are values for total natural capital composed of cropland, land, pasture, timber, nontimber assets, protected areas, and all subsoil resources (minerals). Human capital is computed as the value of labor based on education and health, and manufactured capital consists of man-made objects such as buildings, roads, ports etc. The construction of the data is explained in several studies (Hamilton and Clemens 1999; and Kunte et al. 1998) and on the World Bank's department of environment Web site: 〈http://lnweb18.worldbank.org/ESSD/envext.nsf/41ByDocName/Environment〉. Accessed 10 March 2005.
The poorest countries are the World Bank's 2002 list of “low income” countries and the richest are the “high income” category.
The importance of GS stems from its ability to indicate whether changes in the total capital stock are beneficial or detrimental to future well-being. As Dasgupta has written,
Genuine investment is the social worth of net changes in an economy's capital assets. It is a comprehensive notion, including as it does the social worth of net changes in manufactured and human capital, public knowledge, and natural capital. Thus, ensuring that social well-being is sustainable involves taking care that the economy's assets are managed well.52
Dasgupta 2001, 87.
The GS rate, or genuine investment rate as Dasgupta prefers to call it, is one effort to estimate the sustainability path of nations based on how “well” they manage their total capital stock. How “well” then is highly dependent on the environmental costs based on damage to atmosphere—by carbon dioxide (CO2)—and depreciation of the natural resource stock (forest, mineral, and energy stocks). While resource-wealthy countries, such as oil producers, would naturally have higher depletion, policies governing the decisions to spend on education and other investments in capital may more than offset the given depletion. Such countries, however, rarely make these forms of investment, which means that their future well-being is jeopardized by an unsustainable path of resource extraction.53
See Atkinson and Hamilton 2003; and Hamilton 2001.
While some argue about the exact method of calculating resource depletion and some problematic assumptions surrounding the concept and its measurement,54
this study accepts the adequacy of the World Bank's method for current purposes. Naturally, scholars can further test the conflicting theories against better data as they become available. The multidimensionality of the measure of sustainability that the GS rate presents, however, makes it an attractive choice for addressing the larger issue of how globalization may influence well-being of nations over time. An additional advantage of this measure of sustainability is that it is widely available in time-series format, is consistent with most orthodox views that see economic activity requiring trade-offs, and is a measure policymakers readily understand and would be able to respond to meaningfully.55The basic equation for calculating the GS rate is:

Note that investment in manufactured capital minus foreign borrowing plus net official transfers minus depreciation of manufactured capital is equal to net national savings. While the traditional national accounting treats government spending on education as consumption, the adjusted savings treats it as investment. This is regarded as a first approximation to the full value of human capital investment, which is difficult to measure precisely. Depreciation of natural capital covers nonrenewable resource extraction, such as fossil fuels and minerals, as well as forestry. Cost of atmospheric pollution is approximated by the damage caused by carbon dioxide emissions. Detailed definitions of each item are provided in Appendix 1. Investment in manufactured capital “anchors” the GS rate as it forms the starting point from which items are added and subtracted. Across countries, resource depletion and investment in human capital represent the major correction components to net national savings, with the cost of atmospheric pollution playing a smaller role. With a mean value of 2.88 percent of gross national income, resource depletion is not quite as important on average as educational expenditures at 3.94 percent. Still, it is important given that the mean value of net national savings is 8.87 percent. Also, its standard deviation is quite high (4.85), and for some resource-intensive countries, the resource depletion component can actually be almost as big as, or in many cases even bigger, than net national savings. Appendix 2 lists each country's GS rates and its change, both averaged over the entire period of study.
Statistical Methods and Data
This study employs a pooled, time-series, cross-section (TSCS) data set. The data are for roughly 135 countries, spanning twenty years.56
They are taken from World Bank 2002. The data for Angola and Sudan only are from World Bank 2003a because their values seem to be reported with errors in World Bank 2002.
We have largely relied on the World Bank's research program on savings across the world to pick several variables found to be associated with public and private savings rates. See Loayza et al. 1998; and Loayza, Schmidt-Hebbel, and Servén 2000. The basic model employs per capita income, its growth rate, and urbanization—variables that have data points for at least 135 countries. For robustness, we also test broad money supply (M2/GDP), and the age dependency ratio. Using these variables lowers the sample of countries considerably. The World Bank's research on savings can be accessed at 〈http://www.worldbank.org/research/projects/savings/savinwld.htm〉. Accessed 10 March 2005.
Note that some forms of government induced inefficiencies will be captured by our measure of economic freedom, albeit imperfectly.
Our measure of dependence on trade is total trade to GDP [(imports + exports)/GDP].59
All data are taken from World Bank 2002 unless noted otherwise.
The hypothesis of the supporters of globalization is that trade and investment openness lead to “good” economic, market-oriented policies. Often, such openness is used as an indirect proxy for such policies. In addition, we also want to test the impact of an admittedly subjective, but direct measure of good economic policies, namely the Fraser Institute's index of economic freedom.62
It is made up of approximately thirty-five components of objective indicators capturing the extent of economic freedom within countries. The index measures freedom of economic activity according to the following criteria in quintiles since 1980:63See 〈www.freetheworld.com〉 for details.
- Size of government based on spending and the level of state ownership of enterprises.
- Strength of legal system and sanctity of private property rights.
- Access to sound money.
- Freedom to exchange with foreigners.
- The extent of regulation of economic activity.
The missing years for this variable are interpolated. Because the score on economic freedom changes slowly between the five-year periods measured, the interpolated values should not be problematic. Strictly speaking, because economic freedom has government size as one of its components, to some extent it also suffers from the problem that its inclusion effectively constructs a partial identity between the left-hand side and right-hind side of the estimation (see above). Fortunately, it is only one out of many components, which should mitigate the problem.
Although openness to trade and FDI figure quite prominently in assessing economic freedom, they are but a small part of the overall measure. The bivariate correlations between economic freedom and trade and FDI, nonetheless, are r = 0.36 and r = 0.33, respectively. Clearly, the indicator of economic freedom captures aspects of open and market-oriented economic policies beyond what trade and FDI alone are able to capture. Using the economic freedom measure as an added factor in the globalization process has additional value in that much argumentation about globalization's effects on sustainability reflects fears about growing economic freedom at the expense of government's ability to regulate the market for the sake of intergenerational equity.
The baseline model controls for level of per capita income because richer countries have higher savings rates and supposedly exhibit better environmental standards on several dimensions.64
See Bhagwati 1999; Frankel 2003; Loayza, Schmidt-Hebbel, and Servén 2000; Ogaki, Ostry, and Reinhart 1995; and Shafik 1994.
Savings rates might be negatively affected if a country undergoes a financial currency crisis. To control for this possibility we include a dummy variable. This is set to 1 if, following Frankel and Rose, the local currency loses at least 25 percent of its value and the change in the exchange rate exceeds the previous year's change by at least 10 percent.67
The latter accounts for periods of high inflation. The change in the exchange rate is defined as the change in the natural logarithm of the nominal bilateral dollar exchange rate.The models include the degree to which countries are dependent on natural resource exports because resource depletion will be higher among these countries. As the early studies of the GS data indicate, energy-rich states in particular tend to have low GS given the high extraction levels of a single resource, coupled with lower than normal investment in human capital, dimensions of the familiar “resource curse” hypothesis highlighted in the literature.68
See Atkinson and Hamilton 2003; and Hamilton 2001.
See Auty 2001; Gylfason 2000; Ross 1999; and Sachs and Warner 2001.
These variables are obtained from World Bank 2002.
Democracy, it is often argued, is good for environmental protection because it empowers people and provides channels through which governments can be influenced by civil society.72
See Dryzek 1997; Frankel 2003; and Midlarsky 2000.
In addition, we include two further measures of governance as control variables. One is the political constraints (polcon) index developed by Henisz.77
He has designed his index as an indicator of the ability of political institutions to make credible commitments to an existing policy regime, which he argues is the most relevant political variable of interest to investors. Building on a simple spatial model of political interaction, the index makes use of the structure of government in a given country and the political views represented by the different levels of government (that is, the executive, the legislature). It measures the extent to which political actors are constrained in their choice of future policies by the existence of other political actors who will have to consent. Scores range from 0, which indicates that the executive has total political discretion and could change existing policy regimes at any point of time, to 1, which indicates that a change of existing policy regimes is totally infeasible. Of course, in practice agreement is always feasible, so the maximum score is less than 1. Not surprisingly, polcon is highly correlated with democracy. However, the results reported below hardly change if either of the two variables is dropped from the model to address potential problems with multicollinearity. The other governance measure captures the stability of the political system by counting the percent of veto players dropping out from government in any given year. This variable is taken from the World Bank's Database of Political Institutions.78Trade dependence, the savings rate, and environmental stress are affected by demographic factors.79
See Alesina and Spolaore 1997; and Millennium Ecosystem Assessment 2003. Neo-Malthusian views and antiglobalization views generally coincide on issues of sustainable development. There is lively debate in the literature between the neo-Malthusians and the cornucopians, or those who think substitution of natural resources with human ingenuity is possible. For the classic debate, see Myers and Simon 1994. Most texts on environmental security and economic sustainability sample this debate. See Conca and Dabelko 1998.
Finally, we enter control variables for experience with armed conflict, which presumably influences savings rates and the degree to which extractive activity, corruption, and accumulation of manufactured capital proceeds. We compute a count of peace years since 1946 employing the Uppsala-PRIO data on civil wars and using the BTSCS program in Stata.81
The civil war data (Gleditsch et al. 2002) can be downloaded from 〈www.prio.no〉 and the BTSCS program for generating the peace years and splines (Beck, Katz, and Tucker 1998) from 〈www.vanderbilt.edu/∼rtucker/programs/btscs/〉. Accessed 10 March 2005.
Appendix 3 provides summary statistics of the variables together with a bivariate correlation matrix. A few correlations are above 0.4. The urbanization rate and the agricultural share are the variables with the greatest number of high correlations. They were also identified as potential problem variables by variance inflation factor analysis. However, dropping these two variables or any of the other control variables with high correlations from the model hardly affects our results.
The analysis of time-series cross-sectional (TSCS) data generally poses several problems in the estimating process. TSCS data have complicated temporal and spatial structures that simple ordinary least squares (OLS) cannot adequately account for. TSCS models often allow for temporally and serially correlated errors as well as for heteroskedasticity. The well-known Parks method based on generalized least squares (GLS), which is close to the OLS method, is discredited for underestimating the true variability of the parameter estimates, which Beck and Katz report to be as high as 200 percent.82
They propose panel-corrected standard errors (PCSE) together with OLS as an alternative procedure. We follow this procedure, assuming an autoregressive error process of order one (AR1). Note that for this estimator, we replace the year-specific dummies with a linear time trend because the estimated variance-covariance matrix is not positive definite if year dummies are used.83Results are robust toward replacing the linear time trend with five-year period dummies.
Results
During the period of our study, countries below the median of trade openness have an average GS rate of 4.11 percent with a standard deviation (SD) of 8.56, compared to the average for countries above the median of 7.79 percent with a SD of 15.05. For our FDI measure, the respective figures are 6.09 (SD of 8.97) for countries below the median and 5.82 (SD of 15.04) for countries above the median. Countries below the median of the index of economic freedom have an average GS rate of 3.16 (SD of 9.89) compared to 11.19 (SD of 11.08) above the median. Figure 1 plots the period mean value of the logged trade share against the GS rate, distinguishing between the developed countries of the Organization for Economic Cooperation and Development (OECD), developing countries with below median natural resource intensity, and developing countries with above median natural resource intensity. Figures 2 and 3 do the same for the logged FDI stock to GDP and the measure of economic freedom, respectively.

Period mean values of logged trade openness (horizontal) and genuine savings rates (vertical axis)

Period mean values of logged FDI stock (horizontal) and genuine savings rates (vertical axis)

Period mean values of economic freedom (horizontal) and genuine savings rates (vertical axis)
The much larger SDs of the more trade and FDI open countries suggest significant differences among this group of countries, which is likely to be rooted in variation in other explanatory variables and stresses the importance of controlling for these differences in our estimations. Indeed, of the ten countries with the lowest GS rate over the period (Azerbaijan, Democratic Republic of Congo, Kazakhstan, Liberia, Libya, Nigeria, Oman, Saudi Arabia, Yemen, Zambia), eight countries have trade openness and all countries have FDI openness above the median. While at the same time, of the ten countries with the highest GS rate (Belize, Botswana, Japan, Luxembourg, Malta, Namibia, Seychelles, Singapore, South Korea, Thailand), there are also nine and seven countries with trade and FDI openness, respectively, above the median. Clearly, one obvious characteristic of the countries with very low GS rates is that they are mostly natural resource–intensive economies (this can also be clearly discerned from Figures 1, 2, and 3). Our multivariate estimations reported below indeed show that resource intensity is an important determinant of GS. We also take this as further reason to test our hypothesis in a subsample of resource-intensive economies. A characteristic of the countries with high GS rates is that some of them clearly have high per capita incomes. This factor points toward the need to control for per capita income to ensure that our measures of trade and FDI openness (as well as economic freedom) do not spuriously pick up an effect that truly belongs to the level of economic development. It also prompts us to test our hypotheses in subsamples of developing and low-income countries.
Turning to our multivariate analysis, Table 1 presents the results of trade and FDI's effects on the GS rate using three estimation procedures, the random effects GLS, the GEE, and the PCSE methods. As seen there, in columns (1) and (2), both trade and FDI dependence are positively and statistically significantly associated with the GS rate using the random effects GLS method if entered separately into the estimations. The statistical significance of the trade variable is confirmed in column (4) when GEE is used, but the FDI variable becomes marginally insignificant in column (5).85
Note that the GEE estimator drops Lebanon from the regression as this country has only one observation in the time period, which is not enough to estimate the necessary correlation statistic for this estimator.
Random effects GLS, GEE, and PCSE regression estimates of trade and FDI dependence on genuine savings rate

When entered into the regressions separately, then, in comparison, trade openness is the substantively more important variable of the two. A one SD increase in trade openness raises the GS rate by up to 1.5 percentage points, compared to up to 0.86 percentage points for a one SD increase in the FDI measure. These values do not seem high, but keep in mind that the average GS rate across the period is only 6.95 percent. Also, the SDs are relatively small for our measures of economic openness as many countries are clustered around the mean value. If we look at the effect of moving from the least open to the most open regimes instead, then this raises the GS rates by up to 11.15 and 7.9 points in the case of trade and FDI openness, respectively. Another way to demonstrate the effect of economic openness is to look at predicted values from the estimations. Based on the columns (7) and (8), the average predicted GS rates for the countries with trade and FDI openness below the median are 5.10 and 5.61 percent, respectively, whereas the relevant values for countries with openness above the median are 8.19 and 7.43 percent, respectively. These predicted rates are close to the actual averages from the bivariate analysis reported above, which suggests that the observed differences between relatively closed and relatively open economies uphold after controlling for several important determinants of GS.
Notice that all the three methods used for the analysis of the data produce somewhat similar results with our control variables. Per capita income is strongly positively associated with GS across the testing procedures. However, the effect is nonlinear suggesting that per capita income raises GS with diminishing returns. The economic growth rate is not statistically significant. Given that higher income levels are good for GS, growth's long-term, accumulated effect should be positive, however. A higher percentage of an economy devoted to agriculture is negative for accumulating GS in columns (7) and (8). This result provides some limited support to those who argue that the modernization of economies promotes sustainability. Events of currency crises do not lower the GS rate. Dependence on oil extraction has a strong negative effect on the GS rate as others have also reported.86
This result is statistically highly significant and substantively very large. Being an oil export-dependent country lowers the GS rate by an average of roughly 20 percentage points.Democracy's effect on GS is positive and statistically significant only in the last two columns when the PCSE method is used. Our results suggest that democracy's actual performance does not necessarily match the degree of emphasis on this variable in the academic and popular discussions on sustainability. However, its positive effect, even if only statistically significant in PCSE estimation, is encouraging and warrants closer analysis. Moreover, given our crude dichotomization of the Polity measure, future research should focus on disaggregating types of democracies, as differing democratic institutions produce varying policy outcomes.87
See de Soysa 2003; Lijphart 1994; and Powell 2000.
More densely populated societies are associated with higher GS rates, contrary to the pervasive neo-Malthusian discussions on sustainable development. In other words, population pressure within a territorial unit does not inhibit GS, but it promotes it, net of the other control variables in the model, such as income. Population size, on the other hand, is negative, but the results are far from statistical significance. Higher percentages of urban population, net of the influence of the other control variables, seem to be detrimental to the GS rate.
Civil war experience lowers the GS rate, but a longer period of peace exerts a positive and statistically significant effect only in columns (7) to (9). These results are net of income. Given war's detrimental effects on income, the overall effect on gains to GS from peace is bigger still. This interesting subject too warrants further reflection and more analysis given the recent theoretical arguments about natural resource dependence and civil war.88
Are our results generated by the presence of developed countries in the sample? To provide a fair test of the effect of globalization on sustainability, we need to check whether our results uphold for the countries critics of globalization are most concerned about. In Table 2 we repeat estimations for subsamples of countries. To save space, we concentrate on results from PCSE estimations. In columns (1) and (2), we restrict the sample to developing countries, dropping Japan, Australia, New Zealand, and Northern American and Western European countries. In columns (3) and (4), we further restrict the sample to countries classified as falling into the low-income category by the World Bank. In columns (5) and (6), we check whether results uphold for those developing countries, which trade more than proportionally with Organization for Economic Cooperation and Development (OECD) countries by restricting the sample to countries whose trade with OECD countries divided by GDP is above the median value. Next, we explore whether trade openness and FDI raise GS also in developing countries that are particularly reliant on natural resource extraction. For this purpose, in columns (6) and (7), we restrict the sample to countries whose rents from natural resource extraction relative to their gross national income (GNI) is in the upper three quartiles. Last, columns (8) and (9) further restrict the sample to developing countries with resource rents to GNI above the median. The most interesting feature in these estimations is that despite variances in sample size, FDI remains positive and significant in all estimations as does trade, which is only insignificant in column (9). Globalization remains a promoter of sustainability even in groups of countries thought to be the most vulnerable, perhaps with the exception of countries heavily dependent on natural resource extraction.89
The domestic political economy of education spending within resource-wealthy countries possibly influences this result; see Gylfason 2000.
Effects of trade and FDI dependence on genuine savings rate in sub-samples of countries (PCSE estimates)

We have shown already that natural resource intensity has a substantively important impact on the GS rate. So far we have used a rather crude measure of resource intensity, which had the advantage, however, of being available for a maximum number of countries. In Table 3 the dichotomous measure of oil export dependence is substituted by two continuous measures of fuel exports and metals and ores exports as a percentage of merchandise exports. The substitution results in the loss of ten countries from the sample, but the new resource export measures are more comprehensive, containing more information than the simple dummy variable. Although the fuel export dependence variables are correlated at r = 0.80 with each other, the fuel measures are only weakly correlated with exports of metals and ores. As seen in columns (1) and (2), the effects of trade and FDI on the GS rate remain positive and statistically highly significant. The results of the natural resource variables are both consistent with the findings of others, and the control variables remain nearly the same except that now, the results on democracy are statistically far from significant. Contrarily, the effect of accumulated years of peace is now consistently statistically significant with the expected positive sign.
Effects of trade and FDI dependence on genuine savings rate controlling for fuel exports and metals and ores exports (PCSE estimates)

In Table 4 we report the results of running the models with the measure of economic freedom. We first include only economic freedom, then add trade and FDI openness in separate estimations, finishing with a model that includes all three variables; economic freedom is positively associated with the GS rate throughout. A one SD increase in the index of economic freedom increases the GS rate by up to 3.25 percentage points, a move from the minimum observed value to the maximum by up to 20.8 points. The predicted average GS rate for the countries below the median of the index of economic freedom is 2.83 percent, whereas it is 11.74 percent for the ones above. Results for the rest of the control variables are rather similar to those reported in Table 2, despite the fact that the number of countries decreases by twenty-six. This suggests again that the results are quite robust to differences in sample size. Trade openness is positive and significant, whereas FDI openness is positive, but insignificant, whether added in isolation or in combination with economic freedom. Restricting the sample to be the same, but including just FDI openness, leads to a positive and highly significant coefficient of this variable in column (5). This suggests that the insignificance of the FDI measure is not because of the reduction in sample size. Instead, as before, the positive effect of FDI openness is masked by the inclusion of other aspects of economic openness with which the FDI variable is correlated.
Effects of economic freedom on genuine savings rate (PCSE estimates)

Are our results driven by country-specific fixed effects such as cultural differences, which we have not explicitly controlled for so far? Table 5 reports results from a fixed-effects GLS estimator with an assumed AR1 error process. The results on trade, FDI, and economic freedom are not affected. Note that in these fixed-effects estimations we found no evidence for a nonlinear effect of income on the GS rate, which is why only the linear income term is entered into the regressions. The reason why some of the control variables cease to be statistically significant in these estimations is because they vary little over time (for example, population density and the urbanization rate) and are thus estimated inefficiently by the fixed-effects estimator, which draws on the over-time data variation in each country only.
Fixed effects estimation of genuine savings rate

As we mentioned, economic openness is often used as a proxy for “good” economic policies. In order to further check whether it was the degree of corruption rather than trade, FDI, or economic freedom that mattered, we tested the models using International Country Risk Guide (ICRG) data on “corruption,” which is another widely accepted measure of good governance.90
See Ades and Di Tella 1999; Kaufmann, Kraay, and Zoido-Lobaton 1999; and Treisman 2000. The ICRG data on corruption gauge the degree to which the rule of law prevails. We average the quarterly scores for each year between 1984 and 1999. The data are available for 110 countries in our sample and was obtained from the Political Risk Services (PRS) group, which supplies the data commercially for a fee. See 〈www.prs.com〉.
In summary, the results taken together seem remarkably robust to sample size, specification, and testing procedure. The globalization variables remained unchanged despite several alternative specifications. If the spread of globalization and economic liberalism increase interconnectivity among states, then these trends increase the chances that states would be less profligate. Our results taken together support those who argue that globalization potentially improves conditions for sustainability. If increasing globalization is good for current economic development, our analyses do not suggest that it is to the detriment of future generations. What seems to be harmful for sustainability is autarchy.
So far we have addressed a form of sustainability, which presumes a high degree of substitutability among various forms of capital in the spirit of weak sustainability. The concept of EF is a measure in the spirit of strong sustainability, which rejects substitutability. The objective of EF is to translate all the ecological impact of human economic activity into the “area required to produce the resources consumed and to assimilate the wastes generated … under the predominant management and production practices in any given year.”91
Wackernagel et al. 2002, 9266.
There are many problems with using EF as a measure of ecological sustainability and with estimating how it is affected by globalization. Conceptually, one can argue that EF adds up “apples and oranges” in adding such diverse items as actual land use for agricultural products and purely hypothetical land use for the absorption of carbon dioxide emissions. The energy component is also the most controversial part of EF. It is calculated as the forest land area required to hypothetically sequester enough carbon from the atmosphere to avoid any increase in the atmospheric concentration of carbon from fossil fuel use. There are many more possibilities to sequester carbon from the atmosphere or to prevent carbon emissions than land-intensive forestry, however. Fossil fuel could be replaced with renewable energy, particularly wind and solar energy.92
The Danish Environmental Assessment Institute has calculated that the energy footprint becomes negligible with little impact on the overall EF if, hypothetically, 50 percent of world energy demand were satisfied with renewable energy, which the institute claims to be technically possible, and for the remaining energy demand, low carbon fuels such as natural gas are used.93 From the practical side, a major drawback of the variable is that EF have only been calculated for a global sample for three years, namely 1996, 1999, and 2000.94These problems notwithstanding, Table 6 reports results for EF as the dependent variable (Appendix 2 lists each country's ecological footprint and its change, both averaged over the entire period of study). We use the GLS estimator with random effects as the PCSE estimator is not the most suitable for short time periods. The stability of the political system variable from the World Bank database was not lagged in these estimations, which would not have allowed us to use the EF value for the year 2000. Neither trade, FDI, nor economic freedom are statistically significant. This remains true also in case the dependent variable is interpolated to gain more observations (not shown). Apart from income, population size, and population density, no other variables are significant. Indeed, a model with only per capita income and its squared term explains 80 percent of the variation in the data! This leaves little explanatory power for any of the other variables. Higher per capita income first lowers the EF at low levels of income up to an estimated threshold of around $1,000, after which higher income is associated with higher EF. It is apparent that the way the EF is constructed, high-income countries have high EF and poor countries have low EF, and there is little else that matters. Any policy recommendation from such a result would inescapably mean “increase poverty,” an untenable position no matter which part of this divided planet one lives in. Interestingly, we find no support for neo-Malthusian population concerns because countries with bigger populations and higher population density have lower rather than higher ecological footprints.
Estimation with ecological footprints as dependent variable (random effects GLS)

Conclusion
As one eminent scholar has put it, “reason and analysis require that we abandon the conviction that globalization lacks a human face, an assertion that is tantamount to a false alarm, and embrace the view that it has one.”95
Bhagwati 2004, 265 (italics in original).
Trade, FDI dependence, and economic freedom increase GS. This runs counter to what some dependency and world system theorists have argued in terms of a capitalist world system damaging the well-being of future generations. This study finds no such effect of globalization. Countries that are more closely integrated into world markets and that allow a greater degree of economic freedom protect their future well-being better than isolated countries that tightly restrict the freedom of economic activity. Allegations that globalization induces countries to maximize short-term benefits at the expense of mortgaging the future are therefore without foundation.
A few country cases illustrate our main results. Comparing the world situation in the first half of the 1980s to that of the second half of the 1990s, many countries opened their economies and increased their GS rate substantially. For example, Chile and Ghana increased their share of trade to GDP by 14 and 64 percentage points, their FDI stock relative to GDP by 30 and 8 percentage points, and their Index of Economic Freedom by 2.4 and 2.8 points, respectively, while at the same time increasing their GS rate by 22 and 9 percentage points, respectively. Of course, not all countries opened up trade and FDI and allowed more economic freedom all at the same rate. China is a good example. It increased its trade share by 25 percentage points and its FDI stock relative to GDP by 21 percentage points, but its increase in economic freedom of merely 0.8 points is less impressive. In the same time span, the country managed to increase its GS rate by 24 percentage points. Inevitably, there are also some failures, representing exceptions to the general trend. For example, Nicaragua and the Democratic Republic of Congo were much more open in the late 1990s than in the early 1980s. They increased their trade share by 55 and 20 percentage points, their FDI share by 26 and 4 percentage points, and their index of economic freedom by 2 and 0.6 points, respectively. Yet, their GS rate dropped by 5 and 7 percentage points, respectively. In future research, we would like to explore the reasons why some liberalizing countries fail to achieve increases in GS.
Admittedly, our results only hold for weak sustainability. However, such sustainability is a prerequisite for achieving stronger forms of sustainability. Also, while we have not been able to demonstrate a positive effect of globalization on strong sustainability, of which ecological footprints represent a crude and contested measure, we have also not found any negative effect. Clearly more research needs to be done on the determinants of the GS rate beyond globalization concerns, so that econometric models might be refined over time. When stronger findings from other variables can be incorporated, we will be able to test further the potential spuriousness of the association between trade, FDI, economic freedom, and sustainability reported here.
This caveat notwithstanding, our results taken together suggest that economic globalization leads to better management of the wealth of nations, a good prospect for the present generation and for those to whom we bequeath the planet. On the other hand, resource-wealthy countries seem to waste resources, given that they fail to translate extraction of nature's wealth into sustainability via adequate investment in manufactured and human capital, presumably because of the well-documented feature of both economic and political “Dutch disease” that often result in distorted markets, corruption, mal-governance, and social breakdown.
Many developing countries have embarked on a policy reform toward economic openness in the last two decades or so.96
Whether this change is prompted by the spectacular failure of inward-looking and import-substituting economic policies from previous decades97 is a consequence of the process of democratization98 or has other reasons altogether need not concern us here. What is important is that, built on our estimations, the gradual adoption of open economic policies even in resource-wealthy regions, such as Africa, is good news for weak sustainability.Appendix 1. Definitions of Components of the Adjusted Net Savings (Genuine Savings)
- Gross national savings are equal to gross domestic investment minus net foreign borrowing plus net official transfers.
- Net national savings are equal to gross national savings less the value of consumption of manufactured capital.
- Adjusted net savings, or genuine savings, are equal to net national savings plus current education expenditures and minus energy depletion, mineral depletion, net forest depletion, and carbon dioxide damage.
- Carbon dioxide damage is estimated as $20 per ton of carbon (the unit damage in 1995 U.S. dollars) times the number of tons of carbon emitted.
- Current education expenditure refers to the current operating expenditures in education, including wages and salaries and excluding capital investments in buildings and equipment.
- Energy depletion is equal to the product of unit resource rents and the physical quantities of energy extracted. It covers crude oil, natural gas, and coal.
- Mineral depletion is equal to the product of unit resource rents and the physical quantities of minerals extracted. It refers to bauxite, copper, iron, lead, nickel, phosphate, tin, zinc, gold, and silver.
- Net forest depletion is calculated as the product of unit resource rents and the excess of roundwood harvest over natural growth.
Appendix 2. Genuine savings rates, ecological footprints and their changes (mean period values)


Appendix 3. Summary statistics and bivariate correlation matrix

References
REFERENCES
Ades, Alberto, and
Rafael Di Tella.
1999.
Rents, Competition, and Corruption.
American Economic Review
89 (4):982–93.Google Scholar
Adserà, Alícia, and
Carles Boix.
2002.
Trade, Democracy, and the Size of the Public Sector: The Political
Underpinnings of Openness.
International Organization
56 (2):229–62.Google Scholar
Alesina, Alberto, and
Enrico Spolaore.
1997.
On the Number and Size of Nations.
Quarterly Journal of Economics
112 (4):1027–56.Google Scholar
Amin, Samir.
1990.
Maldevelopment: Anatomy of a Global Failure.
London:
Zed Books.
Ascher, William.
1999.
Why Governments Waste Natural Resources: Policy Failures in
Developing Countries.
Baltimore, Md.:
Johns Hopkins University Press.
Atkinson, Giles, and
Kirk Hamilton.
2003.
Savings, Growth and the Resource Curse Hypothesis.
World Development
31 (11):1793–807.Google Scholar
Atkinson, Giles,
Richard Dubourg,
Kirk Hamilton,
Mohan Munesinghe,
David Pearce, and
Carlos Young.
1997.
Measuring Sustainable Development: Macroeconomics and the
Environment.
Cheltenham, England:
Edward Elgar.
Auty, Richard M., ed.
2001.
Resource Abundance and Economic Development, UNU/WIDER Studies
in Development Economics.
Oxford:
Oxford University Press.
Beck, Nathaniel, and
Jonathan N. Katz.
1995.
What to Do (and Not to Do) with Time-Series Cross-Section
Data.
American Political Science Review
89 (3):634–47.Google Scholar
Beck, Nathaniel,
Jonathan N. Katz, and
Richard Tucker.
1998.
Taking Time Seriously: Time-Series-Cross-Section Analysis with a
Binary Dependent Variable.
American Journal of Political Science
42 (4):1260–88.Google Scholar
Bhagwati, Jagdish.
1999.
Economic Freedom: Prosperity and Social Progress.
Paper presented at the Conference on Economic Freedom and
Development, June, Tokyo.
Bhagwati, Jagdish.
2004.
In Defense of Globalization.
New York:
Oxford University Press.
Birdsall, Nancy, and
Robert Z. Lawrence.
1999.
Deep Integration and Trade Agreements: Good for Developing
Countries? In
Global Public Goods: International Cooperation in the 21st
Century, edited by
Inge Kaul,
Isabelle Grunberg, and
Marc Stern,
128–51.
Oxford:
Oxford University Press.
Birdsall, Nancy, and
David Wheeler.
1993.
Trade Policy and Industrial Pollution in Latin America: Where Are
the Pollution Havens?
Journal of Environment and Development
2 (1):137–49.Google Scholar
Borensztein, Eduardo,
José de Gregorio, and
Jhong-Wha Lee.
1998.
How Does Foreign Investment Affect Economic Growth?
Journal of International Economics
45 (1):115–35.Google Scholar
Bornschier, Volker, and
Christopher Chase-Dunn.
1985.
Transnational Corporations and Underdevelopment.
New York:
Praeger.
Brack, Duncan.
1995.
Balancing Trade and the Environment.
International Affairs
71 (3):497–514.Google Scholar
Brecher, Jeremy, and
Tim Costello.
1994.
Global Village or Global Pillage: Economic Reconstruction from the
Bottom Up.
Boston:
South End Press.
Cardoso, Fernando H., and
Enzo Faletto.
1979.
Dependency and Development in Latin America.
Berkeley:
University of California Press.
Collier, Paul,
Lani Elliot,
Håvard Hegre,
Anke Hoeffler,
Marta Reynal-Querol, and
Nicholas Sambanis.
2003.
Breaking the Conflict Trap: Civil War and Development Policy.
Oxford:
Oxford University Press, for World Bank.
Conca, Ken, and
Geoffrey D. Dabelko, eds.
1998.
Green Planet Blues: Environmental Politics from Stockholm to Kyoto.
2d ed.
Boulder, Colo.:
Westview Press.
Cooper, Richard N.
2001.
Growth and Inequality: The Role of Foreign Trade and
Investment.
Working paper,
Harvard University,
Cambridge, Mass.
Copeland, Brian R., and
M. Scott Taylor.
2003.
Trade, Growth and the Environment.
Working Paper No. 9823.
Cambridge, Mass.:
National Bureau of Economic Research.
Costanza, Robert, and
Sven Erik Jørgensen.
2002.
Understanding and Solving Environmental Problems in the 21st
Century: Towards a New, Integrated Hard Problem Science.
Amsterdam:
Elsevier.
Coxhead, Ian, and
Sisira Jayasuriya.
2003.
The Open Economy and the Environment: Development, Trade and
Resources in Asia.
Cheltenham, England:
Edward Elgar.
Daily, Gretchen C., and
Paul R. Ehrlich.
1996.
Socioeconomic Equity, Sustainability, and Earth's Carrying
Capacity.
Ecological Applications
6 (4):991–1001.Google Scholar
Dasgupta, Partha.
2001.
Human Well-Being and the Natural Environment.
Oxford:
Oxford University Press.
De Mello, Luiz R., Jr.
1999.
Foreign Direct Investment-Led Growth: Evidence From Time Series and
Panel Data.
Oxford Economic Papers
51 (1):133–51.Google Scholar
De Soysa, Indra.
2003.
Foreign Direct Investment, Democracy, and Development: Assessing
Contours, Correlates and Concomitants of Globalization.
London:
Routledge.
De Soysa, Indra, and
John R. Oneal.
1999.
Boon or Bane? Reassessing the Productivity of Foreign Direct
Investment.
American Sociological Review
64 (5):766–82.Google Scholar
Dryzek, John S.
1997.
The Politics of the Earth: Environmental Discourses: The Politics of
the Earth.
Oxford:
Oxford University Press.
Easterly, William, and
Mirvat Sewadeh.
2001.
Global Development Network Growth Database.
Washington, D.C.:
World Bank.
Available at
http://www.worldbank.org/research/growth/GDNdata.htm.
Accessed 10 March 2005.
Fearon, James D., and
David D. Laitin.
2003.
Ethnicity, Insurgency, and Civil War.
American Political Science Review
97 (1):75–90.Google Scholar
Fernando, Jude L.
2003.
The Power of Unsustainable Development: What Is to Be Done?
Annals of American Academy of Political and Social Science
590 (1):6–34.Google Scholar
Frankel, Jeffrey A.
2003.
The Environment and Globalization.
Working Paper 10090.
Cambridge, Mass.:
National Bureau of Economic Research.
Frankel, Jeffrey A., and
David Romer.
1999.
Does Trade Cause Growth?
American Economic Review
89 (3):379–99.Google Scholar
Frankel, Jeffrey A., and
Andrew K. Rose.
1996.
Currency Crashes in Emerging Markets: An Empirical Treatment.
Journal of International Economics
41 (3):351–66.Google Scholar
Galtung, Johan.
1971.
A Structural Theory of Imperialism.
Journal of Peace Research
8 (2):81–117.Google Scholar
Garrett, Geoffrey.
1998.
Global Markets and National Politics: Collision Course or Virtuous
Circle?
International Organization
52 (4):787–824.Google Scholar
Gilpin, Robert.
2000.
The Challenge of Global Capitalism: The World Economy in the 21st
Century.
Princeton, N.J.:
Princeton University Press.
Gleditsch, Nils Petter,
Peter Wallensteen,
Mikael Eriksson,
Margareta Sollenberg, and
Havard Strand.
2002.
Armed Conflict 1946–2001: A New Dataset.
Journal of Peace Research
39 (5):615–37.Google Scholar
Goodwin, Neva R.
2003.
Five Kinds of Capital: Useful Concepts for Sustainable
Development. Working Paper 03–07.
Medford, Mass.:
Global Development and Environment Institute, Tufts
University.
Graham, Edward M.
2000.
Fighting the Wrong Enemy: Antiglobal Activists and Multinational
Enterprises.
Washington, D.C.:
Institute for International Economics.
Greenaway, David,
Wyn Morgan, and
Peter Wright.
1998.
Trade Reform, Adjustment and Growth: What Does the Evidence Tell
Us?
Economic Journal
108 (450):1547–61.Google Scholar
Grimes, Peter, and
Jeffrey Kentor.
2003.
Exporting the Greenhouse: Foreign Capital Penetration and CO2
Emissions 1980–1996.
Journal of World-Systems Research
IX (2):261–75.Google Scholar
Grossman, Gene M., and
Alan B. Krueger.
1995.
Economic Growth and the Environment.
Quarterly Journal of Economics
110 (2):353–77.Google Scholar
Gwartney, James, and
Robert Lawson.
2003.
Economic Freedom in the World 2003: The Annual Report.
Vancouver, Canada:
Fraser Institute.
Gylfason, Thorvaldur.
2000.
Natural Resources, Education, and Economic Development.
Working Paper.
London:
Center for Economic Policy Research.
Haas, Peter,
Robert Keohane, and
Marc Levy, eds.
1993.
Institutions for the Earth: Sources of Effective International
Environmental Protection.
Cambridge, Mass.:
MIT Press.
Hamilton, Kirk.
2001.
The Sustainability of Extractive Economies. In
Resource Abundance and Economic Development, edited by
R. M. Auty.
Oxford:
Oxford University Press.
Hamilton, Kirk, and
Michael Clemens.
1999.
Genuine Savings Rates in Developing Countries.
World Bank Economic Review
13 (2):333–56.Google Scholar
Hardt, Michael, and
Antonio Negri.
2000.
Empire.
Cambridge, Mass.:
Harvard University Press.
Henisz, W. J.
2000.
The Institutional Environment for Economic Growth.
Economics and Politics
12 (1):1–31.Google Scholar
Hoogvelt, Ankie.
2001.
Globalization and the Postcolonial World: The New Political Economy
of Development.
Basingstoke, England:
Palgrave.
Jaggers, Keith, and
Ted R. Gurr.
1995.
Tracking Democracy's Third Wave with the Polity III
Data.
Journal of Peace Research
32 (4):469–82.Google Scholar
Jørgensen, Andreas,
Dorte Vigsøe,
Anders Kirstoftersen, and
Olivier Rubin.
2002.
Assessing the Ecological Footprint: A Look at the WWF's Living
Planet Report 2002.
Copenhagen:
Institut for Miljøvurdering (Environmental Assessment
Institute).
Kaufmann, Daniel,
Aart Kraay, and
Pablo Zoido-Lobaton.
1999.
Governance Matters.
Washington, D.C.:
World Bank.
Klein, Michael,
Carl Aaron, and
Bita Hadjimichael.
2001.
Foreign Direct Investment and Poverty Reduction.
Washington, D.C.:
World Bank.
Korten, David C.
2001.
When Corporations Rule the World.
Bloomfield, Conn.:
Kumarian.
Krueger, Anne O.
1998.
Why Trade Liberalisation Is Good for Growth.
Economic Journal
108 (450):1513–22.Google Scholar
Kunte, Arundhati,
Kirk Hamilton,
John Dixon, and
Michael Clemens.
1998.
Estimating National Wealth: Methodology and Results.
Environment Department Working Paper 57.
Washington, D.C.:
World Bank.
Lijphart, Arend.
1994.
Democracies: Forms, Performance, and Constitutional
Engineering.
European Journal of Political Research
25 (1):1–17.Google Scholar
Loayza, Norman,
Klaus Schmidt-Hebbel, and
Luis Servén.
2000.
What Drives Private Saving Across the World?
Review of Economics and Statistics
82 (2):165–81.Google Scholar
Loayza, Norman,
Humberto López,
Luis Servén, and
Klaus Schmidt-Hebbel.
1998.
Saving in the World: The Stylized Facts.
Working Paper.
Washington, D.C.:
World Bank.
López, Ramón.
2003.
The Policy Roots of Socioeconomic Stagnation and Environmental
Implosion: Latin America, 1950–2000.
World Development
31 (2):259–80.Google Scholar
Mabey, Nick, and
Richard McNally.
1998.
Foreign Direct Investment and the Environment: From Pollution Havens
to Sustainable Development.
Godalming, England:
World Wildlife Fund.
MacNeill, Jim,
Pieter Winsemius, and
Taizo Yakushiji.
1991.
Beyond Interdependence: The Meshing of the World's Economy and
the Earth's Ecology.
Oxford:
Oxford University Press.
Martin, Hans-Peter, and
Harald Schumann.
1997.
The Global Trap: Globalization and the Assault on Prosperity and
Democracy.
London:
Zed Books.
Meadows, Donella H.,
Dennis L. Meadows, and
Jorgen Randers.
1993.
Beyond the Limits: Confronting Global Collapse, Envisioning a
Sustainable Future.
White River Jct., Vt.:
Chelsea Green.
Midlarsky, Manus I.
2000.
Democracy and the Environment. In
Environmental Conflict: An Anthology, edited by
Paul F. Diehl and
Nils Petter Gleditsch,
155–78.
Boulder, Colo.:
Westview Press.
Mikesell, Raymond F.
1992.
Economic Development and the Environment: A Comparison of
Sustainable Development with Conventional Development Economics.
London:
Mansell.
Millennium Ecosystem Assessment (MEA).
2003.
Ecosystems and Human Well-Being: A Framework for Assessment.
Washington, D.C.:
Island Press.
Milner, Helen.
1999.
The Political Economy of International Trade.
Annual Review of Political Science
2 (1):91–114.Google Scholar
Milner, Helen, and
Keiko Kubota.
2005.
Why the Move to Free Trade? Democracy and Trade Policy in the
Developing Countries.
International Organization
59 (1):36–56.Google Scholar
Myers, Norman, and
Julian L. Simon.
1994.
Scarcity or Abundance? A Debate on the Environment.
London:
Norton.
Neumayer, Eric.
2000.
Resource Accounting in Measures of Unsustainability: Challenging the
World Bank's conclusions.
Environmental and Resource Economics
15 (3):257–78.Google Scholar
Neumayer, Eric.
2002a.
Does Trade Openness Promote Multilateral Environmental
Cooperation?
World Economy
25 (6):815–32.Google Scholar
Neumayer, Eric.
2002b.
Do Democracies Exhibit Stronger International Environmental
Commitment?: A Cross-Country Analysis.
Journal of Peace Research
39 (2):139–64.Google Scholar
Neumayer, Eric.
2003.
Weak versus Strong Sustainability: Exploring the Limits of Two
Opposing Paradigms. 2d ed.
Cheltenham:
Edward Elgar.
Neumayer, Eric.
2004.
Indicators of Sustainability. In the
International Yearbook of environmental and Resource Economics
2004/2005, edited by
Tom Tietenberg and
Henk Folmer,
139–188.
Cheltenham, England:
Edward Elgar.
Nye, Joseph S., and
John D. Donahue, eds.
2000.
Governance in a Globalizing World.
Washington, D.C.:
Brookings Institution Press.
Ogaki, Masao,
Jonathan Ostry, and
Carmen Reinhart.
1995.
Saving Behaviour in Low- and Middle-Income Developing Countries: A
Comparison.
Working Paper 95/3.
Washington, D.C.:
International Monetary Fund.
Pearce, David, and
Giles Atkinson.
1993.
Capital Theory and the Measure of Sustainable Development: An
Indicator of “Weak” Sustainability.
Ecological Economics
8 (2):103–8.Google Scholar
Pearce, David, and
Jeremy Warford.
1993.
World Without End: Economics, Environment, and Sustainable
Development.
Oxford:
Oxford University Press.
Perkins, Richard, and
Eric Neumayer.
2004.
The International Diffusion of New Technologies: A Multi-Technology
Analysis of Latecomer Advantage and Global Economic Integration.
Working Paper.
London:
University of Plymouth and London School of Economics.
Powell, G. Bingham.
2000.
Elections as Instruments of Democracy: Majoritarian and Proportional
Visions.
New Haven, Conn.:
Yale University Press.
Roberts, Timmons J., and
Peter E. Grimes.
1997.
Carbon Intensity and Economic Development 1962–1991: A Brief
Exploration of the Environmental Kuznets Curve.
World Development
25 (2):191–98.Google Scholar
Rodrik, Dani.
1994.
The Rush to Free Trade in the Developing World: Why so Late? Why
Now? Will It Last?. In
Voting for Reform: Democracy, Political Liberalization, and Economic
Adjustment, edited by
Stephen Haggard,
61–88.
New York:
Oxford University Press.
Rodrik, Dani.
1996.
Why Do More Open Countries Have Bigger Governments?
Working Paper 5537.
Cambridge, Mass.:
National Bureau of Economic Research.
Røpke, Inge.
1994.
Trade, Development and Sustainability—A Critical Assessment of
the “Free Trade Dogma.”
Ecological Economics
9 (1):13–22.Google Scholar
Ross, Michael.
1999.
The Political Economy of the Resource Curse.
World Politics
51 (2):297–332.Google Scholar
Russett, Bruce, and
John Oneal.
2001.
Triangulating Peace: Democracy, Interdependence, and International
Organizations, The Norton Series in World Politics.
London:
Norton.
Sachs, Jeffrey D., and
Andrew Warner.
2001.
Natural Resources and Economic Development: The Curse of Natural
Resources.
European Economic Review
45:827–38.Google Scholar
Simmons, Beth A., and
Zachary Elkins.
2004.
The Globalization of Liberalization: Policy Diffusion in the
International Political Economy.
American Political Science Review
98 (1):171–89.Google Scholar
Shafik, Nemat.
1994.
Economic Development and Environmental Quality: An Econometric
Analysis.
Oxford Economic Papers
46 (5):757–73.Google Scholar
Thomas, Vinod,
Mansoor Dailami,
Ashok Dhareshwar,
Daniel Kaufmann,
Nalin Kishor,
Ramón López, and
Yan Wang.
2000.
The Quality of Growth.
New York:
Oxford University Press, for the World Bank.
Treisman, Daniel.
2000.
The Causes of Corruption: A Cross-National Study.
Journal of Public Economics
76 (3):399–457.Google Scholar
United Nations Conference on Trade and Development
(UNCTAD).
2003.
World Investment Directory.
Geneva:
United Nations.
Vogel, David.
1995.
Trading Up: Consumer and Environmental Regulation in the Global
Economy.
Cambridge, Mass.:
Harvard University Press.
Wackernagel, Mathis,
Larry Onisto,
Patricia Bello,
Cllejas Alejandro Linares,
Susana Ina López Falfán,
Jesus Méndez García,
Suaréz Isabel Ana Guerrero, and
Ma. Suaréz Guadelupe Guerrero.
1999.
National Natural Capital Accounting with the Ecological Footprint
Concept.
Ecological Economics
29 (3):375–90.Google Scholar
Wackernagel, Mathis,
Niels B. Schulz,
Diana Deumling,
Alejandro Callejas Linares,
Martin Jenkins,
Valerie Kapos,
Chad Monfreda,
Jonathan Loh,
Norman Myers,
Richard Norgaard, and
Jørgen Randers.
2002.
Tracking the Ecological Overshoot of the Human Economy.
Proceedings of the National Academy of Sciences
99 (14):9266–71.Google Scholar
Wacziarg, Romain, and
Karen Horn Welch.
2003.
Trade Liberalization and Growth: New Evidence.
Working Paper 10152.
Cambridge, Mass.:
National Bureau of Economic Research.
World Commission on Environment and Development
(WCED).
1987.
Our Common Future.
Oxford:
Oxford University Press.
World Bank.
1992.
World Development Report 1992: Development and the
Environment.
Washington, D.C.:
World Bank.
World Bank.
1997.
Expanding the Measure of Wealth: Indicators of Environmentally
Sustainable Development.
Washington, D.C.:
World Bank.
World Bank.
2002.
World Development Indicators CD-ROM 2002.
Washington, D.C.:
World Bank.
World Bank.
2003a.
Adjusted Net Savings Data.
Washington, D.C.:
World Bank.
http://lnweb18.worldbank.org/ESSD/envext.nsf/44ByDocName/GreenAccountingAdjustedNetSavings.
Accessed 10 March 2005.
World Bank.
2003b.
Database of Political Institutions.
Washington, D.C.:
World Bank.
World Wildlife Fund (WWF).
2002.
Living Planet Report.
Gland, Switzerland:
World Wide Fund for Nature.
World Wildlife Fund (WWF).
2004.
Living Planet Report.
Gland, Switzerland:
World Wide Fund for Nature.
York, Richard,
Eugene A. Rosa, and
Thomas Dietz.
2003.
Footprints on the Earth: The Environmental Consequences of
Modernity.
American Sociological Review
68 (2):279–300.Google Scholar
Yu, Douglas.
1994.
Free Trade Is Green, Protectionism Is Not.
Conservation Biology
8 (4):989–96.Google Scholar
Zammit, Ann.
2003.
Development at Risk: Rethinking UN-Business Partnerships.
Geneva:
United Nations Research Institute for Social Development
(UNRISD).
Zorn, Christopher.
2001.
Generalized Estimating Equation Models for Correlated Data: A Review
with Applications.
American Journal of Political Science
45 (2):470–90.Google Scholar
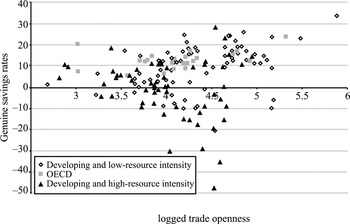
Period mean values of logged trade openness (horizontal) and genuine savings rates (vertical axis)
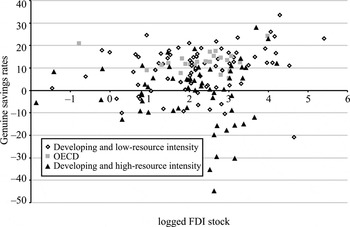
Period mean values of logged FDI stock (horizontal) and genuine savings rates (vertical axis)
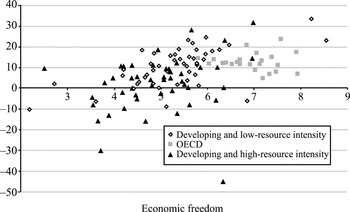
Period mean values of economic freedom (horizontal) and genuine savings rates (vertical axis)
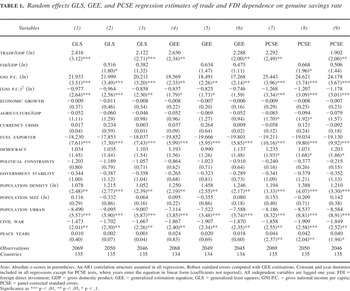
Random effects GLS, GEE, and PCSE regression estimates of trade and FDI dependence on genuine savings rate
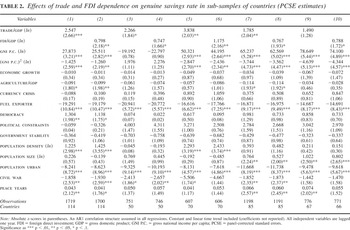
Effects of trade and FDI dependence on genuine savings rate in sub-samples of countries (PCSE estimates)
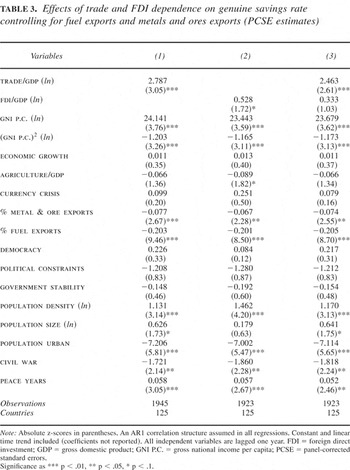
Effects of trade and FDI dependence on genuine savings rate controlling for fuel exports and metals and ores exports (PCSE estimates)
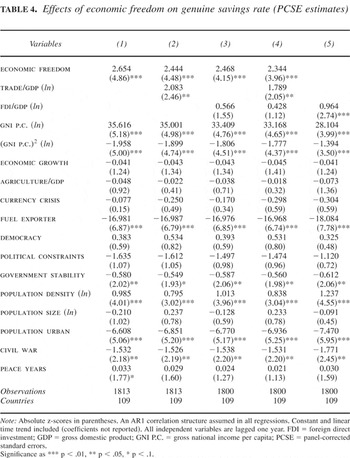
Effects of economic freedom on genuine savings rate (PCSE estimates)
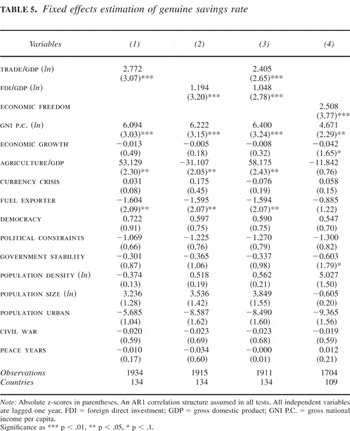
Fixed effects estimation of genuine savings rate
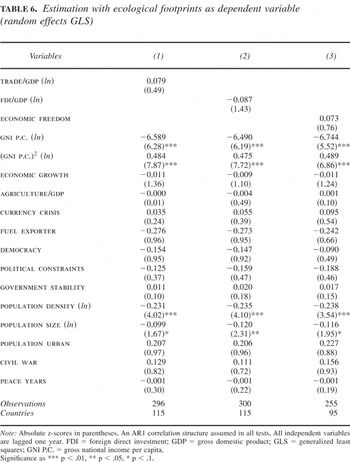
Estimation with ecological footprints as dependent variable (random effects GLS)
 You have
Access
- 34
- Cited by