A number of recent theoretical models are founded on the premise that the time spent in home production decreased dramatically over the first two-thirds of the twentieth century. For example, Jeremy Greenwood, Ananth Seshadri, and Mehmet Yorukoglu argue that the diffusion of appliances led to a fall in time spent in home production and allowed women to increase their labor force participation.Footnote 1 In another theory, Greenwood et al. argue that the diffusion of appliances lowered the cost of having children and thus led to the baby boom of the 1950s and 1960s.Footnote 2 Stefania Albanesi and Claudia Olivetti provide evidence that improvements in reproductive medicine and the invention of formula may have been key to the increase in female labor force participation.Footnote 3
There is no consensus, however, on trends in home production time during the twentieth century. some economists believe that there was a significant decline in time spent in household production during the first two-thirds of the twentieth century.Footnote 4 In contrast, other economists as well as sociologists argue that the amount of time spent in home production by housewives did not decrease for a large part of the twentieth century.Footnote 5 In fact, Joel Mokyr labels the absence of a decline in housework during the era of appliance diffusion the “Cowan Paradox.”Footnote 6 Ruth Schwartz Cowan argued that while technological innovations may have greatly reduced the drudgery of housework, they did not decrease the time devoted to it.Footnote 7 According to Cowan, “modern technology enabled the American housewife of 1950 to produce singlehandedly what her counterpart of 1850 needed a staff of three or four to produce: a middle-class standard of health and cleanliness for herself, her spouse, and her children.”Footnote 8
Mokyr argues further that standards of cleanliness and nutrition were increasing at the same time, so that the output of household production rose substantially.Footnote 9 According to the data shown in Greenwood et al., most of the diffusion of electricity, running water, and appliances occurred between 1900 and 1950.Footnote 10 According to Mokyr, it was during this time that knowledge diffusion convinced many housewives that maintaining a clean house and preparing nutritious meals could improve the health of their families.
There is no agreement on long-run trends in time spent in home production because of the dearth of comprehensive data. While there have been a number of time use studies in the United States over the course of the twentieth century, only the studies beginning in 1965 are based on nationally representative samples and are reasonably consistent across time. As a result, most of the theoretical work seeking stylized facts on long-run trends in home production has had to extrapolate trends from noncomparable and sometimes erroneous estimates of time spent in home production. Thus, theory is far ahead of measurement in this literature.
The goal of this article is to advance measurement to catch up with theory. I use a variety of data sources to construct new estimates of time spent in home production during the twentieth century. Following Margaret Reid, I define home production, or equivalently homemaking, as “those unpaid activities which are carried on, by and for the members, which activities might be replaced by market goods, or paid services, if circumstances such as income, market conditions, and personal inclinations permit the service being delegated to someone outside the household group.”Footnote 11 I build on Joann Vanek's work by using time-diary studies of thousands of housewives from the 1920s through the 1950s.Footnote 12 Extending an idea by W. Keith Bryant, I estimate regressions on grouped data from these early studies. However, I use richer data sources that allow me to adjust the estimates to make them representative in terms of age and number of children, the education level of the housewife, as well as to consider possible differences across races.Footnote 13 While Vanek and Bryant only compared housewives in the 1920s to the 1960s, I also estimate time spent by the other 80 percent of the population: employed women, men, children, and older individuals. Thus, my estimates offer a comprehensive picture of total trends in home production. My estimates for prime-age individuals from 1965 to 2005 are similar to those from John P. Robinson and Geoffrey Godbey and Mark Aguiar and Erik Hurst, differing slightly because I define home production to be consistent with the earlier studies.Footnote 14
My analysis of the original sources reveals the reason for some of the conflicting views. Most of those who have maintained that home production fell significantly during the first two-thirds of the twentieth century have relied exclusively on a couple of rough estimates for housewives offered by Stanley Lebergott.Footnote 15 Investigation of the original sources, however, reveals that Lebergott's estimates were inadvertently based on the wrong table in a key dissertation and on the assumptions of a social activist (Charlotte Gilman) who conducted no study. Lebergott argued that time spent in housework by housewives fell by around 42 hours per week from 1900 to 1966.Footnote 16 In contrast, I find that it fell by six hours per week between 1900 and 1965, and all of that change could be accounted for by the number and age of children and the increased education levels of housewives. Time spent in home production by all prime-age women (employed and nonemployed) also fell by six hours per week from 1900 to 1965, while time spent by prime-age men rose by seven hours per week. As a result, time spent by all prime-age individuals increased slightly over this period. However, in the ten-year period from 1965 to 1975, women's time spent in home production fell by another nine hours, whereas men's time rose by only one hour, so that the average time for prime-age individuals fell by four hours per week. From 1975 to 2005, prime-age hours fell slightly and then recovered. If estimates of home production time by children and the elderly are included, the per capita time spent in home production has increased by about two hours over the twentieth century.
Readers should be cautioned that, like most historical analyses, there is substantial uncertainty surrounding some of my estimates. The early estimates for housewives are quite good; they are based on thousands of observations across the country, they vary little from study to study, and I have used regression analysis to adjust them in a way to make them closer to being nationally representative. The estimates for some of the other groups are based on far fewer studies and thus are more tentative. Moreover, while I have tried to be very careful in classifying activities similarly over the entire century, there is always a possibility that subtle variations in classification could change the estimates by a couple of hours per week.
THEORETICAL LINKS BETWEEN APPLIANCES AND TIME SPENT IN HOME PRODUCTION
To investigate the role of home technology in the effects of appliances on labor supply, I consider a modified version of an alternative model presented by Greenwood et al.Footnote 17 I focus on a static version for ease of exposition, since the results do not depend on dynamic considerations. Also, I assume a simple household optimization problem since details of household bargaining are inessential to the point I wish to make.
Households choose market consumption Cm, consumption of home produced goods Ch, home production capital K, market hours Nm , home production hours Nh, and leisure l to maximize utility

subject to the production function for home goods

and budget constraint

where q is the real rental price of home production capital (in terms of consumption goods) and w is the real wage rate for market work. μ, ν, and θ are assumed to be positive and between zero and unity.
Manipulation of the first-order conditions from this maximization problem leads to two key equations for the capital-labor ratio in home production and the ratio of market hours to home production hours


Equation 4 indicates that either a fall in the rental cost of capital q or a rise in the market wage w raises the capital-labor ratio in home production for any value of r < 1. Differentiation of equation 5 with respect to q and w shows that the effects on market hours versus home hours depend crucially on the elasticity of substitution between capital and labor in home production, e = 1/(1– r). In particular, one can establish that a fall in q or a rise in w leads to a rise in market hours relative to home hours, Nm/Nh, if e >1; no change if e = 1; and a fall in Nm/Nh , if e < 1.
To see the intuition, consider the extreme case of a Leontief production function, where e = 0. In this case, home production capital cannot be substituted for labor. If capital's price falls, then the household buys more capital and allocates more labor to home production. At the other extreme, if ε = ∞, then households can perfectly substitute capital for labor, and time spent in home production falls.
Thus, this simple theory demonstrates that a rise in home capital such as appliances need not shift labor from the home to the market. With these functional forms, such a shift only occurs if the elasticity of substitution between labor and capital in home production is sufficiently high. The canonical Cobb-Douglas case (r = 0) predicts no change in the ratio of market to home work in the face of either falling durables prices or rising market wages.
Larry E. Jones, Rodolfo E. Manuelli, and Ellen R. McGrattan consider alternative versions of the model in which all production is Cobb-Douglas, but in which utility depends on a composite commodity with a constant elasticity of substitution between market goods and home produced goods.Footnote 18 They show that technological progress in the home production sector leads market hours to rise only if market and home goods are complements. If they are substitutes, market hours fall in response to technological innovation in the home sector.
In sum, from the viewpoint of theory, there is no “Cowan Paradox.” Standard theory predicts that hours spent in home production can rise, fall, or stay the same in response to technical innovations such as appliances. The effect depends on key elasticities of substitution. Given the failure of theory to make clear predictions, it becomes even more imperative to develop consistent long-term measures of time spent in home production. The rest of the article undertakes this task.
CLASSIFYING TIME SPENT IN HOME PRODUCTION
General conceptions of what is home production have not changed much in the last century; the definition by Reid presented in the introduction is still relevant today.Footnote 19 Time use studies from 1912 tend to classify activities similarly to time use studies in 2005. Interestingly, opinions about many tasks have not changed much either. In the 1920s, 55 percent of farmwives said they enjoyed cooking the most, whereas 13 percent said they enjoyed care of children the most. Laundry and cleaning ranked at the bottom.Footnote 20 In 1985 individuals continued to rate cooking higher than childcare, and rated laundry and cleaning near the bottom.Footnote 21
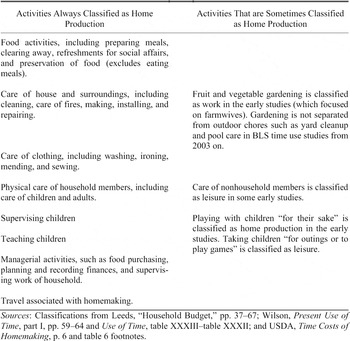
Column 1 of Table 1 shows the activities that are classified as “homemaking” in all early studies of home production. These include food preparation, cleaning the house, care of family members living in the household, shopping, and managing the household. Column 2 shows other activities that are only sometimes classified as home production. These include gardening (which is reported in many of the early studies, but is classified as work since many of those studies focused on farm households), care of others who are not in the household, and entertaining children. Maud Wilson explicitly excludes care of nonhousehold members from home production, whereas the other early studies do not discuss the distinction.Footnote 22 Because extended families were more likely to live together in the early period, care of others not in the household was relatively unimportant, averaging about 40 minutes a week in Wilson's study.Footnote 23 On the other hand, because of the rise in divorce and the tendency for elderly parents to live apart from their children, care of nonhousehold members is now an important part of home production. The studies from 1965–1985 combine help and care of household members with nonhousehold persons. Thus, when linking the early studies to later studies, I will exclude gardening and playing with children, but include care of nonhousehold members. I will note how the results are affected by these classifications.
ANALYSIS OF EARLY TIME USE STUDIES OF HOUSEWIVES
This section analyzes the principal studies that have been used to estimate time spent in home production by housewives in the first half of the twentieth century. I use the terms housewife and homemaker interchangeably to indicate a woman whose primary occupation is home production and who spends fewer than 10–12 hours in other work. A later section will discuss other groups such as employed women, men, and children.
Two features of the studies are important to keep in mind as they are reviewed: the survey method used and the ways in which the samples are not nationally representative. Consider first the survey methods. Some earlier studies used time diary methods and others used recall estimates. The time diary method requires individuals to keep track
CLASSIFICATION OF ACTIVITIES IN TIME USE STUDIES

Sources:
Classifications from Leeds, “Household Budget,” pp. 37–67; Wilson, Present Use of Time, part I, pp. 59–64 and Use of Time, table XXXIII–table XXXII; and USDA, Time Costs of Homemaking, p. 6 and table 6 footnotes.
of their activities throughout a day, typically in five to fifteen minute intervals. Recall estimates, in contrast, typically ask more vague questions, such as: “How much time do you usually spend on housework in a week?” A number of cross-validation studies show time diaries to be the most accurate source of estimates for housework.Footnote 24 As John P. Robinson and Geoffrey Godbey discuss, studies that rely on individuals' recall estimates of time spent in various activities almost always add up to more than the total time available.Footnote 25 For example, they discuss several studies in which estimated time spent in weekly activities ranged from 187 hours to 250 hours, clearly violating the constraint that there are only 168 hours per week. Thus, more weight should be placed on the estimates that use time diaries rather than recall or anecdotes.
The second issue to consider is the nature of the samples. None of the time use studies conducted in the first half of the twentieth century was based on a nationally representative sample. Thus, as I discuss each study and its features, it will be important to keep in mind how the sample differs from the national average and how that difference may affect the estimate of time spent in home production. Later in the article, I will use estimates from detailed group data from one of the key studies to create estimates that are closer to being nationally representative.
Leeds (1917)
As part of his dissertation, John B. Leeds conducted a survey of time use among 60 families in Pennsylvania between 1912 and 1914.Footnote 26 The families were distributed across cities, suburbs, villages, and rural areas. The larger sample of 60 was not based on records, but on recall estimates by the housewives. A smaller sample of 12 families also kept records. The sixty-family sample was nonrandom in several key ways: all families earned at least $1,000 a year, all lived in houses rather than apartments, and the average number of children per family was greater than the national average by one.
The average of the sixty housewives' estimates of time spent on home production was 56 hours per week.Footnote 27 This estimate included time spent in meal preparation and cleanup, care of clothing, house cleaning and repairing, shopping, physical care of children, oversight of children, and management of the household. It did not include gardening. As we shall see, this estimate is only slightly greater than the estimate of time spent in home production by housewives in the 1960s.
Why, then does Lebergott cite Leeds for his rough estimate that housewives spent over 40 hours per week in food preparation and meal cleanup alone?Footnote 28 My reading of the original Leeds dissertation reveals that Lebergott inadvertently used the hours spent by all people in the household, including hired help, rather than the amount of time spent by the housewife herself.Footnote 29 In addition to the housewife's hours, hired help and help from family members contributed an extra 46 hours per week to home production, for a total time of 102 hours per week.Footnote 30 Thus, Lebergott's estimate included services bought on the market with home production hours of housewives and other family members. The hours of servants are included in estimates of market work and their wages are counted in GDP, so their hours should not be double-counted as household production hours.Footnote 31
Lebergott's inclusion of servant hours represents a serious over-estimate because total time devoted to home production was much higher in households with hired help than households without hired help. The USDA time-diary study of the 1920s and 1930s showed total time devoted to home production in the households of urban, highly educated households (75 percent of whom had hired help) was 20 hours more per week than for rural households (90 percent of whom had no hired help.)Footnote 32 Thus, Lebergott's use of the total hours table rather than the housewife hours table results in a substantial overestimate of the time spent by the average housewife. This error has multiplied through the literature because most economists quote this number from Lebergott.
There are other potential sources of bias in the 56 hours per week estimate, however. The recall method and the higher than average number of children would be expected to bias the estimate upwards. On the other hand, Leeds' study excluded the low-income families living in the tenements in big cities at that time. The average expenditures for food, clothing, shelter, furniture, and household operation was $1,575 in Leeds' sample compared to the average urban family of $1,154 in 1917–1919.Footnote 33 Thus, Leeds' families had higher income than average. Many researchers have assumed that wives in lower socioeconomic status families spent more time in home production.Footnote 34 In fact, there is not much evidence for this assumption. Vanek analyzed the link between income and housework in rural families during the 1920s and 1930s.Footnote 35 She found no relationship between income and housework. My analysis of individual-level data from the nationally representative 1965 time use survey (discussed in detail below) shows that housewives in the lowest household income quartile spent the same amount of time on home production as married women in the highest household income quartile, even after controlling for number and age of children. Thus, there is no firm evidence behind the widespread belief that the time spent on home production depends negatively on household income.
How could the poor maintain a household with no hired help and no modern appliances? First, because lower income families lived in smaller living quarters, there was less home production to be done. Reid argued that apartment dwellers spent significantly less time in home production than families in their own houses; there was less space to clean and no houses to paint or repair.Footnote 36 Second, there is a good deal of qualitative evidence that lower-income families produced less home production output. A home economist noted during that time “if one is poor it follows as a matter of course that one is dirty.”Footnote 37 Having clean clothes, clean dishes, a clean house, and well-cared-for children was just another luxury the poor could not afford. Consistent with this observation, studies of wage earners' budgets revealed a monotonous diet with many ready-made goods, such as bakery bread, sausages, salted fish, and canned goods.Footnote 38 According to the study by Robert S. Lynd and Helen Merrell Lynd, near the turn of the century only the working class bought their bread instead of making it themselves.Footnote 39 Thus, it appears that home production output was substantially higher in middle- and upper-class households.
In sum, several aspects of Leeds' sample suggests that his estimate of 56 hours per week may be above the national average, whereas other aspects suggest that his estimates may be below the national average. In any case, Lebergott's estimates were clearly too high because of his inclusion of hours spent by hired help and other members of the household.Footnote 40 Below, I will construct nationally representative estimates based on another source, and I will find estimates that are very close to Leeds' estimate of 56 hours per week.
Purnell Act Time-Diary Studies
The Purnell Act of 1925 provided funding for detailed time-diary studies of thousands of American women, with a focus on farm women. These studies were conducted by researchers working for the Bureau of Home Economics of the U.S. Department of Agriculture. The combined sample size of the studies conducted around the country exceeded 3,000 housewives. Housewives were asked to keep a diary showing their activities for seven days, for 24 hours per day.
Vanek's landmark dissertation analyzed twelve studies funded by the Purnell Act and compared time use to the Survey Research Center 1965 study.Footnote 41 Her analysis led her to the startling conclusion that homemakers in the mid-1960s were spending slightly more time on home production than the homemakers of the 1920s. Vanek noted, as did at least five of the original researchers conducting the various studies, that women with access to electricity, plumbing, and appliances spent the same amount of time on housework as women who lacked these conveniences.Footnote 42
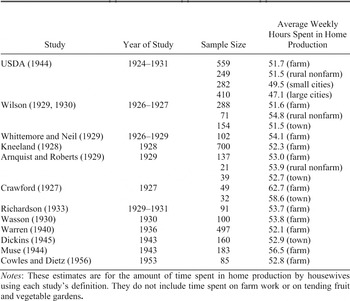
Table 2 shows a summary of the Purnell Act studies for homemakers. All of these studies were surveyed by Vanek, but my summaries of Ina Z. Crawford, Hildgard Kneeland, Inez F. Arnquist and Evelyn Roberts, Wilson, Jessie Richardson, the USDA, Dorothy Dickins, and May L. Cowles and Ruth P. Dietz are based on my reading of the original studies.Footnote 43 With the exception of two small sample outliers, the estimates across studies range from 47 hours per week to 56.5 hours per week, with a weighted mean of 51.9.Footnote 44 There seem to be no significant differences according to whether the women lived on farms, in rural areas, or towns, or whether the studies were conducted in the 1920s, 1930s, 1940s, or 1950s. Farmwives had longer workdays than other housewives, however, because in addition to performing homemaking tasks, they devoted between 9 and 11 hours per week to farm work. The two USDA samples from large urban areas consist entirely of housewives who were graduates of elite colleges; thus, it is difficult to untangle how much of the slightly lower estimates are due to their socioeconomic status and how much is due to the benefits of living in large cities.
PURNELL ACT TIME-DIARY STUDIES OF HOMEMAKERS

Notes:
These estimates are for the amount of time spent in home production by housewives using each study's definition. They do not include time spent on farm work or on tending fruit and vegetable gardens.
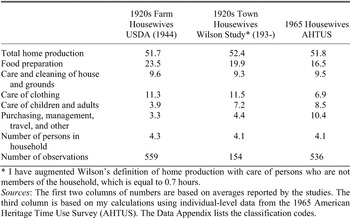
Table 3 shows time spent in subcategories of home production for three groups: one sample of farm housewives in the mid-1920s reported by the USDA, town housewives in the mid-1920s from Wilson's study, and married nonemployed women in 1965, with the latter estimates based on my calculations from individual-level data from the nationally representative American Heritage Time Use Survey.Footnote 45 The numbers from the USDA summary are very similar to other Purnell Act studies. The table shows that the household size for all three groups was very similar, just over four persons per household. The USDA survey did not specify the number of children versus adults, but Wilson's study showed an average of 1.83 children and 2.24 adults per household among the town housewives. The numbers were virtually identical in 1965, 1.87 children and 2.18 adults.
HOURS PER WEEK IN TYPES OF HOME PRODUCTION BY SELECT GROUPS OF HOUSEWIVES

* I have augmented Wilson's definition of home production with care of persons who are not members of the household, which is equal to 0.7 hours.
Sources:
The first two columns of numbers are based on averages reported by the studies. The third column is based on my calculations using individual-level data from the 1965 American Heritage Time Use Survey (AHTUS). The data appendix lists the classification codes.
While the total time spent in home production is very similar across the three groups, some of the subcategories differ quite a bit. Housewives in the 1960s spent less time on food preparation and clothing care, but more time on care of others and much more time on purchasing, household management, and travel than farmwives and town housewives in the 1920s. Being able to rely on the market for food and clothing saves time in those categories, but adds time in terms of purchasing, traveling to stores, and household management such as paying bills.Footnote 46
After analyzing data such as these, Vanek concluded that total time spent in home production did not change between the 1920s and 1960s.Footnote 47 Her analysis has been dismissed by some economists because she did not adjust her estimates for the fact that the samples were not representative.Footnote 48 For example, Glen G. Cain hypothesized that the early numbers might be underestimates relative to the national average because busier women were less likely to respond; higher status farmwives might have done less home production; and the number of children per household may have been less than the average for farm households.Footnote 49
With regard to Cain's first concern about self-selection of less busy individuals, all the evidence points to the fact that the individuals most likely to respond to time use surveys are the ones who are busier.Footnote 50 Thus, there is no evidence of the type of bias in Cain's first concern.
Bryant sought to address Cain's second and third concerns by using regression analysis to calculate the effects of education, place of residence, and family size on home production.Footnote 51 Bryant combined information from Wilson's tables with the USDA study, and studied the effects of household size, education, and residence on total home production, as well as subcategories.Footnote 52 When Bryant used his regression estimates to reweight the averages, he obtained estimates of home production time in the 1920s that were three hours per week lower than the rural estimates.
Bryant's analysis was a significant step forward because he used formal statistical techniques rather than guesses to make adjustments to the raw data.Footnote 53 However, because he based most of his analysis on the USDA study, he was unable to control for the number and age of children.Footnote 54 Also, his urban sample consisted entirely of graduates of elite colleges, who had somewhat lower hours of home production than the other samples. Below, I will show that Wilson's data allow for more precise controls for reweighting estimates for the first half of the twentieth century.Footnote 55 Nevertheless, I reach very similar conclusions to those of Bryant.Footnote 56
ADJUSTED ESTIMATES FOR NONEMPLOYED WOMEN
As discussed in the last section, the Purnell Act studies were not nationally representative. Thus, this section constructs estimates of time spent in home production by housewives (and other nonemployed women) between the ages of 18 and 64 that are adjusted to make them more nationally representative with respect to family composition and educational attainment. The next section will study other demographic groups.
For the pre-1965 sample, I first use the data from Wilson's study in the early 1920s to estimate how household characteristics correlate with the amount of time spent in home production.Footnote 57 In order to be consistent with later studies, I augment Wilson's definition of home production to include care of nonhousehold members, which averages 40 minutes per week. The sample size is over 500 housewives and is about equal to the sample of housewives in the 1965 time use study used below. The individual-level data are no longer available, but Wilson provides hundreds of tables of tabulations of her sample by different groups.Footnote 58 I use tabulations of data by residence (farm, nonfarm rural, and town) and family composition. The family composition cells are grouped according to the presence of children and whether there are children in each of four age categories. The permutations on these age categories and residence categories result in 35 cells with nonzero observations. The only available socioeconomic status variable is educational attainment, but it is not available by cell for the rural nonfarm group, so most of the estimates presented are for 25 cells with a total of 442 observations. I estimate regressions based on the grouped data, using the number of observations per cell as weights.
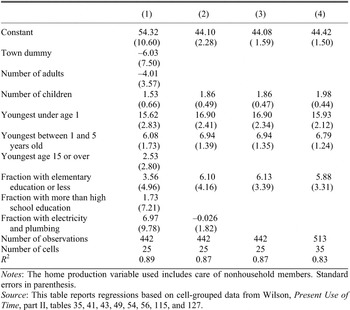
To determine which available variables are most important for explaining time spent in home production, I use David F. Hendry's “general-to-specific” methodology.Footnote 59Table 4, column 1 shows the regression with all of the available variables. The variables include a dummy variable for town residence, the number of adults in the household, the number of children ages 18 and under in the household, whether the youngest is under one year of age, whether the youngest is between one and five years of age, whether the youngest is between 15 and 18 years old, the fraction of the women with an elementary school education or less (eight years of school or less), the fraction with more than a high school education, and the fraction with electricity and plumbing. Footnote 60 Many of the coefficients are not statistically different from zero, but it is
DETERMINANTS OF HOME PRODUCTION TIME IN THE 1920S DEPENDENT VARIABLE: HOUSEWIFE'S WEEKLY HOURS SPENT IN HOME PRODUCTION

Notes:
The home production variable used includes care of nonhousehold members. Standard errors in parenthesis.
Source:
This table reports regressions based on cell-grouped data from Wilson, Present Use of Time, part II, tables 35, 41, 43, 49, 54, 56, 115, and 127.
likely that the precision of the estimates is affected by multicollinearity. Thus, following Hendry's methodology, I test many combinations of subsets of variables until only those variables with t-statistics above the 10 percent significant level remain. Column 2 shows one intermediate step in which all of the variables except the fraction with electricity and plumbing are at least marginally significant. The economically and statistically insignificant coefficient on the fraction with electricity and plumbing indicates that the availability of utilities appears to have no correlation with the amount of housework done. Thus, these regression results support the existing evidence that the time spent in housework has no relationship to the presence of modern utilities and appliances.Footnote 61
Column 3 shows the results with only statistically significant variables included. According to the results, a woman with no children and at least some high school spent 44 hours per week on home production. Each extra child age six or above added almost two extra hours. However, if the youngest child was under one year of age, the housewife spent 17 hours more per week.Footnote 62 If the youngest child was between one and five years old, the housewife spent almost seven extra hours per week. If the housewife was less educated and had not attended any high school, she spent six hours per week more than an educated housewife. Thus, this regression provides some formal statistical evidence that socioeconomic status, at least as measured by education, is related to the amount of housework done in the 1920s. Whether the housewife lived on a farm or in town did not appear to matter in this sample, nor did the number of adults in the household.
As mentioned earlier, Wilson's data did not provide education by cell within the rural nonfarm group, so columns 1–3 are estimated only over the farm and town groups. Column 4 shows the regression that includes the rural nonfarm group, where the fraction with an elementary education or less for the entire rural nonfarm group has been entered for each cell within that group. This amendment results in a sample of 513 with 35 cells. As column 4 shows, the coefficient estimates are very similar to those in column 3.
Wilson's sample included only white women (both native born and immigrants). A key question is whether time spent in home production was different for nonwhite women. Fortunately, Dickins' study, which compared 80 white homemakers to 80 black (“Negro”) homemakers in small towns in Mississippi in 1943, allows us to gain insight into this question.Footnote 63 Her study shows that white homemakers and black homemakers spent the same amount of time on homemaking, around 53 hours per week.Footnote 64 The numbers are similar despite the fact that only 2 of 39 families in the poorest black households had kitchen sinks and that most of the black families did not have a water supply in the house.Footnote 65 Furthermore, applying the regression coefficients from Wilson's data to Dickins' information on family composition and education, the predicted hours of home production for the black homemakers is 52 versus the actual value of 53. The slightly higher number in Dickins' study might be attributed to the fact that the survey was conducted during the main canning season, which was an important part of the war effort.Footnote 66
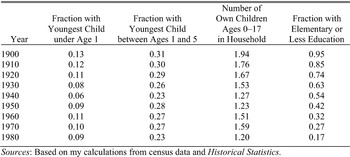
Given the similarities across studies, I use the regression estimates from column 3 of Table 4 to form estimates of time spent in home production that are closer to being nationally representative estimates. In particular, I apply the coefficients to the national averages of the explanatory variables for married nonemployed women between the ages of 18 and 64. These national averages are calculated from the census and Historical Statistics from 1900 to 1960, as described in Appendix A.
All of these estimates apply to married nonemployed women. Among all nonemployed women ages 18 to 64, 77 percent were married in 1900 and 86 percent were married in 1960. The widowed, divorced, and never-married women who were not employed were often the unmarried daughters or “maiden aunts” who lived with their families and helped the housewife with home production.Footnote 67 To determine the difference in home production time by married versus unmarried women, I estimated regressions on individual data for nonemployed women (who are not students) from the 1965 and 1975 surveys. These regressions show that conditional on the number and age of children as well as education and year, married women spend 7.12 more hours per week than unmarried women.Footnote 68 Thus, for the unmarried nonemployed women I use the regression coefficients from Table 4 applied to their family compositions, but subtract 7.12 hours per week.
Obtaining nationally representative estimates for the period from 1965 to the present is simple relative to the early period. Estimates of time spent in home production since 1965 are available from the micro files of the time diary surveys conducted by the Survey Research Center in 1965, 1975, 1985, and 1992–1994, and the BLS time use surveys beginning in 2003. I use the American Heritage Time Use Survey (AHTUS) version of these studies, augmented with the 2003, 2004, and 2005 BLS surveys. The Data Appendix shows the activities codes included in “home production.” I do not use the 1992–1994 survey because of key missing data (such as marital status) and the problems with that survey discussed by Robinson and Godbey.Footnote 69
A key challenge is matching activities across the various surveys. The Purnell Studies use a common classification scheme, the studies from 1965–1985 use another classification scheme, and the BLS studies from 2003–2005 use yet a third classification scheme. Fortunately, two small key linking studies can be used to check the classification linkages: a 1968 study conducted using the Purnell Act classifications and a 1998 study conducted using the 1985 study classification scheme. The Data Appendix shows that the estimates from these alternative studies are quite close at the overlap.
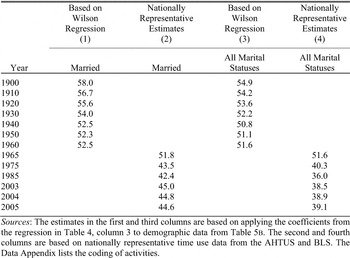
Table 5a shows the new estimates of home production for married nonemployed prime-age women as well as all nonemployed prime-age women from 1900 to the present. The estimates for married women fall from 58 hours per week in 1900 to 52.5 in 1960. Because these estimates are constructed from constant regression coefficients from the 1920s, the source of the change is the change in family composition and education. Interestingly, my estimate for 1910 of 56.7 is just slightly above Leeds' estimate of 56 for 1912.Footnote 70 My estimate for 1920 is 55.6, which is just a few hours above the mean for Wilson's study. The estimates for 1930, 1940, and 1950 are equal to the means for the other Purnell Act studies shown in Table 2. The estimates for all nonemployed women in this age group are similar.
The second column shows estimates for housewives from the nationally representative time use studies starting in 1965.Footnote 71 Note that my method, based on regressions on Wilson's data from the 1920s, produces an estimate for 1960 that is very close to the estimate from the nationally representative sample in 1965. This match lends credence to my estimation method, which assumes that only the family composition and education of the housewife matters for the period from 1900 to 1960, and which assumes that the diffusion of appliances had no effect on time spent in home production.Footnote 72 The results suggest a very gradual decline in time spent in home production by nonemployed prime-age women from 1900 to 1965. The decline of almost four hours per week from the 1920s to 1965 is similar to Bryant's estimate of a decline of four hours per week when he compares nonemployed married women.Footnote 73
ESTIMATES OF HOME PRODUCTION: NONEMPLOYED WOMEN, AGES 18–64 HOURS PER WEEK

Sources:
The estimates in the first and third columns are based on applying the coefficients from the regression in Table 4, column 3 to demographic data from Table 5b. The second and fourth columns are based on nationally representative time use data from the AHTUS and BLS. The data appendix lists the coding of activities.
CHARACTERISTICS OF HOUSEWIVES AGES 18–64 USED FOR CONSTRUCTING ESTIMATES IN COLUMN 1 OF TABLE 5A

Sources:
Based on my calculations from census data and Historical Statistics.
Thus, although I exploit a different compilation of the 1920s data and I use the nationally representative survey in 1965 (rather than Kathryn E. Walker and Margaret Woods's survey of Syracuse in 1968), I confirm Bryant's findings for nonemployed housewives.Footnote 74
As further evidence of the constancy of home production time (conditional on family composition) until the 1960s, I conducted the reverse experiment.Footnote 75 Using individual-level data from 1965, I estimated a prediction equation for home production based on family composition and then compared the prediction to 1920. The 1965 data are less rich in that they only indicate whether children are under 5 years of age. The estimated equation based on 1965 data for housewives between the ages of 18 and 64 was

Standard errors are shown in parenthesis. The values of the explanatory variables in Wilson's data (in order) were 0.40, 1.74, and 0.27. Thus, the predicted amount of home production in the 1920s, based on 1965 estimates, was 51.8 hours per week. The actual amount in Wilson's sample (including care of nonhousehold members) was 52.7, within one hour of the predicted value. Thus, regressions run on 1920s data predict home production time in 1965 very well and regressions run on 1965 data predict 1920s home production time very well.
Between 1965 and 1975, however, the amount of time spent in home production by these women decreased dramatically, by eight hours per week. This drop has been noted by a number of previous studies, such as those by Robinson and Godbey and Mark Aguiar and Erik Hurst.Footnote 76 After 1975 there was virtually no change in home production by housewives.
The third and fourth columns show the estimates for all nonemployed women, including unmarried women. The estimates are slightly lower because unmarried nonemployed women tend to have fewer children and because the estimates incorporate the auxiliary estimate that unmarried women spend seven hours less per week on home production.
A key question is why time spent in home production fell so dramatically between 1965 and 1975. One possibility is changes in the methodology of the studies. This explanation is unlikely because Robinson was a key investigator in both studies and strove to make the categories comparable. A second possibility is changing demographics. To try to understand the changes, I used the microdata from 1965 and 1975 to study changes for nonemployed married women. After controlling for family composition and education, the decline in home production was still seven hours per week. By subcomponent of home production, time spent in cooking and cleanup fell by two hours per week, in housework by one-half hour per week, in laundry and clothing care by three hours per week, and in purchasing, management, and other home production by 1.6 hours per week. Time spent on childcare (after controlling for the age and number of children) did not change at all. The fact that the biggest declines were in cooking, cleanup, and clothing care leads one to wonder whether the diffusion of “TV dinners,” dishwashers, and polyester in the late 1960s and early 1970s had more impact on time spent in home production than the diffusion of washing machines and vacuums. Another possible explanation is the social changes resulting from birth control pills and the women's movement. Further analysis of the decline in home production from 1965 to 1975 would be a fruitful area for further research.
ESTIMATES FOR OTHER DEMOGRAPHIC GROUPS
Housewives have received the lion's share of attention because they have historically accounted for most of the housework. However, to understand total trends in housework, as well as how the increasing labor force participation of women has affected time spent in housework, it is essential to study the rest of the population. In this section, I will construct estimates for employed women, employed men, unemployed men, individuals over age 65, and children. These estimates will also be used to construct aggregate estimates for the population.
Employed Women Ages 18–64
There are far fewer estimates of the time spent in home production by employed women in the early period, in part because they represented a less important part of the population (only 20 percent of prime-age women in 1900).
Janet Fowler Nelson used time-diary methods to study the leisure time of female white-collar workers.Footnote 77 The study was conducted for the International Y.W.C.A. in 1931 and 1932. The sample contains over 1,000 observations on young women employed as secretaries, office clerks, teachers, and nurses. The majority was single and none had children.
These women appear similar to national samples in several aspects. First, Nelson's comparisons indicate that the distribution of father's occupations was similar to the national average, indicating that this was not a select group.Footnote 78 Second, Nelson states that she found no differences in time use between the women who were associated with the Y.W.C.A. and the control group that was not associated with the organization. Third, their hours of work are similar to other employed women. According to William Sundstrom, the average weekly hours for female manufacturing workers was 39.8 in 1931 and 36.3 in 1932, which is just below the average of 40 in Nelson's sample.Footnote 79 Fourth, the women's living arrangements were roughly similar to the national average. According to the census, 92 percent of single (never-married) employed women lived with relatives or as a lodger or boarder. Ninety percent of Nelson's sample lived with their families or as boarders. Fifth, the average age of the working women of 25 was just two and one-half years under the national average for single employed women (between the ages of 18 and 64).
Nelson's survey included 57 activities, most of which were detailed leisure activities. One of her other categories was “household responsibilities.” To create a home production category that is comparable to the other studies, I combined the time spent in this category with “personal business” and her leisure categories, “shopping” and “sewing.”
According to the estimates, business women (secretaries, etc.) spent 40 hours working per week, seven hours commuting, and six hours in home production. Professional women (teachers, nurses, and librarians) spent 37 hours working per week, five hours commuting, and seven hours in home production. As I will discuss below, female high school students did about six hours of housework per week. Thus, employed single females in their twenties appear to have been very similar to high school students in their time spent in home production.
Although the study was intended to focus on single women, the sample also included 58 married women (none of whom had children). Unfortunately, Nelson does not report the estimates for some of my added categories of home production. Nevertheless, the estimates suggest that even though married women spent the same amount of time working and commuting, they spent 2.5 times more time in home responsibilities than the single women. If we apply this factor to the total category of home production, it would indicate that married women with no children spent 15 or more hours in home production activities.
A second study that provides information on employed women is the time-diary study conducted by George A. Lundberg, Mirra Komarovsky, and Mary Alice McInerny between 1931 and 1933 of 2,500 respondents of Westchester County, New York.Footnote 80 It was a convenience sample in which high school students were greatly overrepresented. Although the average income of this county was quite high, the study also had a number of lower income respondents. Fortunately, Lundberg et al. show time use by general occupation and gender.Footnote 81 Though far from perfect, this study serves as one of the few sources of early time use data on groups outside of housewives.
According to the study, the group of female factory workers (a sample of 60 individuals with a total of 228 diary days) spent 9.8 hours per week on “household and children,” whereas white-collar female office employees (a sample of 226 individuals with 678 diary days) spent 8.4 hours per week on household and children. We do not know how many of these women were married or how many had children. These estimates lie between the single and married women estimates of the Nelson study.
In the third study, Blanche M. Kuschke surveyed 69 employed married women in Rhode Island in 1935 who worked 30 or more hours per week outside the home.Footnote 82 Most were office workers, teachers, or nurses. Average hours of outside work was 40 hours per week, which was just above the 1940 Census average of 38 hours per week for employed married women between the ages of 18 and 64. Average hours spent on home production was 25 hours per week. The time spent by the women in this sample is greater than in the previous samples for several reasons. First, in contrast to the Lundberg et al. study, all of the women in the Kuschke sample were married. Second, in contrast to the married women in Nelson's study, the women in the Kuschke study were the female heads of households.Footnote 83
The fourth study is by E. Wiegand (summarized by Walker).Footnote 84 In a sample of 53 employed married women in 1952, the average time spent in home production was 28.7 hours per week.
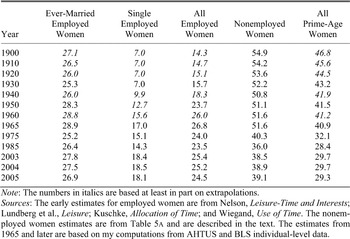
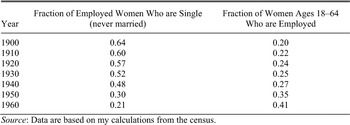
I use the estimates from three of these studies to construct estimates of time spent in home production for employed women. For the early period, I estimate hours of employed women by weighting the ever-married and single employed women cells by their fractions from the census. I use the mean of Kuschke's estimates of 25 hours per week for ever-married employed women in 1936 and Wiegand's estimate of 28.7 hours for 1952. For single employed women, I use Nelson's estimate of seven hours per week. These estimates for subcategories give an estimate of 15.6 hours per week per employed woman in 1930. For the period before 1930, I assume that housework by ever-married women follows the same trends as for housewives. I assume that housework by single employed women was a constant seven hours before 1930. Since single employed women worked much longer hours in the market in the first few decades of the century and were even more likely to reside with family or as boarders, it is unlikely that they would have had time to do more home production.
Table 6a shows my estimates for employed women, nonemployed women, and all women between the ages of 18 and 64. The estimates for all women are constructed by weighting the employed and nonemployed estimates by the employment-population ratio. The Data Appendix describes how this series is constructed. The estimates from 1965–2005 are from nationally representative samples.
Ironically, it appears that single employed women in 1965 spent significantly more time in home production than those in 1930. The difference in living situations is the most likely reason for this difference; single employed women in 1965 were far less likely to live with their families or in boarding houses. Thus, the estimates suggest that while the amount of home production by nonemployed women was slowly decreasing, the amount of home production by employed women was increasing.
The final column of Table 6a shows the estimates for all prime-age women, where the individual estimates have been weighted by the fraction employed. For all women between the ages of 18 and 64, the estimate is 47 hours per week in 1900, falling to 41 hours in 1965, and reaching 29 hours in 2005. Thus, the estimates suggest that time spent in home production by prime-age women fell twice as much from 1965 to 2005 as from 1900 to 1965.
ESTIMATES OF WEEKLY HOURS SPENT IN HOME PRODUCTION: WOMEN AGES 18–64

Note:
The numbers in italics are based at least in part on extrapolations.
Sources:
The early estimates for employed women are from Nelson, Leisure-Time and Interests; Lundberg et al., Leisure; Kuschke, Allocation of Time; and Wiegand, Use of Time. The nonemployed women estimates are from Table 5a and are described in the text. The estimates from 1965 and later are based on my computations from AHTUS and BLS individual-level data.
AUXILIARY INFORMATION FOR CONSTRUCTING HOURS IN HOME PRODUCTION

Source:
Data are based on my calculations from the census.
Men Ages 18–64
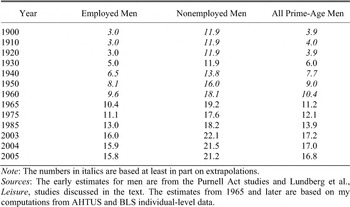
We now turn to the other half of the prime-age population. Because men historically have not done much home production, there are only a few studies to which we can turn. The estimates from the Purnell Act studies during the 1920s indicate that employed husbands spent very little time doing housework, between two and three hours a week.Footnote 85 Lundberg et al. estimated that male laborers and white-collar workers spent about four hours a week, whereas male professionals spent six hours a week in 1931.Footnote 86 Dickins found that black husbands helped between two and three hours per week.Footnote 87 In contrast, by 1965, the average employed man spent ten hours per week, and by 2005, he averaged 16 hours a week.
Are the numbers for the 1920s too low? One question is the accuracy of wives' estimates of husbands' housework time. In Wilson's study, wives were asked to keep written records of time spent by other members of the household and thus should be reasonably accurate.Footnote 88 Furthermore, a recent study using various methods for measuring time spent on housework found that wives' estimates of husbands' housework hours were quite accurate.Footnote 89 Thus, I do not have a reason to believe that wives' estimates are biased downward. A second factor that makes the lower estimates of employed men's housework in the 1920s plausible is the negative correlation between housework and the length of the workweek. Between 1965 and 2005, average hours of work of employed prime-age males fell by 3.6 hours per week, whereas average hours of housework rose by five hours per week. During the early decades of the century, employed men worked significantly more hours per week than they did in later decades. Thus, it is not so surprising that they helped less with the housework.
Another possible bias is single versus married men. All of the men in the 1920s studies were married. Do single men do more housework? My analysis of the 1965 data shows that, whereas the average employed married man in 1965 spent 10.7 hours on home production per week, the average employed single man spent 9.2 hours on housework. Thus, single employed men tend to do less housework than married employed men, so the 1920s estimates are not likely to be biased downward. Footnote 90
Finally, I consider home production hours of nonemployed men, which is a very small category, except during the Great Depression. According to the study by Lundberg et al., hours of nonemployed men were around 12 hours per week in 1931. In 1965 they were 19 hours a week, and are now 21 hours.Footnote 91
ESTIMATES OF WEEKLY HOURS SPENT IN HOME PRODUCTION: MEN AGES 18–64

Note:
The numbers in italics are based at least in part on extrapolations.
Sources:
The early estimates for men are from the Purnell Act studies and Lundberg et al., Leisure, studies discussed in the text. The estimates from 1965 and later are based on my computations from AHTUS and BLS individual-level data.
Table 7 shows the combination of these estimates for prime-age males. I use the Purnell study estimates for 1920, the Lundberg et al. estimates for 1930, the AHTUS and BLS estimates for 1965 to 2005, and interpolate between decades. I project the Purnell study estimates before 1920 in the absence of other information. Since men worked longer hours in 1900, it seems unlikely that they would do more home production than in the 1920s and 1930s when they had shorter work hours. The totals are constructed by weighting by employment-population ratios. The estimates show an increase of 13 hours a week for time spent in home production by men. Both employed and nonemployed men increased their time spent in home production.
Individuals Ages 65 and Over
The estimates presented so far have dealt only with the 18–64 age group. the first year that the 65 and older age groups were included in the national time-diary studies was 1975. For 1975 the estimates of housework range from 28 hours for nonemployed women to 13 hours for employed men. Nonemployed women ages 65 and older spend less time than nonemployed women ages 18–64 because most women ages 65 and older do not have young children. After 1975 women's hours fall slightly and men's hours increase substantially.
To extend the data earlier than 1975, I assume that males age 65 and over do the same amount of housework as those under 65 for each employment status group (since this is the case in 1975). For women, I assume that employed women ages 65 and over spend the same time as ever-married employed women between 18 and 65. For nonemployed women ages 65 and over, I assume that they work eight hours less per week than women ages 55–64 (since this is the case in 1975). Women ages 55–64 worked 47 hours per week in 1965. Thus, I use 39 hours per week for women age 65 and over for 1965 and earlier. Although there is much uncertainty about the estimates for the older age group in the early part of the sample, they are such a small fraction of the population (and their labor force participation rate was higher in the early part of the century) that imprecision of the estimates have little aggregate effect.
Children
Finally, I consider the housework done by children. According to Wilson, homemakers in the 1920s reported an average of three hours of housework from children ages 6 to 14 and five hours of housework for children ages 15 to 18.Footnote 92 Arnquist and Roberts report an average of five hours for children between the ages of 1 and 20.Footnote 93 The Lundberg et al. study estimated that high school students spent 4.5 hours on home production in 1931.Footnote 94 John F. Fox's survey of suburban school children from grades 6 to 12 found an average of 3.3 hours per week.Footnote 95 Estimates from J. Wiley et al., F. Thomas Juster and Frank P. Stafford, Susan Goff Timmer, Jacquelynne Eccles, and Kerth O'Brien, and Sandra L. Hofferth and John F. Sandberg suggest similar numbers for 1981, 1990, and 1997, around three hours for grade school children and five to six hours for teenagers.Footnote 96 These eight studies conducted over a 70-year span suggest that housework by school children has been about constant. However, most of the studies were conducted only during the school year. Fortunately, some of the 1920s studies and the BLS surveys indicate that children spend roughly twice as much time on home production during the summer. Weighting up the earlier estimates for the school year to account for the entire year, I assume that children ages 0–4 do no housework, children ages 5–13 work a constant 3.75 hours a week, and children ages 14–17 work 7.5 hours a week on housework.
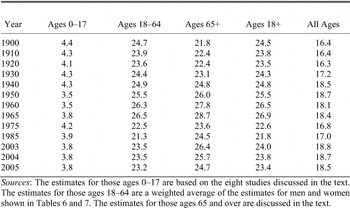
One other consideration is children who are not in school and not employed. In the early part of the century, 30 percent of girls ages 14–17 and 9 percent of boys ages 14–17 were neither in school nor in the labor force. For this category, I assume that girls and boys did the same amount of housework as those ages 18–64 in the same nonemployed category with no children (43 hours for girls and 12 hours for boys). I then weight by the fraction of children in this category. Thus, the overall estimates for average time spent in home production for those ages 0–17 are 4.4 hours in 1900, falling to 3.8 hours in 2005.
DISCUSSION OF THE ESTIMATES
Estimate Quality
The last section constructed estimates for all segments of the population. Before combining those to study overall trends, it is useful to review the quality of the estimates.
The estimates for housewives are probably the most precise, both since the data were rich enough to allow for adjustments to make them closer to being nationally representative and because there were so many different studies of housewives that all gave the same estimates for the early period. For 1912 both the raw estimate and my adjusted estimate (based independently on regressions coefficients from 1920s data applied to 1910 Census data) are 56 hours per week. For the second half of the 1920s, the raw estimates from the various studies totaling 2,500 observations average 53 hours per week, whereas my adjusted estimates are 54 hours per week. For the 1930s, 1940s, and 1950s, the raw estimates are 51 hours per week, whereas my adjusted estimates are 52 hours per week.
The estimates for employed males are based on less detailed data, but all of the available estimates of their home production in the early twentieth century are clustered between two and four hours per week in the early century. I have no reason to believe the estimates are biased.
The estimates for employed women, who constituted only 20 percent of all prime-age women in 1900, are somewhat surprising. The large study by Nelson suggests that single employed women spent much less time in home production in the 1930s than the AHTUS suggests they did in 1965.Footnote 97 Nelson's estimates are roughly consistent with the estimates of Lundberg et al., and become less surprising once one realizes that almost all single employed women in the early twentieth century lived with their families or in boarding houses.Footnote 98 The estimates for married employed women are based on much smaller studies, but they are similar to the estimates from 1965 on. Fortunately, this group constituted only 6 percent of all prime-age women in 1900, so errors in estimation have little effect on aggregates.
As for the other groups in the population, the estimates for children are surprisingly uniform across time and across studies. Thus, I think these estimates are quite precise. On the other hand, the estimates for older individuals in the pre-World War II era are very imprecise. They do not have much impact on the aggregate, though, because they were a small segment of the population.
As I discuss aggregate trends in the next section, I will indicate how changing some of the underlying assumptions for each group changes the results.
General Trends
In order to study general trends in home production time, the estimates from the last several sections are combined to form aggregate estimates as follows. For each of the relevant gender-employment-age cells, I use available estimates and then interpolate values between years of the time-diary studies. I then weight the estimated hours of housework of each cell by the fraction of the population that falls in that cell. Because average housework time differs so much between employed and nonemployed individuals, fluctuations in employment rates lead to fluctuations in the estimates. The year-to-year fluctuations are probably qualitatively correct, but should not be used for quantitative analysis because of the imprecision involved.
Figure 1 and Tables 6, 7, and 8 summarize the estimates of weekly hours in home production by prime-age men and women, as well as their weighted average. The figure shows that time devoted to home production by women fell gradually until 1965, after which it fell more steeply until 1975. Overall, time spent fell by almost 18 hours per week from 1900 to 2005; half of that fall occurred between 1965 and 1975. On the other hand, time spent by prime-age men rose steadily, by a total of 13 hours. Average time by all prime-age individuals (weighted by their shares of the population in each year) changed little from 1900 to 2005.
AVERAGE WEEKLY HOURS IN HOME PRODUCTION BY INDIVIDUALS AGES 18–64

How does each of the assumptions affect the estimate of average home production across all prime-age individuals in 1900? First, consider housewives. Since women were 48.5 percent of the prime-age population in 1900, 80 percent were nonemployed, and 77 percent of those were married, housewives accounted for 30 percent of the prime-age population. Thus, each hour by which we change the estimate of time spent in home production by housewives adds 0.3 hours to the prime-age aggregate. Fortunately, we are the least uncertain about the estimates for this group. Second, unmarried nonemployed women accounted for another 9 percent of the prime-age population. Recall that we assumed that unmarried nonemployed women spent seven hours less than similar married nonemployed women. If we assume they worked the same amount as married women, then the prime-age aggregate would be 0.6 hours greater. Thus, this assumption does not have a big impact on the aggregate. Third, suppose that we assumed single employed women in 1900 spent as much time as single employed women in 1965, 17 hours rather than the estimate of seven hours. Using the fractions above as well as the fact that 64 percent of employed women in 1900 were single, we see that the effect of increasing the estimate for this group by ten hours would add only 0.6 hours to the prime-age aggregate. Finally, consider employed men. Suppose that we doubled the estimate of time spent in home production, from three hours to six hours. Since 90 percent of the men were employed, the prime-age average (over both sexes) would rise by 1.4 hours. Making all of these adjustments for the non-housewife categories would add only 2.6 hours to prime-age hours in 1900.
AVERAGE WEEKLY HOURS IN HOME PRODUCTION FOR TWO AGGREGATES

Even allowing for the uncertainty in the estimates, they in no way support the notion of a dramatic decline in home production by prime-age individuals. It appears that most of the decline in time spent by women was compensated for by an increase in time spent by men.
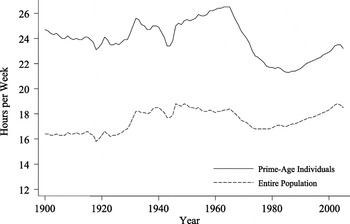
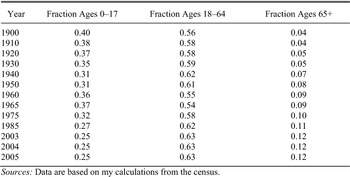
Figure 2 shows average time spent by prime-age individuals compared to average time spent by all individuals of all ages. On a per capita basis, there is a slight upward trend in time spent in home production during the last century. Weekly hours were 16.4 in 1900 and 18.5 in 2005. Tables 8a and 8b reveal why per capita home production is slightly higher now than in 1900. The fraction of the population that was under 18 years old was 40 percent in 1900 and is now only 25 percent. As discussed earlier, children have historically done very little home production. Thus, including them in the average significantly changes the trends.
ESTIMATES OF WEEKLY HOURS SPENT IN HOME PRODUCTION BY AGE GROUP

NONINSTITUTIONAL POPULATION BY AGE GROUP

Sources:
Data are based on my calculations from the census.
Another useful aggregate is housework time per household, which I estimate by dividing aggregate home production hours by the number of households. In 1900 hours of home production per household were 78 hours per week. By 2005 they were 49 per week. Thus, home production time per household fell by 37 percent. Over the same time period, the average size of the household fell from 4.7 to 2.6 persons, a 45 percent decline. Thus, the amount of time spent per household fell proportionally less than the size of the household.
CAPITAL-LABOR RATIOS IN HOME PRODUCTION AND FACTOR PRICES

Implications for Theory
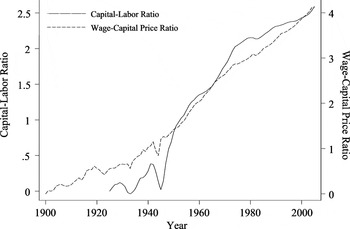
We can now use the series created in the last section to assess the plausibility of various theories. Recall from the theory presented in section two that the capital-labor ratio in home production should depend positively on the ratio of the market wage to the price of appliances. The elasticity of the capital-labor ratio with respect to this variable is equal to 1/(1–ρ), which is the elasticity of substitution between capital and labor in home production. On the other hand, the effect of the ratio of the market wage to the price of appliances on the ratio of time spent in market work to time spent in home production depends on the value of ρ /(1–ρ). Thus, the effect could be positive, negative, or zero.
Figure 3 shows the capital-labor ratio in home production plotted against the ratio of wages to the price appliances. “Labor” is the total time spent in home production by the population. The data appendix gives more details about the construction of the variables in the graph.Footnote 99 The graph shows that the data are consistent with the simple theory, since the capital-labor ratio in home production rises with the wage-price ratio. A simple regression of the log of the capital-labor ratio on the log of the ratio of wages to appliance prices yields a coefficient of 0.8, suggesting a slightly lower elasticity of substitution between capital and labor in home production than Cobb-Douglas.Footnote 100
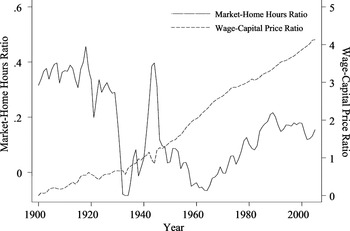
RATIO OF MARKET HOURS TO HOME PRODUCTION HOURS AND FACTOR PRICES

Figure 4 shows the ratio of total market hours to home production hours plotted against the ratio of wages to the price of appliances. There is little relationship between these two series. In fact, contrary to the standard story in which declines in home production hours freed up time for market work, total hours in the market fell relative to hours in the home from 1900 to 1960. The regression of the log hours ratio on the price ratio yields a coefficient of −0.051, suggesting that the price ratio has virtually no impact on the ratio of market hours to home production hours. This result is consistent with Rachel Ngai and Christopher Pissarides' model, or with a more simple model with Cobb-Douglas preferences and Cobb-Douglas technology for home production.Footnote 101 The advantage of this latter theory is that it can also explain the cross-sectional evidence indicating no relationship between time spent in home production and the presence of utilities and appliances.Footnote 102
As discussed briefly in the introduction, there are other leading explanations for why home production time did not fall during the diffusion of appliances. Cowan argues that appliances did not reduce time spent by the housewife, but it did allow her to accomplish what previously took a staff of several to accomplish.Footnote 103 Related to this argument is the notion that the diffusion of appliances compensated for the decrease in servants. In the pre-appliance era, many families hired laundresses or sent out their laundry to commercial facilities. Because of the large waves of immigration during the early part of the century, the real price of hiring full-time or part-time help was relatively low. At the same time that appliances diffused, immigration restrictions were imposed and the number of domestics employed fell precipitously. In fact, Lynd and Lynd quote two business-class wives in the 1920s as saying, “My labor-saving devices just about offset my lack of a maid.”Footnote 104 To quantify this effect, I compute average hours worked by servants per household.Footnote 105 Servant hours per household amounted to eight hours per week in 1900, but had declined to only one hour per week by 1950. Thus, including servant time, total hours per household averaged 86 hours per week in 1900. Thus, it is possible that the time-saving appliances merely replaced servant hours.
The second leading explanation is due to Mokyr.Footnote 106 Mokyr argues that the failure of labor-saving appliances to save labor during this period was the result of a different type of technological progress: the revolution in sanitation and cleanliness, the germ theory of disease, and knowledge about the consequences of nutrition for health. Mokyr presents evidence and a model suggesting that at the very time electric appliances were diffusing, the public became aware of the importance of cleanliness and nutrition for families' health. Thus, the demand for housework rose just as the appliances were introduced.
Whatever the explanation, it appears that the data are not consistent with the “engines of liberation” explanation of increases in women's labor force participation. Prime-age women's home production hours fell by six hours from 1900 to 1965, but that fall was matched by an increase in men's hours. Thus, total housework time barely changed during the era of the most rapid diffusion of appliances. On the other hand, it is likely that the drudgery of home production fell significantly, as Cowan argues.Footnote 107
The implication for home production output is quite different. I have estimated little or no decline in hours devoted to home production at the same time that household capital rose dramatically. Thus, one would expect that there must have been a significant rise in home production output. One mitigating factor not accounted for by my simple model, however, is the possibility of economies of scale. If there are economies of scale in household production, then the decline in the size of households over time may have led home production output to increase by less than predicted by the simple model. Measuring the rise in household production output is a subject for future research.
CONCLUSIONS
This article has developed new estimates of time spent in home production from 1900 to 1965 and then linked them to the nationally representative estimates from 1965 on. The new estimates are based on early- twentieth-century time use studies of thousands of individuals. For housewives, I estimated the correlates of housework time using detailed data from early tabulations. The estimates from these regressions were then used to produce estimates that are closer to being nationally representative. Estimates were also collected for other segments of the population, such as single employed women, married employed women, men, children, and the elderly, and were used to form aggregate estimates of time spent in home production.
Even allowing for wide bands of uncertainty, the new estimates contradict the notion that time spent in household production fell dramatically. Time spent in housework by housewives fell by only six hours per week during the period of rapid diffusion of electricity, indoor plumbing, and appliances. For all prime-age individuals, average time spent in housework changed little over the twentieth century. Thus, the most important trend is a decrease in the gender specialization of home production. Albanesi and Olivetti argue that changes in reproductive technology and the invention of infant formula could have been a key step in the decline in specialization.Footnote 108
Hours in home production per household fell by 38 percent from 1900 to 2005. However, the number of people per household also fell by 44 percent during this period. Thus, per capita time spent in home production was virtually unchanged during the twentieth century.
Appendix A: Data Sources
Variables for Constructing Nationally Representative Estimates
Estimates of population by age-sex-marital status groups, the number of children under 18, and the fraction of women with children under one and between one and five are estimated from the IPUMS version of the census (Steven Ruggles et al., Integrated Public). The variable momloc is used to link women with their own children. For annual totals, I used population totals by age from Historical Statistics Millenium Online Edition to interpolate. All estimates are for the noninstitutional population. The fraction who have completed eight grades or less of education are taken from the census from 1940 on. Based on the low high school attendance in the early years of the century, I assume that the fraction with less than or equal to an eighth grade education is 95 percent for 1900. (The fraction of 14–17 year olds enrolled in grades 9–12 was only 2.5 percent in 1870 and 8.8 percent in 1900.) I then interpolate between 1900 and 1940.
To create total hours spent in housework, I used employment-population ratios and fractions of the population by age and gender. The following is a description of the procedures used.
1. For the period from 1900 to 1940, I used decennial census estimates of population and labor force (labforce) by gender and age from IPUMs. I did not use the 1910 Census because of known overcounts of female workers. For 1942 to 1947, I used annual civilian labor force data by age and gender from the 1950 Statistical Abstract, augmented with data on the armed forces.
2. To convert decennial labor force participation rates to annual employment rates, I first interpolated the labor force participation rates between decades. I then used David L. Weir's (“Century of U.S. Unemployment”) annual unemployment estimates to convert them to employment-population ratios. To account for differences in unemployment rates across gender and age, I used the “empstat” variable from 1910 (it was not available in 1900 or 1920) to compute age-sex specific unemployment rates from Weir's aggregate. (The aggregate unemployment rate was very similar in 1900, 1910, and 1920.)
3. For 1948 on, I used the BLS series on civilian employment, augmented with armed forces data. The armed forces data are from the U.S. Census, Statistical Abstract: Historical Statistics, 1950 Statistical Abstract, and official U.S. Department of Defense data available online.
Definitions of Home Production from the AHTUS and BLS Surveys
AHTUS 1965, 1975, and 1985: I define home production as the sum of codes tmain20–tmain27, tmain30–tmain35, tmain37–tmain40, tmain95, and tmain96. Note that I exclude playing with children and purchasing own medical and personal services, since they were excluded from the early studies
BLS 2003–2005: I first extract gardening from “lawn and garden.” According to the 1998–1999 Family Interaction, Social Capital, and Trends in Time Use survey, gardening was only between 4 and 15 percent of the sum of outdoor chores and gardening, depending on the group. Thus, for 2003–2005, I assume that gardening was a certain percent of exterior cleaning, lawn and garden, and pool care. Home production is defined as the sum of 1st tier codes 2 + 3 + 4 + 7 + 8 (excluding 2nd tier codes 4 and 5) + 9 + 10 plus travel codes 17.2., 17.3, 17.7, 17.8, 17.9, 17.10, less the adjustment for gardening, pet care (2.6), and playing with children (3.1.3, 3.1.4, and 3.1.5, 4.1.3, 4.1.4, and 4.1.5). (The travel codes for the 2005 survey are 18.2, 18.3, 18.7, 18.8, 18.9, and 18.10.)
How well does the classification system of the various studies link up? To determine this, I first compared the 1965 survey to Walker and Woods' (Time Use) survey of Syracuse in 1968, which used the earlier Purnell Act methodology. Among the nonemployed housewives in the Syracuse survey, the average number of children was 2.44 and 67 percent of the housewives had children age 5 or under. Applying the coefficients for the prediction equation from the 1965 survey to these data, I predict that housework should have been 55.2 hours per week. In fact, it was 56 hours per week. Thus, the estimates are very close. The second question is how well does my classification scheme from the BLS surveys from 2003–2005 match up to the surveys from 1965–1985. Fortunately, Robinson and coauthors conducted a small, but nationally representative, survey in 1998 for individuals ages 18–64. Using the microdata from that survey and the classification system common to the earlier surveys, I find that time spent in home production rose from 21.3 hours in 1985 to 22.9 hours in 1998 to 23.5 hours in 2003. Thus, the 2003 survey seems to be consistent with the trend between 1985 and 1998 implied by the two Robinson studies.
Data for Figures 3 and 4 and the text
The number of households and population are taken from the Statistical Abstract: Historical Statistics and updated from the census.
The capital series is the quantity index for appliances from the BEA and the home production series is the average time spent in home production per capita multiplied by the noninstitutional population. Since aggregate wage data are difficult to obtain historically, I use labor productivity measured as GDP divided by total hours worked. Average wages and labor productivity should have the same trends in equilibrium. The hours worked series is the one constructed by Valerie A. Ramey and Neville Francis (“Century of Work and Leisure”) based on Kendrick data and CPS data. Finally, the price of appliances is based on the nominal and chained appliance investment series from the BEA.
Servant hours were estimated as follows. I use estimates of numbers of servants in private households from Historical Statistics series Ba1396 by decade, with missing values filled in by my calculations from IPUMS. For 1900 I use George J. Stigler's (Domestic Servants) estimate that servants worked 60 hours per week. For 1940 on, I estimated hours from IPUMs and interpolated between decades.
Appendix B: Reconciling Estimates from the Farm Surveys and the Purnell Studies
Before the Purnell Act led to the detailed time-diary studies discussed in the last section, the Department of Agriculture also conducted large-scale surveys of farmers' standards of living (Florence Ward, “Farm Woman's Problems”; and Ellis Lore Kirkpatrick, “Farmer's Standard of Living” and Farmer's Standard of Living). Ward studied 10,000 farm women and estimated an 11.3 hour work day averaged over summer and winter (excluding Sundays). Kirkpatrick studied 2,886 white farm families in 11 states and found an almost identical 11.4 hour work day (excluding Sundays). Kirkpatrick (“Farmer's Standard of Living,” pp. 47–48) describes how this estimate was obtained:
The average length of workday (excluding Sundays) for the operator and the home maker is determined from estimates of the time reported for beginning and for completing the day's work in summer and in winter. The hours from which this average was obtained start with the time of beginning work in the morning and end with the completion of chores or of household or other tasks in the evening. Time spent at meals and in reading or other rest during the day was excluded before the average was taken in each instance.
These estimates suggest that farm women worked much longer than the subsequent time-diary studies indicate. I will now demonstrate that the difference is due to definitions and estimation techniques.
The first difference is that the surveys exclude Sundays, whereas the time-diary studies included Sundays in the averages. Thus, to compare the estimates we need to convert the time diary estimates to ones that exclude Sunday. Fortunately, this is possible in Wilson's study. The calculations following table 4 of part II of Wilson's (Present Use of Time) complete report shows the following breakdown of activities:

Thus, Wilson's study indicates that time spent on homemaking and other work was 9.7 hours per day excluding Sunday. This compares to the Kirkpatrick and Ward estimates of 11.3 or 11.4 hours per day. Hence, there is still a difference of 1.6 hours per day.
Most of the rest of the discrepancy can be explained by the method used to estimate the workday in the surveys. We do not have the necessary information to convert the surveys to the more reliable time diary methods. However, we can do the reverse by applying the survey method to the time diary samples. In particular, we can measure the time between starting work and stopping work, and subtract eating meals, rest, and reading as described by Kirkpatrick (“Farmer's Standard of Living”). According to the USDA (Time Costs of Homemaking) study, for farmwives, the average time of starting work was 6:25 a.m. and the average time of stopping work was 8:00 p.m. Thus, the total time between starting work and stopping work was 13.5 hours. According to Wilson (Use of Time, tables XXXIV and XXXVI), the average (over all seven days) daily time spent in resting or sleeping during the day was 0.4 hours, in eating meals was 1.3 hours, and in reading was 0.96 hours. We would expect the average to be lower on weekdays than on Sunday, but I was not able to find estimates that distinguish by day of week. If we subtract the combined total of 2.7 hours spent in these activities from the length of the day, we would obtain an estimate of hours of work of 10.8, which is only slightly lower than Ward and Kirkpatrick's estimates. Their method of estimating work as the residual after subtracting eating, resting, and reading overestimates the amount of work done because it does not take into account time spent in personal care time as well as leisure activities, such as telephoning and informal socializing. Telephoning, correspondence, and informal socializing accounted for 1.2 hours per day (including Sunday) for farmwives (Wilson (Use of Time, table XXXVI).
To summarize, the Department of Agriculture surveys suggest a much longer workday than the time diary estimates. However, I have shown that the rough approximation method used in those surveys leads to an overestimate relative to the more reliable time diary method.
Appendix C: The Middletown Study
The Lynds' (Middletown) famous study of “Middletown” has also been used as a source for estimates of time spent in home production (e.g., Greenwood and Guillaume Vandenbroucke, “Hours Worked”). Thus, it is useful to consider how home production was estimated in this study. In 1924 the Lynds' conducted extensive interviews of women who were “business class” and “working class.” They used recall methods to ascertain the amount of time spent in housework, which they defined as “routine cleaning, preparing of food, etc., exclusive of ‘extra’ cleaning or baking or laundry work” (Lynd and Lynd, Middletown, footnote 19, p. 168). On an average weekday, of the 112 working-class wives, 7 percent spent less than four hours a day, 69 percent spent between four and seven hours per day, and 24 percent spent more than seven hours per day. Of the 40 business-class wives, 23 percent spent less than four hours per day, 55 percent spent between four and seven hours per day, and 23 percent spent more than seven hours per day. Based on these interval estimates, the average time spent on meals and routine cleaning is around six hours per day for the working-class wife and 5.5 hours for the business-class wife. This number is much higher than Wilson's (Use of Time, p. 18) estimates that farmwives spent 3.8 hours per day on these subcategories of home production.
What explains the higher estimate for Middletown than for the farmwives? The most obvious explanation is the one discussed in the text: recall methods lead to substantial overestimates of time spent relative to time diary estimates. When asked about typical weekdays, it is likely that the Middletown interviewees overestimated the time spent in preparing meals and cleaning because they did not subtract out other distractions, such as childcare and informal socializing. Fortunately, we can test this hypothesis because Theodore Caplow et al. (Middletown Families) did a follow-up study of Middletown in 1978 using the Lynds' methodology. We can thus compare their estimates to those we obtain from the 1975 time use survey, which uses the superior time diary method. In both cases, the estimates are for housework for married women with at least one child. As the table below shows, the Middletown study overestimates time spent in basic housework.
Percent of Women