Palmer amaranth, a C4 species (Ehleringer Reference Ehleringer1983), is one of the most commonly encountered, problematic, and economically damaging weeds in row-crop production systems in the southern United States (Ward et al. Reference Ward, Webster and Steckel2013; Webster Reference Webster2005). Palmer amaranth was ranked as the most troublesome weed in the United States in a 2015 survey conducted by the Weed Science Society of America (Van Wychen Reference Van Wychen2016). Interference from Palmer amaranth significantly affects growth and yield of agronomic crops. Morgan et al. (Reference Morgan, Baumann and Chandler2001) reported that season-long interference from Palmer amaranth at a density of 10 plants per 9.1 m of row reduced cotton canopy volume and lint yield by 45% and 54%, respectively. Palmer amaranth that emerged with corn reduced crop leaf area index by 9% to 45% and reduced grain yield by 11% to 91% as density increased from 0.5 to 8 plants m−2 (Massinga et al. Reference Massinga, Curie, Horak and Boyer2001). Palmer amaranth at 1 plant m−1 of row decreased peanut yield by 28% (Burke et al. Reference Burke, Schroeder, Thomas and Wilcut2007). Palmer amaranth at densities of 0.33, 3.33, and 10 plants m−1 of row reduced soybean [Glycine max (L.) Merr.] yield 17%, 64%, and 68%, respectively (Klingaman and Oliver Reference Klingaman and Oliver1994). Palmer amaranth produced greater biomass and was more competitive than common waterhemp (Amaranthus rudis Sauer) or redroot pigweed (Amaranthus retroflexus L.) in soybean [Glycine max (L.) Merr.] (Bensch et al. Reference Bensch, Horak and Peterson2003). Palmer amaranth also decreases harvest efficiency and increases foreign matter in harvested crops (Smith et al. Reference Smith, Baker and Steele2000).
Herbicide options to control Palmer amaranth are decreasing due to resistance to several herbicides. Palmer amaranth populations resistant to herbicides with different sites of action, including 5-enolpyruvylshikimate-3-phosphate synthase (EPSPS) inhibitors, mitotic inhibitors, acetolactate synthase (ALS) inhibitors, protoporphyrinogen oxidase inhibitors, 4-hydroxyphenylpyruvate dioxygenase inhibitors, and photosynthetic inhibitors, have been reported (Heap Reference Heap2016). The first report of glyphosate-resistant (GR) Palmer amaranth in the United States was from Macon County, GA, in 2005 (Culpepper et al. Reference Culpepper, Grey, Vencill, Kichler, Webster, Brown, York, Davis and Hanna2006), but as of 2016, this species had been confirmed in 27 states, including North Carolina (Heap Reference Heap2016). Palmer amaranth populations appear to have independently evolved more than one mechanism for glyphosate resistance, including amplification of the EPSPS gene (Gaines et al. Reference Gaines, Shaner, Ward, Leach and Westra2011) and reduced glyphosate translocation in GR Palmer amaranth (Nandula et al. Reference Nandula, Reddy, Kroger, Poston, Rimando, Duke, Bond and Ribeiro2012).
Palmer amaranth is dioecious and thus an obligate outcrosser, mainly through wind pollination (Franssen et al. Reference Franssen, Skinner, Al-Khatib and Horak2001). Each plant can produce up to 600,000 seeds (Keeley et al. Reference Keeley, Carter and Thullen1987). Sosnoskie et al. (Reference Sosnoskie, Webster, Kichler, MacRae, Grey and Culpepper2012) reported that the glyphosate resistance trait in Palmer amaranth could be transferred up to 300 m through pollen from GR males to glyphosate-susceptible (GS) females. These factors may play a key role in herbicide-resistance evolution in Palmer amaranth. Due to overreliance on glyphosate as a single method for weed control in GR crops and rapid widespread evolution of GR weeds, it is important to quantify the effect of glyphosate-resistance traits on plant fitness. Fitness costs associated with glyphosate resistance have been reported in rigid ryegrass (Lolium rigidum Gaudin) (Pederson et al. Reference Pederson, Neve, Andreasen and Powles2007) and tall morningglory [Ipomoea purpurea (L.) Roth] (Baucom and Mauricio Reference Baucom and Mauricio2004). However, a fitness penalty in GR Palmer amaranth with EPSPS gene amplification has not been observed (Giacomini et al. Reference Giacomini, Westra and Ward2014; Vila-Aiub et al. Reference Vila-Aiub, Goh, Gaines, Han, Busi, Yu and Powles2013). Giacomini et al. (Reference Giacomini, Westra and Ward2014) reported no significant fitness costs for Palmer amaranth plants with glyphosate resistance (EPSPS gene amplification) when measurements were taken to compare growth rate, plant height/volume ratio, biomass, photosynthetic rate, inflorescence length, pollen viability, and seed set of resistant and susceptible populations.
Differences in relative fitness between resistant and susceptible populations are usually inferred from measures of relative plant productivity or competitiveness (Warwick and Black Reference Warwick and Black1994). It is important to note that the impact of resistance on plant fitness can depend upon genotype and population; intra- and interpopulation competition; and environmental conditions such as temperature, light quality, and management practices (Warwick and Black Reference Warwick and Black1994). Previous studies to compare the biology and management of GR and GS populations of Palmer amaranth have been conducted with varying outcomes (Chandi et al. Reference Chandi, Jordan, York, Burton, Milla-Lewis, Spears, Whitaker and Wells2013a, Reference Chandi, Jordan, York, Milla-Lewis, Burton, Culpepper and Whitaker2013b; Giacomini et al. Reference Giacomini, Westra and Ward2014; Vila-Aiub et al. Reference Vila-Aiub, Goh, Gaines, Han, Busi, Yu and Powles2013). No differences were reported in growth and reproduction between GS and GR Palmer amaranth plants under greenhouse conditions (Giacomini et al. Reference Giacomini, Westra and Ward2014; Vila-Aiub et al. Reference Vila-Aiub, Goh, Gaines, Han, Busi, Yu and Powles2013). Chandi et al. (Reference Chandi, Jordan, York, Burton, Milla-Lewis, Spears, Whitaker and Wells2013a) found disadvantages of glyphosate resistance in terms of interference with corn, cotton, peanut, and snap bean (Phaseolus vulgaris L.) and response to atrazine and dicamba in a greenhouse study. In that study, 19% fresh biomass reduction of crops was reported in the presence of GR populations compared with 25% in the presence of GS populations. In another study, response of 15 North Carolina Palmer amaranth accessions, including 5 accessions each of GR, ALS inhibitor-resistant (ALSR), and ALS inhibitor-susceptible and GS (ALSS/GS), were compared under durations of drought stress (Chandi et al. Reference Chandi, Jordan, York, Milla-Lewis, Burton, Culpepper and Whitaker2013b). Results showed greater reduction in height and shoot dry biomass for the ALSS/GS accession group by drought than for the GR and ALSR accession groups. However, inferences from these studies may be limited, as the populations compared were from different geographical locations within North Carolina such that the response may be confounded with population/genotype differences. The high degree of genetic variability in the Palmer amaranth populations used in these studies was demonstrated using amplified fragment-length polymorphisms (Chandi et al. Reference Chandi, Milla-Lewis, Jordan, York, Burton, Zuleta, Whitaker and Culpepper2013c).
Variation in response to herbicides among accessions or biotypes of a weed species has been reported previously (Bond et al. Reference Bond, Oliver and Stephenson IV2006; Padzoldt et al. Reference Padzoldt, Tranel and Hager2002; Tardif and Leroux Reference Tardif and Leroux1991). Bond et al. (Reference Bond, Oliver and Stephenson IV2006) reported variation in control of Palmer amaranth accessions with the registered rate of pyrithiobac at 70 g ai ha−1 (20% to 94%), but not with glyphosate at 840 g ae ha−1 or fomesafen at 420 g ai ha−1. Differential response of common waterhemp and tall waterhemp [Amaranthus tuberculatus (Moq.) Sauer] accessions was observed for atrazine, glyphosate, and imazethapyr, but not for fomesafen (Padzoldt et al. Reference Padzoldt, Tranel and Hager2002). Differential sensitivity among red rice (Oryza sativa L.) ecotypes was reported for recommended rates of thiobencarb, fenoxaprop, and sethoxydim (Noldin et al. Reference Noldin, Chandler, Ketchersid and McCauley1999).
There are inherent difficulties in measuring the impact of resistance on plant fitness; therefore, herbicide-resistant and herbicide-susceptible individuals or genotypes must share the same genome except for the gene or genes endowing resistance. A number of techniques, including targeted mutation (Roux et al. Reference Roux, Gasquez and Reboud2004), transgenic (Purrington and Bergelson Reference Purrington and Bergelson1997), and production of segregating populations by crossing resistant and susceptible populations (Bergelson and Purrington Reference Bergelson and Purrington1996) have been proposed to minimize the differences between genotypes. Additionally, vegetative propagation (cloning) could be used to identify and isolate GR and GS individuals from a segregating Palmer amaranth population (Pederson et al. Reference Pederson, Neve, Andreasen and Powles2007).
An understanding of the basic biology of resistant phenotypes, including their growth or competitiveness relative to susceptible phenotypes collected from a segregating population, may provide information helpful for the management of resistant Palmer amaranth. Therefore, greenhouse studies were conducted to evaluate the following: level of resistance and shikimate accumulation in the GR and GS phenotypes following glyphosate application; interference from GR and GS phenotypes of Palmer amaranth on early season vegetative growth of corn, cotton, and peanut; effect of various durations of imposed drought stress on GR and GS phenotypes; and response of GR and GS phenotypes to atrazine, dicamba, fomesafen, glufosinate, glyphosate, paraquat, tembotrione, and thifensulfuron applied POST.
Materials and Methods
A segregating population of Palmer amaranth collected from Wayne county in North Carolina during 2010 was used as a plant source for both GR and GS traits. An assumption was made that outcrossing between GR and GS individuals prior to field collection would ensure homogeneity of fitness affecting traits between the GR and GS phenotypes. Collected Palmer amaranth seeds were planted in plastic pots (12-cm diameter by 10-cm deep) in a greenhouse. When plants were approximately 40- to 50-cm tall, clones were made from individual parent plants using vegetative cuttings. Half of the clones from individual parent plant were treated with 840 g ha−1 glyphosate at the 5- to 7-leaf stage. At 21 d after treatment (DAT), clones were characterized as GS (no survivors) or GR (plants surviving glyphosate at 840 g ha−1). Approximately 20 of each susceptible or resistant clone not exposed to glyphosate were grown to maturity in separate greenhouses, and seed from those plants was collected. To confirm the heritability of GR and GS traits and frequency of phenotypic resistance, plant survival data were collected from a separate experiment (see “Experiment 4” in this section). The GR and GS Palmer amaranth phenotype seedlings treated with glyphosate 710 g ha−1 were scored as dead (GS) or alive (GR) at 21 DAT. It was found that 91.6% (±3.5) and 2.08% (±2.0) of the GR and GS individuals, respectively, were phenotypically resistant. A complete segregation into GR and GS phenotypes could not be expected, and this material was considered suitable for further experiments. Amplification of the EPSPS gene as a mechanism of glyphosate resistance has been reported in the Palmer amaranth population used in this study (Chandi et al. Reference Chandi, Milla-Lewis, Giacomini, Westra, Preston, Jordan, York, Burton and Whitaker2012).
All experiments were conducted in a greenhouse maintained at 30±5 C with natural lighting supplemented for 14 h by metal-halide lamps (Hubbell Lighting, Greenville, SC) delivering 400 μmol m−2 s−1 photosynthetic photon flux density. Plants were grown in round plastic pots (12-cm diameter by 10-cm deep) using a commercial potting mix (Fafard® 4P potting mix, Conrad Fafard, Agawam, MA) and irrigated four times daily with an automated irrigation system to maintain optimum soil moisture until special conditions mentioned for each of the four experiments (see following sections) were implemented. Plants were fertilized with 25 ml pot−1 of a 4.6 g L−1 fertilizer solution (Scotts® Starter Fertilizer, Scotts Company, Marysville, OH) as needed to maintain good growth. All experiments were conducted twice.
Experiment 1. Glyphosate Dose–Response and Shikimate Assay
Seedlings of both the GR and GS Palmer amaranth phenotypes (1 plant pot−1) were treated with glyphosate at 0, 50, 100, 500, 1,000, and 5,000 g ha−1 when plants were 8- to 10-cm tall. Herbicides were applied using a CO2-pressurized backpack sprayer equipped with four 11002 AIXR nozzles (TeeJet® Technologies, Wheaton, IL) spaced 50-cm apart and calibrated to deliver 140 L ha−1 of spray solution at 207 kPa. The experimental design was a randomized complete block with eight replications and blocking against plant size.
Shikimate content of the plants was determined 5 d after treatment (DAT) by collecting three 4-mm leaf disks from the youngest fully expanded leaf using a leaf-disk puncher. Leaf disks were frozen and stored in 12-ml glass vials prior to analysis. Shikimate content was measured spectrophotometrically using the method of Henry et al. (Reference Henry, Koger and Shaner2005). Three hundred microliters of 0.25 M HCl were added to each vial. The vials were shaken to ensure all leaf disks were submerged in acid and were incubated at 25 C for 2 h. One hundred microliters of a 1:1 (v/v) solution of 0.25% (w/v) periodic acid and 0.25% (w/v) m-periodate were added to each well of a 96-well microtiter plate. A 25-µl aliquot of 0.25 M HCl was added to each of 3 wells vial−1 so that three replicate extract samples were assayed per vial. Plates were then incubated at 25 C for 1 h. The reaction was stopped by adding 100 ml of 0.6 M sodium hydroxide/0.22 M sodium sulfite (1:1, v/v) to each well. The optical density (OD) from each well was measured at 380 nm using a microtiter plate spectrophotometer (Synergy H1 Hybrid Plate Reader, Biotek, 100 Tigan Street, Winooski, VT). Background OD was determined from wells containing the extracts from nontreated control disks and was subtracted from each of the samples treated with glyphosate. A shikimate standard curve was acquired by adding known amounts of shikimate to extracts from control leaf disks, and results are reported as micrograms shikimate per milliliter.
At 21 DAT, Palmer amaranth plants were severed at the soil surface and oven-dried at 55 C for 3 d, and then shoot dry biomass was measured. Percent reduction in shoot dry biomass was calculated relative to the nontreated control for each Palmer amaranth phenotype. Due to lack of treatment by run interaction, data were pooled over the two runs of the experiment.
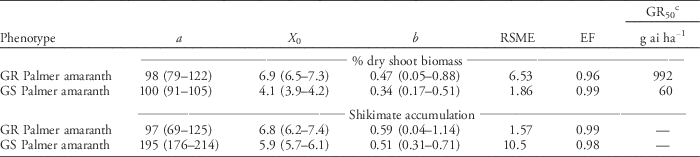
A nonlinear log-logistic model was best fit to relate plant response (shikimate accumulation or percent reduction of shoot dry biomass) to glyphosate rates, using PROC NLIN in SAS (v. 9.3, SAS Institute, Cary, NC) (Harring et al. Reference Harring, Streibig and Husted1998; Nandula et al. Reference Nandula, Reddy, Kroger, Poston, Rimando, Duke, Bond and Ribeiro2012). Plots were generated using Sigma-Plot (SigmaPlot v. 12.0, Systat Software, San Jose, CA).
 $$Y\,{\equals}\,a\,/\,\big( {1{\plus}e^{{{\minus}\left\{ {\left[ {{\rm log}\left( X \right){\minus}{\rm log}\left( {X_0} \right)} \right]\,/\,{b}} \right\}}} } \big)$$
In this model, Y is either shikimate accumulation or percent reduction of shoot dry biomass, X is glyphosate rate, a is the difference of the upper and lower response limits (asymptotes), X 0 is the glyphosate rate giving 50% response, and b is the slope of the curve around X 0. The regression parameters from the response curves of the Palmer amaranth phenotypes were computed and compared using their 95% confidence limits (Riar et al. Reference Riar, Norsworthy, Bond, Bararpour, Wilson and Scott2012). Root mean square error (RMSE) and modeling efficiency coefficient were used to determine the goodness of fit for the model (Table 1) (Werle et al. Reference Werle, Sandell, Buhler, Hartzler and Lindquist2014).
Parameter estimates and the goodness of fit (RMSE and EF) of the three-parameter log-logistic model fit to Palmer amaranth phenotypes for percent dry shoot biomass and shikimate accumulation after glyphosate application (with 95% confidence interval in parentheses) (Experiment 1).Footnote a, Footnote b

a Abbreviations: GR, glyphosate-resistant; GS, glyphosate-susceptible; EF, modeling efficiency coefficient; RMSE, root mean square error.
b
Three-parameter log-logistic model:
 $Y\,{\equals}\,a\,/\,( {1{\plus}e^{{{\minus}\left\{ {\left[ {{\rm log}\left( X \right){\minus}{\rm log}\left( {X_0} \right)} \right]\,/\,{b}} \right\}}} } )$
, where X is glyphosate rate, a is the difference of the upper and lower response limits (asymptotes), X
0 is the glyphosate rate giving 50% response, and b is the slope of the curve around X
0.
c GR50 glyphosate rate g ai ha−1 (back transformed) required for 50% reduction in shoot dry biomass.
Experiment 2. Interference of GR and GS Palmer Amaranth Phenotypes with Selected Crops
Four seeds of the corn hybrid ‘31G71’ (DuPont Pioneer®, Johnston, IA), cotton cultivar ‘DP 424 BGII/RR’ (Monsanto Company, St Louis, MO), or peanut cultivar ‘Bailey’ (Isleib et al. Reference Isleib, Milla-Lewis, Pattee, Copeland, Zuleta, Shew, Hollowell, Sanders, Dean, Hendrix, Balota and Chapin2011) and 8 to 10 Palmer amaranth seeds were planted per pot. Seedlings were thinned to one crop and one Palmer amaranth plant per pot 10 d after planting (DAP). Pots containing a single crop or Palmer amaranth plant were used as controls. The experimental design was a randomized complete block with treatments replicated 10 times.
Height of Palmer amaranth and crops was determined at 5-d intervals from 15 to 45 DAP. Plant height was measured from the soil surface to the apical meristem for cotton, peanut, and Palmer amaranth. In case of corn, height was measured from the soil surface to the tip of the uppermost fully expanded leaf. At 45 DAP, Palmer amaranth and crop plants were severed at the soil surface and shoots were oven-dried at 55 C for 3 d to measure shoot dry biomass. Percent reductions in height and shoot dry biomass were calculated with respect to the controls of either crop or Palmer amaranth without interference.
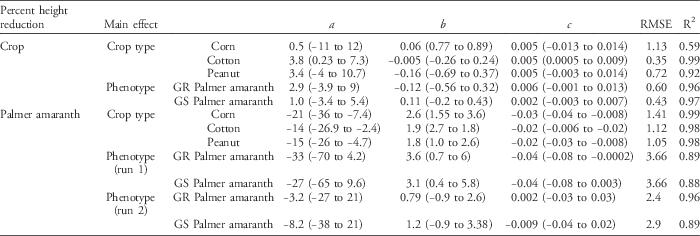
Data were subjected to ANOVA considering the factorial treatment structure of three levels of crop (corn, cotton, and peanut) and two levels of Palmer amaranth phenotypes (GR and GS phenotypes). Means of significant main effects and interactions were separated using Fisher’s protected LSD test at the significance level of 0.05. Percent reduction in height of crops and Palmer amaranth phenotypes was regressed against days after planting using PROC REG in SAS to fit quadratic equations (Chandi et al. Reference Chandi, Jordan, York, Burton, Milla-Lewis, Spears, Whitaker and Wells2013a, Reference Chandi, Jordan, York, Milla-Lewis, Burton, Culpepper and Whitaker2013b; Ma et al. Reference Ma, Wu, Jiang, Ma and Ma2015). RMSE and R2 were used to determine the goodness of fit for the model. Parameter estimates of GR and GS or different crop models were compared using their 95% confidence limits (Table 2). Plots were generated using Sigma-Plot.
 $$Y\,{\equals}\,a{\plus}bD{\plus}cD^{2} $$
where a, b, and c are constants, D is days after planting, and Y is percent reduction in height.
Parameter estimates for the quadratic model describing the effect of days after planting on percent height reduction in crop and Palmer amaranth as influenced by crop type or Palmer amaranth phenotype (with 95% confidence interval in parentheses) (Experiment 2).Footnote a, Footnote b

a Abbreviations: GR, glyphosate-resistant Palmer amaranth; GS, glyphosate-susceptible Palmer amaranth; RMSE, root mean square error.
b Quadratic model: Y=a+bD+cD 2, where a, b, and c are constants, D is days after planting, and Y is percent reduction in height.
Experiment 3. Recovery of GR and GS Palmer Amaranth Phenotypes from Drought Stress
The experiment was conducted using a factorial arrangement of plant type (cotton alone, GR Palmer amaranth alone, GS Palmer amaranth alone, cotton plus GR Palmer amaranth, and cotton plus GS Palmer amaranth) and duration of drought stress (0, 4, 6, 8, 10, and 12 d) in a randomized complete block design with treatments replicated eight times. Each pot contained a similar biomass (175 to 180 g) of potting mix. Four crop seeds and 8 to 10 Palmer amaranth seeds were planted in each pot, and seedlings were thinned to one cotton and one Palmer amaranth plant per pot 10 DAP where both species were present or a single cotton or Palmer amaranth plant per pot where species were grown individually. Before the initiation of drought stress treatments, pots were watered to field capacity on a daily basis.
Beginning at 20 DAP, water was withheld to induce drought stress for 0, 4, 6, 8, 10, or 12 d. Soil was brought back to full saturation after completion of each stress period and was thereafter maintained at adequate moisture to ensure optimum growth for the remainder of the experiment. Plant height and shoot biomass were recorded at 38 DAP, which also represented 6 d after recovery from the previous drought treatment. Percent reductions in height and shoot dry biomass were determined relative to the control (0-d water stress) for each plant type.
Data were subjected to ANOVA using SAS appropriate for the plant type by duration of drought stress factorial treatment arrangement. For percent reduction in cotton plant height and shoot dry biomass, the plant type had three levels (cotton grown alone, cotton grown with GR Palmer amaranth, and cotton grown with GS Palmer amaranth). However, for percent reduction in Palmer amaranth plant height and shoot dry biomass, the plant type had four levels (GR Palmer amaranth grown alone, GS Palmer amaranth grown alone, cotton grown with GR Palmer amaranth, and cotton grown with GS Palmer amaranth). Means of significant main effects and interactions were separated using Fisher’s protected LSD test at the significance level of 0.05. Percent reduction in cotton height and shoot dry biomass and Palmer amaranth shoot dry biomass relationships with duration of drought stress were established from the best fits of the experimental data to appropriate models using PROC REG in SAS (Chandi et al. Reference Chandi, Jordan, York, Burton, Milla-Lewis, Spears, Whitaker and Wells2013a, Reference Chandi, Jordan, York, Milla-Lewis, Burton, Culpepper and Whitaker2013b; Ma et al. Reference Ma, Wu, Jiang, Ma and Ma2015). Plots were generated using Sigma-Plot.
A linear equation was fit to percent reduction in cotton height and shoot dry biomass over the duration of drought stress:
 $$Y\,{\equals}\,a{\plus}bx$$
where Y is percent reduction in height or shoot dry biomass, a and b are constants, and x is duration of drought stress in days.
A quadratic equation was fit to percent reduction Palmer amaranth dry biomass over the duration of drought stress:
 $$Y\,{\equals}\,a{\plus}bx{\plus}cx^{2} $$
where Y is percent reduction in shoot dry biomass, a, b, and c are constants, and x is duration of drought stress in days.
Experiment 4. Efficacy of Herbicides on GR and GS Palmer Amaranth Phenotypes
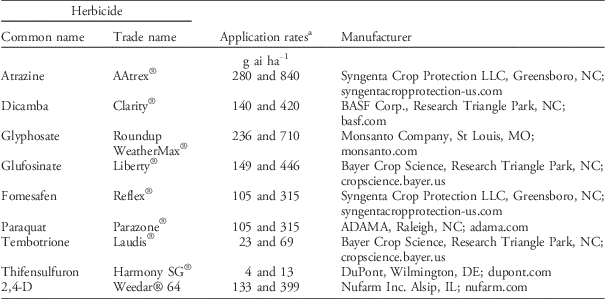
Seedlings of both GR and GS Palmer amaranth phenotypes were grown separately. Seedlings similar in height and number of leaves were thinned to four per pot at 10 DAP. Herbicides (mentioned in Table 3) were applied when Palmer amaranth was 8- to 10-cm tall with 3 to 5 leaves. Herbicide application rates reflect recommended field use rate for each herbicide by the manufacturer (hereafter “high rate”) and a rate lower than the field rate (hereafter “low rate”) because of high sensitivity of plants in the greenhouse. A nonionic surfactant (Induce® nonionic surfactant, Helena Chemical Company, Collierville, TN) was included with fomesafen, paraquat, and thifensulfuron, whereas crop oil concentrate (Agri-Dex® spray adjuvant, Helena Chemical Company, Collierville, TN) was included with atrazine, and a mixture of crop oil concentrate and 30% urea ammonia nitrate liquid fertilizer was included with tembotrione. No adjuvant was included with 2,4-D, dicamba, glyphosate, and glufosinate. A nontreated control was included for comparison. Herbicides were applied using a spray chamber equipped with a single 8002 EVS nozzle (TeeJet® Technologies, Wheaton, IL) delivering 140 L ha−1 at 207 kPa. Following herbicide application, plants were returned to the greenhouse, where irrigation was withheld for 24 h. The experimental design was a randomized complete block with six replications and blocking against plant size. At 21 DAT, visual estimates of Palmer amaranth control were made on a scale of 0 (no control) to 100% (complete control) and shoot dry biomass was determined. Percent reduction in shoot dry biomass was calculated relative to the nontreated control for each Palmer amaranth phenotype. The effects of the herbicides, herbicide rate, Palmer amaranth phenotype, and their interactions were determined using analysis of variance. Means of significant main effects and interactions were separated using the Fisher’s protected LSD test at the significance level of 0.05.
Herbicides used in greenhouse Experiment 4.

a Herbicide application rates reflect the recommended field use rate for each herbicide according to the manufacturer (high rate) and a rate lower than the field rate (low rate).
Results and Discussion
Experiment 1. Glyphosate Dose–Response and Shikimate Assay
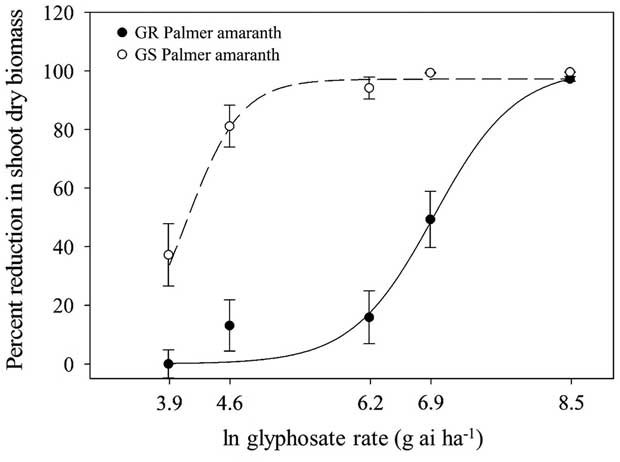
Interactions of phenotype by glyphosate rate were noted for Palmer amaranth shoot dry biomass reduction (P<0.0001) and shikimate concentration (P<0.0001). The GR50 (glyphosate rate providing 50% reduction in shoot dry biomass) for shoot dry biomass reduction was 17-fold greater for the GR phenotype (992 g ha−1) than the GS phenotype (60 g ha−1) (Figure 1; Table 1). Varying levels of glyphosate resistance among Palmer amaranth phenotypes have been reported, depending upon location and response variables. In Arkansas, a GR Palmer amaranth population had between 79- and 115-fold resistance based upon the amount of glyphosate needed to cause 50% mortality (Norsworthy et al. Reference Norsworthy, Griffith, Scott, Smith and Oliver2008). Whitaker et al. (Reference Whitaker, Burton, York, Jordan and Chandi2013) reported an 18-fold level of glyphosate resistance in a Palmer amaranth population in North Carolina based on shoot fresh biomass reduction. Sosnoskie et al. (Reference Sosnoskie, Kichler, Wallace and Culpepper2011) reported a 14-fold level of glyphosate resistance based on shoot fresh biomass reduction in Georgia.
Percent shoot dry biomass reduction of glyphosate-resistant (GR) and glyphosate-susceptible (GS) Palmer amaranth phenotypes 21 d after glyphosate application (Experiment 1). Data are pooled over experiment runs. Points are means±SE.

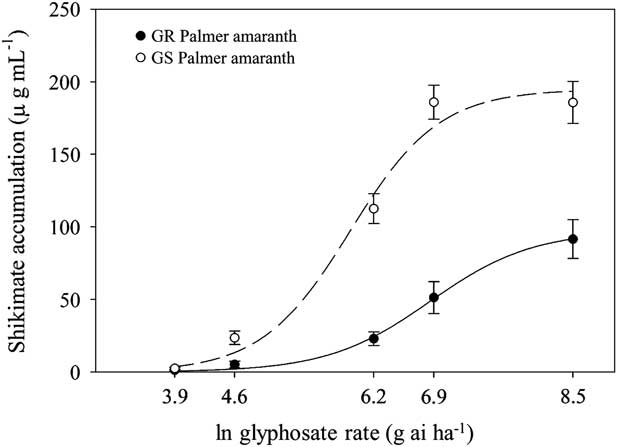
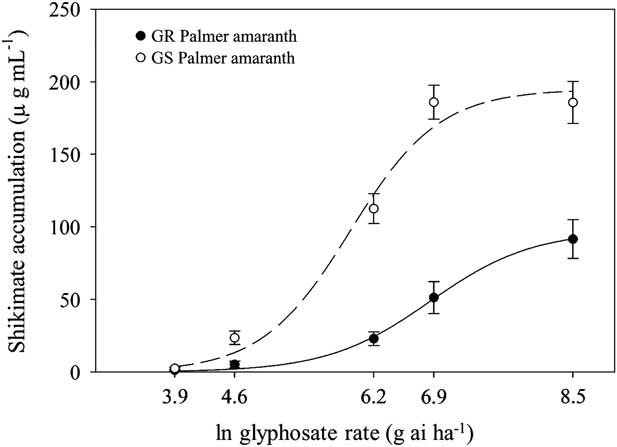
Accumulation of shikimate in glyphosate-treated plants indicates that the herbicide is affecting the EPSPS enzyme (Mueller et al. Reference Mueller, Massey, Hayes, Main and Stewart2003). Shikimate accumulation increased in both phenotypes as glyphosate concentration increased. Regardless of the glyphosate rate, shikimate accumulation in the GS phenotype was greater than in the GR phenotype (Figure 2). Shikimate accumulation ranged from 2.5 to 186 (GS) and 1.3 to 92 (GR) in respect to Palmer amaranth phenotypes at 5 DAT with glyphosate applied from 50 to 5,000 g ha−1. Similar results of relatively greater levels of shikimate accumulation in susceptible Palmer amaranth populations compared with resistant populations have been reported previously (Mohseni-Moghadam et al. Reference Mohseni-Moghadam, Schroeder and Ashigh2013; Nandula et al. Reference Nandula, Reddy, Kroger, Poston, Rimando, Duke, Bond and Ribeiro2012; Whitaker et al. Reference Whitaker, Burton, York, Jordan and Chandi2013). Glyphosate resistance in Palmer amaranth populations from Georgia and North Carolina has been attributed to overexpression of the EPSPS enzyme (Chandi et al. Reference Chandi, Milla-Lewis, Giacomini, Westra, Preston, Jordan, York, Burton and Whitaker2012; Gaines et al. Reference Gaines, Shaner, Ward, Leach and Westra2011). Shikimate accumulation in resistant plants has been reported to be negatively correlated with EPSPS copy numbers (Gaines et al. Reference Gaines, Shaner, Ward, Leach and Westra2011; Mohseni-Moghadam et al. Reference Mohseni-Moghadam, Schroeder and Ashigh2013). Chandi et al (Reference Chandi, Milla-Lewis, Giacomini, Westra, Preston, Jordan, York, Burton and Whitaker2012) reported that the Palmer amaranth population from North Carolina used in this study is resistant to glyphosate via EPSPS gene amplification. Therefore, the differences in shikimate accumulation between GR and GS were expected, and increased EPSPS copies in the GR phenotype were sufficient to maintain the shikimate pathway in the presence of glyphosate.
Shikimate accumulation by glyphosate-resistant (GR) and glyphosate-susceptible (GS) Palmer amaranth phenotypes 5 d after glyphosate application (Experiment 1). Data are pooled over experiment runs. Points are means±SE.
Experiment 2. Interference of GR and GS Palmer Amaranth Phenotypes with Crops
Heights and shoot dry biomass of the two Palmer amaranth phenotypes grown in the absence of a crop were similar. Heights of GR and GS phenotypes at 45 DAP in the absence of a crop were 60 and 62 cm, respectively, whereas the dry shoot biomass measures for GR and GS phenotypes were 4.2 and 4.3 g plant−1, respectively (unpublished data). In the absence of Palmer amaranth, heights of corn, cotton, and peanut were 84, 45, and 34 cm, respectively, and dry shoot biomass values were 12.1, 5.6, and 6.2 g plant−1, respectively (unpublished data).
Effect of Palmer Amaranth on Crops
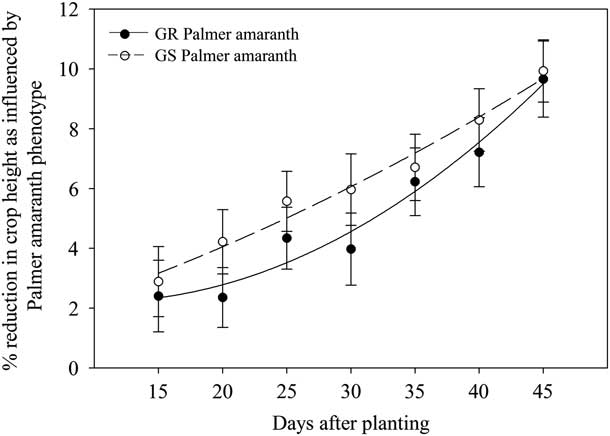
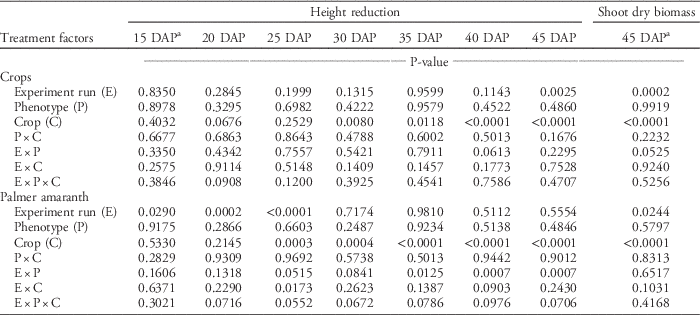
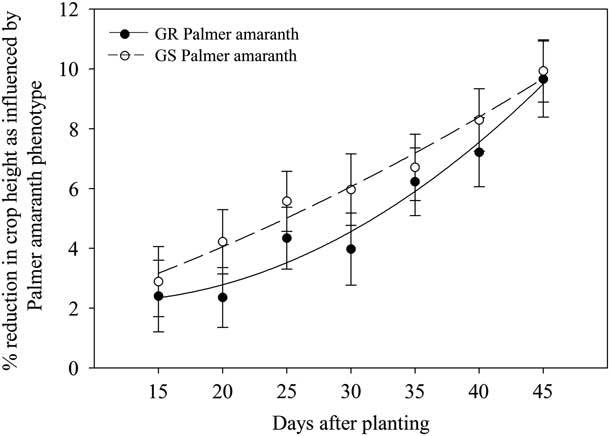
Interactions for treatment by experiment run were not significant for percent reduction of crop height or shoot dry biomass (Table 4); data were therefore pooled across the two runs. The Palmer amaranth phenotypes were similarly competitive with the crops as indicated by lack of a significant main effect of phenotype for either crop height or shoot dry biomass reduction. Averaged over crops, no differences were noted in crop height reduction as influenced by the GR and GS Palmer amaranth (Figure 3; Table 2). Overall, the GR Palmer amaranth reduced crop shoot dry biomass by 21% compared with 20% reduction by GS Palmer amaranth (unpublished data).
Percent reduction in crop height at 15, 20, 25, 30, 35, 40, and 45 d after planting, as influenced by glyphosate-resistant (GR) and glyphosate-susceptible (GS) Palmer amaranth phenotypes (Experiment 2). Data are pooled over experiment runs. Points are means±SE.
P-values for percent reduction in height and shoot dry biomass of crops and Palmer amaranth phenotypes (Experiment 2).

a DAP, days after planting.
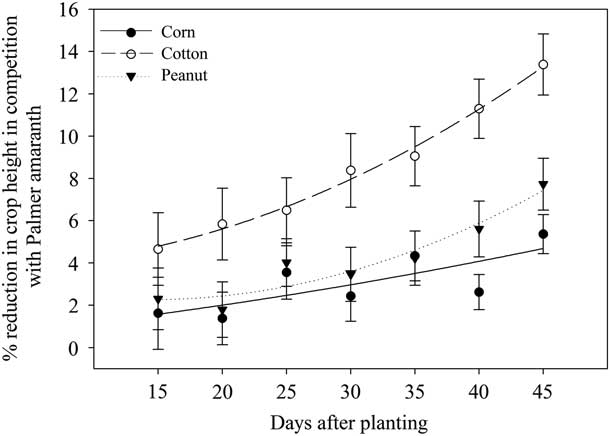
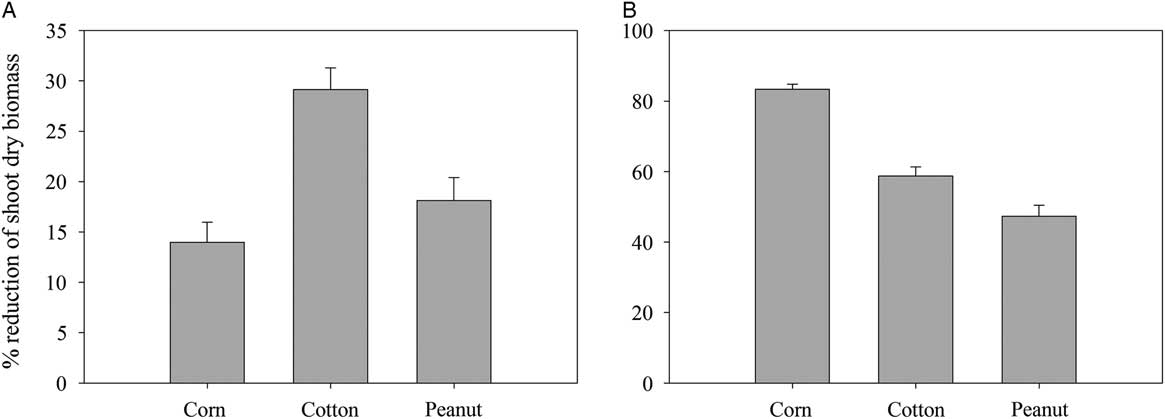
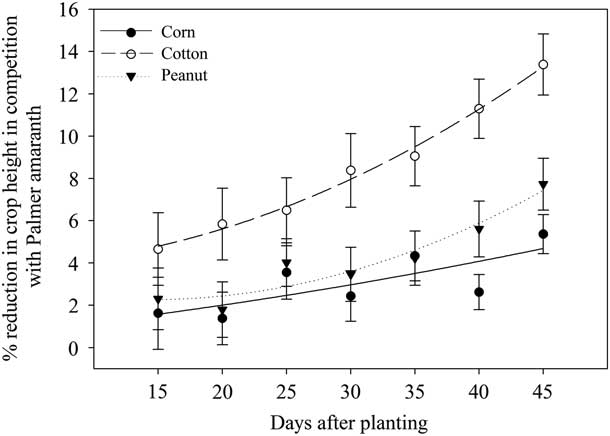
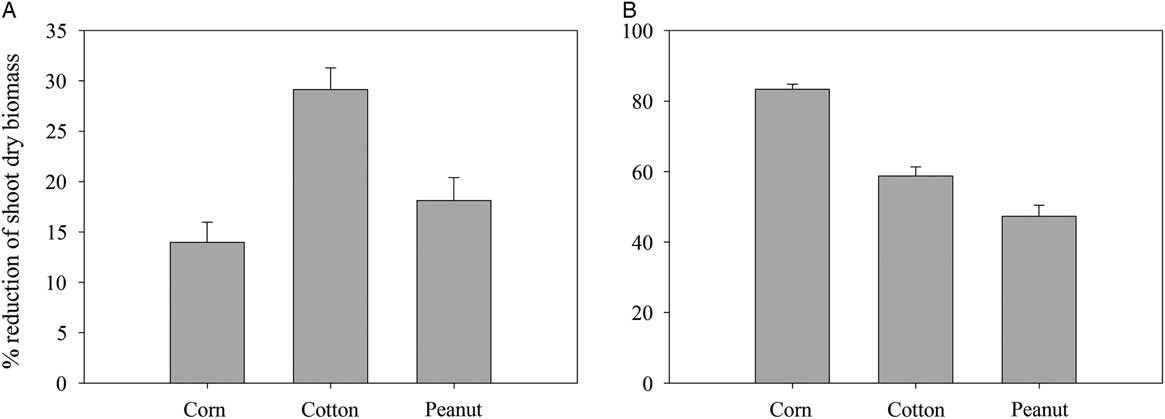
The impact of Palmer amaranth interference varied among the crops. Averaged over Palmer amaranth phenotypes, crop height reduction due to Palmer amaranth interference was greatest for cotton and least for corn (Figure 4; Table 2). At 45 DAP, Palmer amaranth reduced corn, peanut, and cotton height by 4.6%, 6.3%, and 13.6%, respectively. Shoot dry biomass reduction in corn and peanut (14% to 18%) was less compared with cotton (29%) (Figure 5A). This difference in crop response was expected due to the crops’ inherent variation in growth and ability to compete with weeds (Burke et al. Reference Burke, Schroeder, Thomas and Wilcut2007; Massinga et al. Reference Massinga, Curie, Horak and Boyer2001; Morgan et al. Reference Morgan, Baumann and Chandler2001). Using WebHADSS, yield loss of corn in the presence of season-long interference from Palmer amaranth at 5 plants per 10 m2 was estimated to be 4%, compared with 20% for peanut and 40% for cotton at the same population density (WebHADSS 2004).
Percent reduction in crop height at 15, 20, 25, 30, 35, 40, and 45 d after planting, in competition with Palmer amaranth (Experiment 2). Data are pooled over experiment runs. Points are means±SE.
Percent shoot dry biomass reduction of (A) crops due to Palmer amaranth interference and (B) Palmer amaranth due to crop interference. Data pooled over experiment runs and Palmer amaranth phenotypes (Experiment 2).
Effect of Crops on Palmer Amaranth
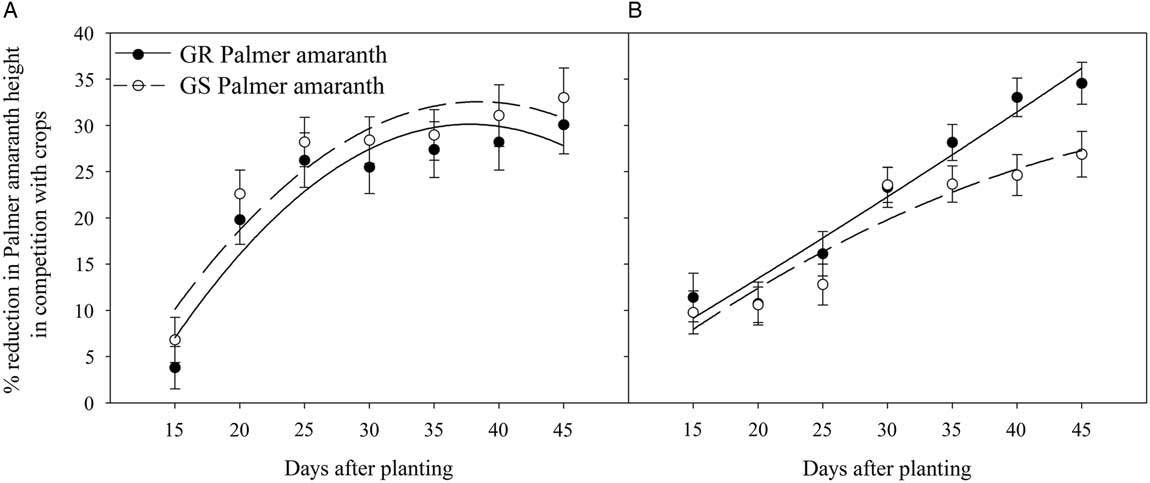
The experiment run by crop by phenotype, experiment run by crop, and phenotype by crop interactions were not significant in most cases for reduction of Palmer amaranth height or shoot dry biomass (Table 4). Palmer amaranth phenotypes generally responded similarly to crop interference. The main effect of phenotype was not significant for Palmer amaranth height reduction or shoot dry biomass reduction, although there was a phenotype by experiment run interaction for Palmer amaranth height reduction at 35, 40, and 45 DAP. This interaction occurred because height reductions of Palmer amaranth at 35, 40, and 45 DAP were similar with the two phenotypes in run 1, while the GR phenotype experienced a greater height reduction at these stages in run 2 (Figure 6; Table 2). The possible reason for difference in height reduction between the GR and GS phenotypes in both runs of this study is not clear. There was no difference between GR (63%) and GS (65%) Palmer amaranth biotypes in terms of shoot dry biomass reduction due to crop interference (unpublished data).
Percent height reduction in glyphosate-resistant (GR) and glyphosate-susceptible (GS) Palmer amaranth phenotypes at 15, 20, 25, 30, 35, 40, and 45 d after planting in competition with crops (A) run 1 and (B) run 2 (Experiment 2). Points are means±SE.

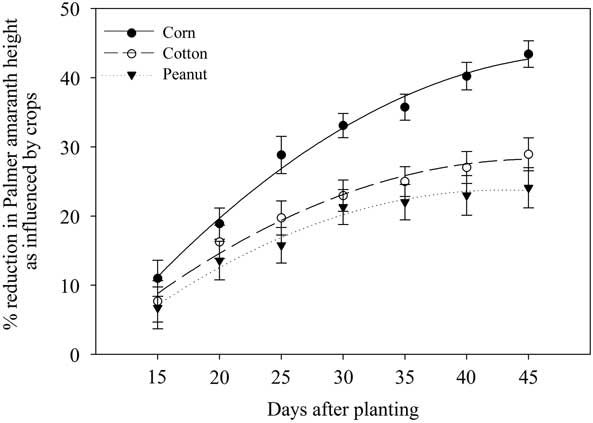
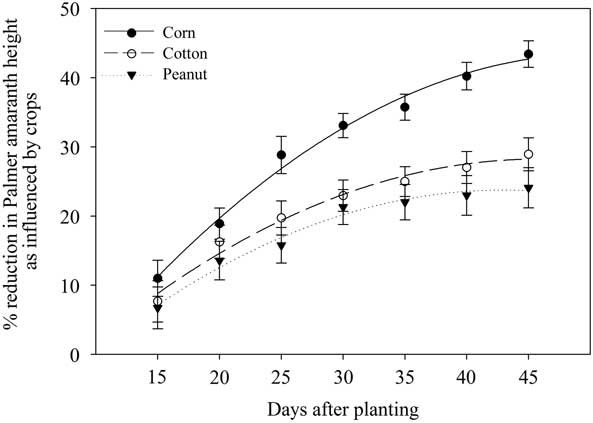
The main effect of crop was significant for height reduction at 25 through 45 DAP and for shoot dry biomass reduction. Peanut and cotton interference caused a similar reduction in Palmer amaranth height (23% and 30%, respectively, at 45 DAP) whereas corn interference reduced Palmer amaranth height 45% at 45 DAP (Figure 7). Corn interference reduced Palmer amaranth shoot dry biomass by 82% compared with 60% and 50% reduction by cotton and peanut, respectively (Figure 5B).
Percent height reduction of Palmer amaranth at 15, 20, 25, 30, 35, 40, and 45 DAP as influenced by crop interference. Data are pooled over experiment runs (Experiment 2). Points are means±SE.
Experiment 3. Recovery of GR and GS Palmer Amaranth Phenotypes from Drought Stress
When grown alone under no drought stress, height and shoot dry biomass of the two Palmer amaranth phenotypes were similar. Height of GR and GS phenotypes at 38 DAP under no drought stress growing alone were 34 and 36 cm, respectively, while dry biomass of GR and GS phenotypes were 2.8 and 2.4 g plant−1, respectively. Cotton had only minor effects on the height of Palmer amaranth phenotypes (4% to 7% reduction) but reduced shoot dry biomass 30% to 36% under no drought stress (unpublished data). The two Palmer amaranth phenotypes similarly reduced cotton height (9% to 10%) and shoot dry biomass (21% to 26%) under no drought stress (unpublished data).
Effect of Drought Stress on Palmer Amaranth Interference with Cotton
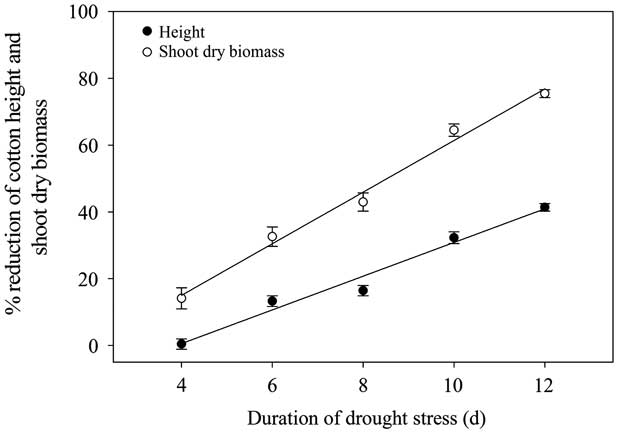
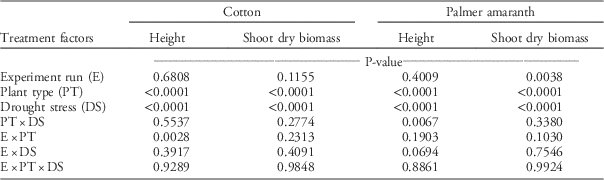
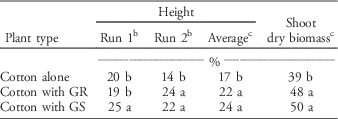
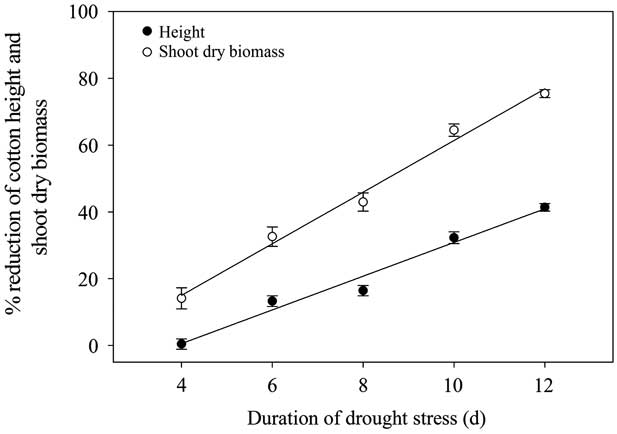
Interactions of plant type by drought stress, run by drought stress, and run by plant type by drought stress were not significant for cotton height or shoot dry biomass reductions (Table 5). The main effect of drought stress was significant for both cotton height and shoot dry biomass reduction. Cotton height and shoot dry biomass reductions increased as duration of drought increased, with a greater impact on dry biomass than height (Figure 8). Drought stress for 12 d reduced cotton height and shoot dry biomass by 41% and 77%, respectively. The main effect of plant type was significant for cotton height and shoot dry biomass reductions, and there was a run by plant type interaction for cotton height reduction (Table 5). This interaction occurred because both Palmer amaranth phenotypes, averaged over drought stress, reduced cotton height in run 2, whereas only the GS phenotype reduced cotton height in run 1 (Table 6). However, when averaged over runs and drought stress, both phenotypes reduced cotton height and shoot dry biomass relative to cotton grown alone.
Percent reduction in cotton plant height and shoot dry biomass as affected by duration of drought stress (Experiment 3). Data are pooled over experiment runs and plant types (cotton alone and cotton with glyphosate-resistant or glyphosate-susceptible Palmer amaranth). Regression equations are as follows: shoot dry biomass, Y=−15.9+7.7x, R2=0.98; and height, Y=−19.6+5.05x, R2=0.97. Points are means±SE.
P-values for percent reduction in height and shoot dry biomass of cotton and Palmer amaranth at 38 days after planting (Experiment 3).

Percent reduction in height and shoot dry biomass of cotton when grown alone and with glyphosate-resistant (GR) or glyphosate-susceptible (GS) Palmer amaranth phenotypes (Experiment 3).Footnote a

a Means within a column followed by the same letter are not different according to Fisher’s protected LSD (α = 0.05).
b Data are pooled over drought stress duration.
c Data are pooled over drought stress duration and experiment runs.
Effect of Drought Stress on Cotton Interference with Palmer Amaranth
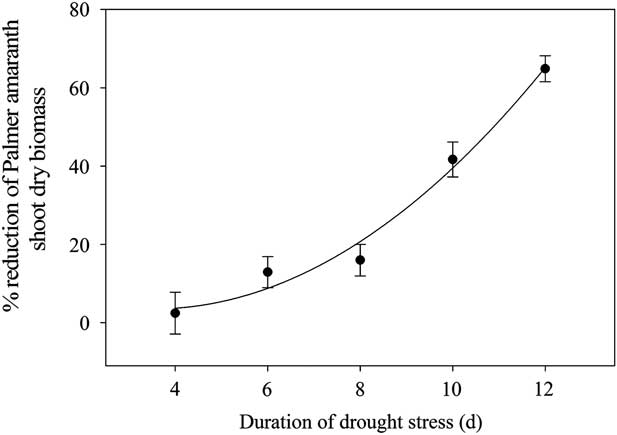
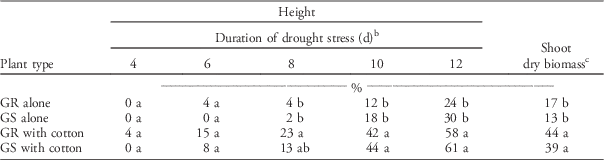
The treatment by experiment run interactions were not significant for Palmer amaranth shoot dry biomass and height reduction (Table 5). The main effects of drought stress and plant type were significant for Palmer amaranth shoot dry biomass reduction. Shoot dry biomass reduction of both phenotypes increased as duration of drought stress increased, with 12 d of drought stress reducing shoot dry biomass by 65% (Figure 9). Averaged over durations, drought stress reduced shoot dry biomass of both phenotypes by 13% to 17% in the absence of cotton interference (Table 7), whereas cotton interference increased Palmer amaranth shoot dry biomass reduction 2.5- to 3-fold.
Percent reduction in glyphosate-resistant (GR) and glyphosate-susceptible (GS) Palmer amaranth shoot dry biomass as affected by duration of drought stress (Experiment 3). Data are pooled over experiment runs and plant types (GR and GS Palmer amaranth alone, GR and GS Palmer amaranth with cotton). Regression equations are as follows: shoot dry biomass, Y=14.2−6.04x+0.86x 2, R2=0.98. Points are means±SE.

Percent reduction in height and shoot dry biomass of glyphosate-resistant (GR) and glyphosate-susceptible (GS) Palmer amaranth when grown alone and with cotton (Experiment 3).Footnote a

a Means within a column followed by the same letter are not different according to Fisher’s protected LSD (α=0.05).
b Data are pooled over experiment runs.
c Data are pooled over duration of drought stress and experiment runs.
There was a significant plant type by drought stress interaction for Palmer amaranth height reduction (Table 5). The interaction occurred because Palmer amaranth height reduction was similar with and without cotton with 4 and 6 d of drought stress, whereas interference from cotton increased Palmer amaranth height response with drought stress durations of 8 d or longer (Table 7).
Lack of differences in cotton shoot dry biomass reduction in the presence of either of the two Palmer amaranth phenotypes and lack of differences in shoot dry biomass or height reductions between GR and GS Palmer amaranth grown either alone or with cotton indicate the behavior of GR and GS Palmer amaranth phenotypes selected from the same population was similar when exposed to drought stress. In contrast, Chandi et al. (Reference Chandi, Jordan, York, Burton, Milla-Lewis, Spears, Whitaker and Wells2013a) demonstrated a competitive advantage for GR Palmer amaranth populations under limited moisture availability when GR and GS populations were collected from different geographical regions of North Carolina.
Experiment 4. Efficacy of Herbicides on GR and GS Palmer Amaranth Phenotypes
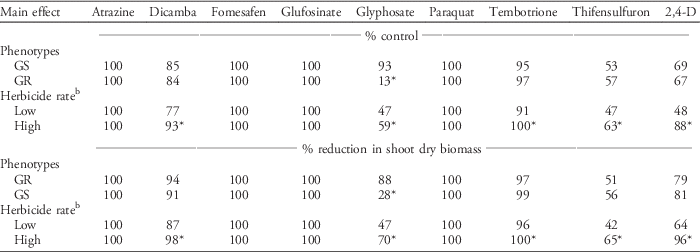
The three-way interaction among herbicide, herbicide rate and phenotype was significant for both Palmer amaranth control and shoot dry biomass reduction; data were therefore analyzed for each herbicide. The interaction of phenotype by herbicide rate for Palmer amaranth control and shoot dry biomass reduction was not significant for any herbicide evaluated (P=0.1011 to 0.9806). The two phenotypes responded similarly to all herbicides except glyphosate. Averaged over application rates, glyphosate controlled the GS phenotype by 93% and reduced shoot dry biomass by 88% compared with nontreated plants (Table 8). In contrast, glyphosate controlled the GR phenotype by only 13% and reduced shoot dry biomass by only 28%. Greater control and shoot dry biomass reduction were noted with the higher rate of glyphosate.
Percent visual control and reduction in shoot dry biomass of glyphosate-resistant (GR) and glyphosate-susceptible (GS) Palmer amaranth as influenced by phenotypes and POST herbicide rates 21 d after treatment (Experiment 4).Footnote a

a Asterisk (*) indicates significance at Fisher’s protected LSD (α=0.05) within phenotypes or within an herbicide. Data are pooled over experiment runs.
b Herbicide application rates reflect recommended field use rate for each herbicide by the manufacturer (High) and a rate lower than the field rate (Low).
Atrazine, fomesafen, glufosinate, and paraquat controlled both phenotypes completely regardless of the application rates used in this study (Table 8). Other researchers have also reported control of GR Palmer amaranth by these herbicides (Mohseni-Moghadam et al. Reference Mohseni-Moghadam, Schroeder and Ashigh2013; Norsworthy et al. Reference Norsworthy, Griffith, Scott, Smith and Oliver2008; Poirier et al. Reference Poirier, York, Jordan, Chandi, Everman and Whitaker2014; Whitaker et al. Reference Whitaker, York, Jordan and Culpepper2010, Reference Whitaker, York, Jordan and Culpepper2011).
Dicamba and tembotrione, averaged over application rates, controlled Palmer amaranth by 84% to 85% and 95% to 97%, respectively, and reduced shoot dry biomass by 91% to 94% and 97% to 99%, respectively (Table 8). A rate response was observed with both herbicides, with the higher rate of dicamba and tembotrione controlling Palmer amaranth by 93% and 100%, respectively. Thifensulfuron and 2,4-D were the least effective of the herbicides evaluated. Averaged over application rates, thifensulfuron controlled Palmer amaranth by 53% to 57% and reduced shoot dry biomass by 51% to 56%, while 2,4-D controlled the weed by 67% to 69% and reduced shoot dry biomass by 79% to 81%. A rate response was observed with both herbicides. Palmer amaranth was controlled 88% and shoot dry biomass was reduced 96% by 2,4-D at the higher rate. Thifensulfuron at the higher rate controlled Palmer amaranth only 63% and reduced shoot dry biomass only 65%. In previous research (Whitaker Reference Whitaker2009), thifensulfuron at 4 g ha−1, the low rate in this experiment, controlled susceptible phenotypes at least 95%. Populations used in the current experiment were likely resistant to ALS-inhibiting herbicides. In previous research in North Carolina, 97% of 134 Palmer amaranth populations screened were at least partially resistant to thifensulfuron (Poirier et al. Reference Poirier, York, Jordan, Chandi, Everman and Whitaker2014).
Results from these experiments do not describe presence or absence of a fitness penalty for glyphosate resistance in Palmer amaranth, because seed production was not determined. The comparison of seed production among the phenotypes (not measured in this study) would have been more useful, although plant biomass and seed production are often highly correlated (Howell Reference Howell1990). Additional work is necessary to determine whether differences in late-season vegetative growth and fecundity exist between GR and GS phenotypes collected from the same location before predictions can be made regarding the likelihood of persistence and prevalence of the GR phenotype in the absence of selection pressure from glyphosate. Nevertheless, these results bring clarity to results in the literature (Chandi et al. Reference Chandi, Jordan, York, Burton, Milla-Lewis, Spears, Whitaker and Wells2013a, Reference Chandi, Jordan, York, Milla-Lewis, Burton, Culpepper and Whitaker2013b) comparing response of GS and GR Palmer amaranth populations collected from different locations exposed to the same stresses in our research. Chandi et al. (Reference Chandi, Jordan, York, Burton, Milla-Lewis, Spears, Whitaker and Wells2013a, Reference Chandi, Jordan, York, Milla-Lewis, Burton, Culpepper and Whitaker2013b) reported possible disadvantages of glyphosate resistance in Palmer amaranth in terms of interference with crops (corn, cotton, peanut, and snap bean) and response to herbicides (atrazine and dicamba) other than glyphosate, and an advantage of glyphosate resistance in recovery from drought stress. Chandi et al. (Reference Chandi, Jordan, York, Milla-Lewis, Burton, Culpepper and Whitaker2013b) reported that reduction in crop fresh biomass (25%) was greater in GS Palmer amaranth populations than GR populations (19%) although no differences in crop height reduction were noted between GS and GR populations. In another study, Chandi et al. (Reference Chandi, Jordan, York, Burton, Milla-Lewis, Spears, Whitaker and Wells2013a) demonstrated greater reduction in height and fresh biomass for ALSS/GS Palmer amaranth populations (12% and 23%, respectively) by drought compared with GR and ALSR populations (10% and 20%, respectively). These findings were inconsistent with our current work, in which GR and GS plants selected from a segregating population responded similarly under drought stress; when grown with corn, cotton, and peanut; and when treated with eight herbicides representing seven sites of action commonly used in agronomic crops. Results from the present study suggest that differential response of GR and GS populations reported previously may be attributed to the location of the collected populations rather than glyphosate resistance.
Acknowledgments
The authors thank Travis Gannon and Khalied Ahmed for use of their laboratory for analysis of shikimate samples and Andrew Hare for technical assistance in the greenhouse. Furthermore, the authors thank Candace Haigler and the Genomic Science Laboratory staff for their assistance in the use of the spectrophotometer. The North Carolina Agricultural Foundation provided partial funding for this research.