Nomenclature
- CD
-
drag coefficient
- CDF
-
skin friction drag coefficient
- CDP
-
pressure drag coefficient
- CDV
-
viscous drag coefficient
- CDW
-
wave drag coefficient
- CL
-
lift coefficient
- Cp
-
pressure coefficient
- d
-
hole diameter
- D
-
drag
- L
-
lift
- M
-
Mach number
- N
-
N-factor in stability analysis (amplitude ratio)
- p
-
pressure
- Re
-
Reynolds number
-
 ${\bar {\rm R}}$
-
attachment line Reynolds number
-
${{\bar{\rm R}}_{{\rm{crit}}}}$
-
attachment line critical Reynolds number
- Sd
-
hole spacing to hole diameter ratio
- t
-
skin thickness
- T
-
temperature
- U∞
-
freestream velocity
- Vs
-
suction velocity, non-dimensionalised by freestream velocity
- x/c
-
streamwise ordinate, non-dimensionalised by chord
- Xe
-
end of transition location
- Xt
-
transition location


Greek symbol
- α
-
angle of incidence
-
${\delta ^*}$
-
boundary layer displacement thickness
- γ
-
intermittency factor
- ψ
-
wave angle
- Λ
-
wing sweep angle

Subscripts
- 2D
-
two-dimensional
- L
-
local
- n
-
normal to wing leading-edge sweep
- w
-
wall
- ∞
-
freestream
Acronyms
- ARA
-
Aircraft Research Association
- HLFC
-
hybrid laminar flow control
- NLF
-
natural laminar flow
- CF
-
crossflow instability
- TS
-
Tollmien-Schlichting instability
- 2D
-
two-dimensional
- 3D
-
three-dimensional
- TWT
-
transonic wind tunnel
- IR
-
infra-red
1.0 Introduction
Drag has a direct impact on aircraft fuel consumption and engine emissions. The increasing emphasis on the environmental effects of engine emissions has driven the need for future civil aircraft to be more environmentally friendly. To this end, there has been large amount of research in recent years into flow control techniques for delaying transition from laminar to turbulent flow in order to reduce drag and fuel burn. One of the techniques that has generated considerable research both in Europe and United States is hybrid laminar flow control (HLFC). This technology involves the combination of geometry shaping and surface suction in the leading-edge region to control the flow instabilities to delay transition. The Aircraft Research Association (ARA) has carried out HLFC research since the 1980s, and various key findings obtained are described in the paper.
On swept wings, there are number of flow instability mechanisms which can cause transition from laminar to turbulent flow. An important aspect of HLFC is to establish a methodology for controlling these flow instabilities to delay transition. An investigation into a transition control methodology for a range of pressure distributions and flow conditions relevant to civil transport aircraft has been part of the HLFC research programme at ARA since the 1990s [Reference Wong and Maina1–Reference Wong and Maina3]. These research studies have established an appropriate level of suction velocity and suction extent required for controlling various flow instabilities in order to delay transition. The findings are outlined in Section 2 of this paper. In these studies, the surface suction velocity was specified directly in the transition prediction method. Further development of the method has been carried out at ARA to take into account the effect of the pressure difference across the porous surface and surface porosity on the suction mass flow. The method has enabled investigations into the effect of the external pressure gradient and surface porosity on surface suction for a given chamber pressure. The pressure gradient effect is most pronounced in the leading-edge region due to the steep initial flow acceleration. One approach for resolving this problem commonly adopted is the use of a number of separate suction chambers [Reference Horstmann, Schrauf, Sawyers and Sturn4], where the suction velocity in each chamber is directly controlled. An alternative approach using a single plenum chamber with varying porosity to alleviate the effect of pressure gradient on the surface suction velocity distribution has been developed at ARA for civil transport and supersonic aircraft [Reference Wong, Maina and Doig5, Reference Wong6]. The variable porosity concept for controlling transition is also described in Section 2 and its application to a supersonic aircraft is presented in Section 3.
Choosing an appropriate pressure distribution for HLFC wing design is still a key issue at the present time, due to its effect on transition and aerodynamic performance. Aerofoils with different types of ‘rooftop’ pressure gradients for HLFC application, and their aerodynamic performance characteristics have been investigated at ARA in mid-1990s [Reference Wong and Maina1, Reference Wong and Maina2]. Pressure distributions with a favourable ‘rooftop’ gradient are usually regarded as the most appropriate for maximising laminar flow extent. However, in addition to viscous drag reduction, wave drag and lift capability are important considerations for HLFC wing design. It has been shown that it is possible to obtain a significant extent of laminar flow on aerofoils with an adverse ‘rooftop’ pressure gradient, that is, the same type of upper surface pressure distribution may be chosen for a HLFC wing as for a turbulent wing. This is also important when considering performance reduction in the event of suction system failure. The choice of an appropriate type of pressure distribution and its design implications are described in Section 4 of this paper.
The possibility of using a turbulent type of pressure distribution for HLFC design for a civil transport retrofit wing has been investigated at ARA as an alternative to a favourable gradient type of pressure distribution. It was shown that transition can be delayed as far downstream as the shock location, and with a higher aerodynamic performance than a favourable gradient type of pressure distribution. This conceptual wing design with the single chamber and variable porosity suction system for controlling transition has been integrated with the leading-edge wing structure, combined with the wing ice protection and high lift systems [Reference Wong and Walters7]. The resulted suction system in terms of structural complexity and weight relative to a multi-chamber approach is also outlined in Section 5, together with recommendations for its future development.
HLFC analysis tends to focus on transition onset, but the transition process encompasses an intermittency region before the flow becomes fully turbulent. The influence of the transition region on the flow and the effect on the aerodynamic performance of HLFC aerofoils have been shown to be significant in an investigation carried out at ARA [Reference Green and Wong8]. The results suggested that the modelling of the transition region should be included in aerodynamic methods for designing HLFC aerofoils and wings. The effect of transition zone region on aerodynamics performance is described in Section 6 of this paper.
ARA has been involved in natural laminar flow (NLF) and HLFC wind tunnel experimental research since 2000 [Reference Allen, Lawson, Maina and Alderman9–Reference Lawson, Ciarella and Wong11] and has gained valuable knowledge and experience in transition location measurement techniques and data analysis. Linear stability analysis and the N-factor method is commonly used for transition prediction for HLFC wing design in an industrial environment. The N-factor for transition depends on surface roughness and the flow environment, such as noise and turbulence level. Various issues involving the use of the method for determining an N-factor value for transition for a wind tunnel are discussed in Section 7. For practical NLF and HLFC commercial aircraft wing design, the structural integration of the high lift devices, anti-icing systems and more regular in-service maintenance requirements may result in a wing with small grooves or steps between these components. A wind tunnel investigation into the effect of various groove and step sizes on transition due to Tollmein-Schlichting (T-S) instabilities in NLF has been carried out at ARA in 2017 [Reference Lawson and Ciarella10]. Section 7 also provides outline of this experiment and recommendations for future research.
Wind tunnel testing of aircraft designed for fully turbulent flow in a cryogenic tunnel or in a low Reynolds number facility such as the ARA transonic wind tunnel (TWT) is well established. For aircraft that employ HLFC, the simulation problem is much more complex, and there are testing issues for both types of wind tunnel facilities. A theoretical study to address a number of issues involved in the wind tunnel testing of HLFC wings in a low Reynolds number tunnel and some of the problems related to scale effects has been carried out at ARA in 2000 [Reference Wong and Maina12]. The issues with wind tunnel testing methodology of HLFC wing designs and future research recommendations are discussed in Section 8 of this paper.
2.0 Transition control methodology
On swept wings, transition from laminar to turbulent flow may be caused by one of three principal mechanisms that depend mainly on pressure gradient, Reynolds number and sweep angle. These three mechanisms are attachment line contamination, crossflow (CF) instability and Tollmien-Schlichting (TS) instability. It should be noted that the transition mechanisms along the attachment line and attachment line contamination are different, and this paper only deals with attachment line contamination. The occurrence of attachment line contamination and CF instability is associated mainly with the initial pressure gradient, though favourable ‘rooftop’ gradients will allow CF instability to persist. TS instability generally becomes dominant further aft, particularly for adverse gradients. Given that these instability modes can be confined to different regions of the wing, a control methodology of treating each mode separately and successively can be employed in HLFC. This division of the pressure distributions into two parts allows the different transition mechanisms to be investigated independently. This is consistent with the use of linear stability analysis for transition prediction, which also presupposes that the instability modes may be treated independently.
Linear stability analysis methods coupled with the ‘eN’ criterion are widely used for transition prediction. The theory behind such methods has been well documented elsewhere, see for example Ref. [Reference Mack13]. The method employed for the work described here is the spatial method with compressible flow formulation, Compact Difference Scheme (CoDS), due to Atkin [Reference Atkin14]. The boundary layer information required as input to CoDS for transition prediction is given by a laminar boundary layer code, Boundary Layers Two Dimensional (BL2D) [Reference Atkin15, Reference Cobbin16]. The integration strategy chosen for the calculation of the N-factor is the constant spanwise wavenumber strategy, which is considered the most physically meaningful for infinite yawed wing flows.
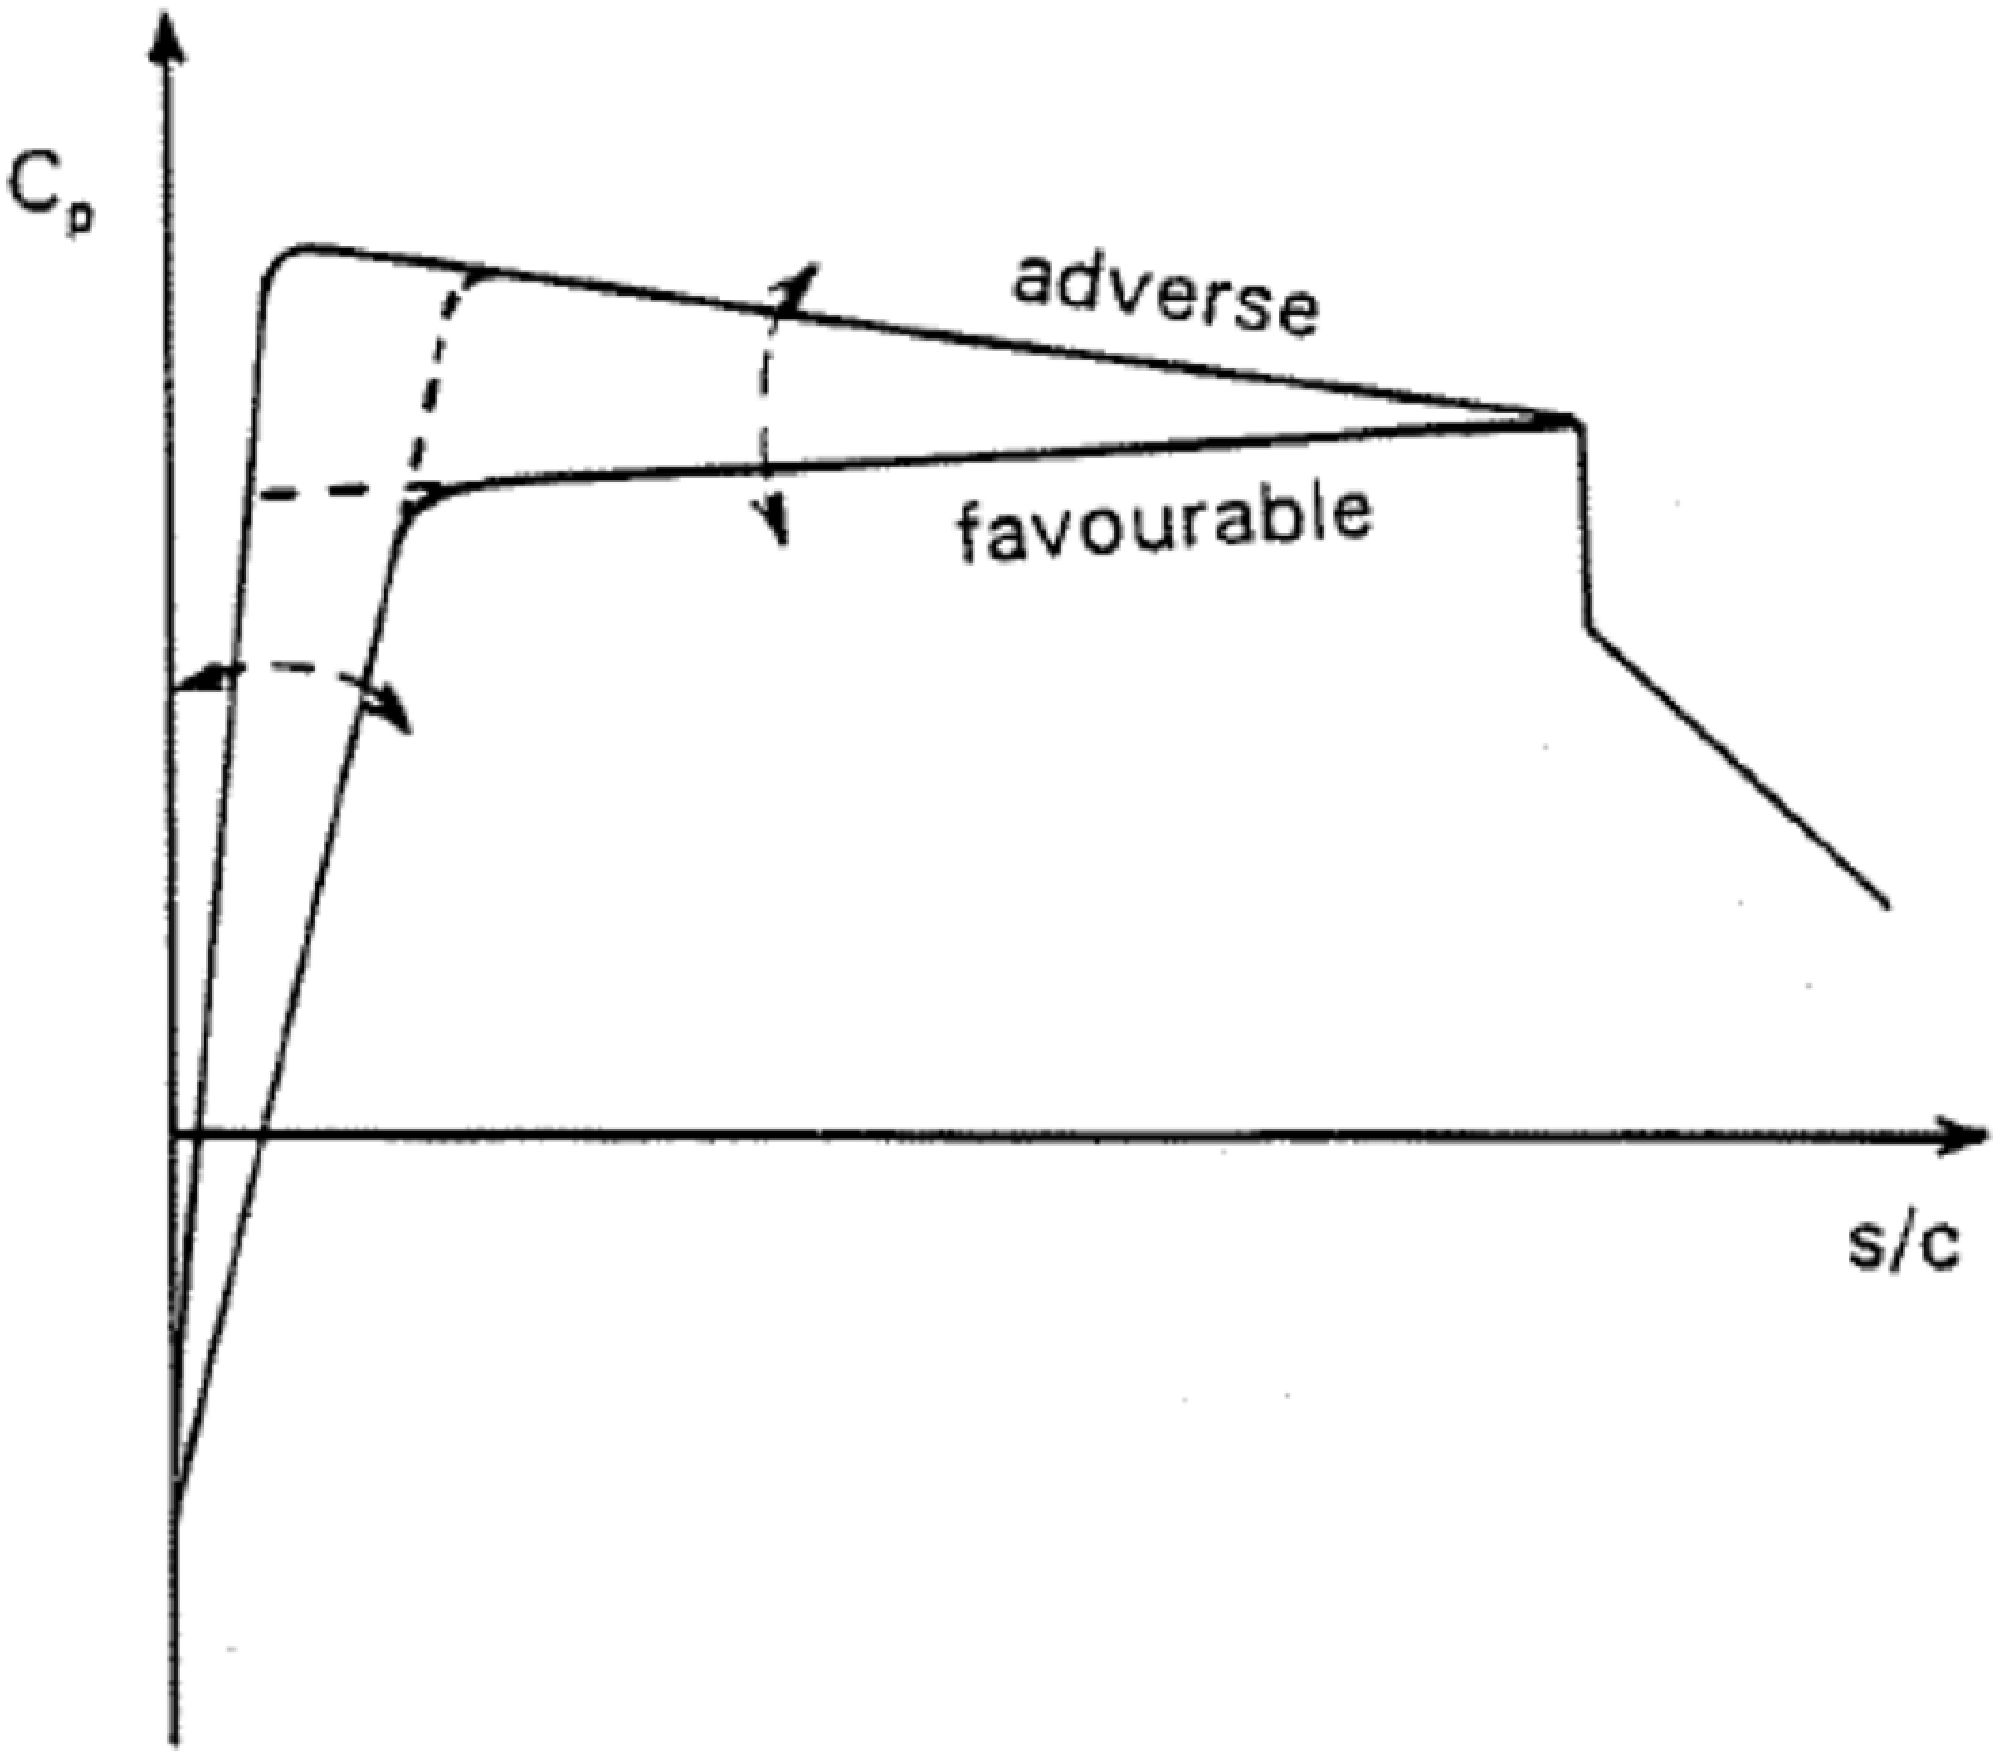
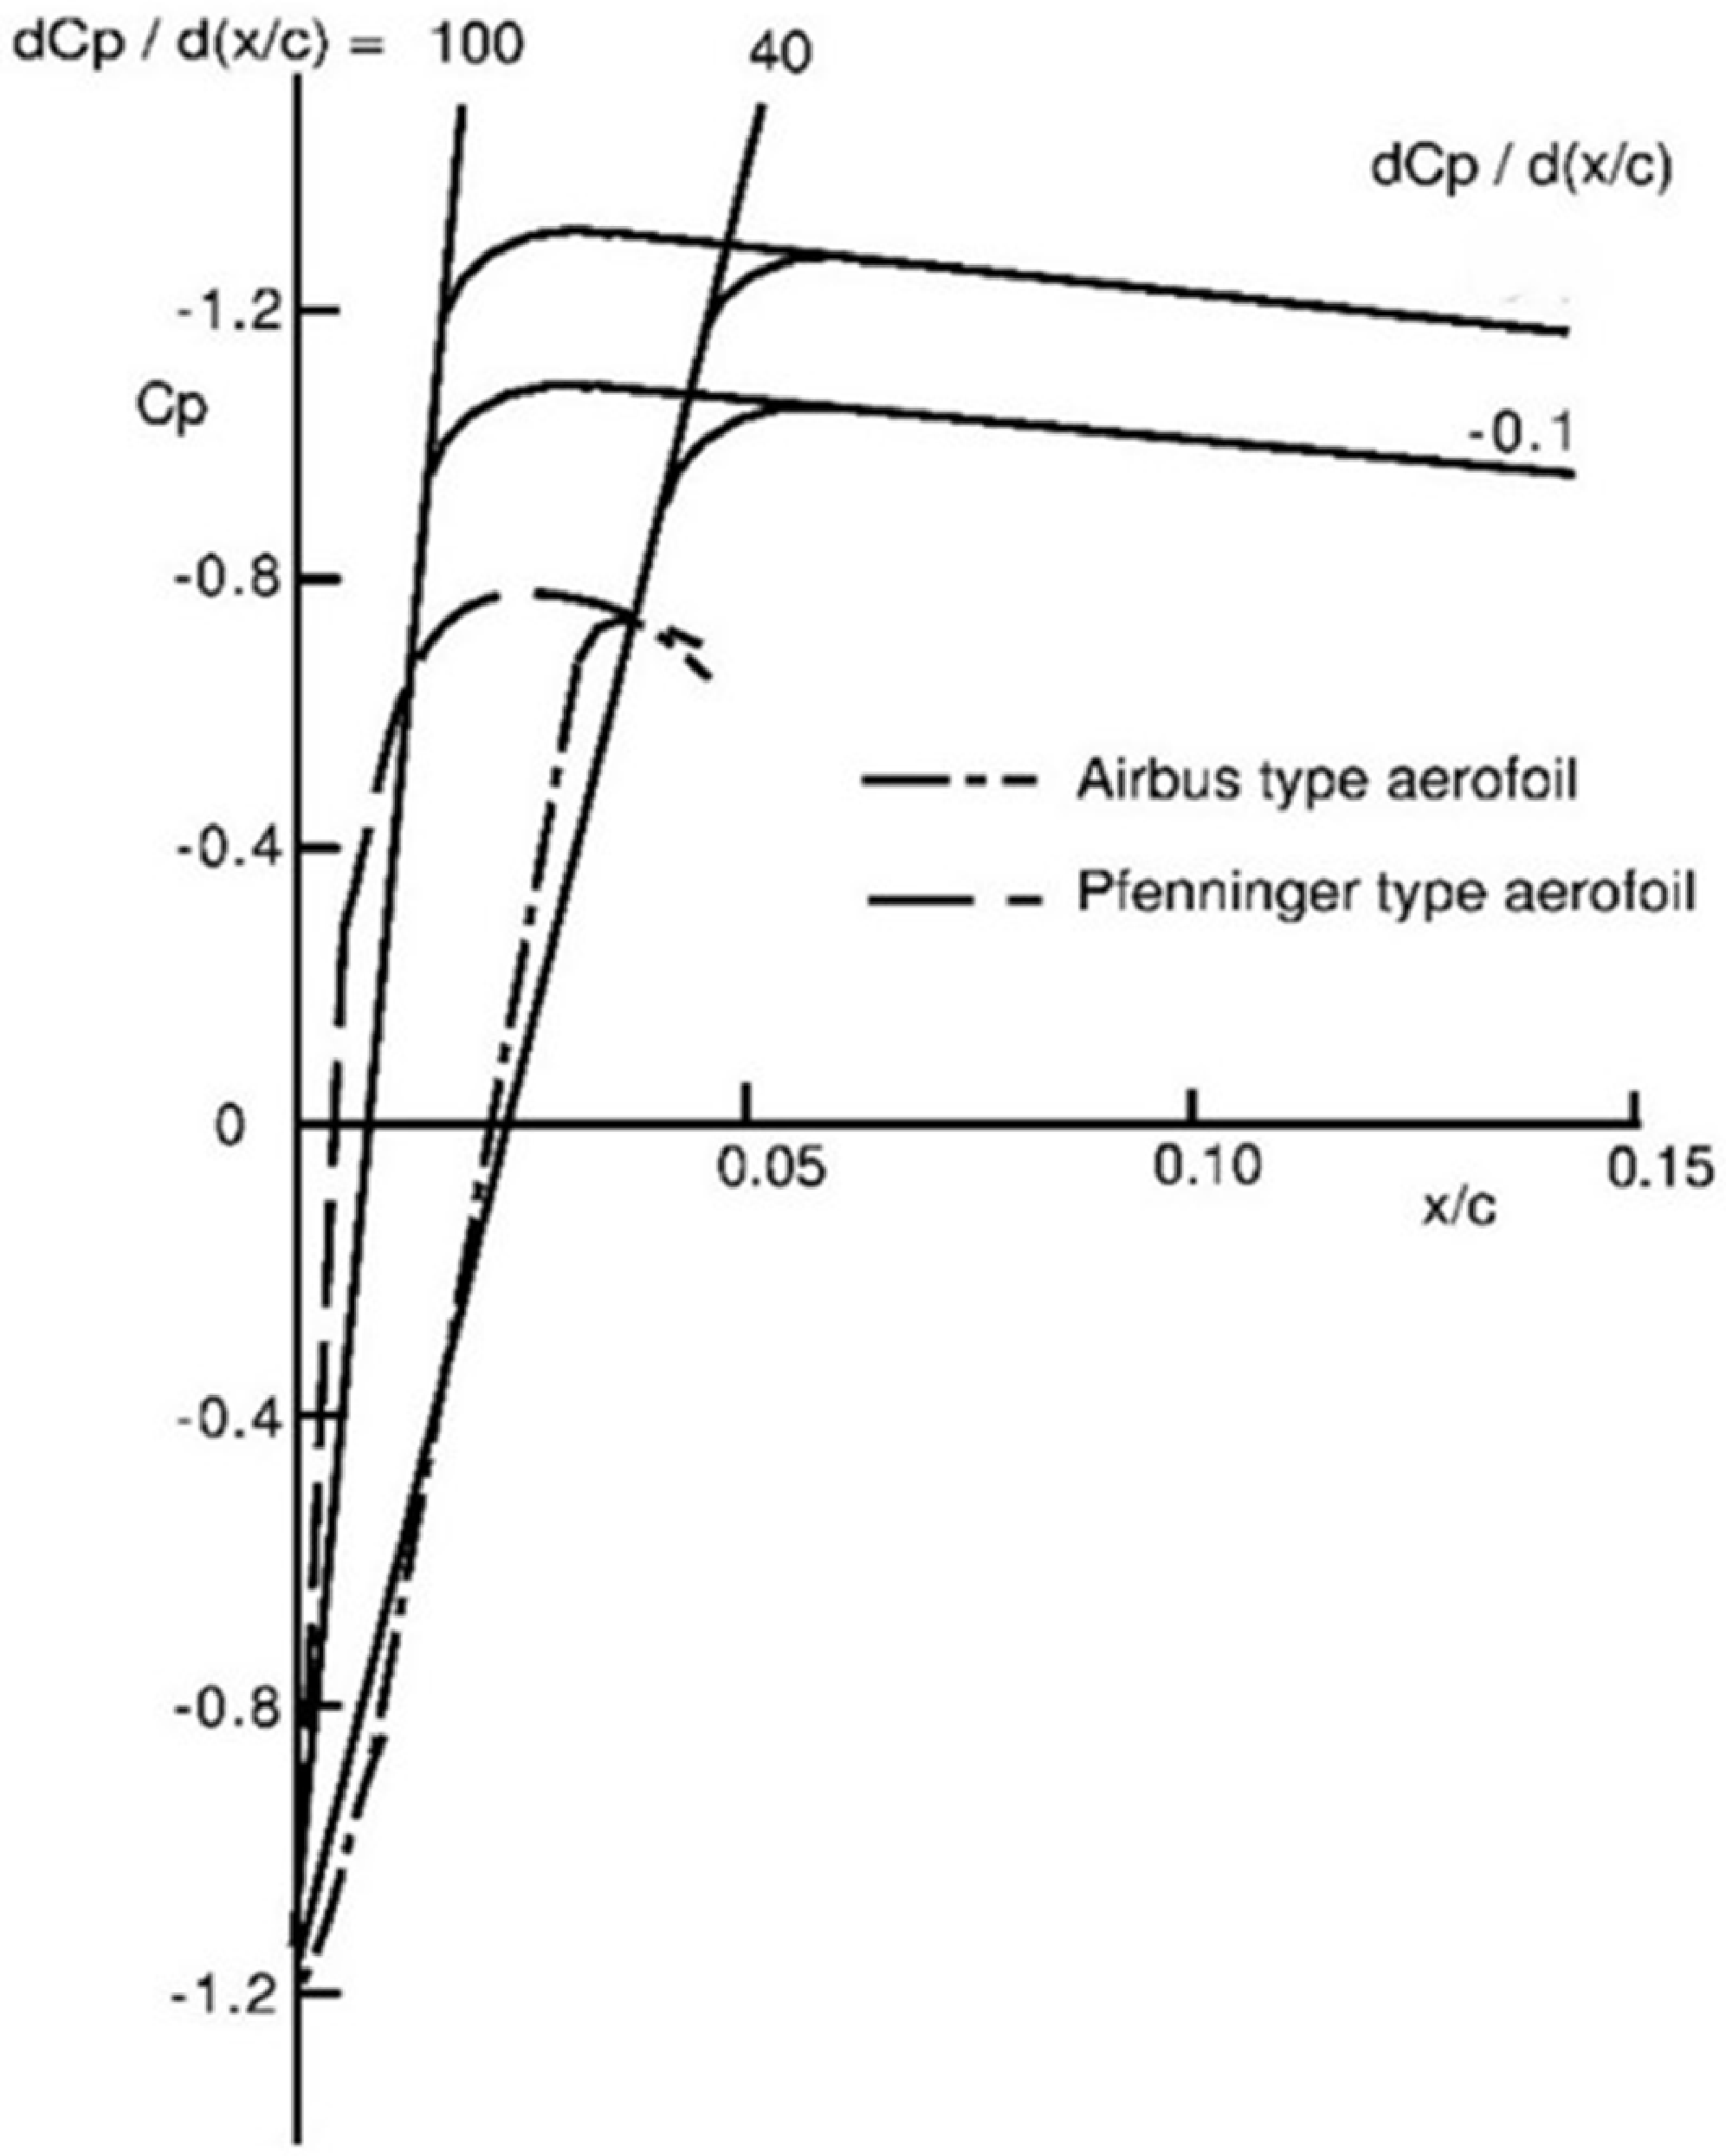
In HLFC, the three instability modes can be controlled by means of a combination of surface suction and appropriate pressure distributions in order to maintain laminar flow. For structural reasons it may be possible to apply suction only on the wing upper surface upstream of the front spar from about 15 to 20% chord. The control of various instability modes has been investigated in the form of a parametric study at ARA [Reference Wong and Maina2, Reference Wong and Maina3]. A range of pressure distributions has been constructed systematically for the parametric studies as illustrated in Fig. 1, based on a cruise Mach number normal to wing sweep relevant to transport aircraft. The pressure distributions consist of a range of initial gradients downstream of the attachment line followed by a range of ‘rooftop’ gradients. The initial pressure gradient is related to the size of the leading-edge geometry of a section, with a steeper gradient being associated with a smaller leading-edge radius. The range of initial gradients considered in the investigation encompasses both conventional civil transport wings and the Pfenninger-type wing section with its small leading-edge radius and undercut lower surface (see Fig. 2). The pressure distributions are defined for 2D flow applicable to aerofoils and then converted to the streamwise direction with the effect of sweep angle based on infinite swept wing assumption. It should be noted that these pressure distributions have been constructed for transition control parametric studies only, and not for an aerofoil CL.
Sketch of pressure gradient variation.

Range of initial pressure distribution.

2.1 Attachment line contamination
The stability of attachment line contamination can be assessed based on the magnitude of the attachment line Reynolds number,
 $\bar R$
, based on the results of Poll and Paisley [Reference Poll and Paisley17]. The value of
 $\bar R$
is dependent on the initial pressure gradient, leading-edge sweep and flow condition. For
 $\bar R$
above a critical value of 245, any bursts or spots of turbulence are self-sustaining and will propagate along the attachment line. The gross contamination of the wing by the turbulence originating from the fuselage can be controlled by surface suction or devices such as a ‘Gaster bump’. The attachment line boundary layer is also susceptible to TS disturbances. These waves first appear when
 $\bar R$
reaches a value of approximately 580. If
 $\bar R$
exceeds 580 then the waves amplify as they travel along the attachment line and ultimately reach some threshold condition beyond which the waves break down to form localised turbulent spots. If the local values of
 $\bar R$
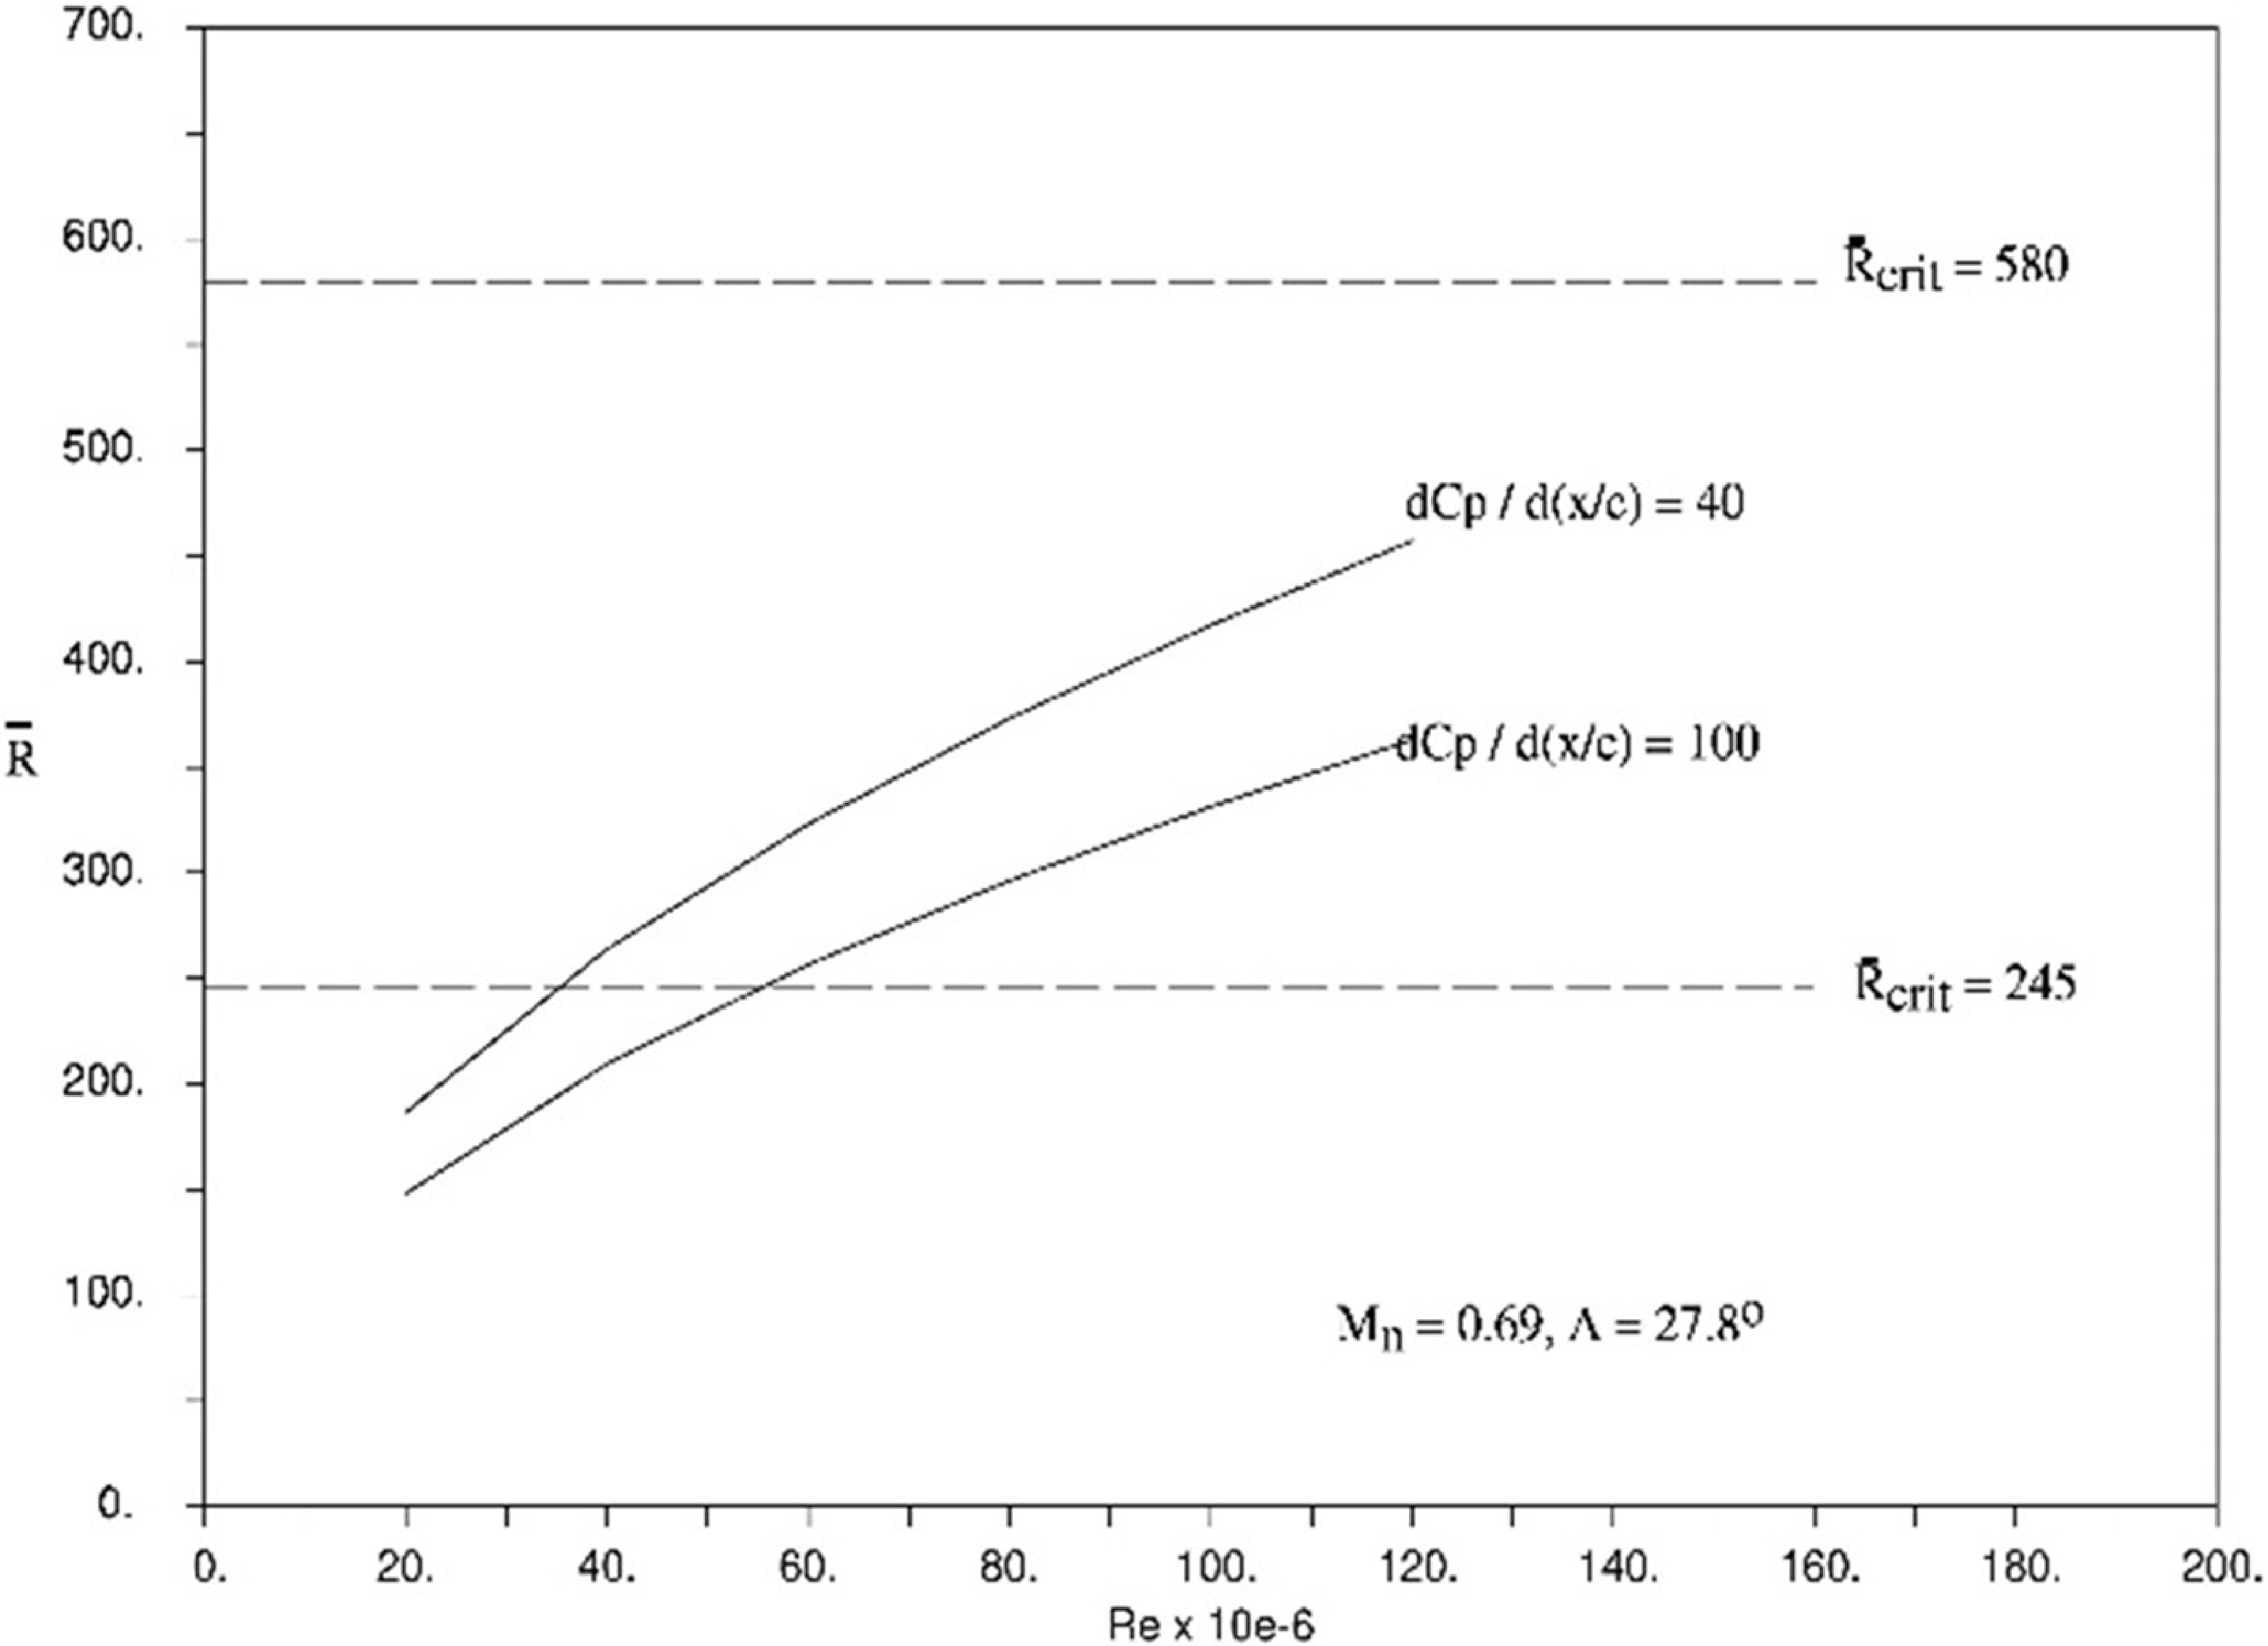
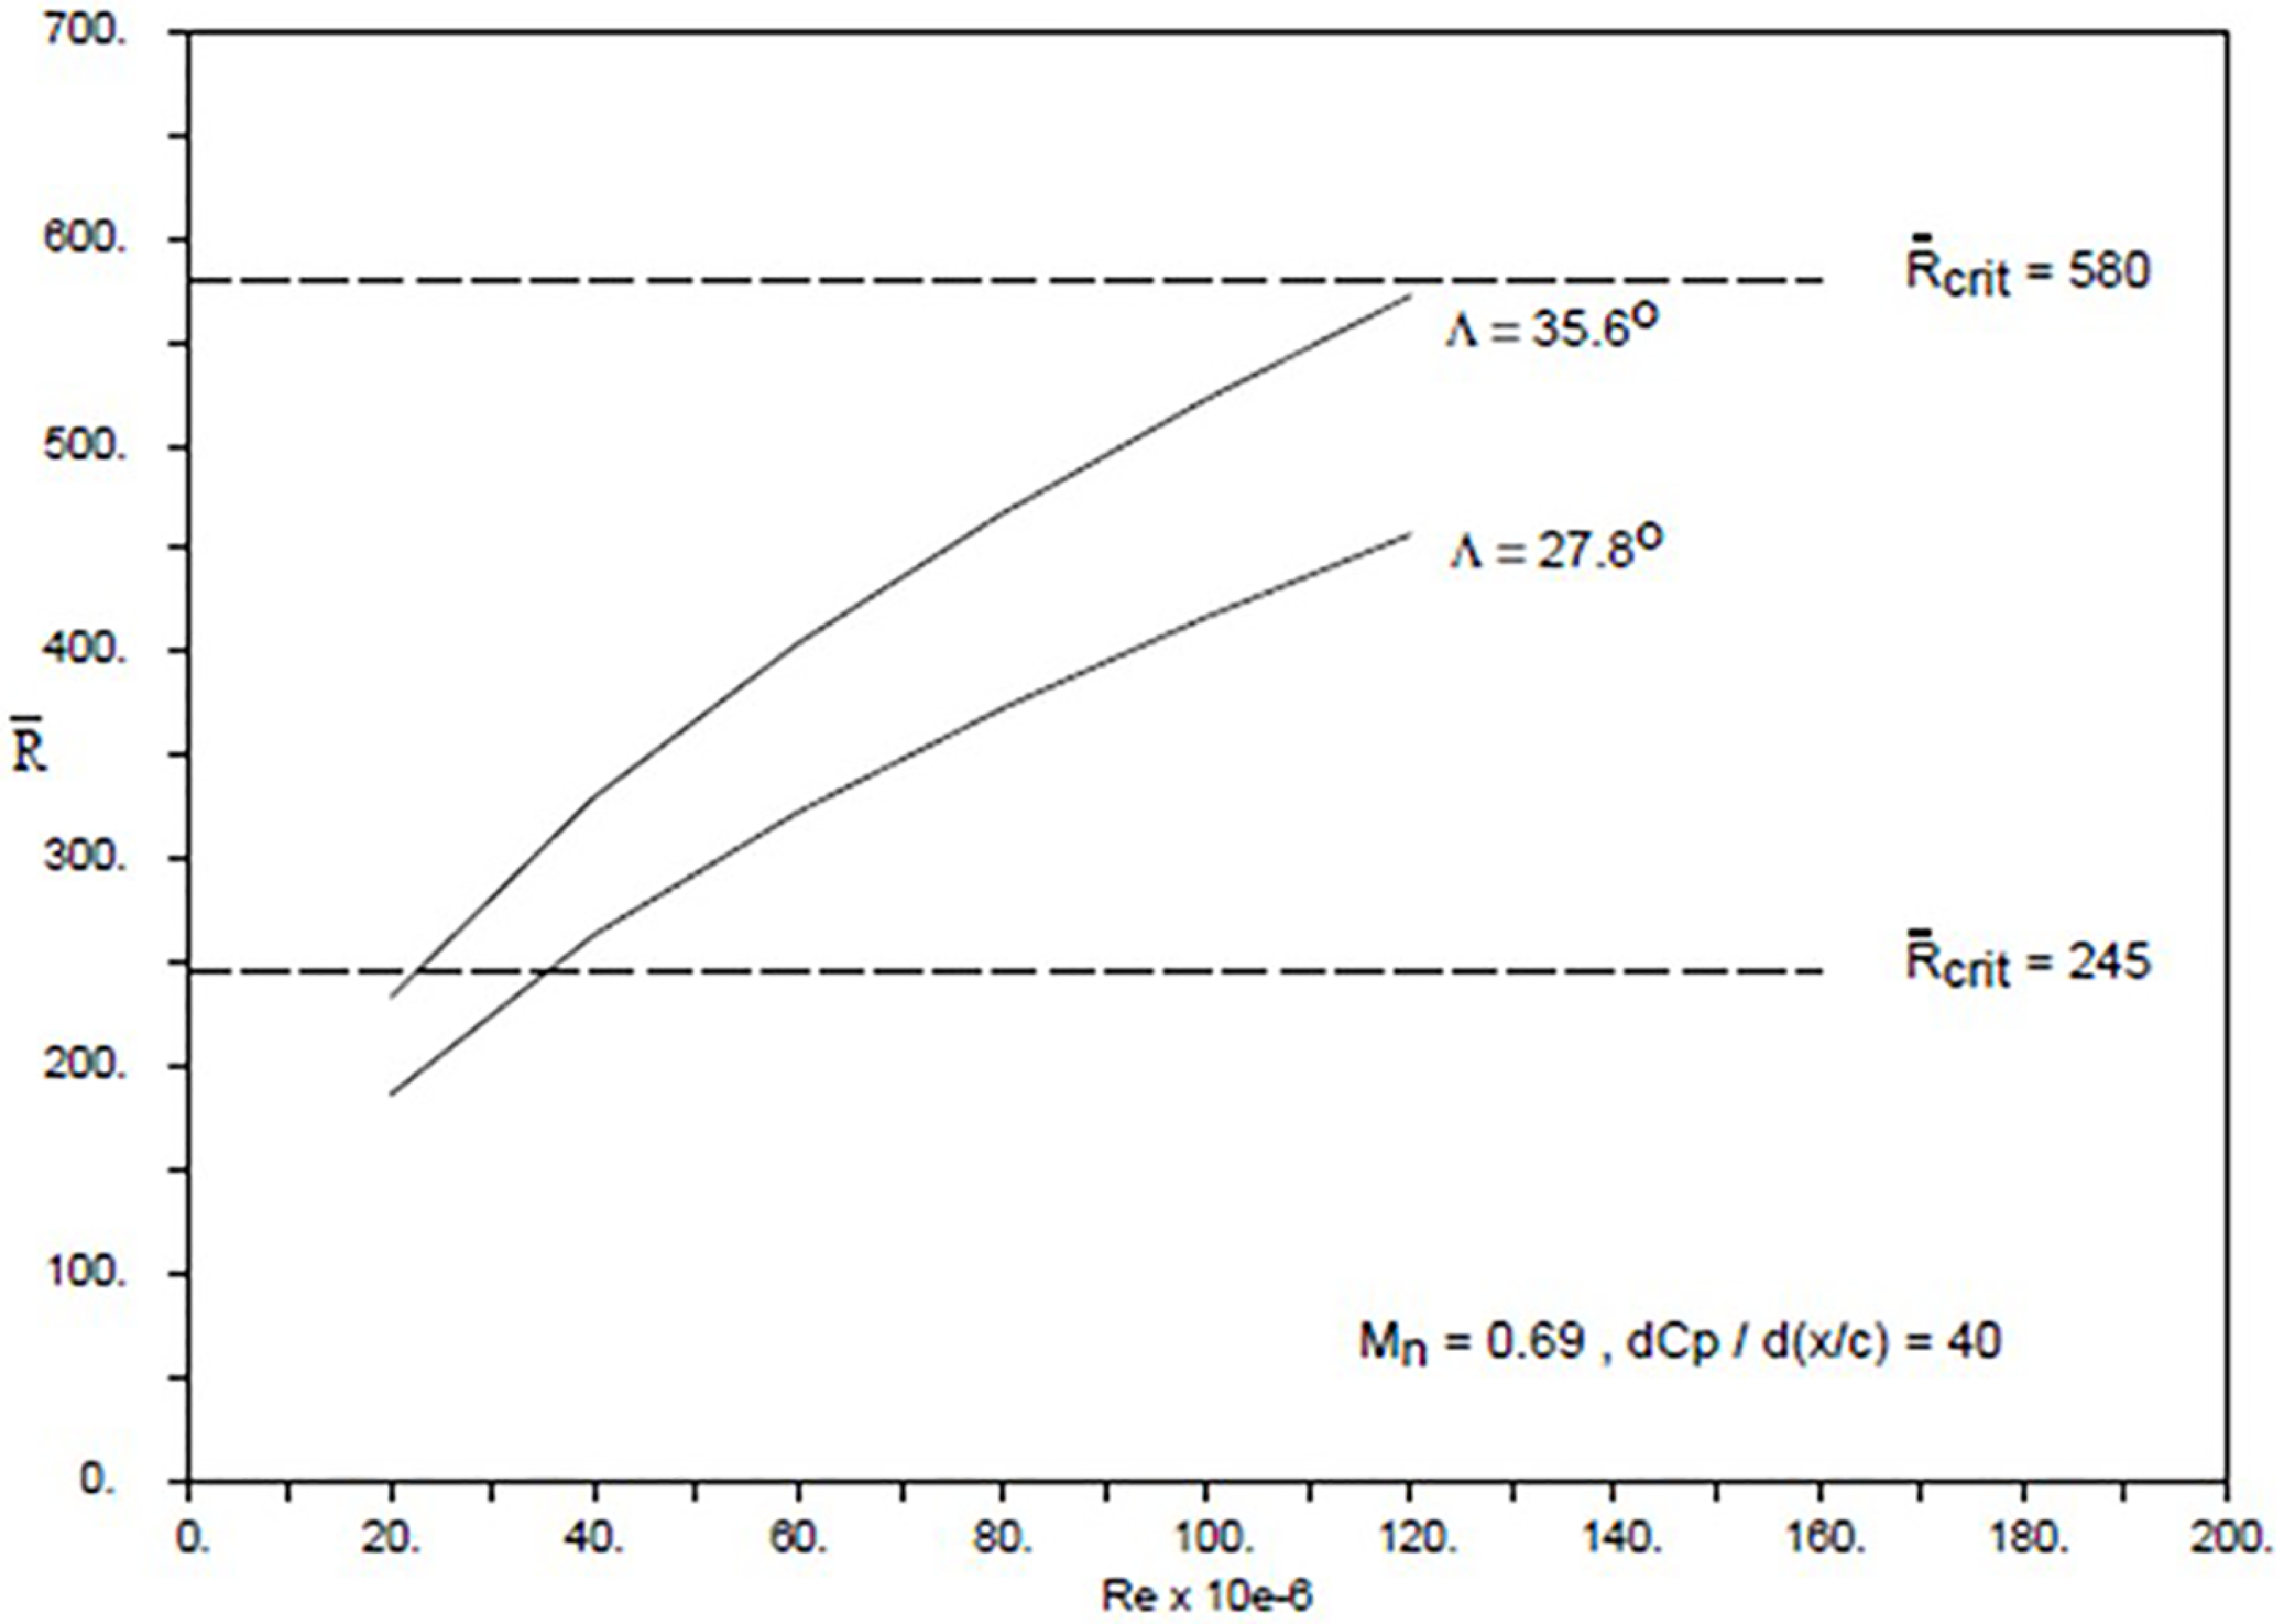
drop below 580, the waves will be damped and eventually die out. For the range of pressure distributions constructed for the parametric study and flow conditions relevant to civil transport, the value of
 $\bar R$
is between 245 and 580, as shown in Figs 3 and 4. The Reynolds number, Re, in this paper is based on wing chord. This indicates that the stability of the attachment line can be controlled by surface suction or passive devices such as a ‘Gaster bump’.
Effect of initial pressure gradient on
 $\bar R.$

Effect of sweep angle on
 $\bar R$
.

2.2 Crossflow instability
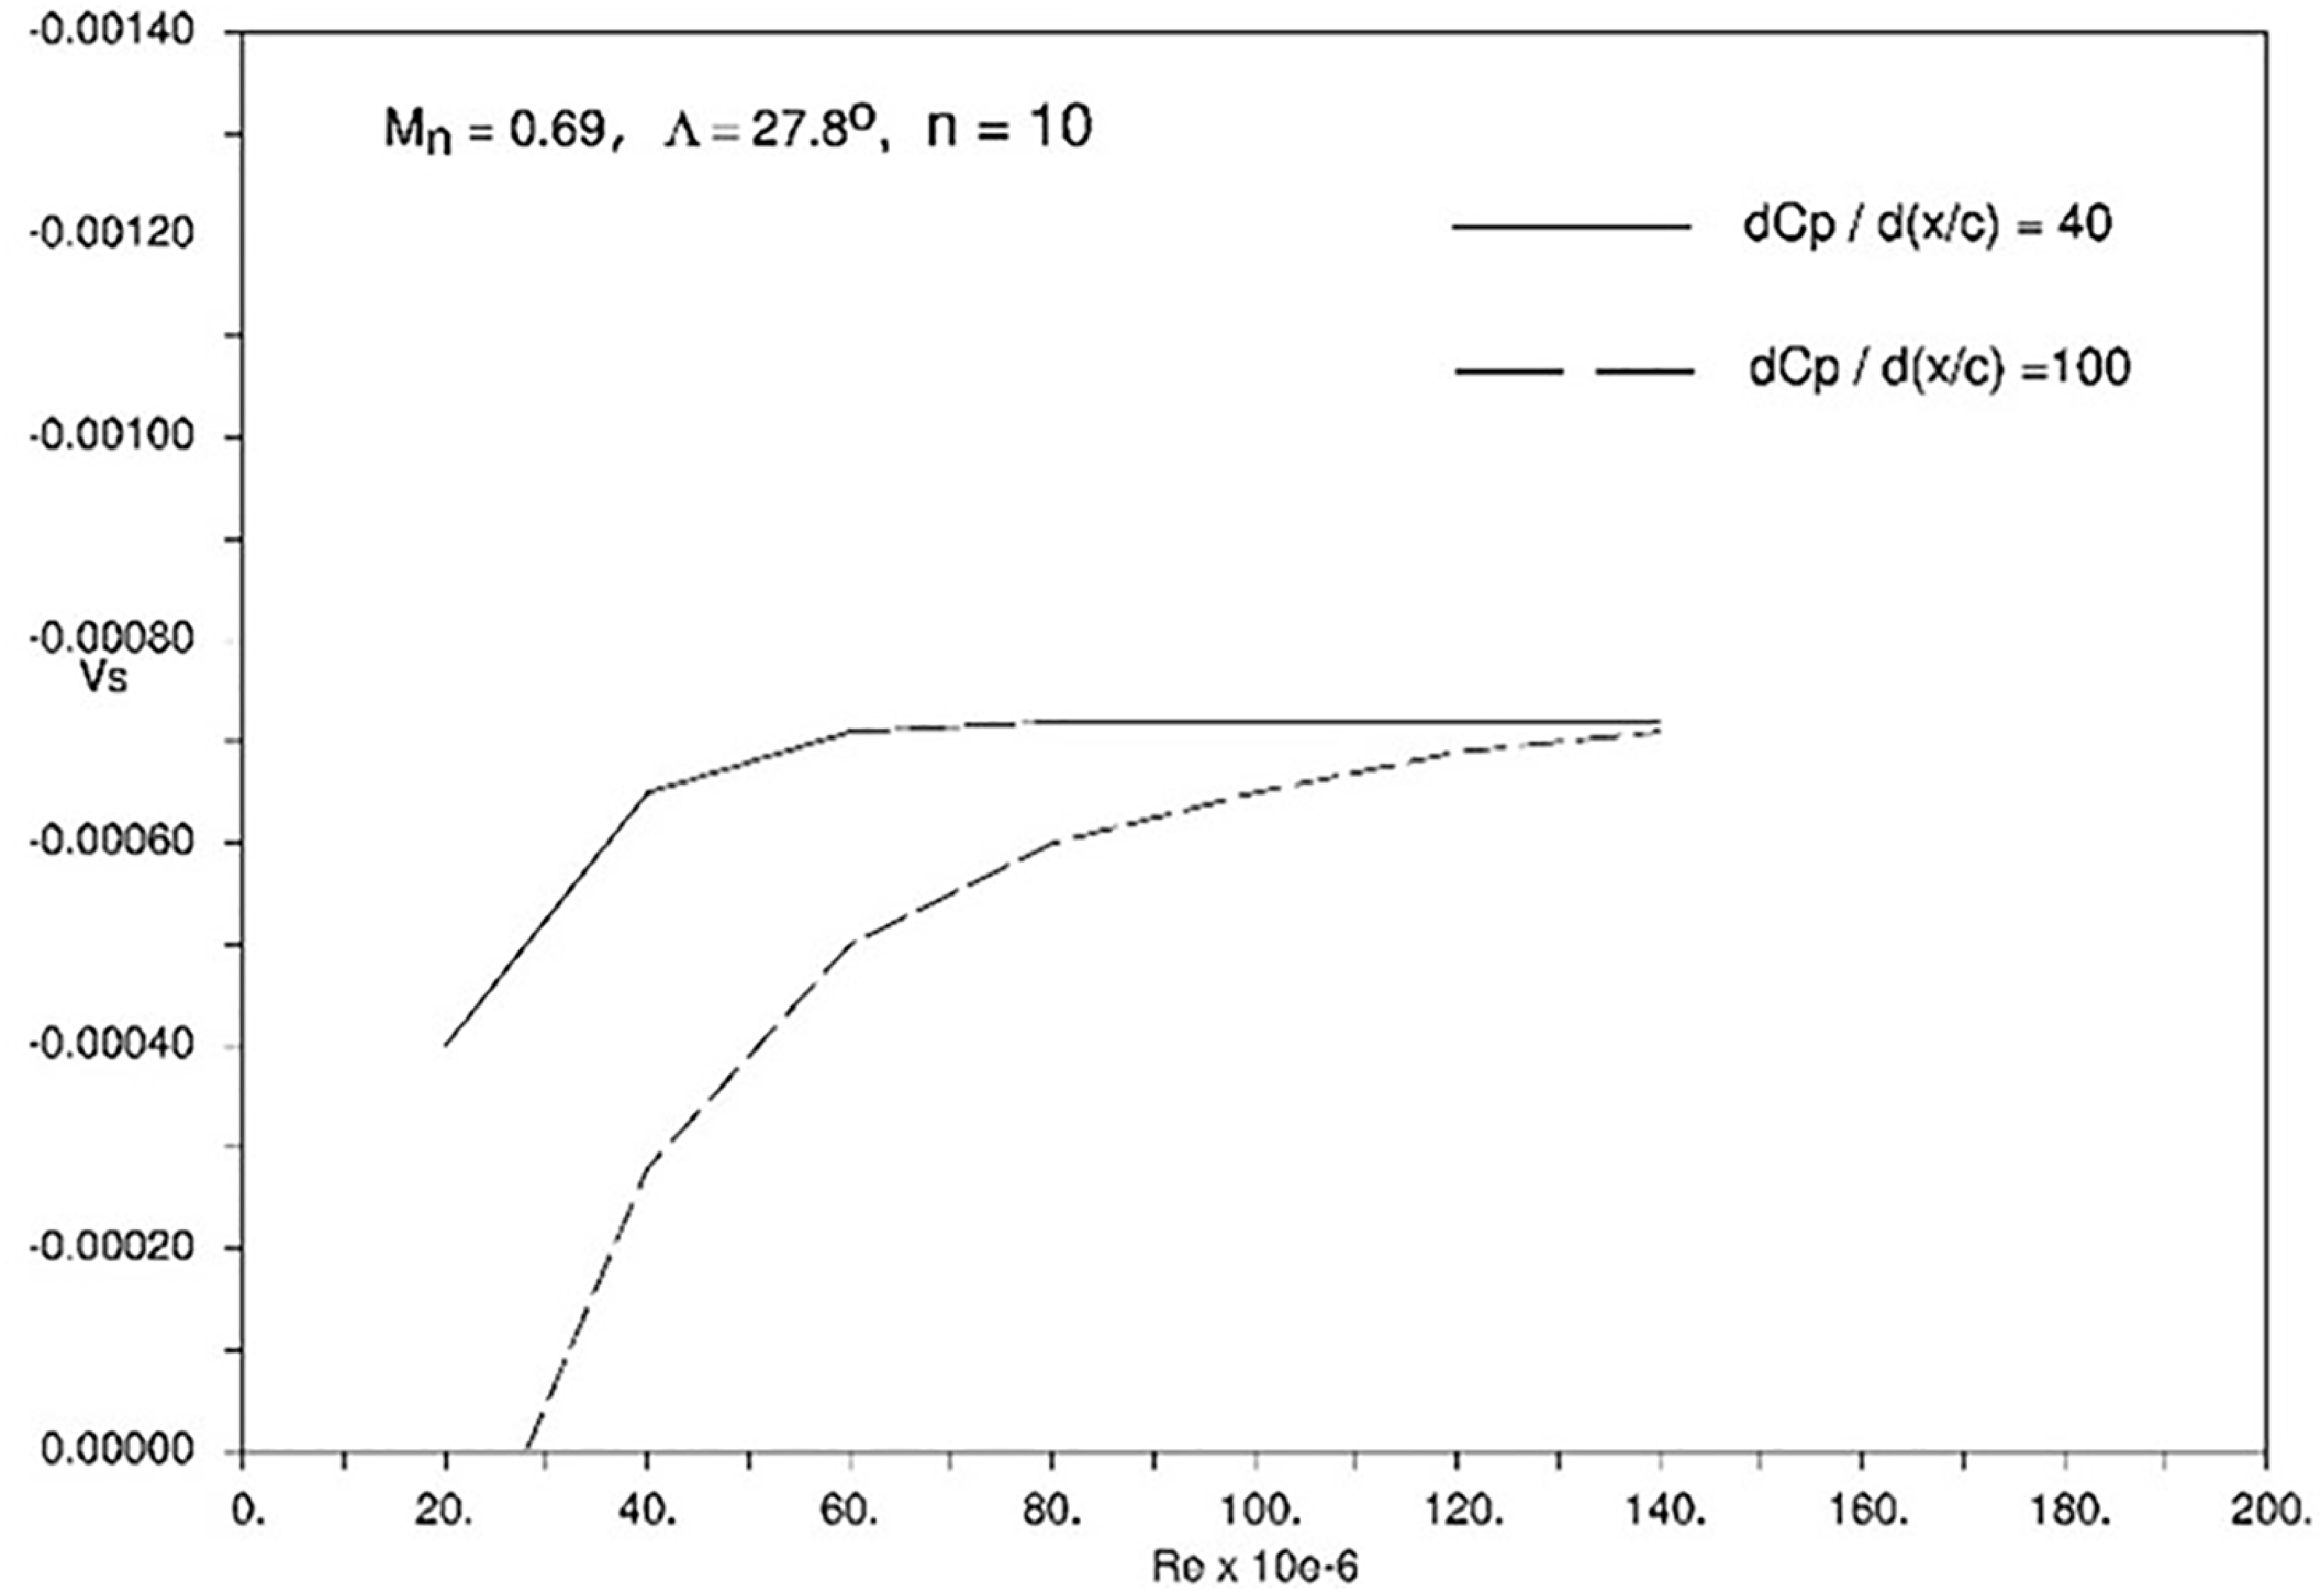
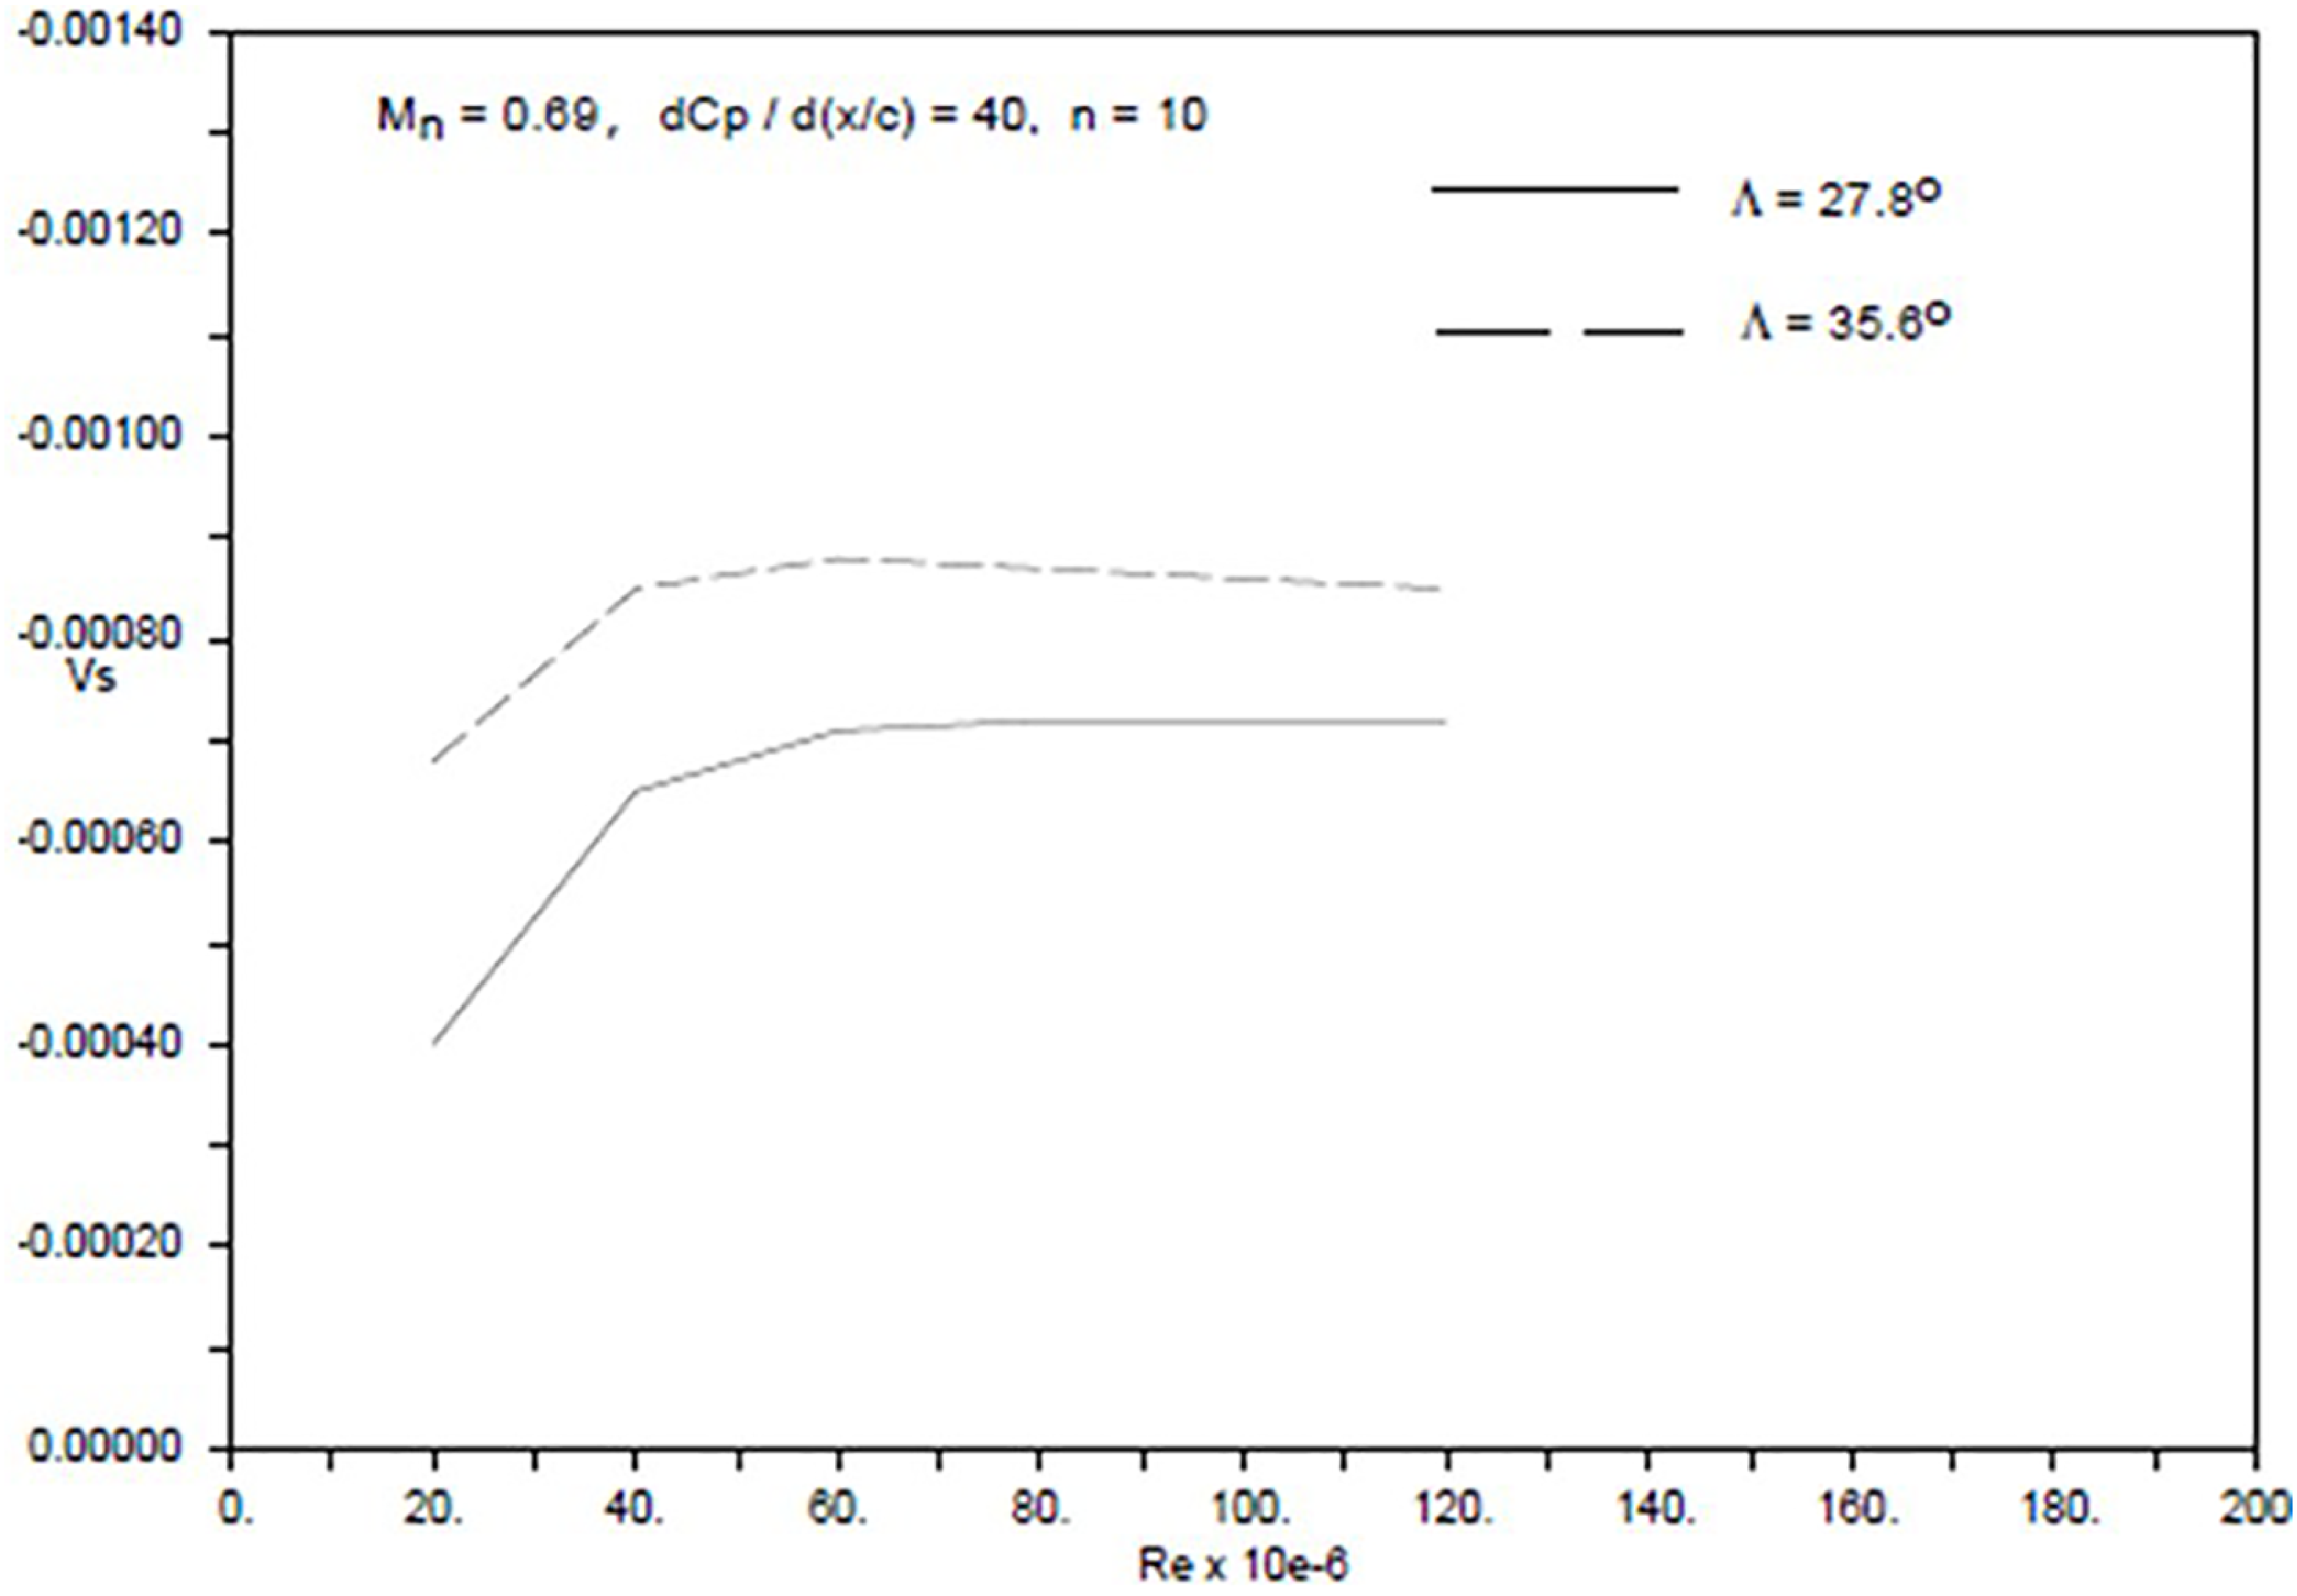
CF instabilities are due to the inflection point in the crossflow mean velocity profile. These instabilities are strongly dependent on wing leading-edge sweep and the initial flow acceleration corresponding to a favourable pressure gradient. To suppress CF instability, suction is applied over the initial steep pressure gradient region with aim of reducing the amplitude ratio below a given N-factor in the linear stability analysis method. The suction velocity, Vs, non-dimensionalised by freestream velocity is specified as an input to the laminar boundary layer code, BL2D [Reference Atkin15, Reference Cobbin16] for transition prediction in CoDS [Reference Atkin14] in the streamwise direction. The required suction velocity is sensitive to pressure gradient and wing sweep as shown in Figs 5 and 6. A constant value of Mn = 0.69 for the Mach number normal to wing leading-edge sweep has been used for the investigations. The results show that although the level of suction required varies with Reynolds number, it tends to become asymptotic and less dependent on the initial pressure gradient and wing sweep. This is beneficial for design in terms of determining a maximum required suction velocity. The maximum level of suction velocity required is about −0.007 for a wing leading-edge sweep of 27.8° for a range of initial pressure gradients.
Effect of initial pressure gradient on suction velocity.

Effect of sweep on suction velocity.

There could be a large difference in the value of N-factor for transition between that of flight and wind tunnel environment as outlined in Section 2. The range could be between 6 and 20. Apart from the differences in the flow environments that could affect the value of N-factor for transition, it may also depend on the transition prediction methods used. Surface roughness can also affect the N-factor for transition. All the results presented in this paper are for an N-factor of 10 for the purpose of transition control illustrations. The sensitivity of suction velocity required to suppress CF to N-factor has been investigated in Ref. [Reference Wong and Maina3]. It was found that assuming n = 8 rather than 10 implies a 10% difference in the suction velocity over most of Reynolds number range.
For a wing leading-edge sweep of 35.6° with a low initial pressure gradient of 40, which may be associated with a cruise Mach number of 0.85 for an inboard wing section with a larger leading-edge radius, the maximum suction velocity required is about −0.009 as shown in Fig. 6. The results have provided useful guidance in the maximum level of suction velocity required for controlling CF in HLFC wing design.
2.3 Tollmien-Schlichting instability
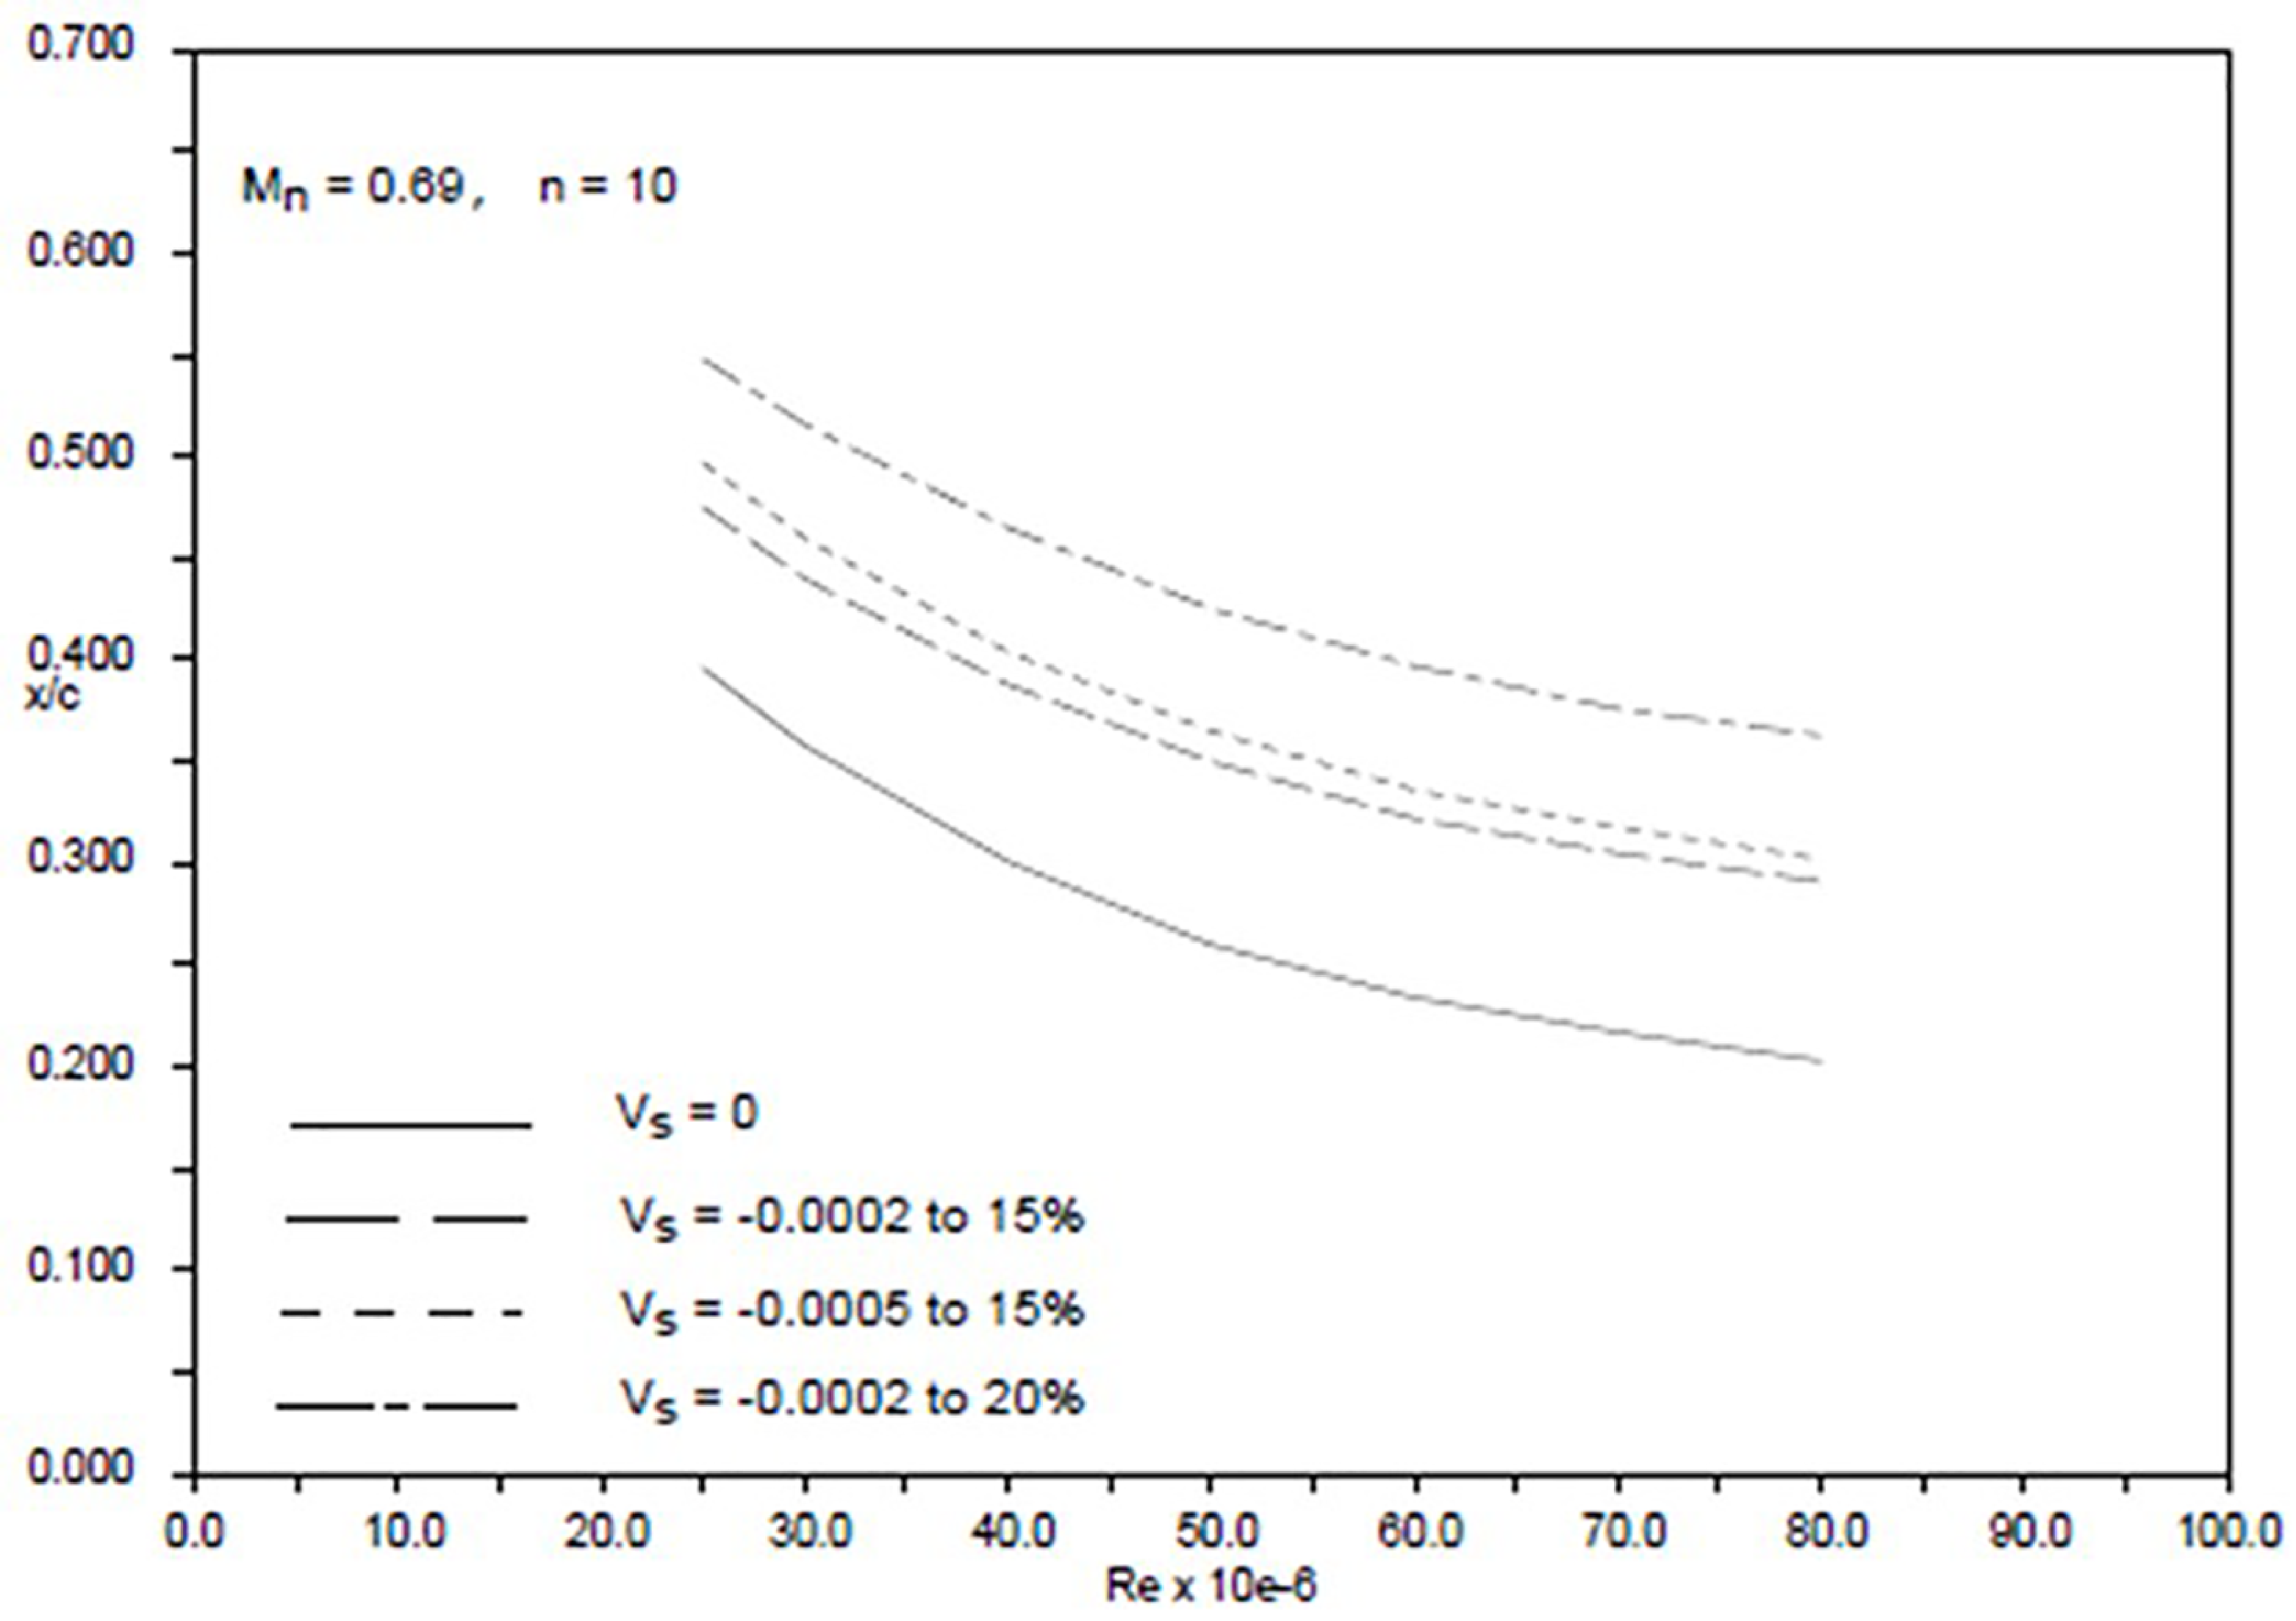
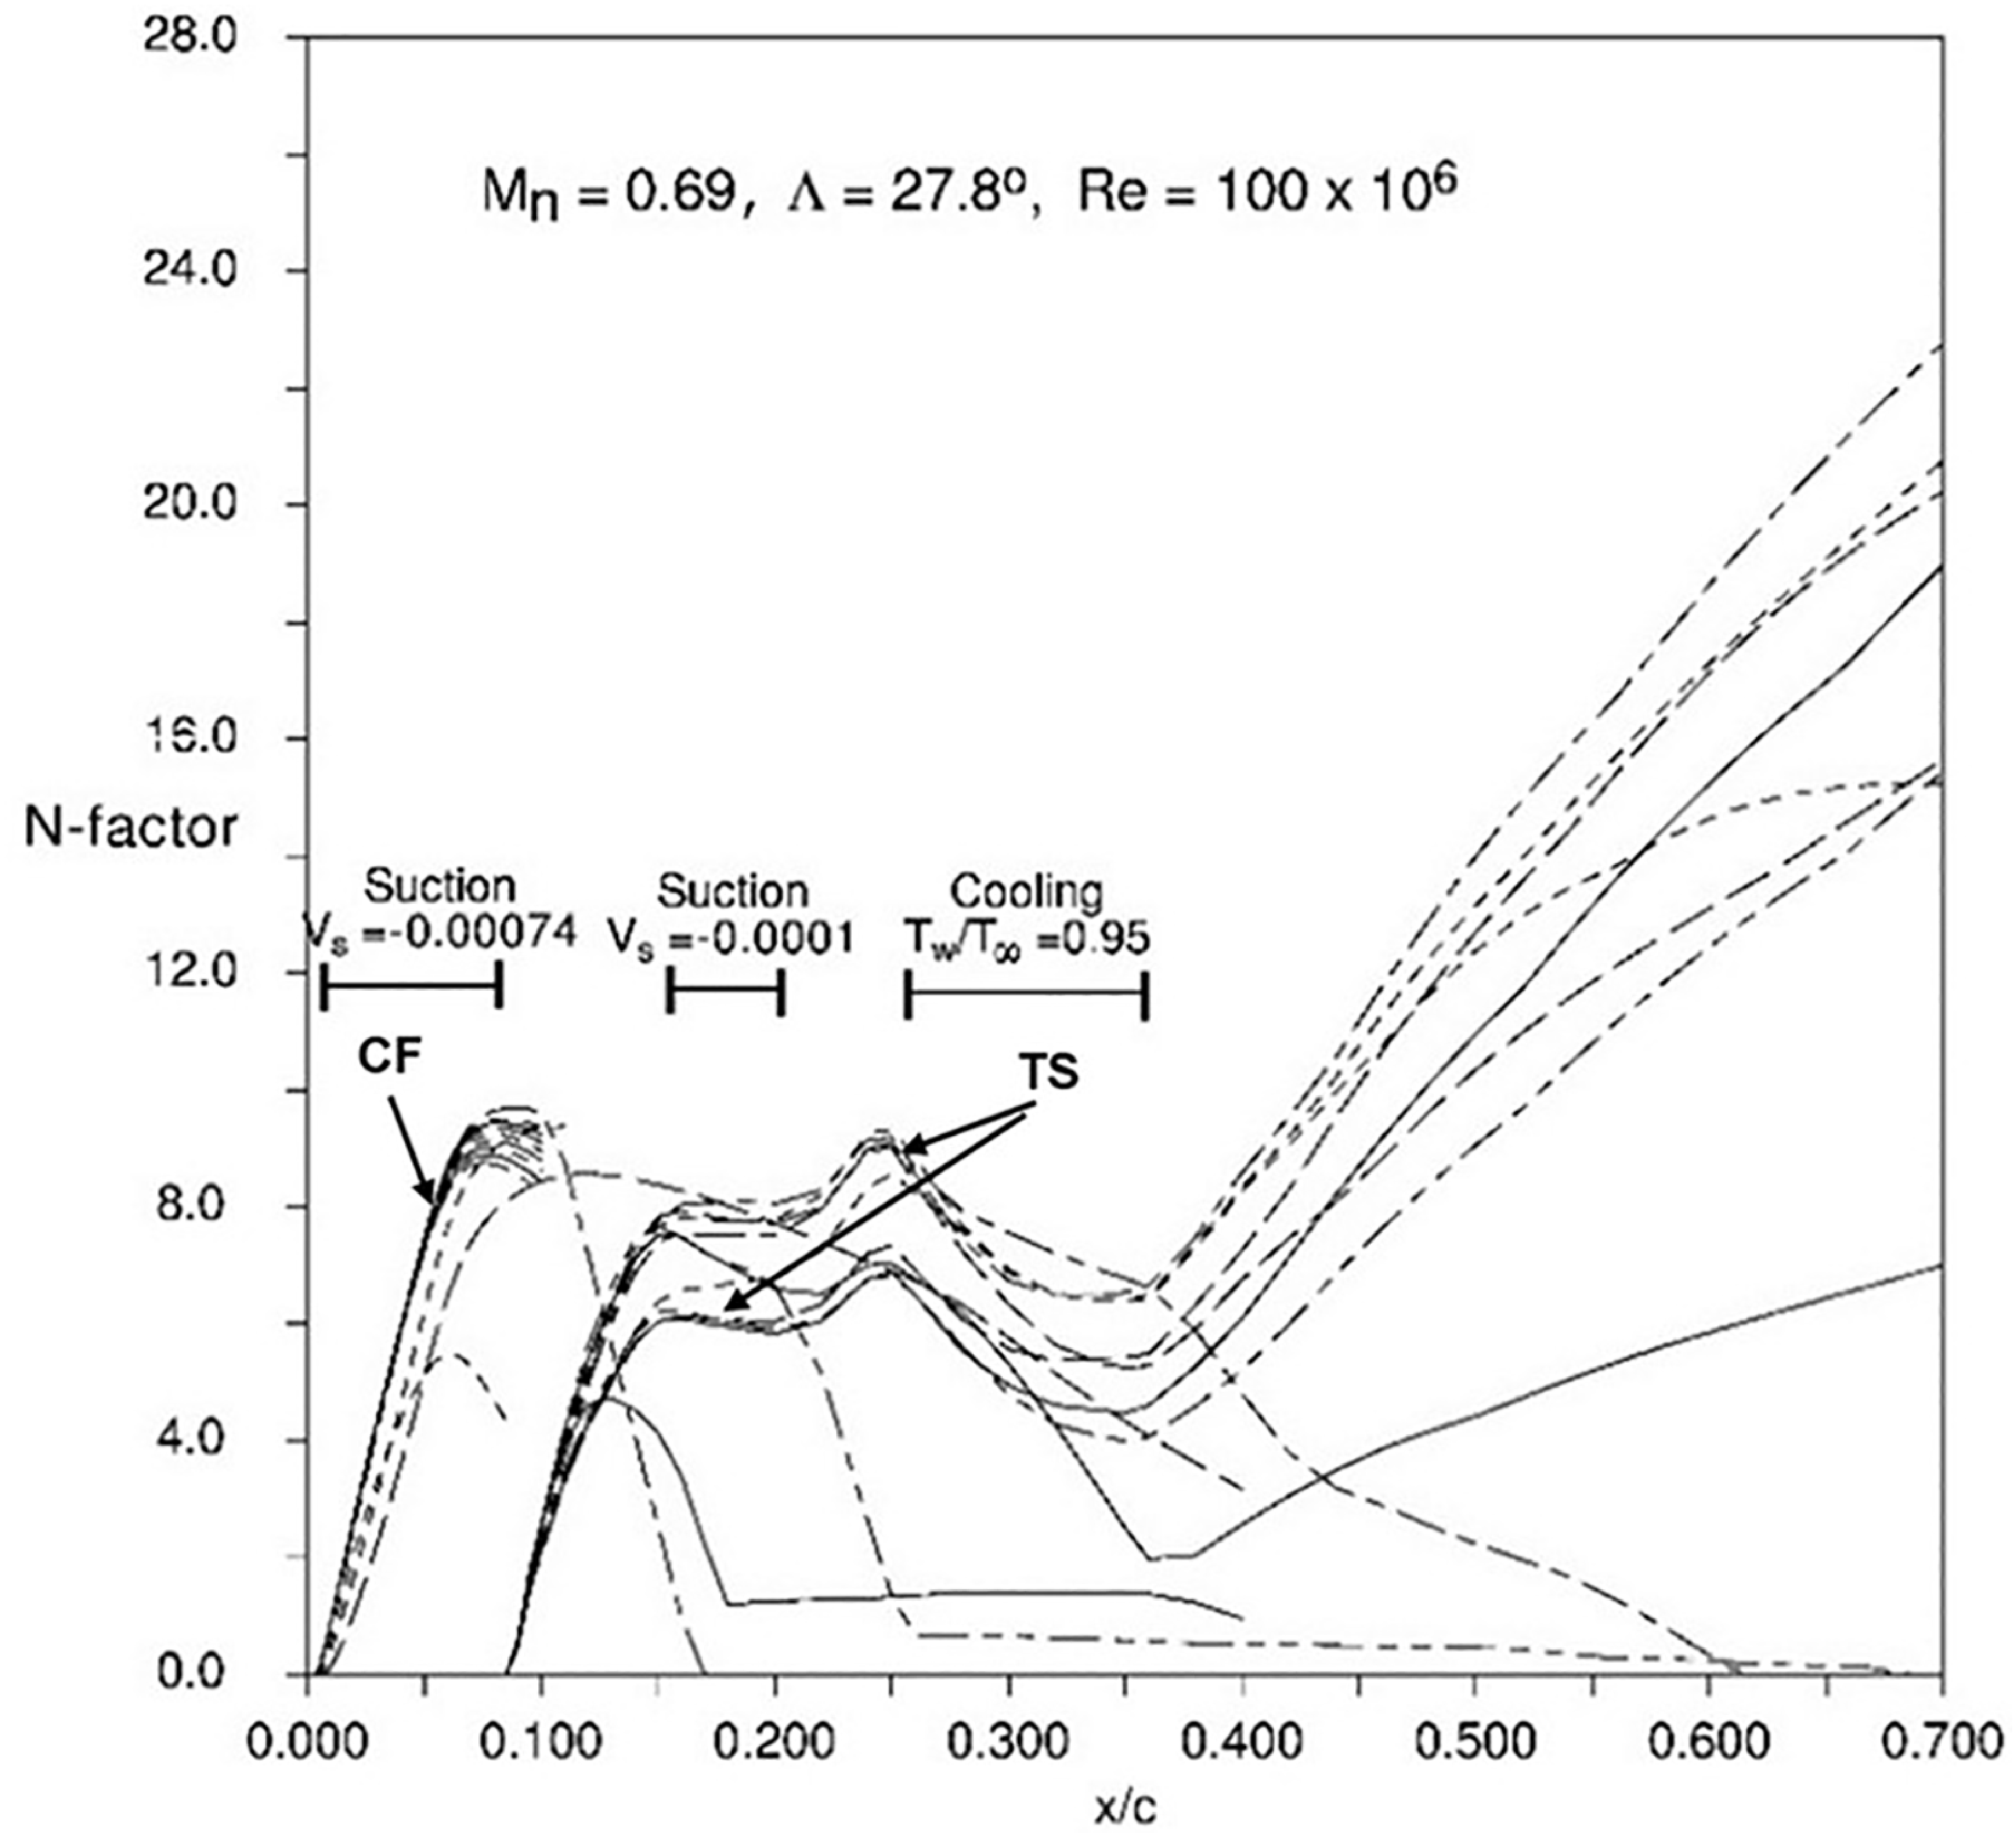
With the assumption that CF instability has been controlled and the onset of transition delayed to aft of the minimum pressure point, then TS instability would become the dominant mode for transition. Investigations carried out at ARA [Reference Wong and Maina3] have shown that the level of suction required for suppressing TS instability is much less than for CF. For most cases a suction velocity of about –0.0002 would be sufficient for a range of rooftop pressure gradients. It was also found that it is more effective to increase the suction panel length than the suction velocity in order to delay transition, as shown in Fig. 7. This implies the structural constraint of the suction panel forward of the front spar may limit the extent of laminar flow that could be achievable. This constraint may be overcome by the use of surface cooling instead of suction downstream of the front spar for suppressing TS instability. The cooling rates required were found to be low, generally about 10% below the ambient temperature is sufficient to delay transition significantly. A transition control methodology consisting of a successive number of suction panels forward of the front spar for suppressing the CF and TS instabilities, combined with cooling panels downstream of the front spar if further extent of laminar flow is required, as illustrated in Fig. 8, could be employed.
Effect of suction velocity on TS transition.

Effect of control methodology on disturbance growth.

There is current interest in the use of hydrogen fuel for engine propulsion for zero carbon emissions. The use of hydrogen as an alternative fuel remains a challenge and much research is required. The research could include investigations into the feasibility of using liquid hydrogen stored in low temperature, of the order of −250°C, to provide surface cooling to suppress the flow instabilities for delaying transition as shown in the transition control methodology in Fig. 8.
2.4 Single suction chamber and variable porosity technique
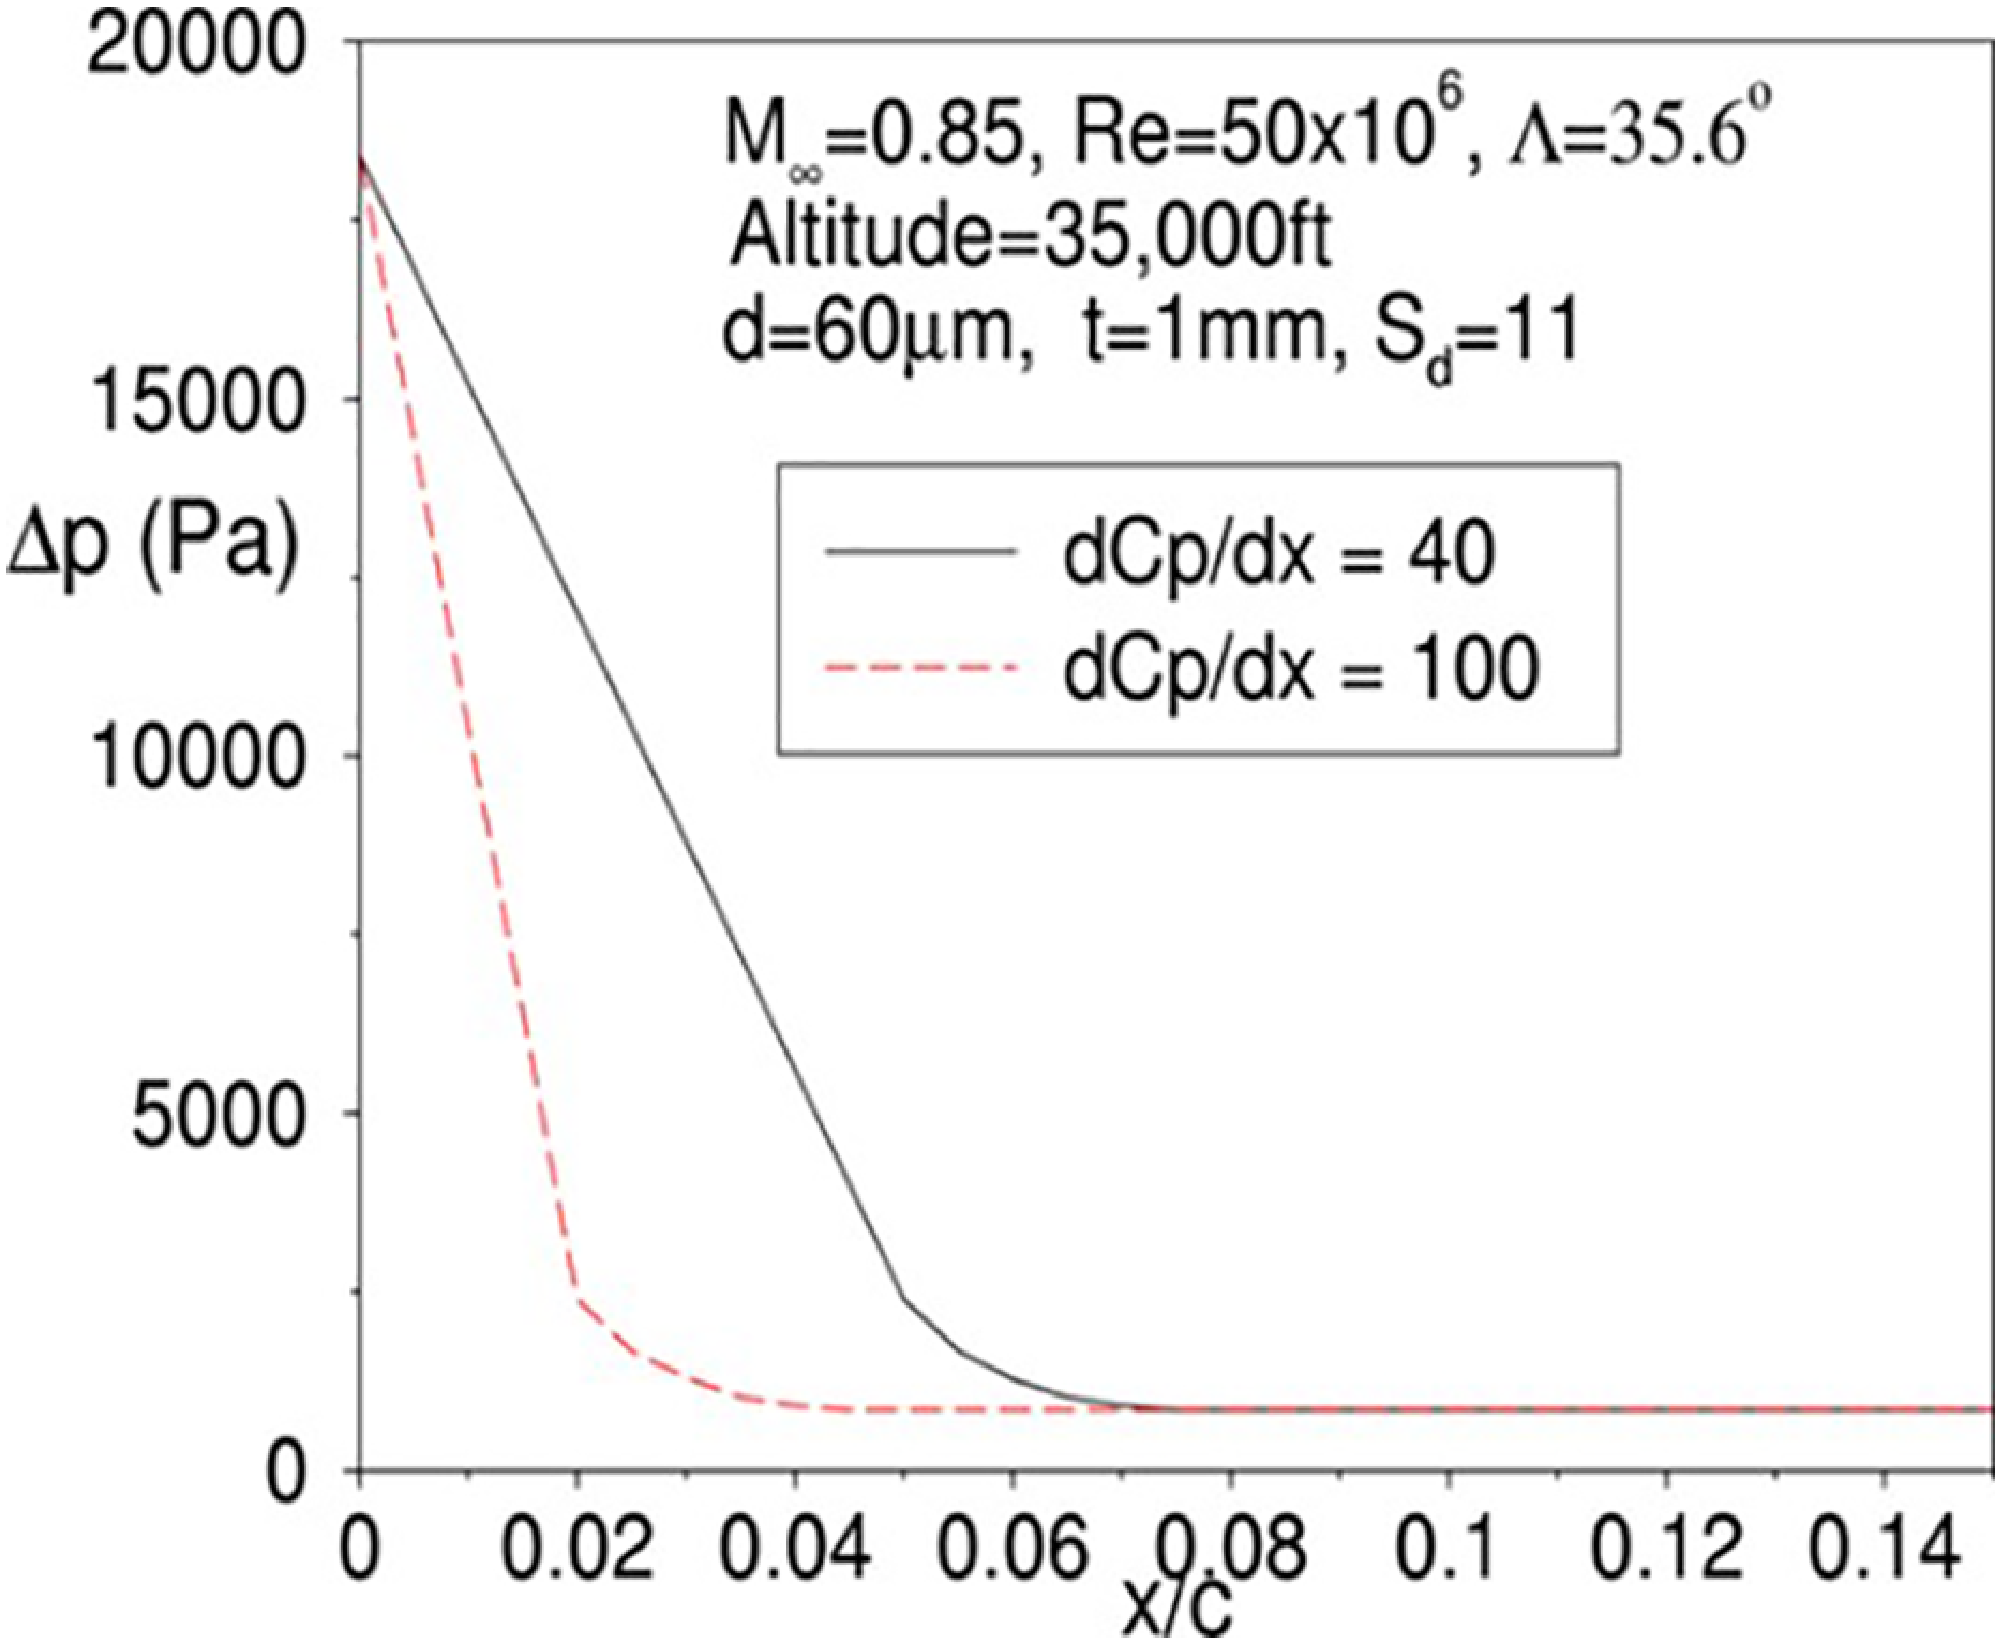
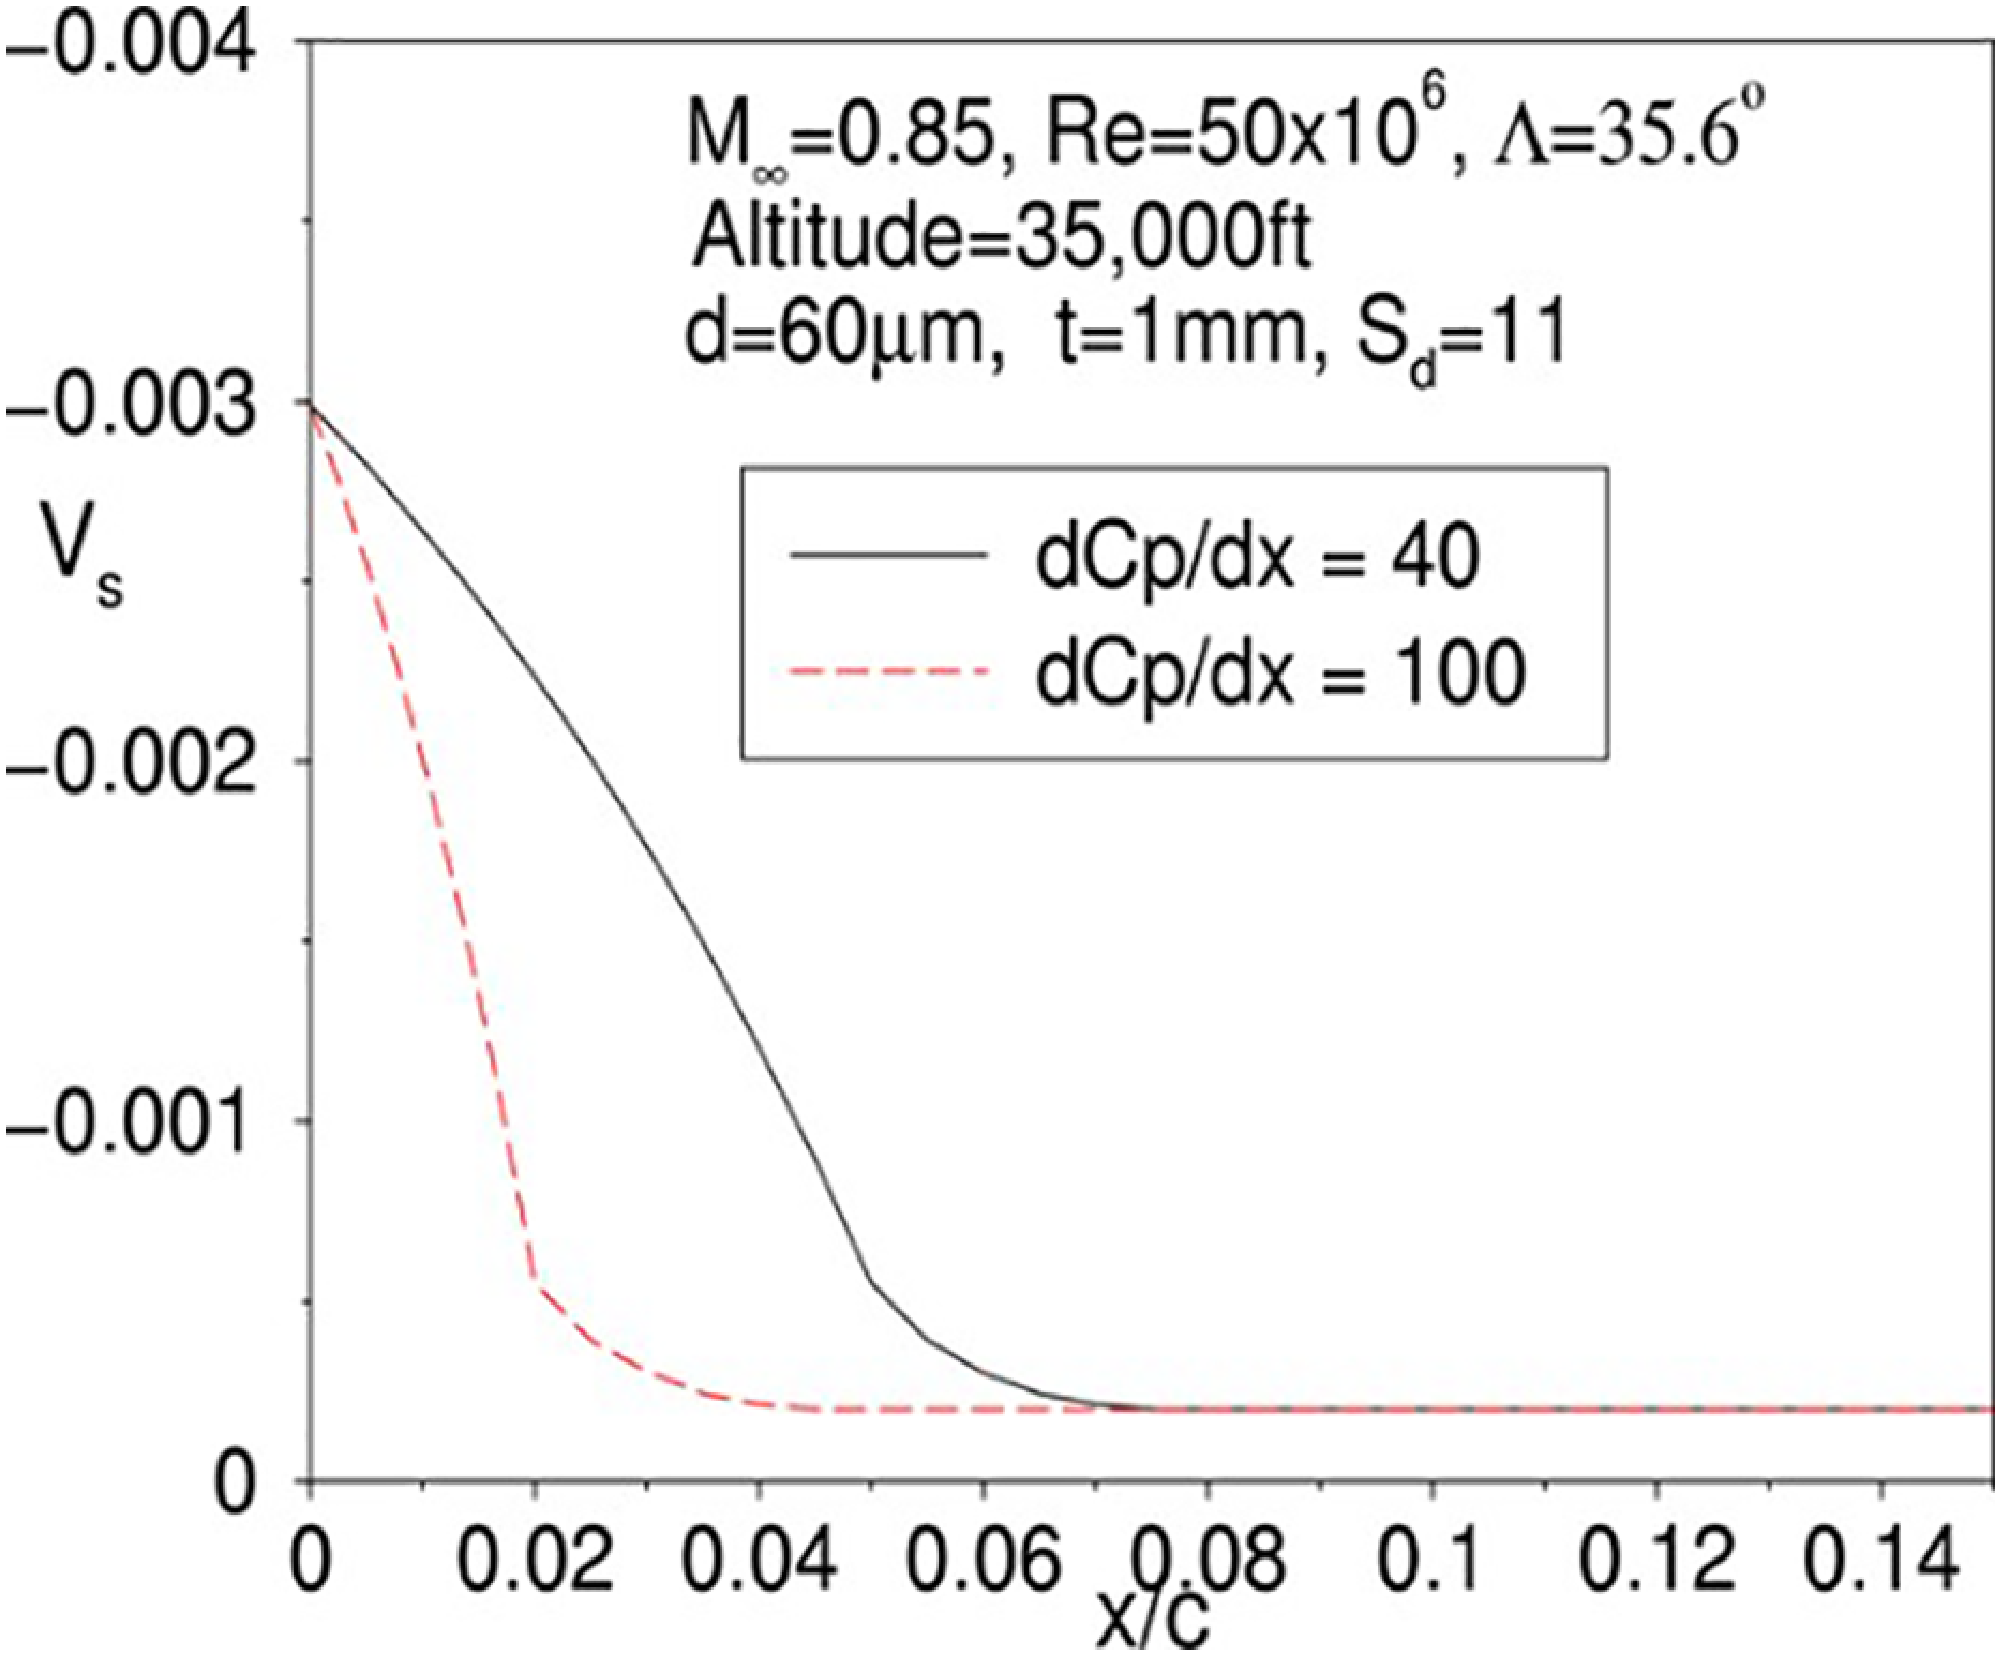
In the parametric studies described in Sections 2.2 and 2.3, the surface suction velocity, Vs, was specified directly in the transition prediction method, where the effect of the external pressure gradient on the surface suction velocity has not been taken into account. This effect is most pronounced in the leading-edge region due to the steep pressure gradient associated with the initial flow acceleration. The laminar boundary layer code, BL2D [Reference Atkin15, Reference Cobbin16], has been modified at ARA to allow the plenum chamber pressure and panel porosity to be specified as input data, rather than the suction velocity. The suction velocity is calculated by an empirical correlation based on the pressure difference across the porous skin [Reference Preist and Paluch18]. For a constant chamber pressure, the external pressure gradient shown in Fig. 2 can cause a large variation in the pressure difference (Δp) across the porous panel and hence the suction velocity distribution (V s), as illustrated in Figs 9 and 10.
Pressure difference variation.

Suction velocity variation.

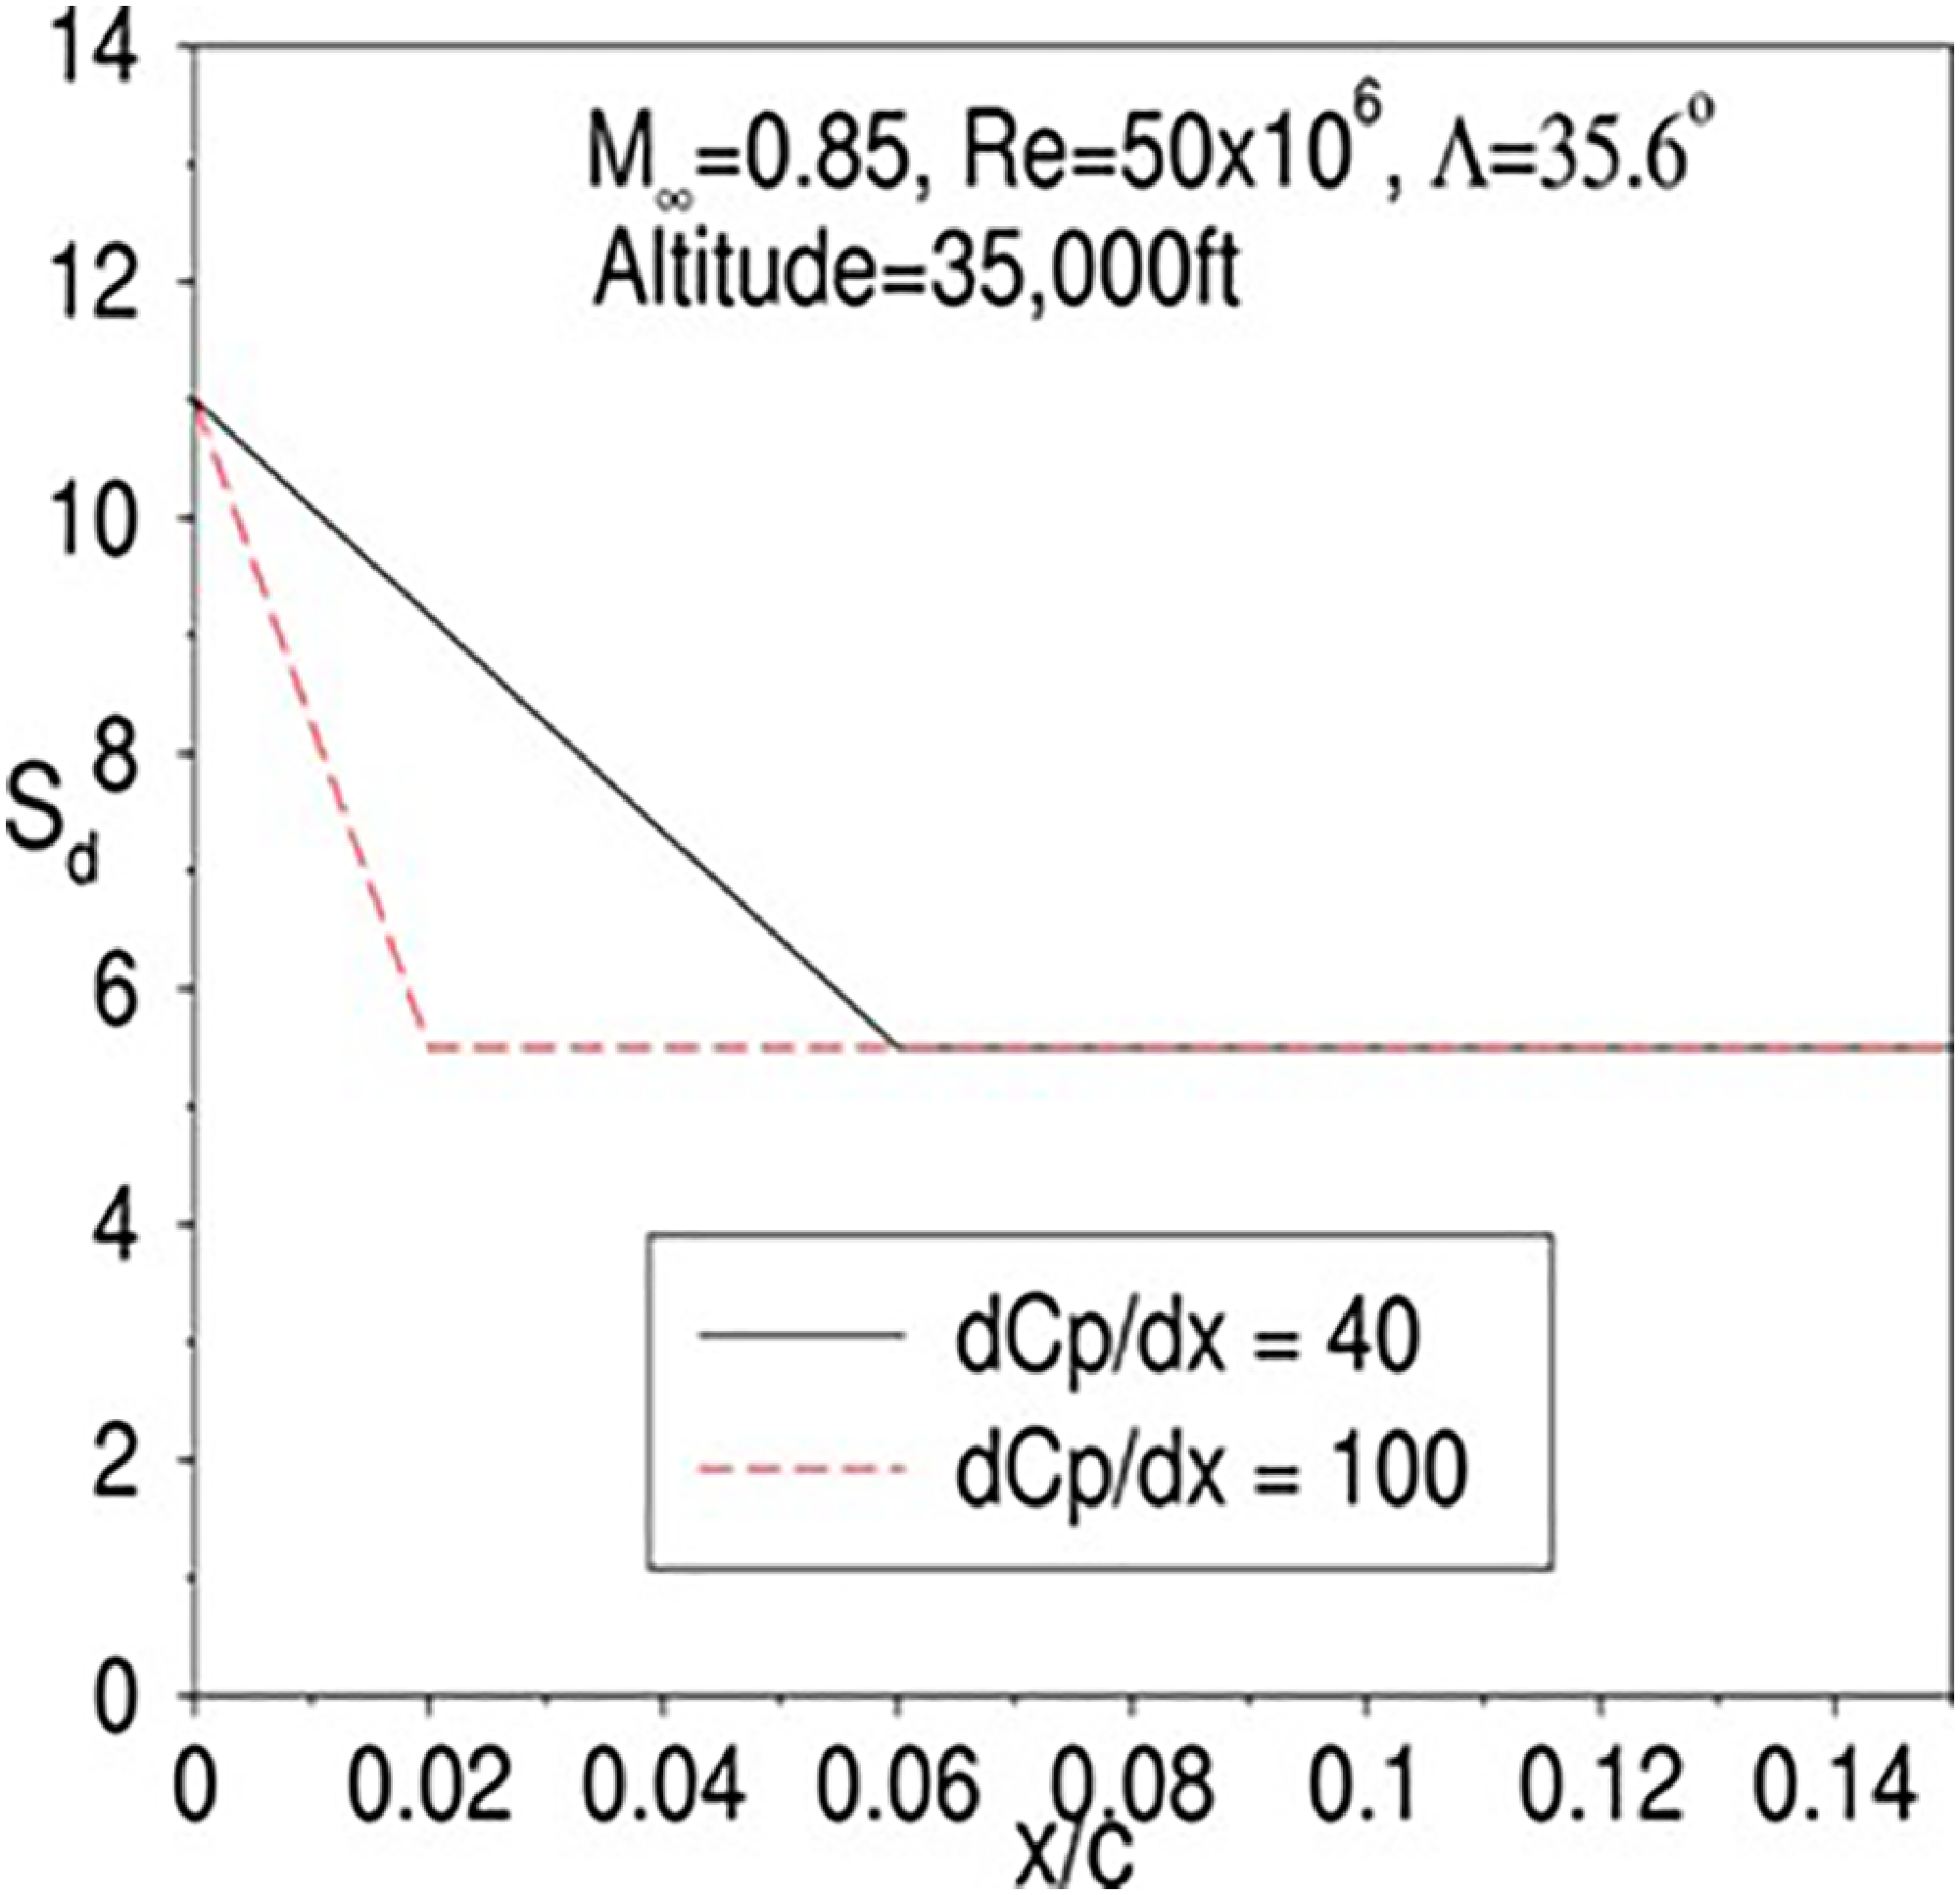
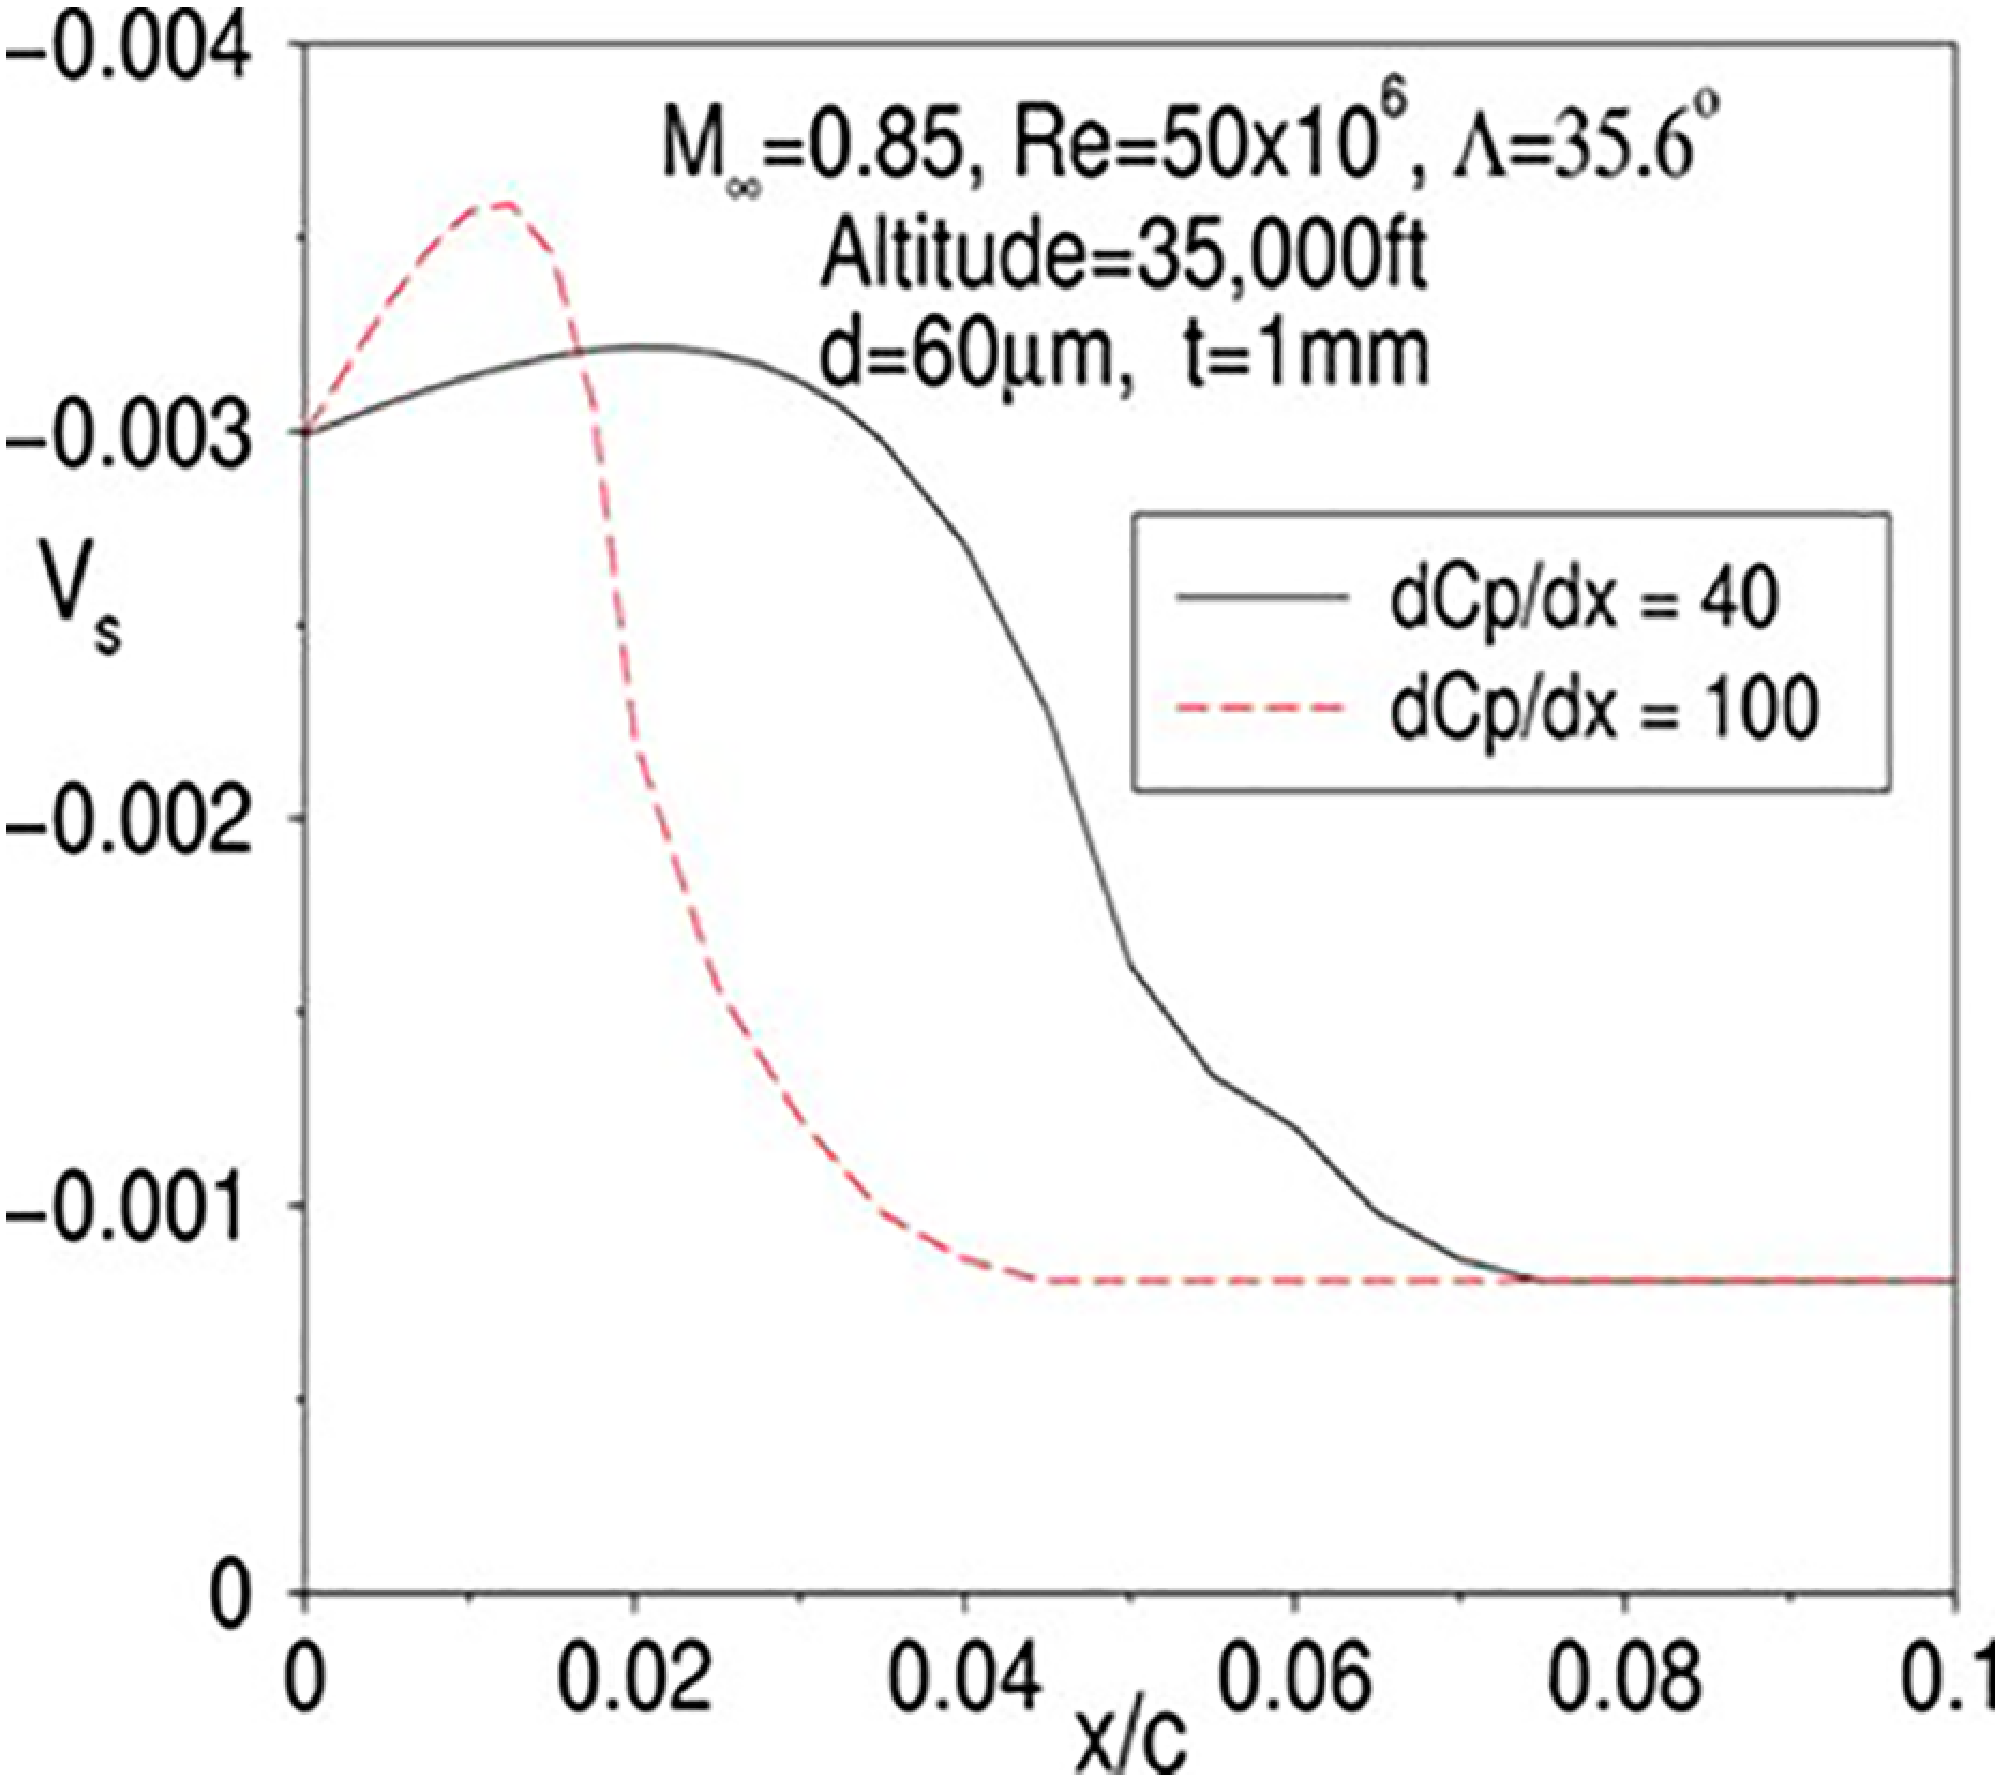
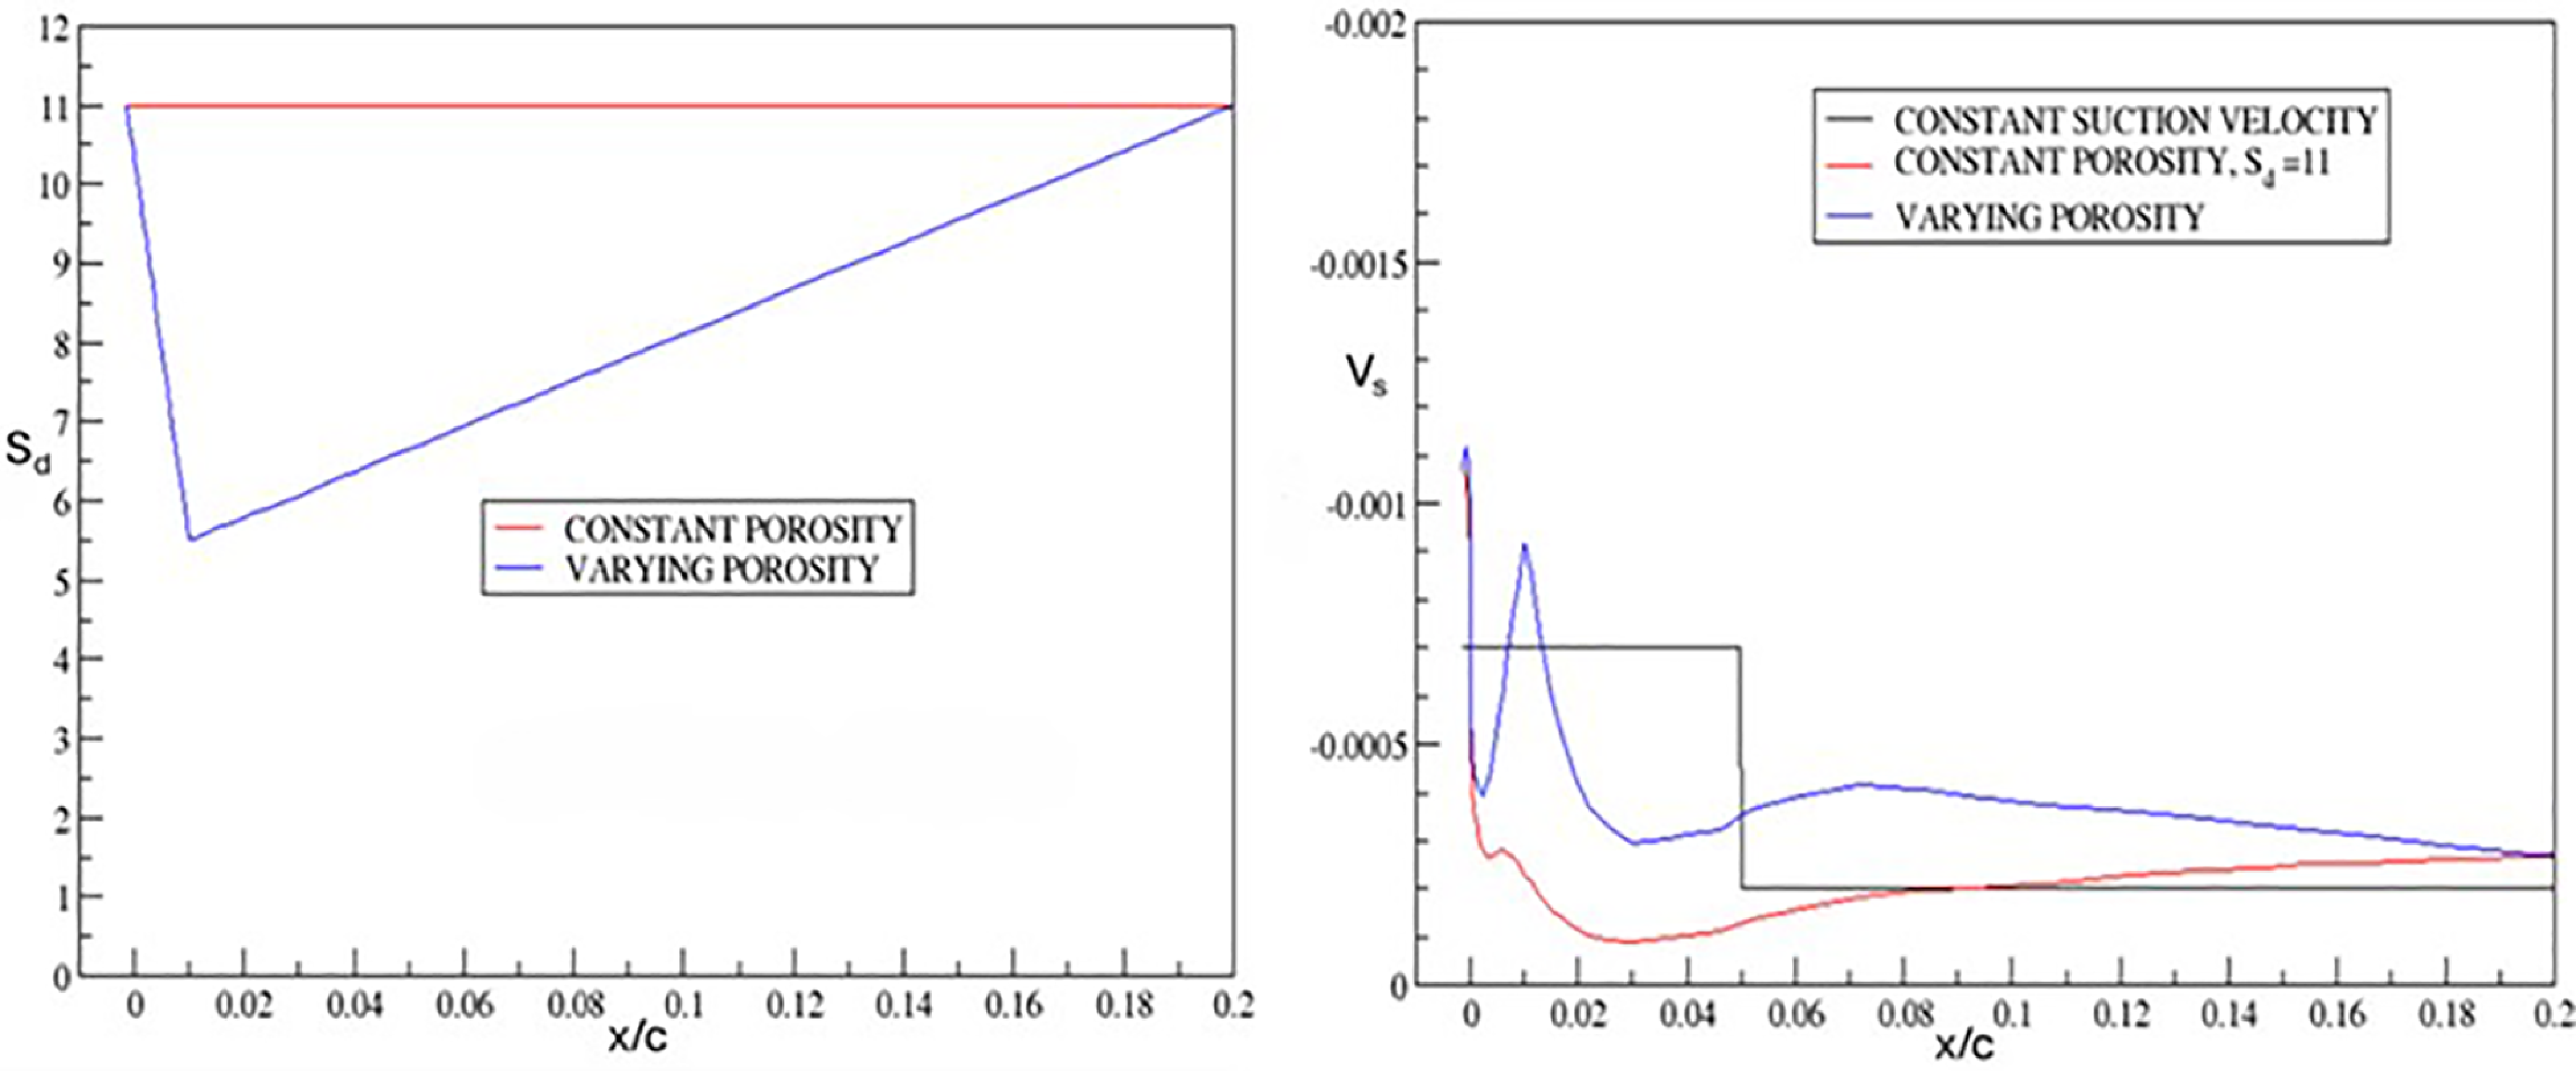
One approach to resolving this problem is the use of a number of separate suction chambers within a double sheet suction surface [Reference Horstmann, Schrauf, Sawyers and Sturn4], where the suction velocity in each chamber is controlled by orifices in the inner sheet and a constant speed suction pump directly coupled with the leading-edge box. To minimise the number of plenum chambers in order to reduce system complexity, ARA has developed an alternative approach to vary the suction panel porosity to balance the effect of pressure gradient [Reference Wong, Maina and Doig5]. A parameter that affects the panel porosity is the ratio of hole spacing to hole diameter (S d), where a higher value would give a lower suction velocity. In order to provide a uniform suction velocity across the region with an initial steep pressure gradient, a higher initial value of Sd can be applied at the leading-edge with the value reduced linearly with distance, as shown in Fig. 11. It can be seen that the suction velocity distributions in Fig. 12 given by the porosity variation are now much more uniform across the initial pressure gradient region. The level of the suction velocity can be further controlled by the hole diameter and/or skin thickness.
Porosity variation.

Suction velocity variation.

3.0 Application of transition control methodology to a supersonic aircraft
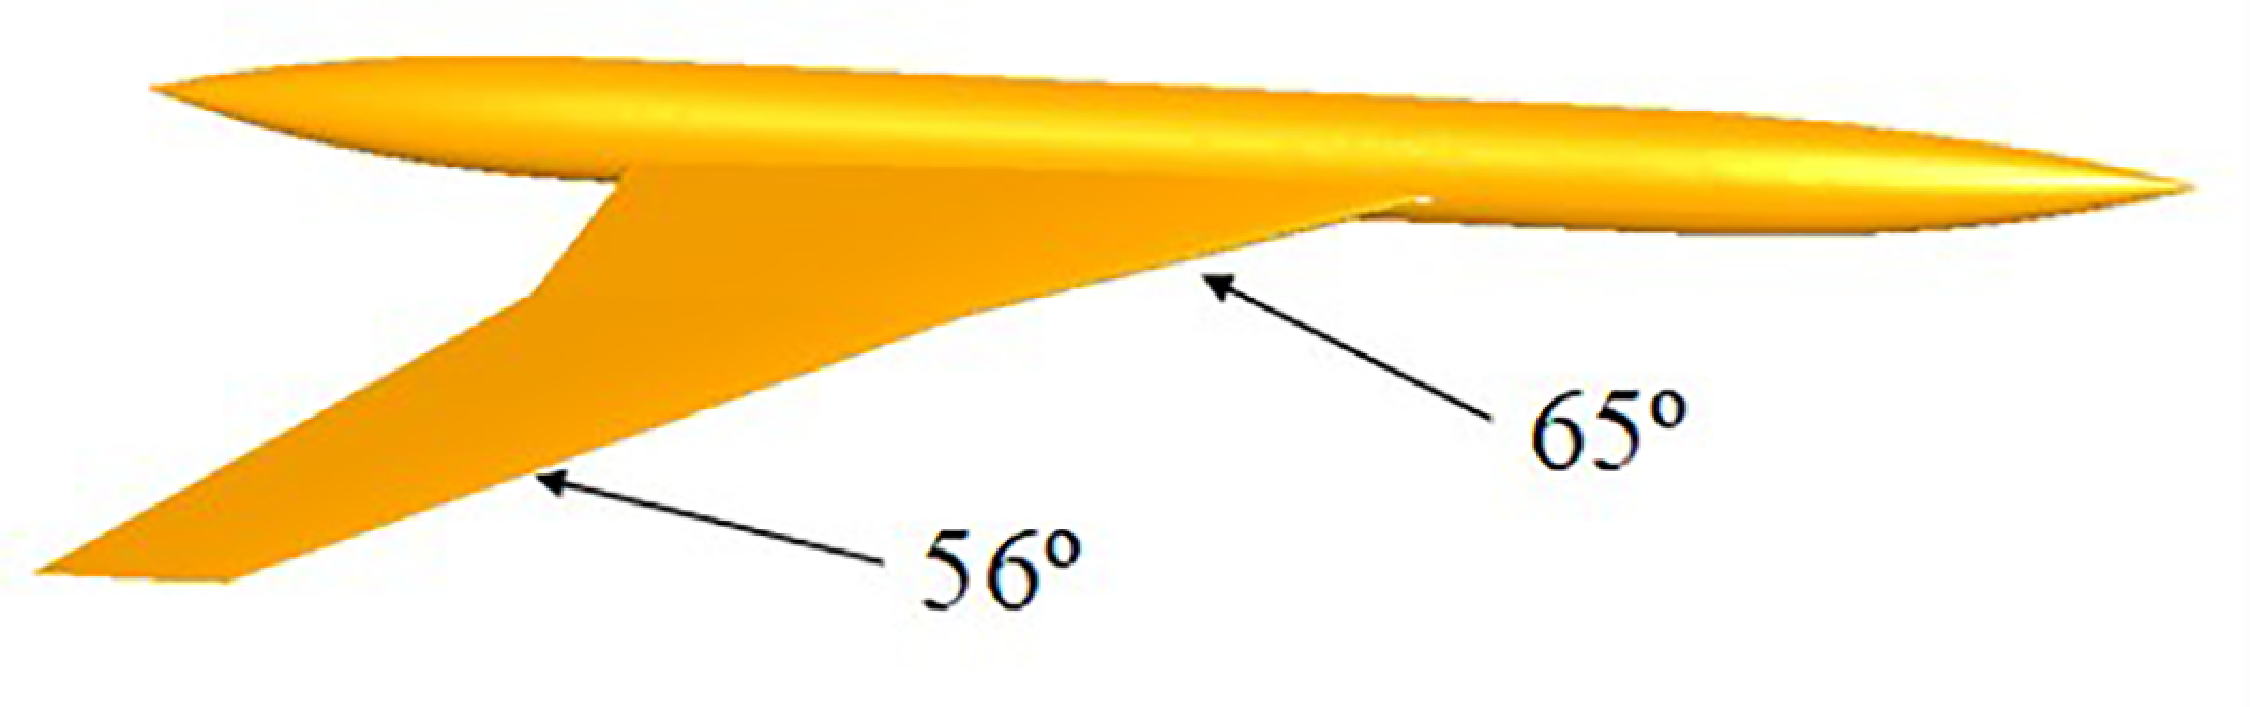
The single plenum chamber with varying porosity approach to control the suction velocity distribution has also been shown to be applicable to supersonic aircraft [Reference Wong6] in a EU-funded project called HISAC (High Speed Aircraft). The HISAC generic baseline configuration that was used for the transition control study is shown in Fig. 13.
HISAC baseline geometry.

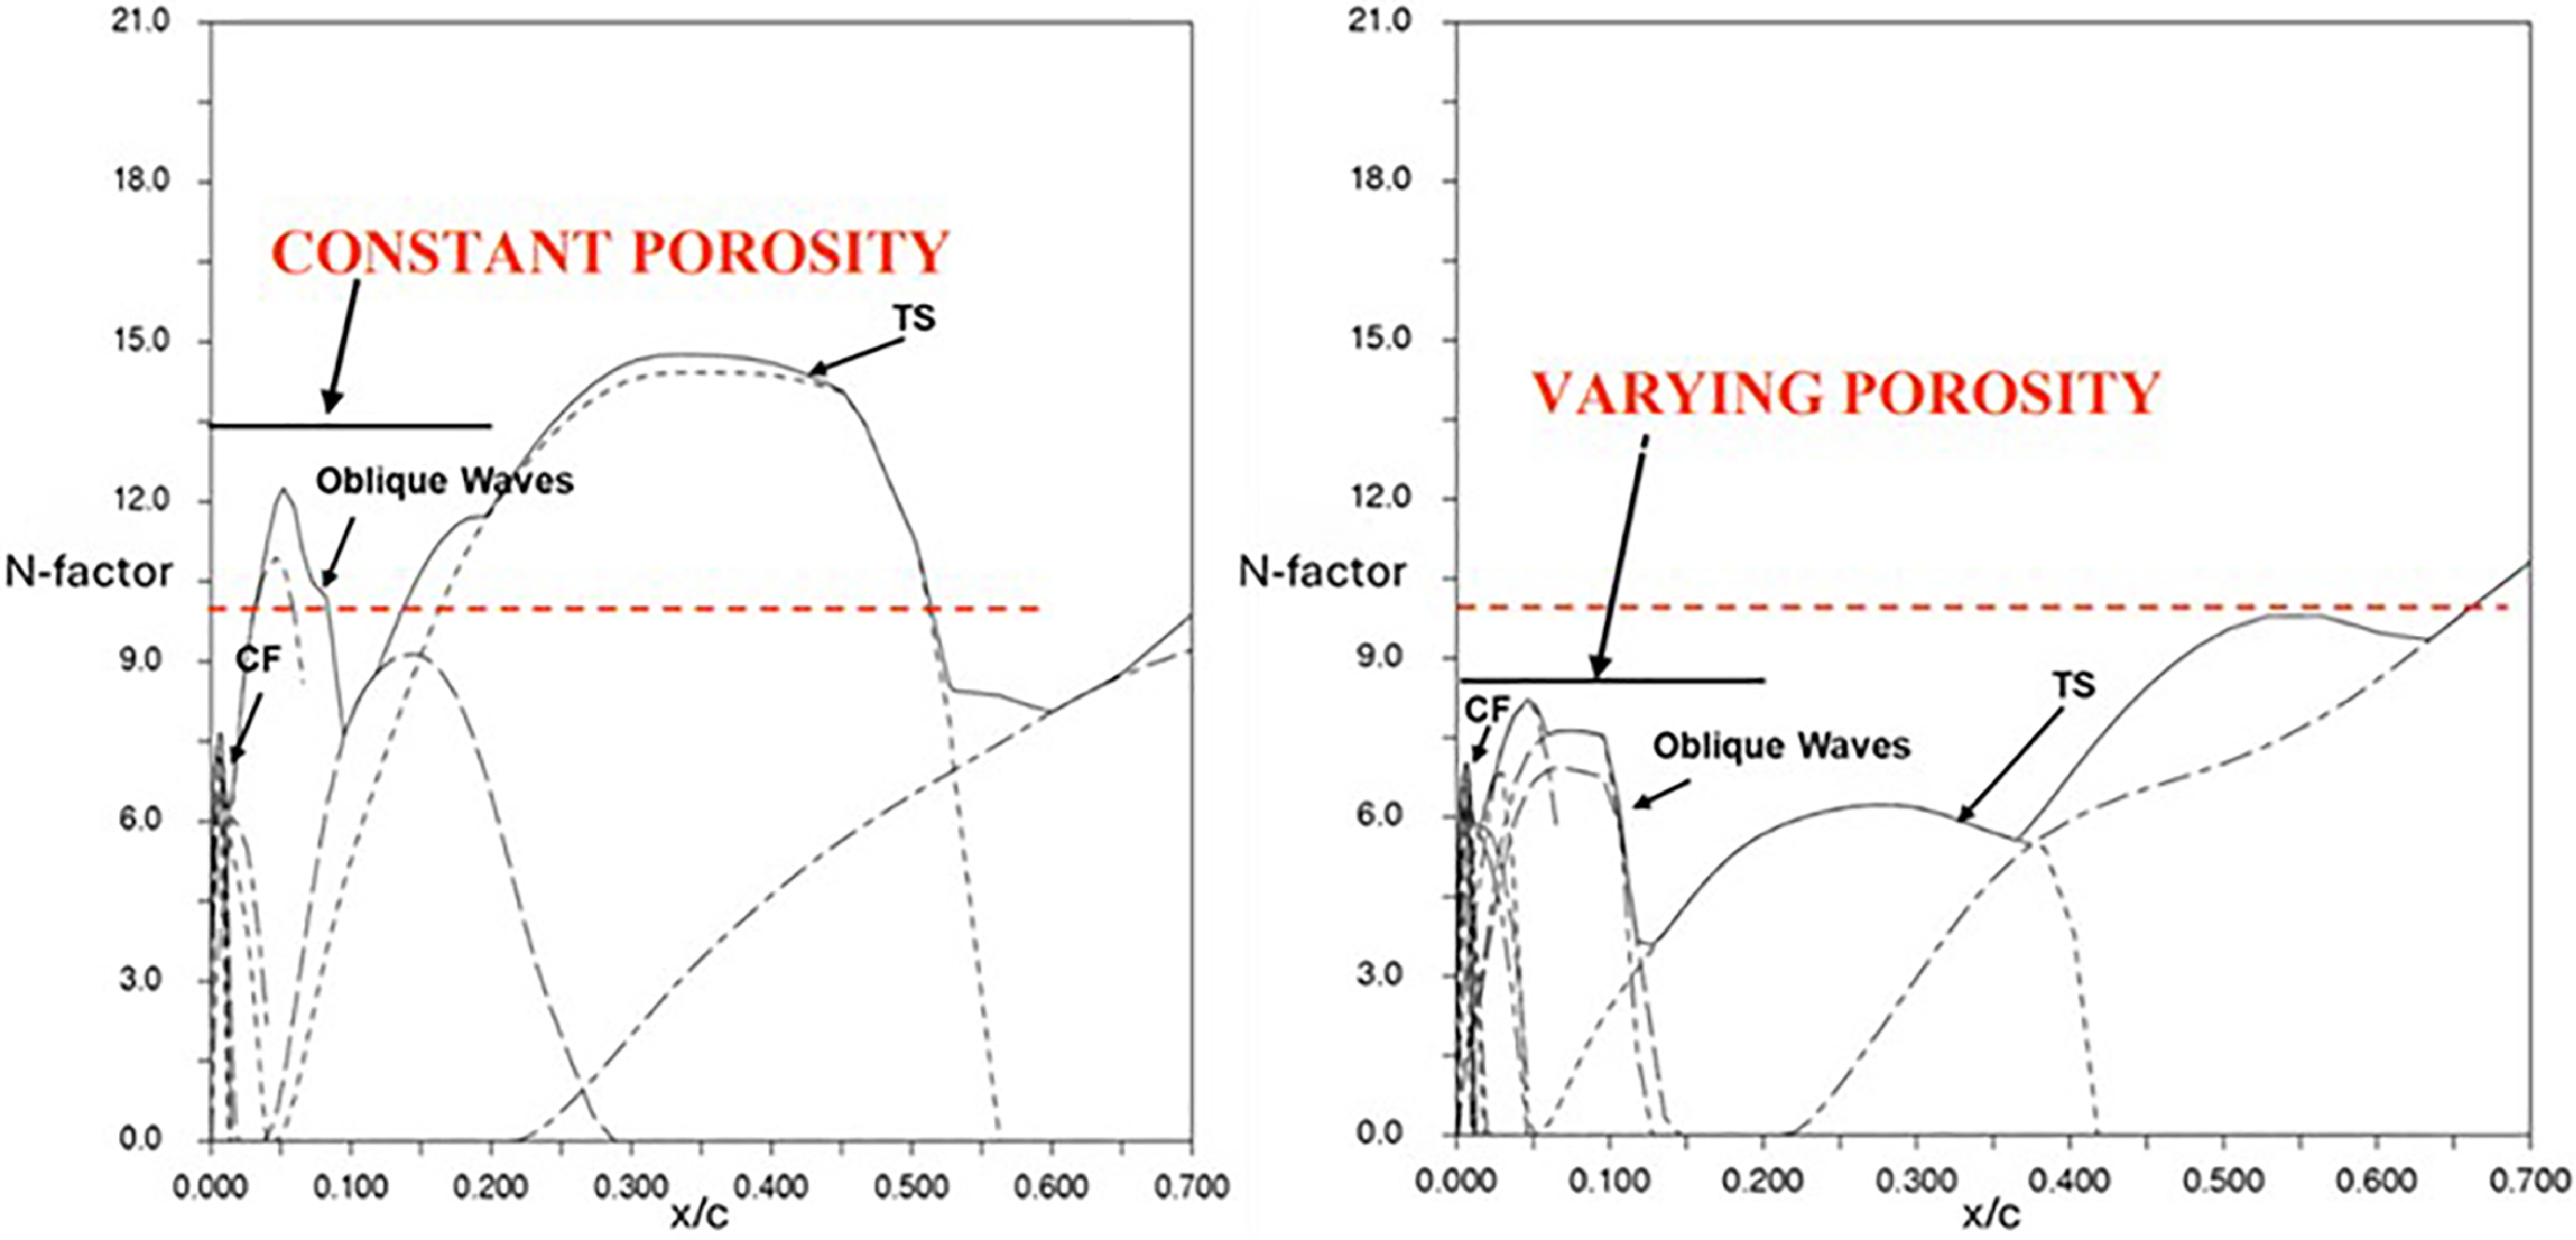
The porosity variation for controlling the suction velocity due to the effect of the pressure gradient in the initial accelerated flow leading-edge region is illustrated in Fig. 14, where Sd is reduced linearly with distance by a factor of a half from 0 to 1% chord and then increased linearly by a factor two from 1 to 20% chord to re-arrive at the initial level. The effect of this variation in porosity on the surface suction velocity distribution for the wing C L = 0.1 case, assuming the same chamber pressure, is also shown in Fig. 14. The level of suction velocity has been increased compared with that given by constant porosity. For constant porosity, the chamber pressure would need to be reduced significantly to increase the level of suction velocity to that of variable porosity. This resulted with a high suction velocity at the leading edge which could lead to the problem of over-suction causing transition. The aim is to keep the level of suction velocity in the order of −0.001 to avoid over-suction. The N-factor distribution for transition has been reduced due to the increased in suction velocity as can be seen in Fig. 15, where a significant extent of laminar flow to 65% chord for the inboard wing has been achieved with variable porosity if transition onset is assumed to occur at N-factor of 10. The disturbances due to CF and TS are indicated in Fig. 15. The disturbances with the presence of both strong CF and TS, identified as oblique waves in a supersonic boundary layer, are also indicated in Fig. 15.
Porosity distributions and suction velocity variation, inboard wing, M = 1.6, C L = 0.1, Re = 75.3 × 10⁶.

Effect of porosity distribution on the N-factor distributions, inboard wing, M = 1.6, C L = 0.1, Re = 75.3 × 10⁶.

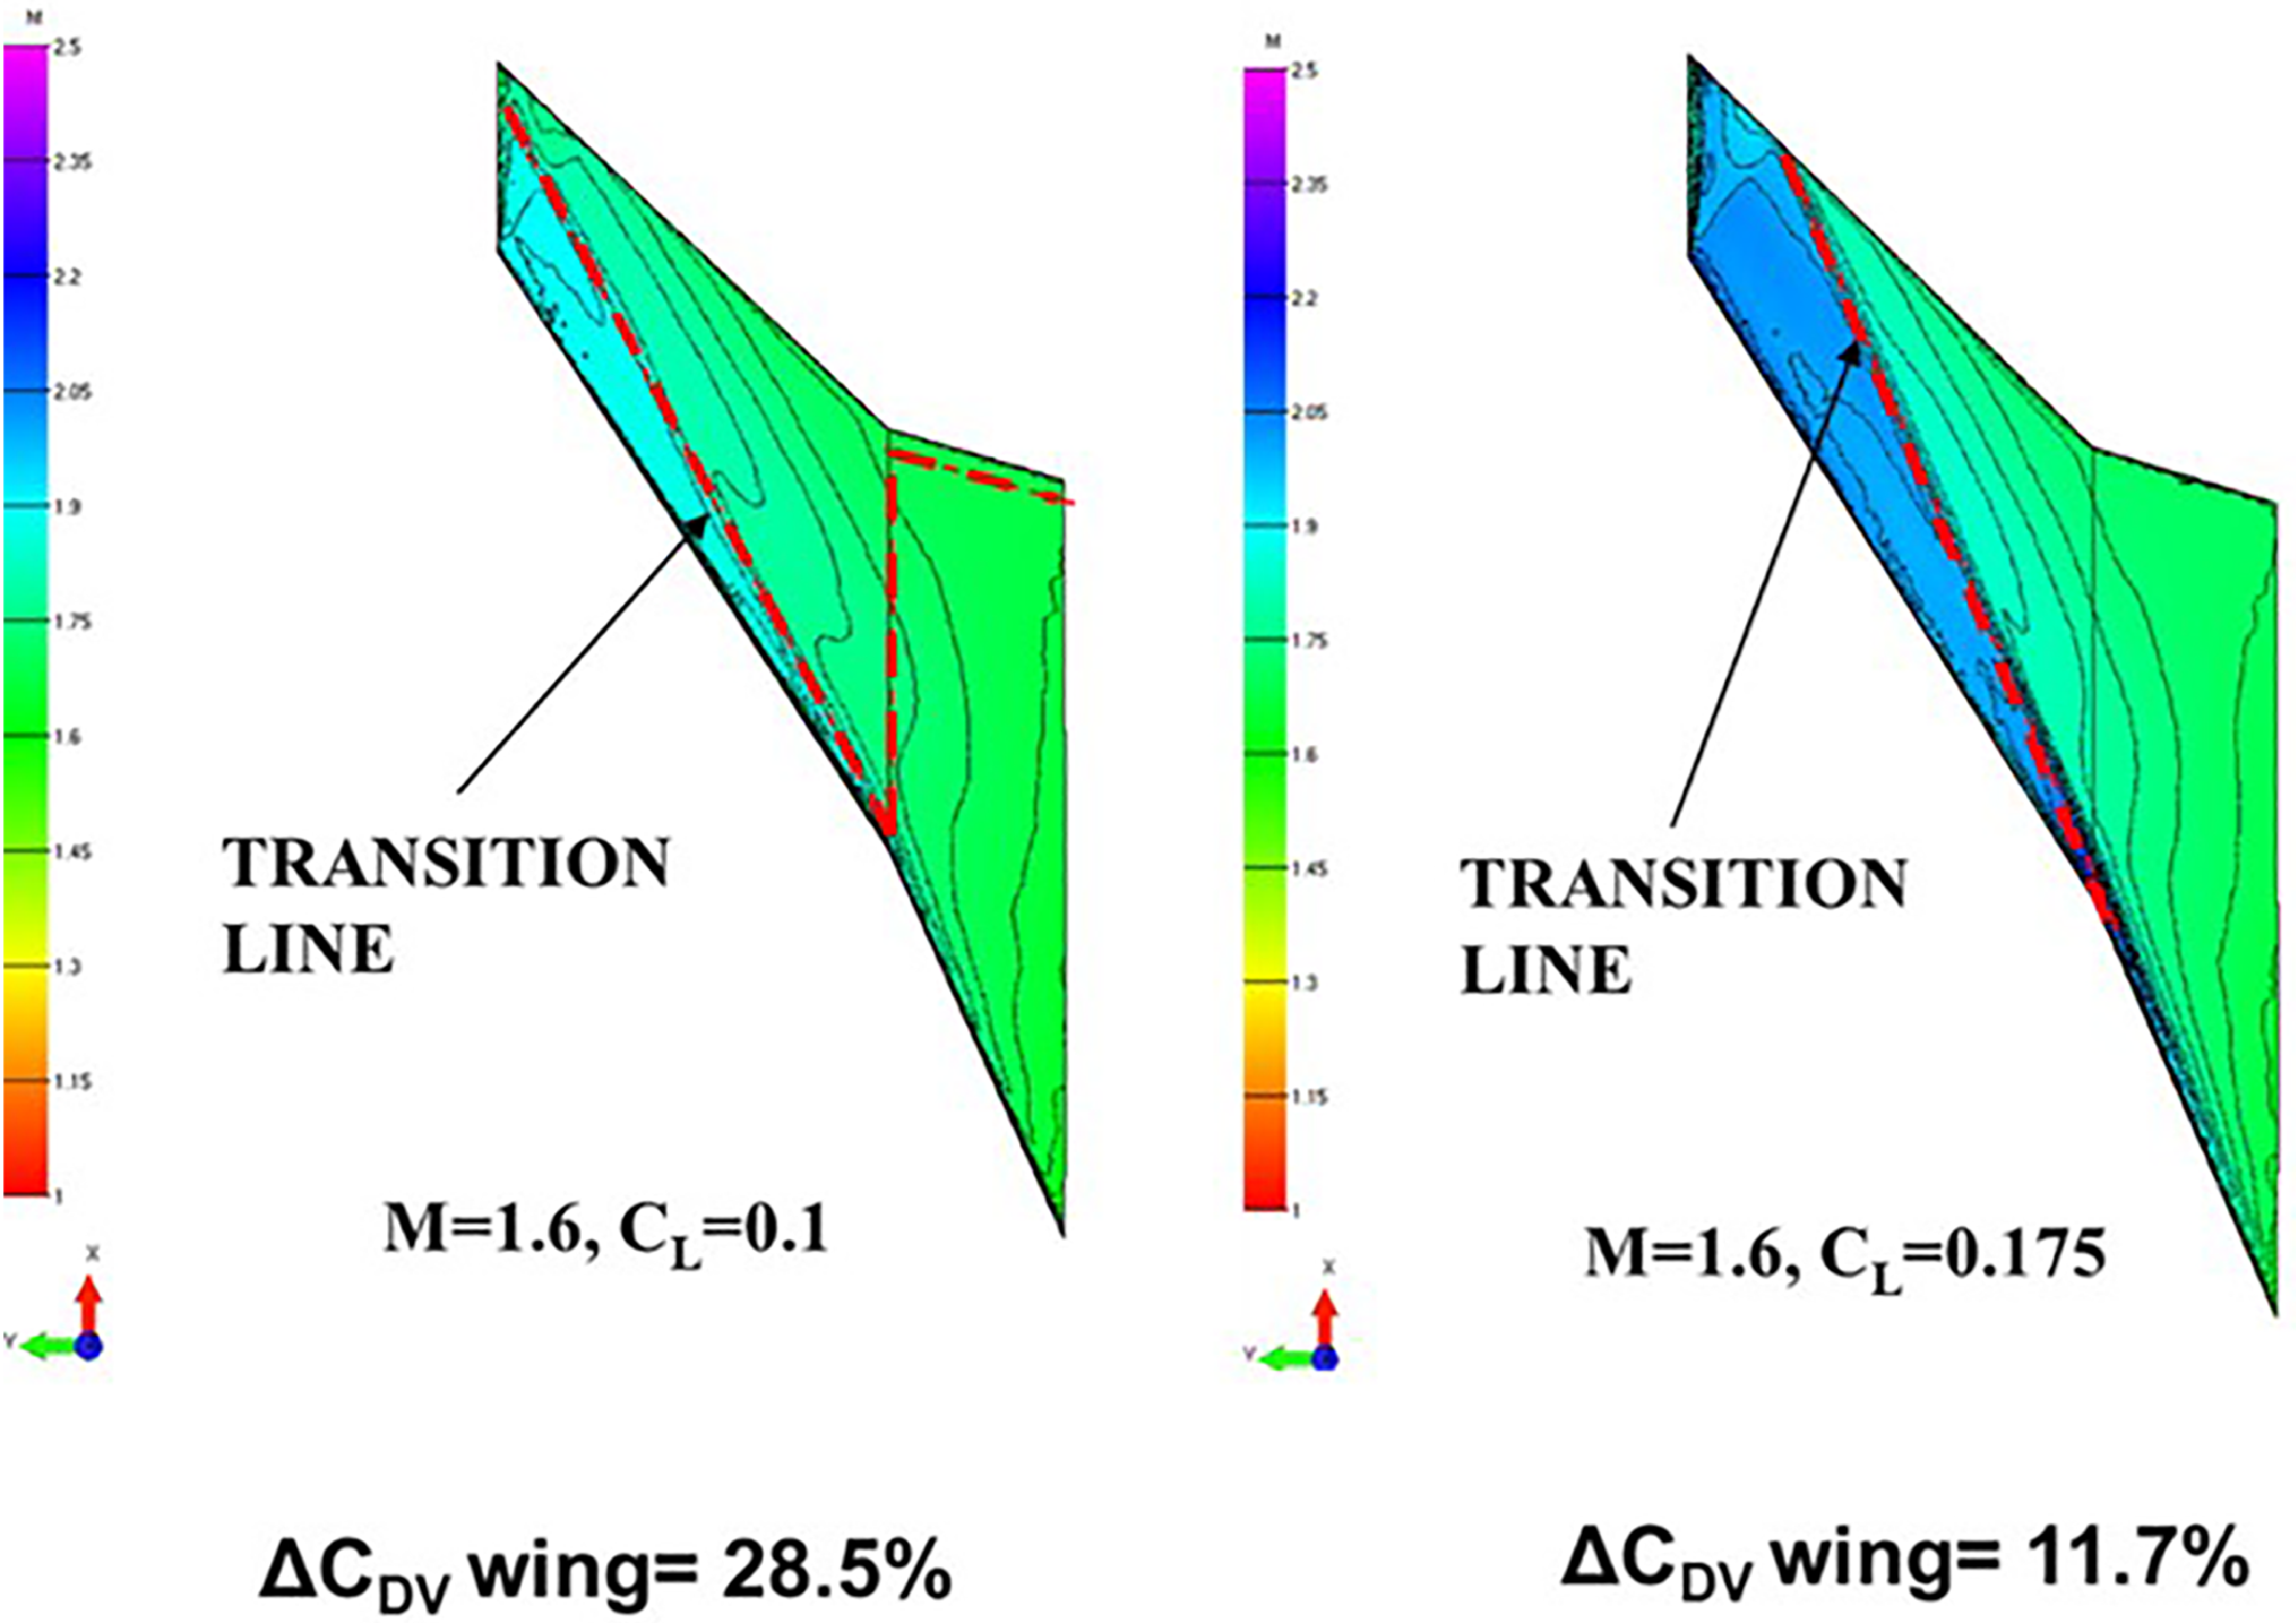
The extent of laminar flow achieved using the variable porosity technique has resulted with a drag reduction (ΔC DV) of 28.5% for C L = 0.1 and 11.7% for C L = 0.175 at the cruise Mach number M = 1.6, as shown in Fig. 16.
Mach number contours and transition locations of wing upper surface with surface suction applied.

4.0 Choice of pressure distributions
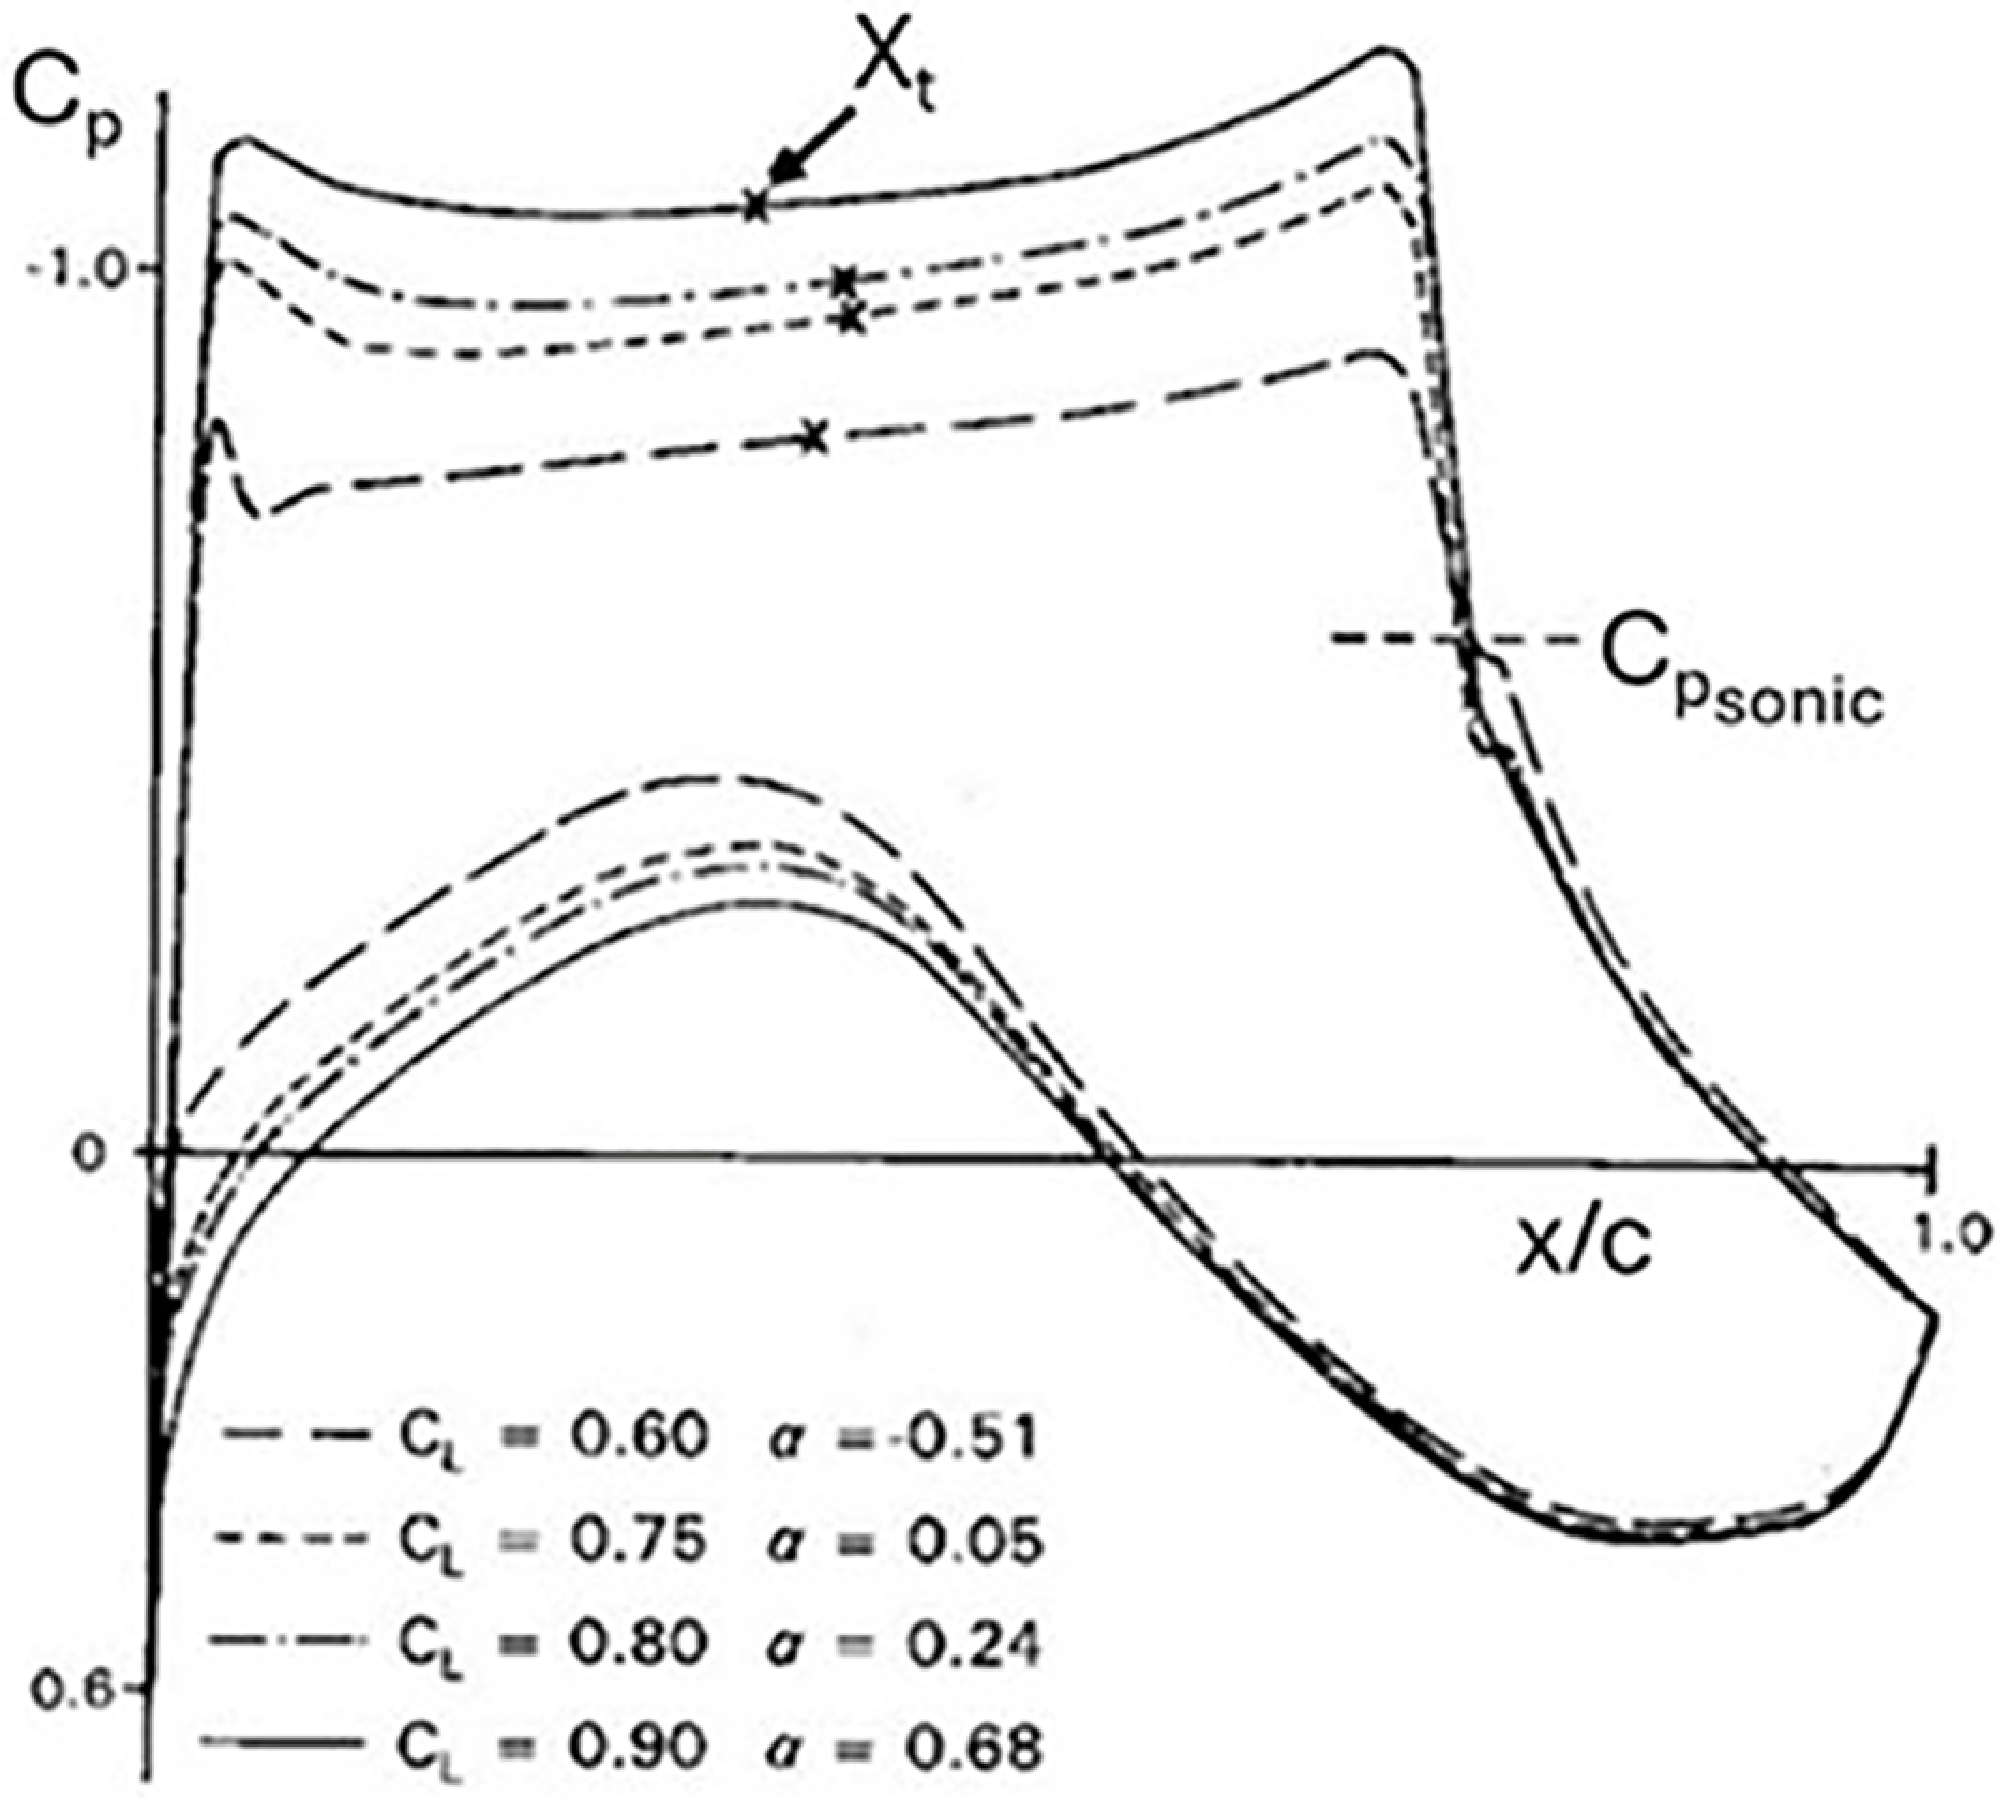
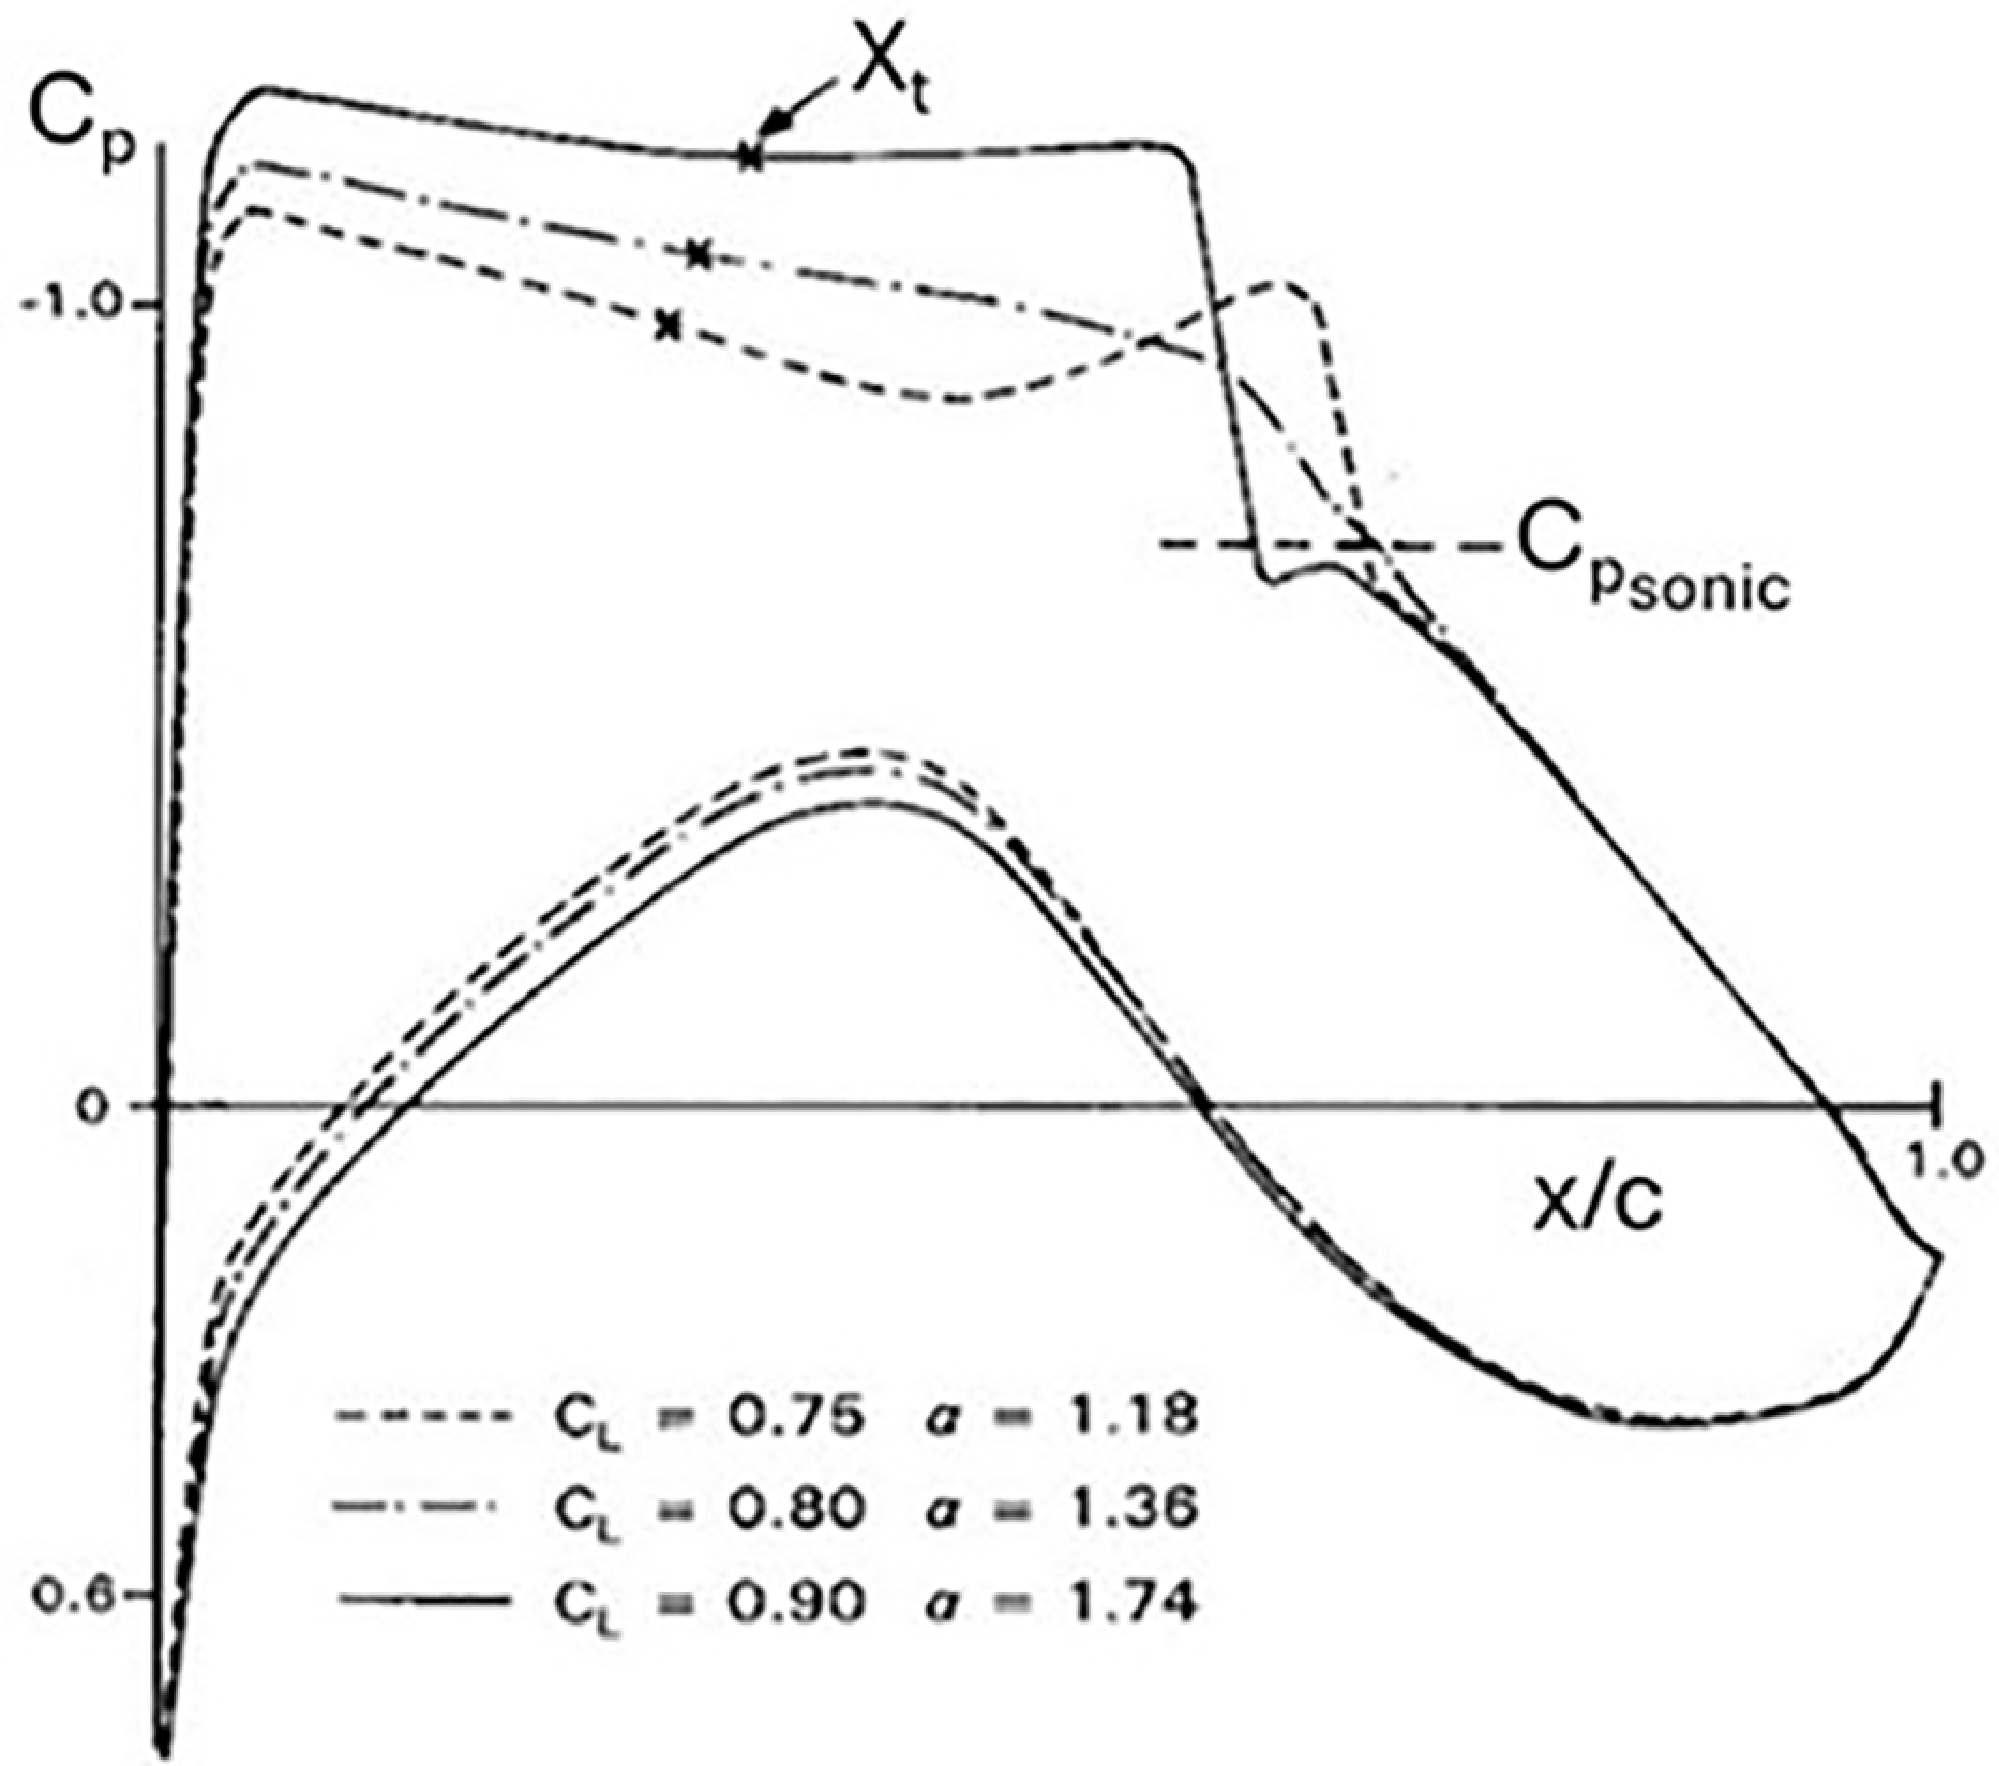
It is difficult to choose an appropriate ‘rooftop’ pressure distribution for optimum aerodynamic performance in HLFC wing design. For maximising the laminar flow extent, pressure distributions with a favourable ‘rooftop’ gradient are usually regarded as the most appropriate. However, in addition to viscous drag reduction, wave drag and lift capability are important considerations for HLFC wing design. ARA has been investigating these design issues since the 1990s [Reference Wong and Maina1, Reference Wong and Maina2, Reference Wong and Walters7]. The design issues can be illustrated by an analysis of the aerodynamic performance characteristics of two aerofoils with pressure distributions, which may be suitable for HLFC application, one with a favourable ‘rooftop’ pressure gradient and the other with an adverse pressure gradient. Both aerofoils have a shock location at 60–70% chord in the design condition, as shown in Figs 17 and 18, with a potential of achieving a significant extent of laminar flow in HFLC. The aerofoils may be regarded as being equivalent to three-dimensional sections on an infinite yawed wing for which the leading-edge sweep is representative of current civil transport wings. The investigation was carried out before the development of the variable porosity concept. A suction velocity of −0.0007 from 0 to 5% chord and −0.0002 from 5 to 15% chord, based on the results obtained in the transition control methodology described in Section 2, has been applied for suppressing CF and TS instabilities respectively to allow a significant extent of laminar flow.
Favourable pressure gradient aerofoil, M = 0.75, Re = 35 × 106.

Adverse pressure gradient aerofoil, M = 0.75, Re = 35 × 106.

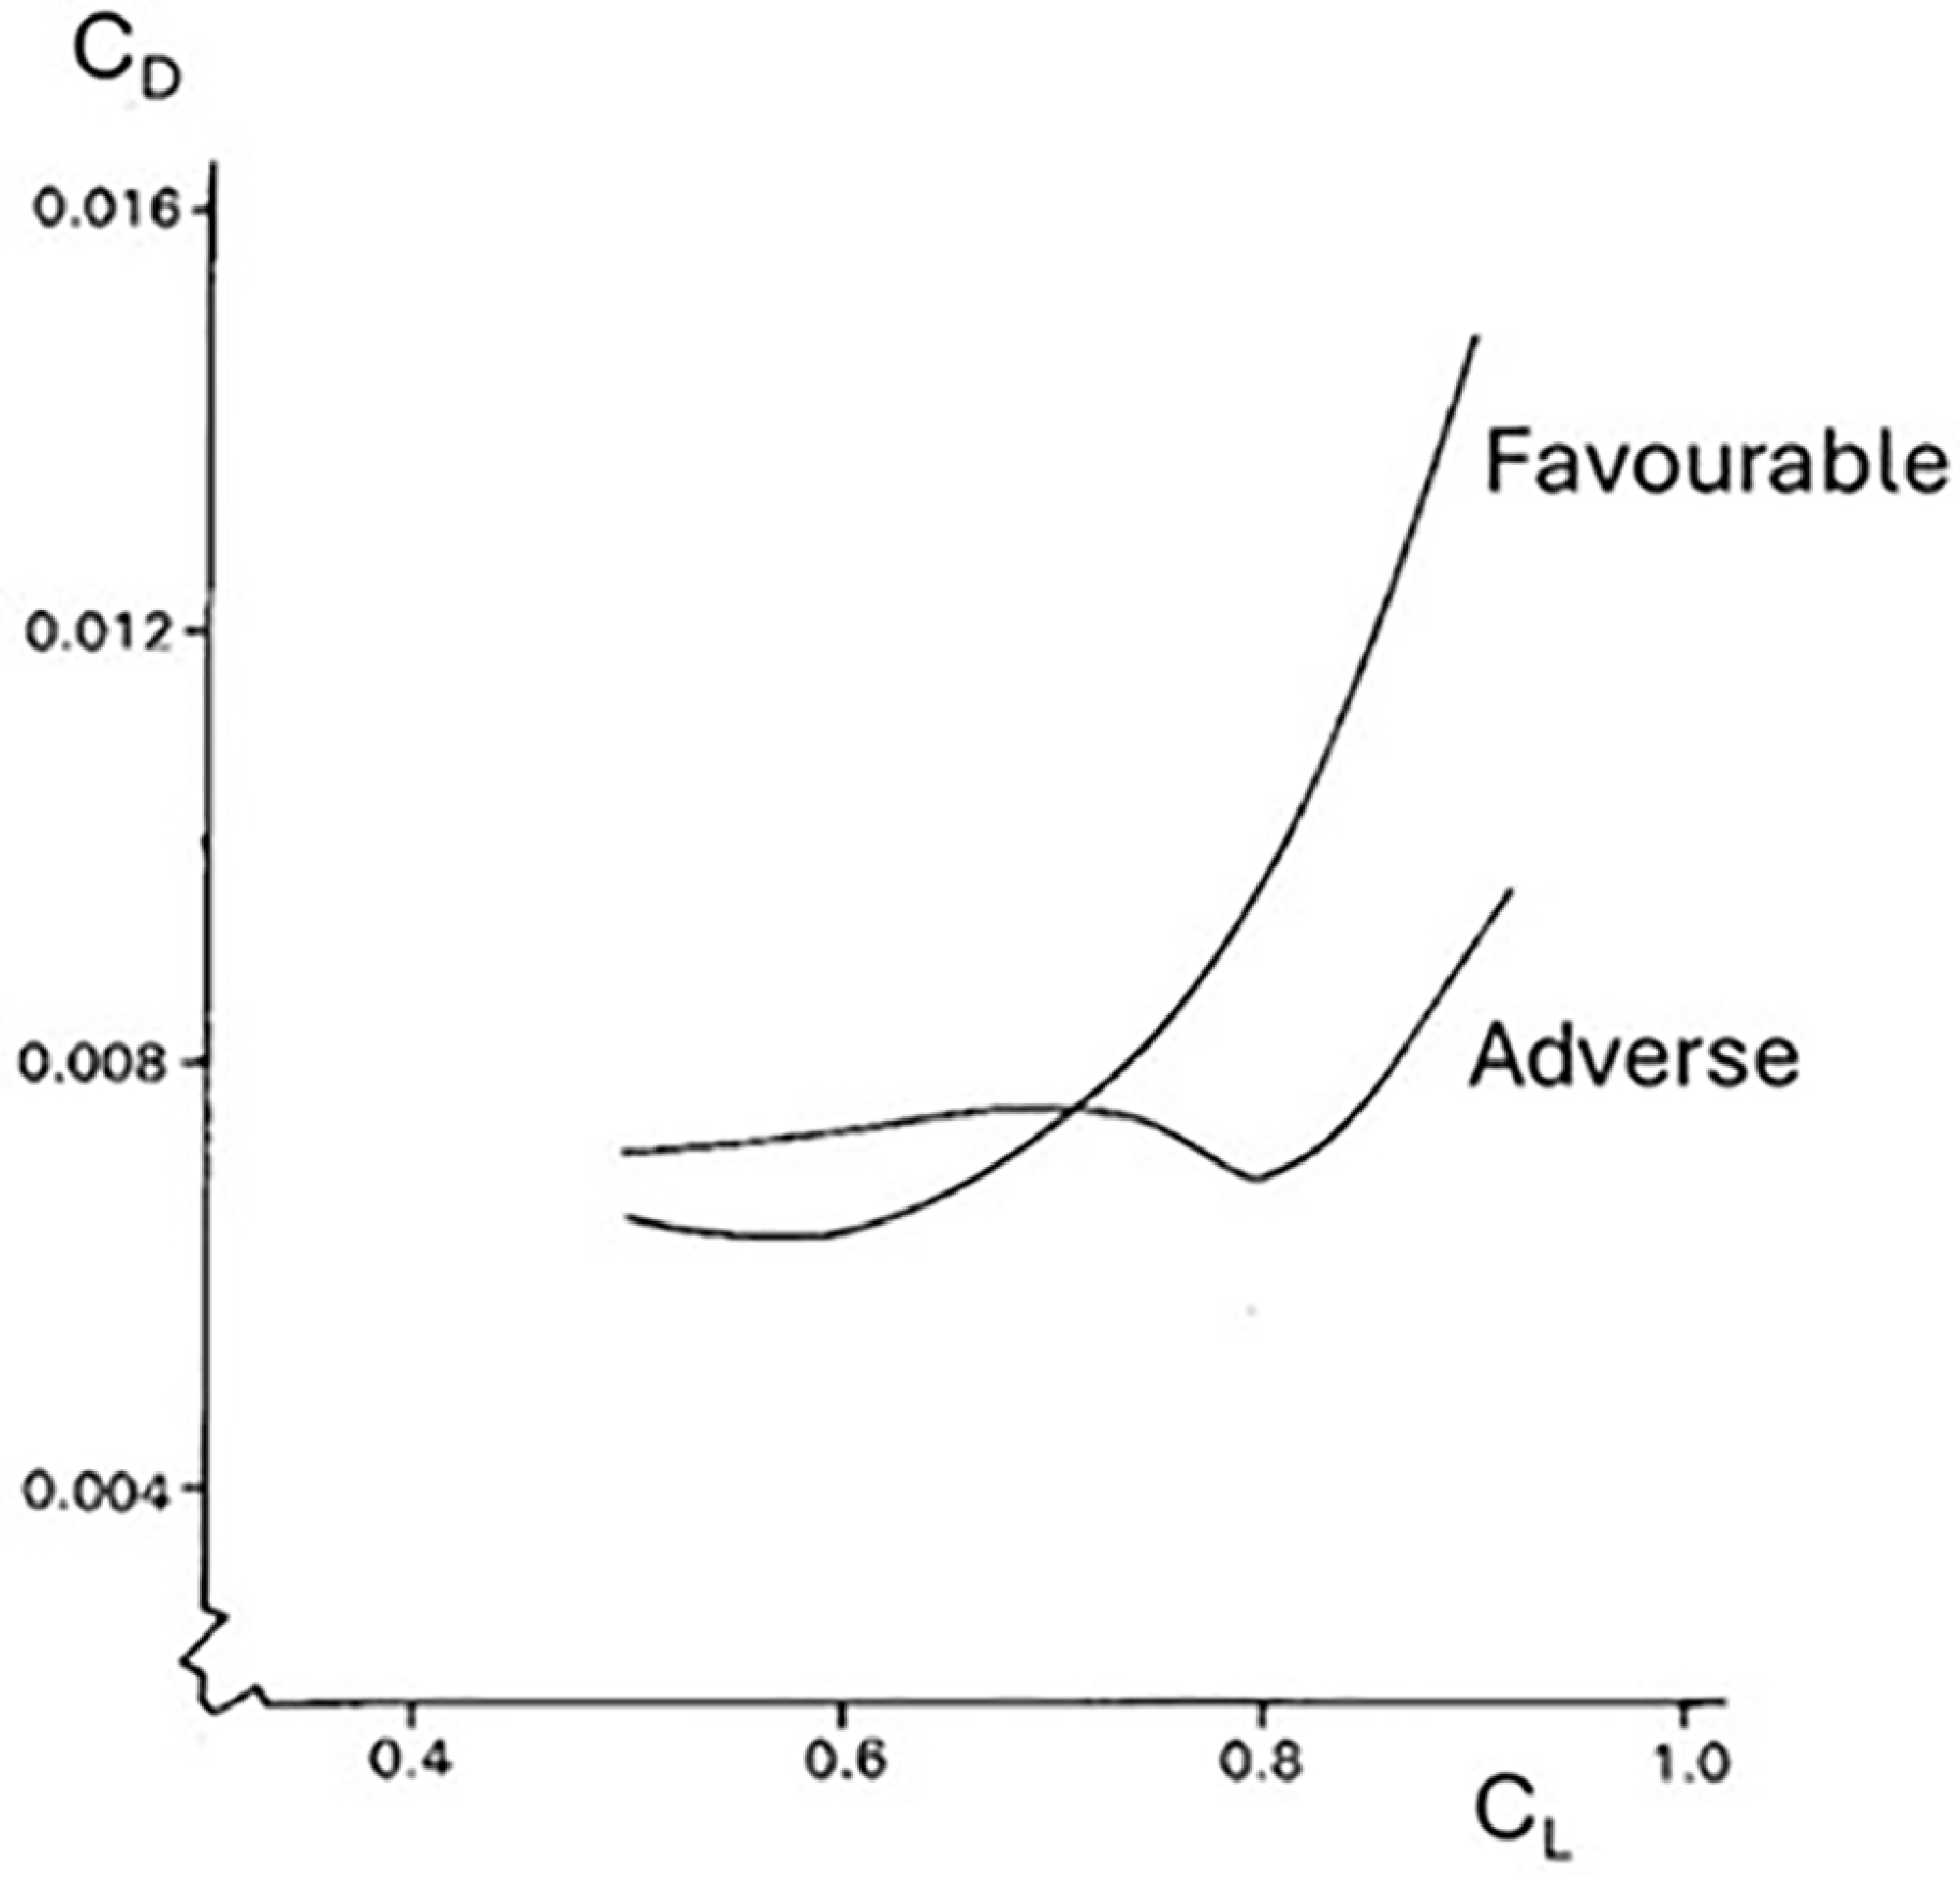
Drag characteristics.

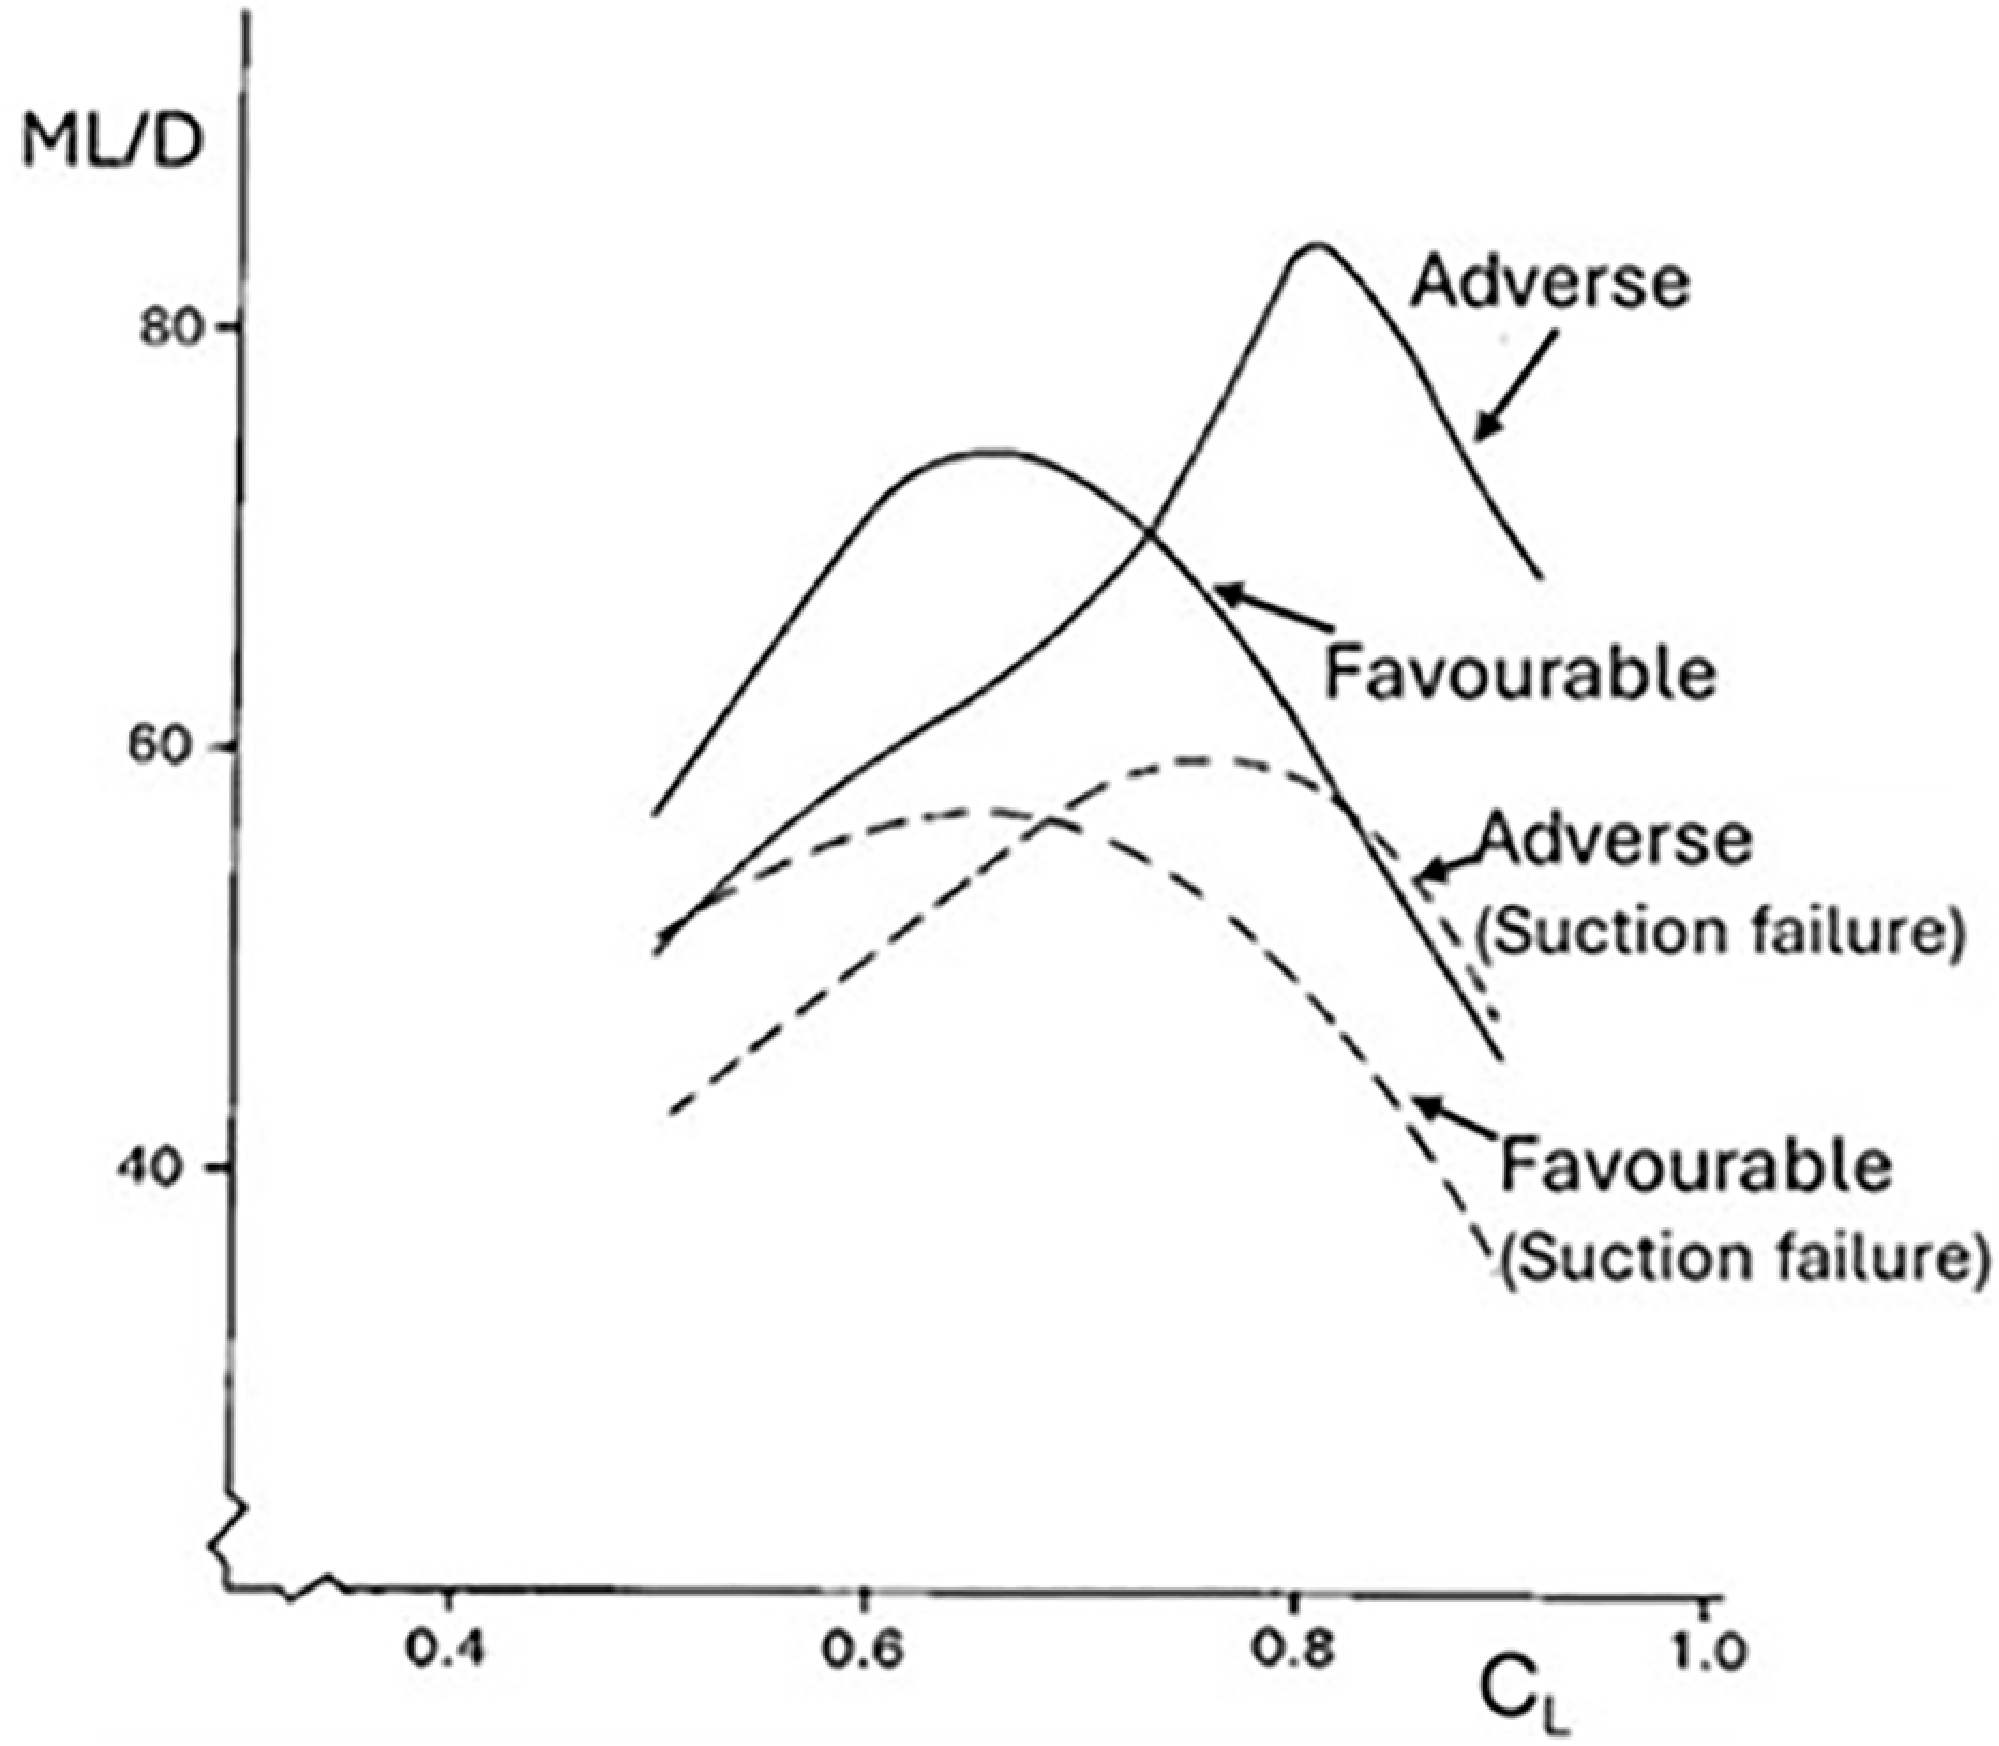
Performance characteristics.

The drag characteristics and performance characteristics in terms of ML/D for the aerofoils are compared in Figs 19 and 20, respectively. As illustrated in the results, despite the transition position on the favourable pressure gradient aerofoil being further aft than on the adverse pressure gradient aerofoil, the adverse gradient aerofoil has a higher lift capability for a given shock strength and better drag rise characteristics than the favourable gradient aerofoil. This implies that the same type of upper surface pressure distribution can be chosen for a hybrid laminar flow wing as for a turbulent wing. This is also important for ensuring a viable wing design in terms of performance in the event of suction failure.
It should be noted that the aerofoils considered here are not specifically designed and optimised for HLFC. They are used to illustrate that an adverse ‘rooftop’ pressure gradient may be more viable than a favourable ‘rooftop’ pressure gradient in HLFC wing design.
5.0 Suction system and structural integration
5.1 Crossflow instability
The single suction chamber and variable porosity technique with a turbulent type of pressure distribution for HLFC design, has been applied to an Airbus A330 aircraft outer wing retrofit, under a EU-funded research programme called AFLONEXT (Active Flow, Load & Noise Control on next generation aircraft). The aim of the investigation of the single chamber and variable porosity concept was to establish the following potential advantages over the current multi-chamber concept:
-
1. Reduced structural and system complexity.
-
2. Reduced weight.
-
3. Potential for incorporating different types of wing ice protection systems (WIPS), such as a conventional hot air WIPS, or a skin concept with electric wing ice protection systems (EWIPS).
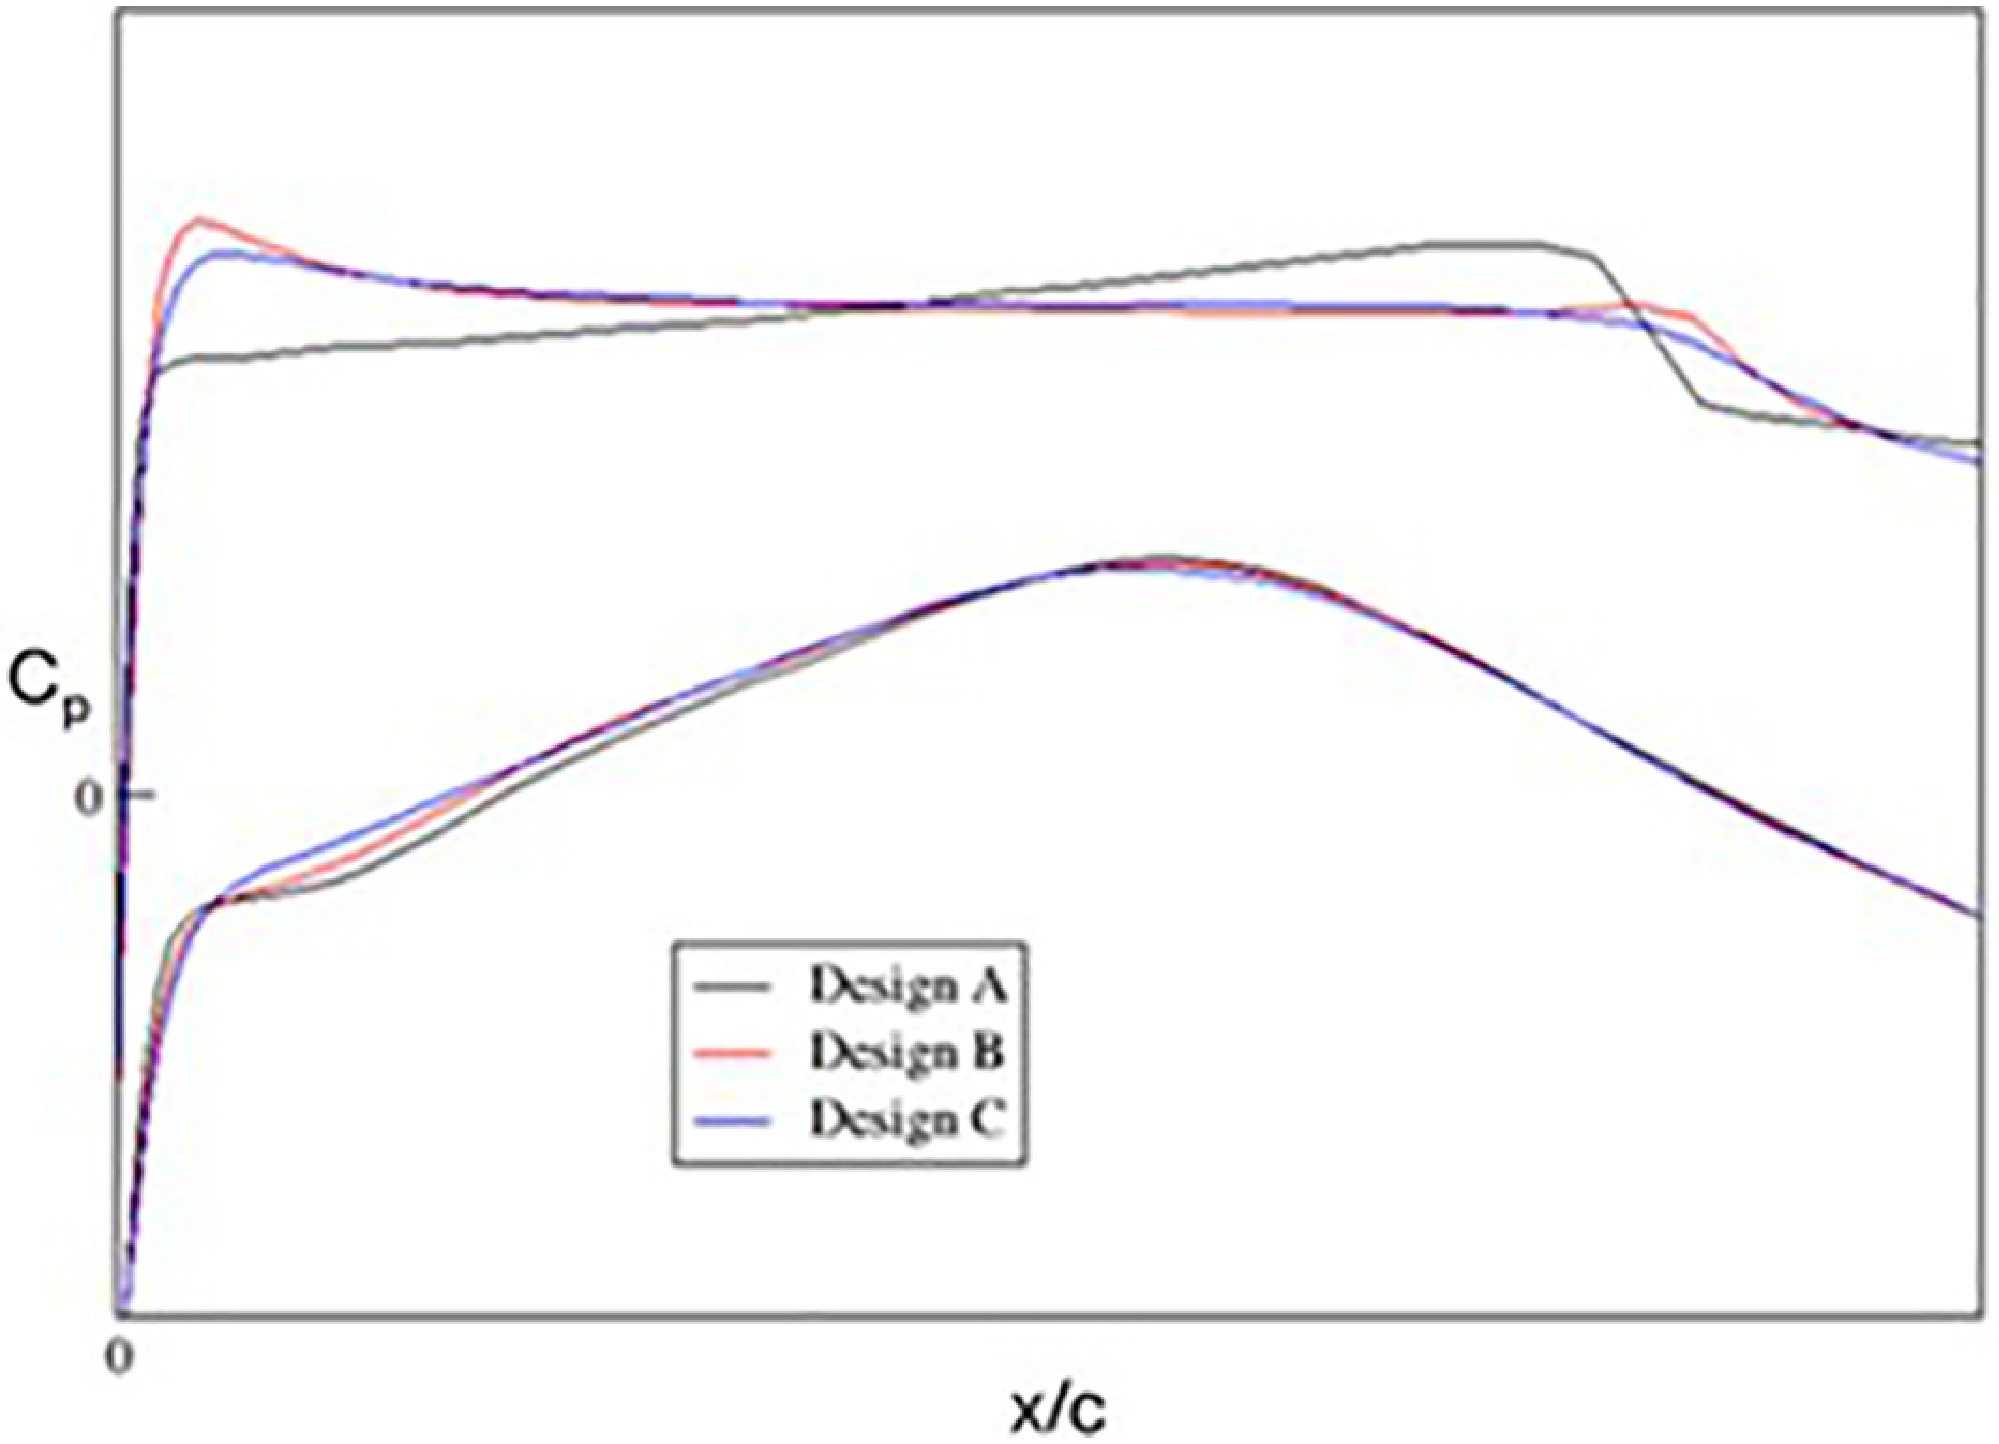
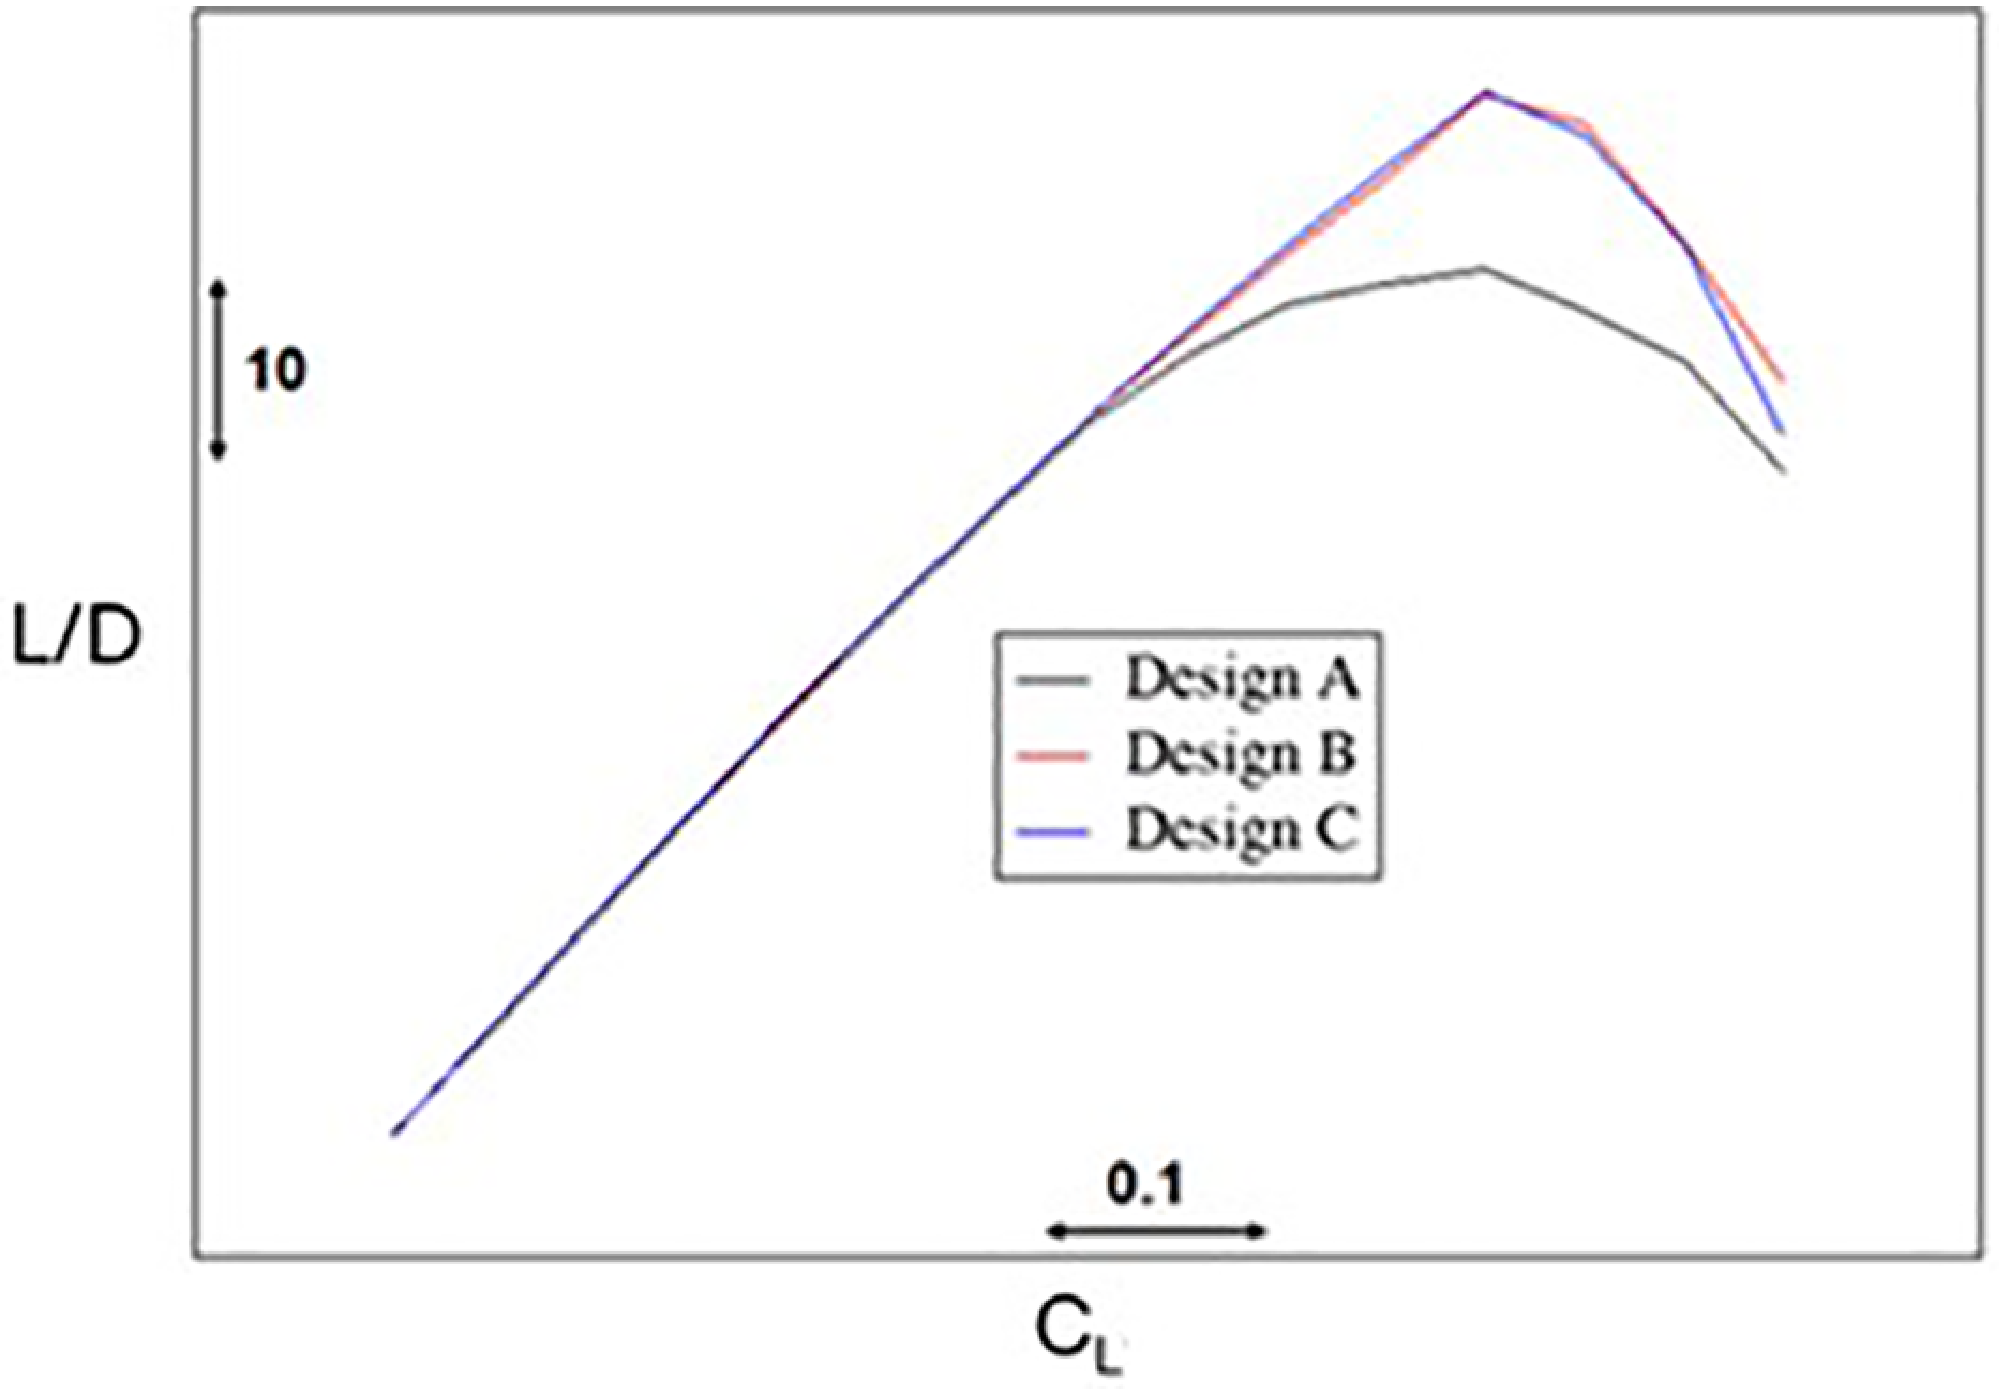
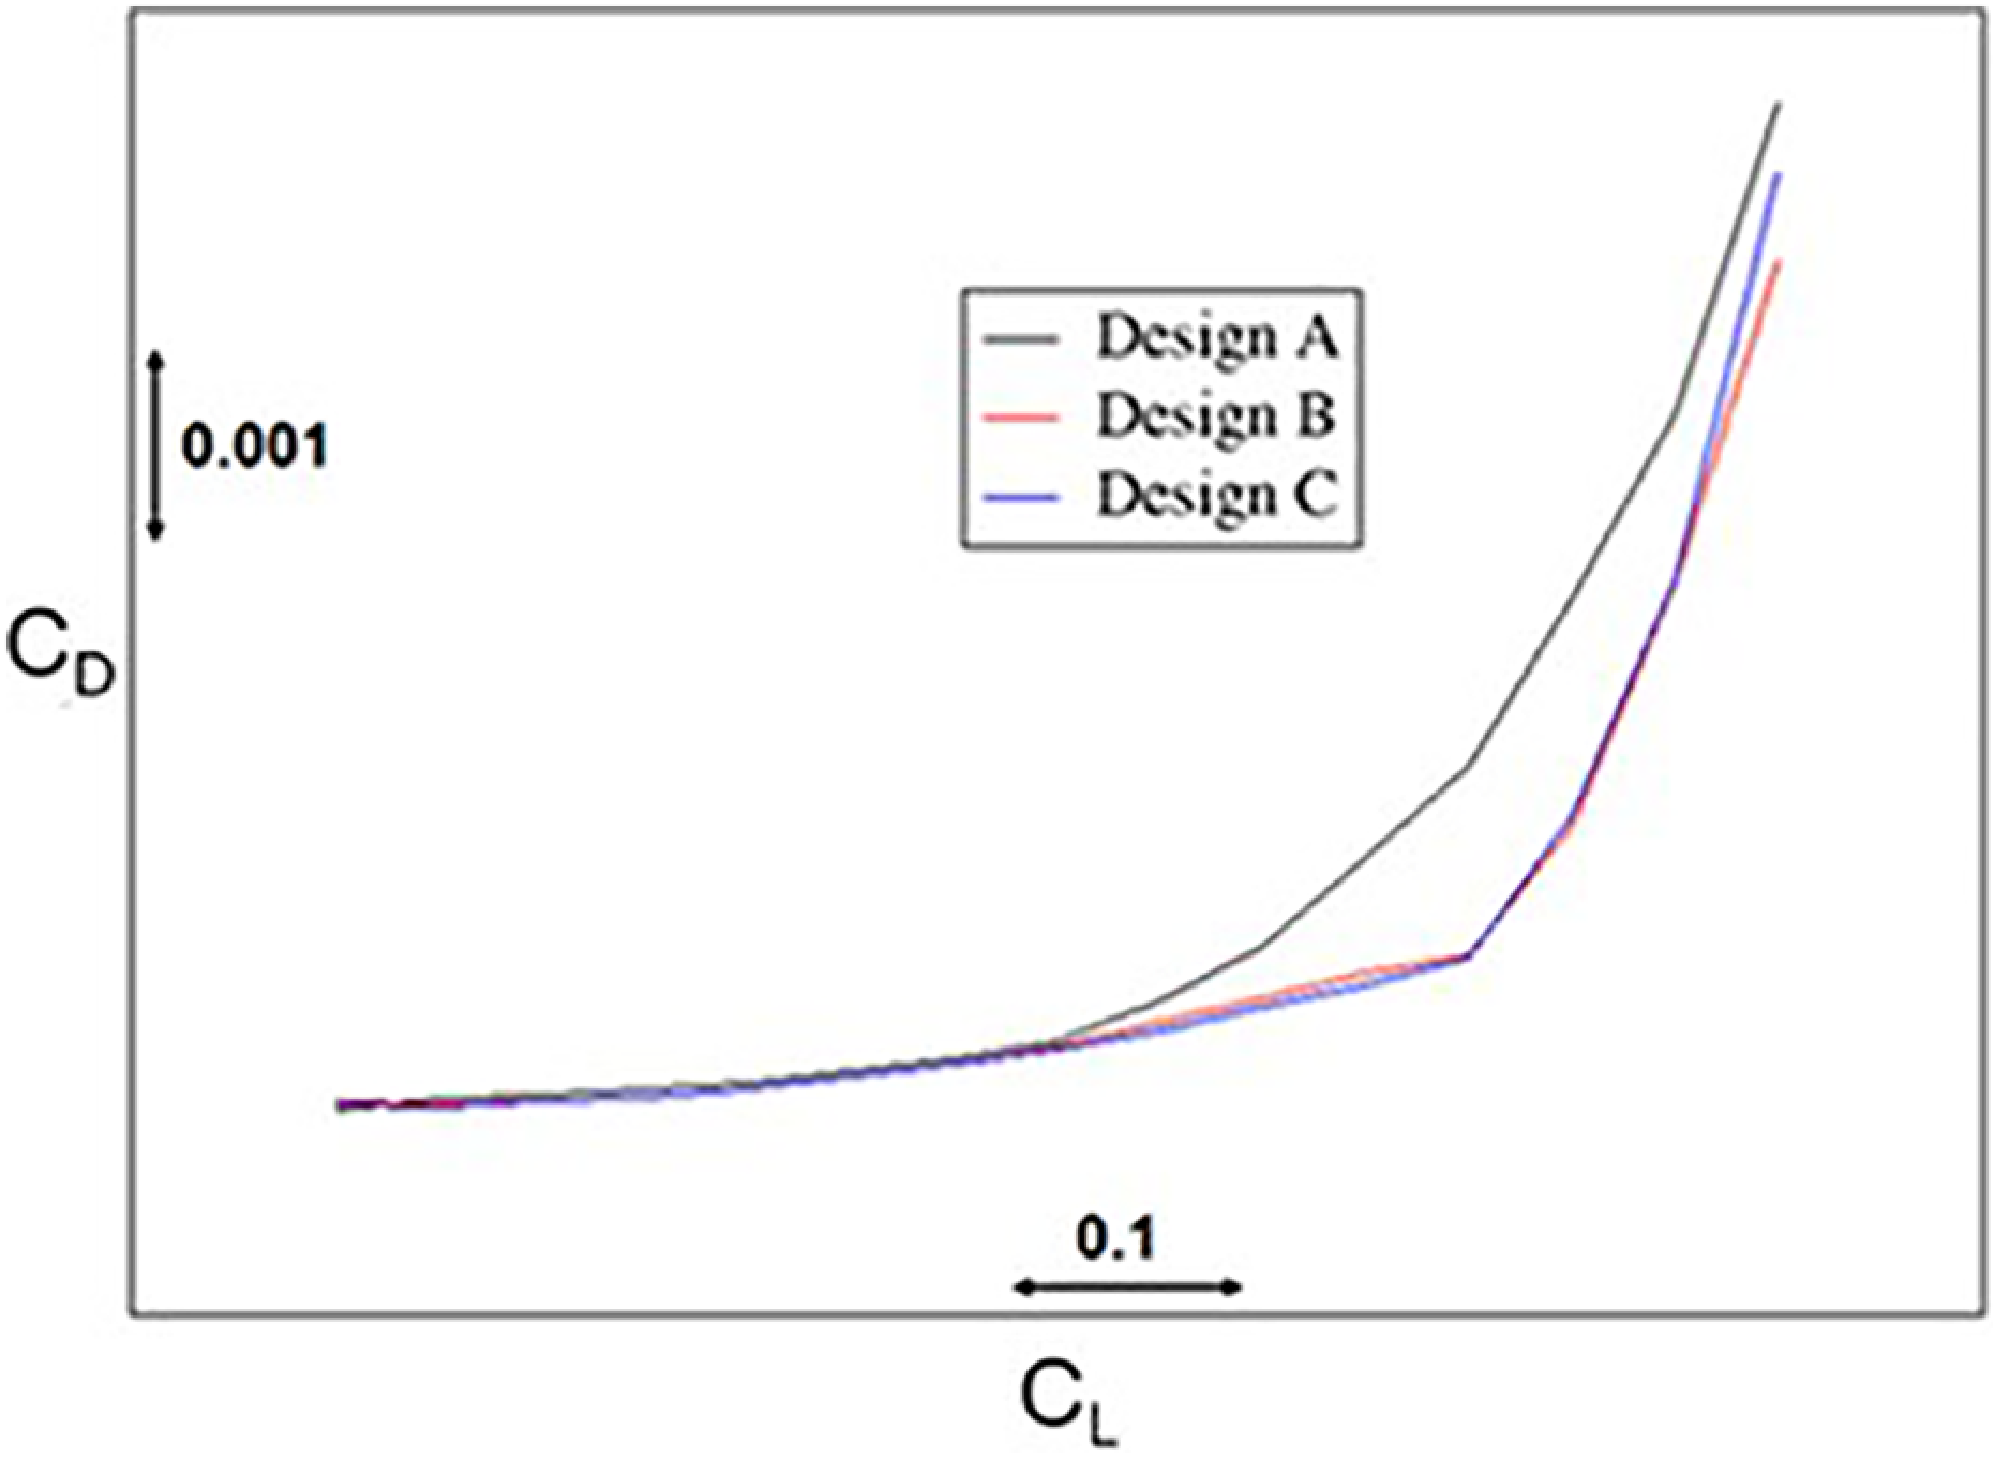
Details of the investigation are described in Ref. [Reference Wong and Walters7]. This paper will only outline some aspects of the findings. Various degrees of pressure gradient for the upper surface and their effect on transition control and aerodynamic performance have been investigated [Reference Green and Wong8]. The 2D section geometry that has been used as a basis for the study has been derived from a ‘normal-to-leading-edge’ cut of the outboard end of the HLFC panel. The design constraints were to maintain the maximum thickness/chord ratio and aft part of the geometric profile same as the baseline section. A range of design lift coefficient, C L, from 0.48 to 0.63 for the section in the streamwise direction, for a cruise Mach number of M ∞ = 0.82 has been specified by Airbus for the HLFC study. For the results presented here, a sectional C L of 0.58 in the streamwise direction within the range of the design target has been considered. The corresponding CL and Mach number normal to the wing leading-edge sweep is 0.76 and 0.708, respectively, as shown in Fig. 21. The pressure distributions for three of the sections for a same design C L that have been derived based on the baseline geometry in the design investigation are shown in Fig. 21. The wing section, Design A, has a favourable type of pressure distribution, and Designs B and C both have a turbulent type of pressure distribution with an adverse pressure gradient and a different suction peak level in the leading-edge region. A lower leading-edge suction peak would have a higher suction velocity for a same suction chamber pressure than a higher suction peak. It can be seen from Fig. 22, for a given design C L, the lift to drag ratio, L/D, for Designs B and C with a turbulent type of pressure distribution is higher than Design A with a favourable gradient type of pressure distribution, in line with the findings in Section 4. The turbulent designs also have a weaker shock and lower drag rise than the design with a favourable type of pressure gradient, as shown in Figs 21 and 23, respectively. The results presented in Figs 21–23 are with HLFC, but the scales on the axes could not be shown due to commercial confidentiality.
2D pressure distributions, M = 0.75, M2D = 0.708, C L = 0.76, Re = 19.81 × 10⁶.

L/D performance.

Drag performance.

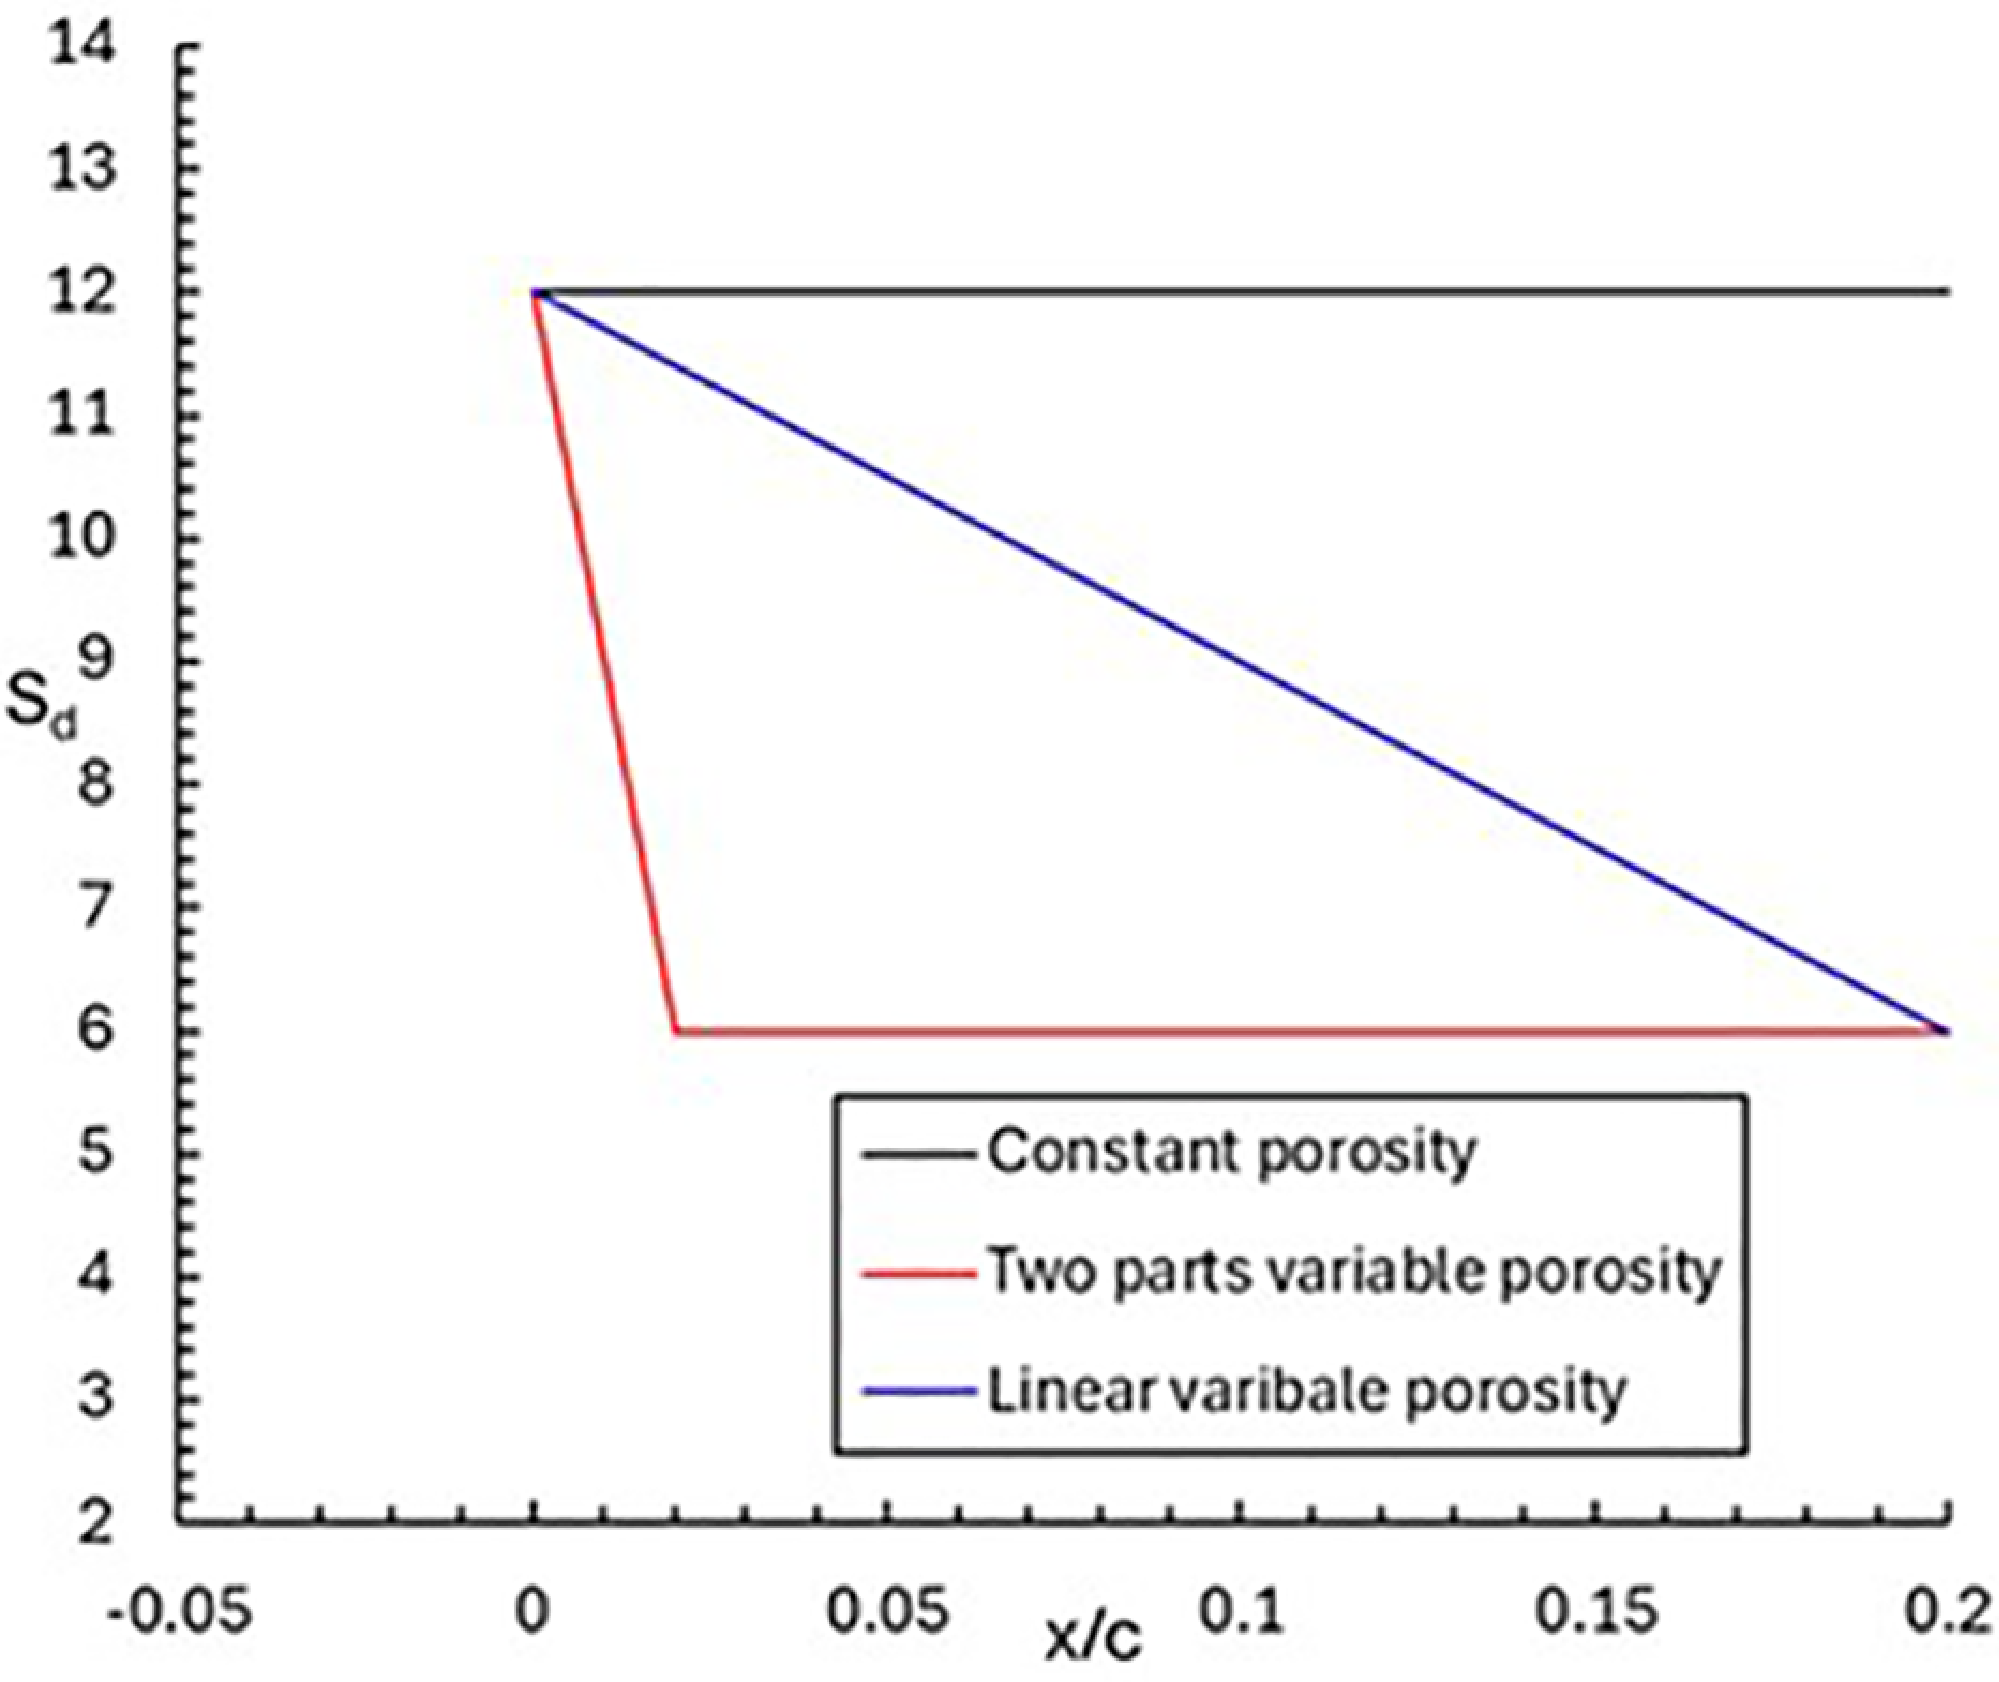
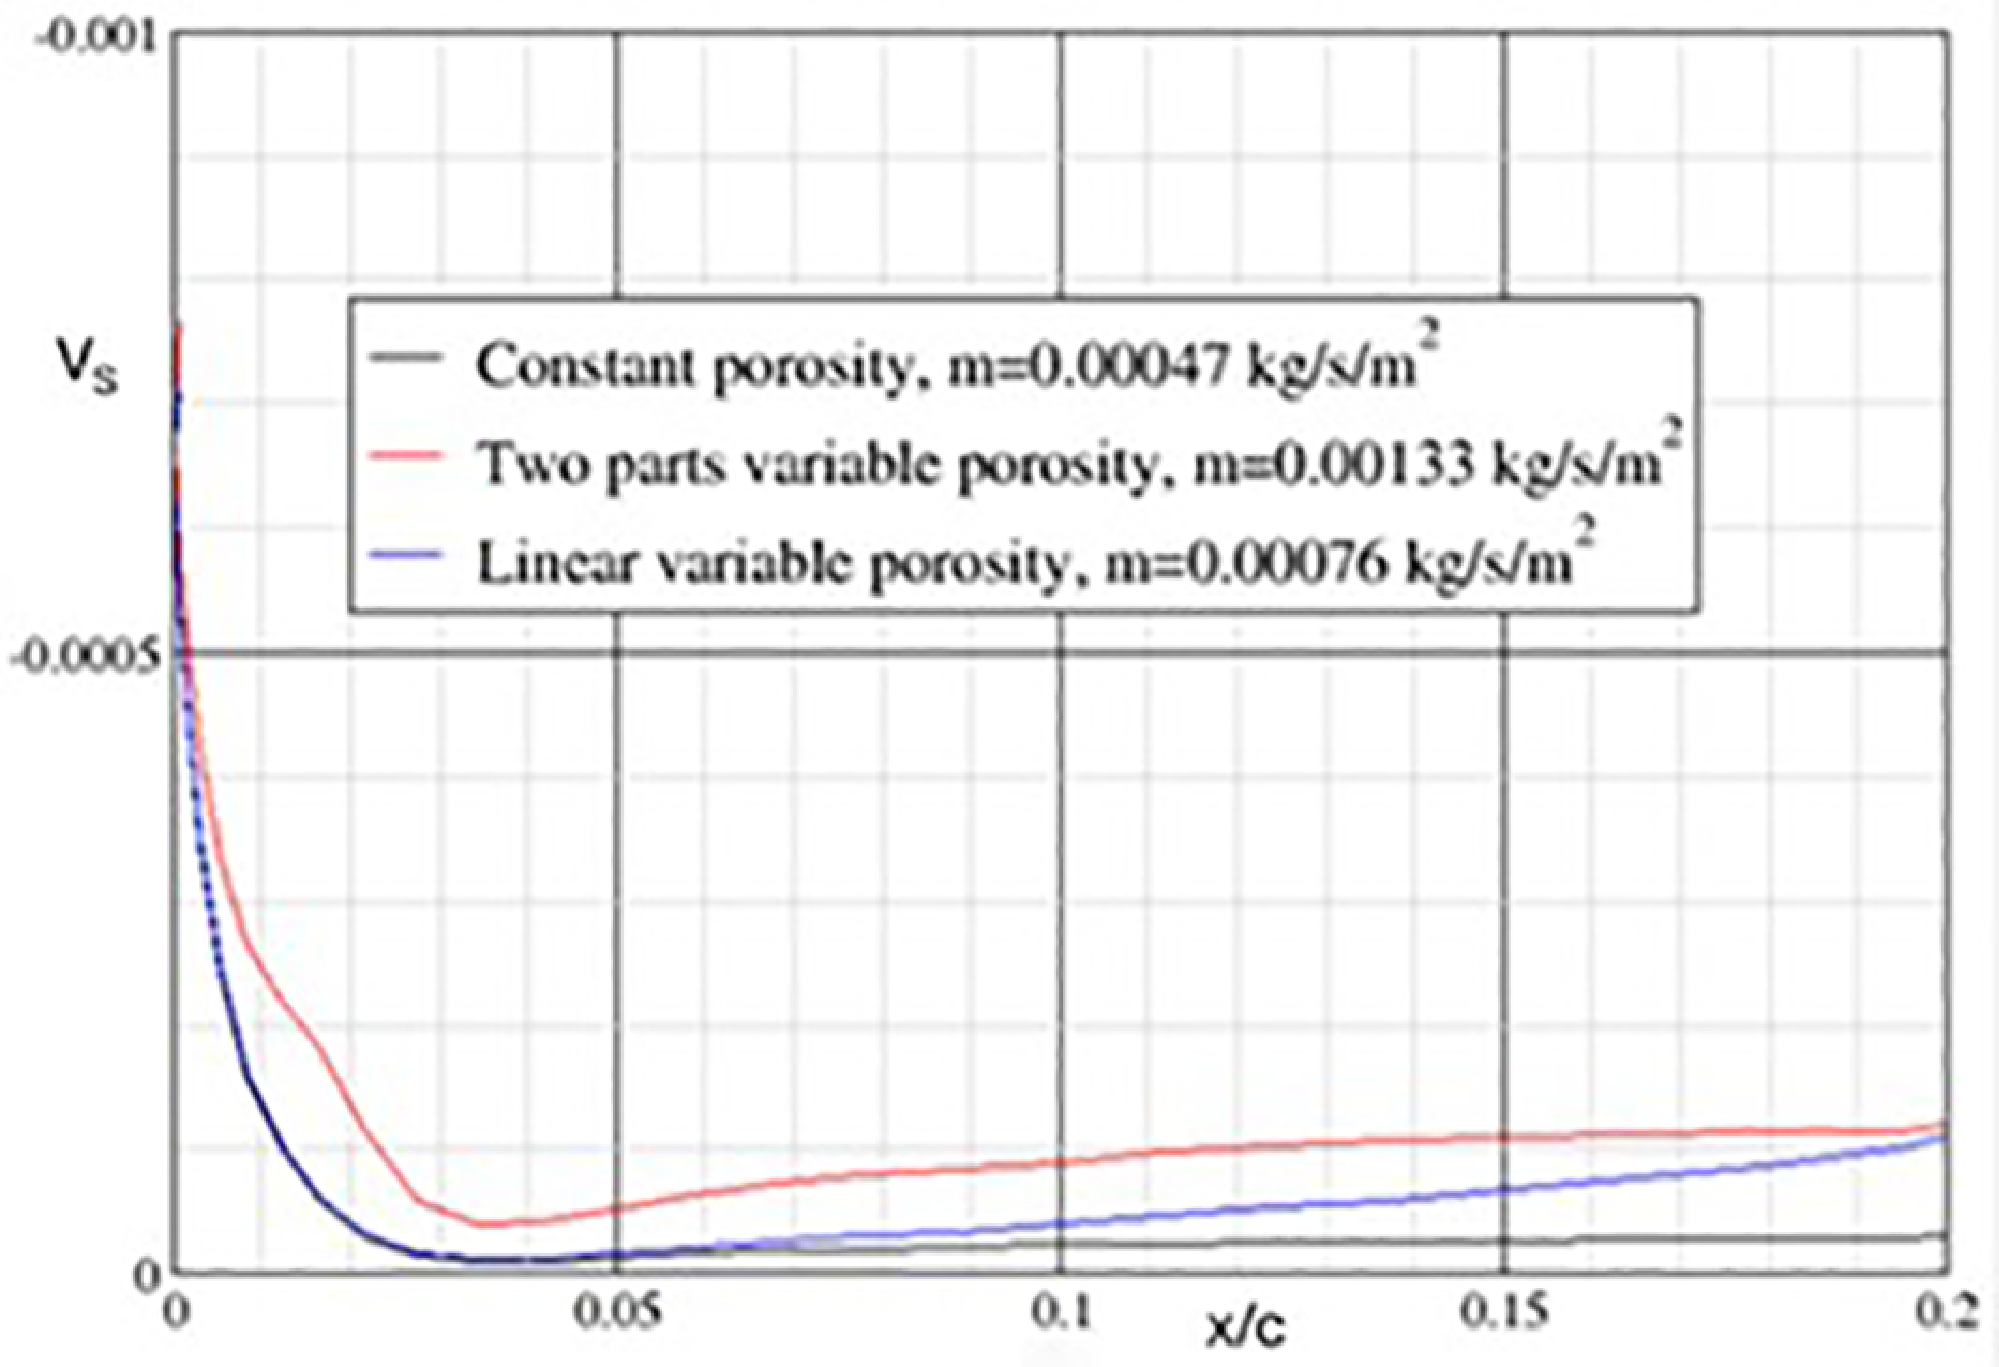
For the designs with a turbulent type of pressure distribution, it is possible to use a single suction chamber with variable porosity to delay transition as far downstream as the shock location. For the pressure distributions shown in Fig. 21, the steep pressure gradient occurs close to the leading edge, within the initial 2% chord, and its variation with distance over this region is nearly linear. Based on the transition control methodology established in Ref. [Reference Wong, Maina and Doig5] outlined in Section 2.4, a higher value of S d can be applied at the leading edge and then reduced linearly with distance. The variation of porosity with distance could be defined in various ways, and it was shown that two types of porosity variation as shown in Fig. 24 could be used to provide an appropriate suction velocity distribution for controlling transition. One of these cases is a linear reduction in S d by 50% over the initial 2% chord followed with a constant porosity to 20% chord, defined as ‘two-part’ variable porosity distribution, and the other is simply a linear variation from the leading edge to 20% chord.
Porosity distributions, d = 50 µm.

Design C suction velocity distribution, chamber pressure = 13250 Pa, d = 50 μm, t = 3 mm.

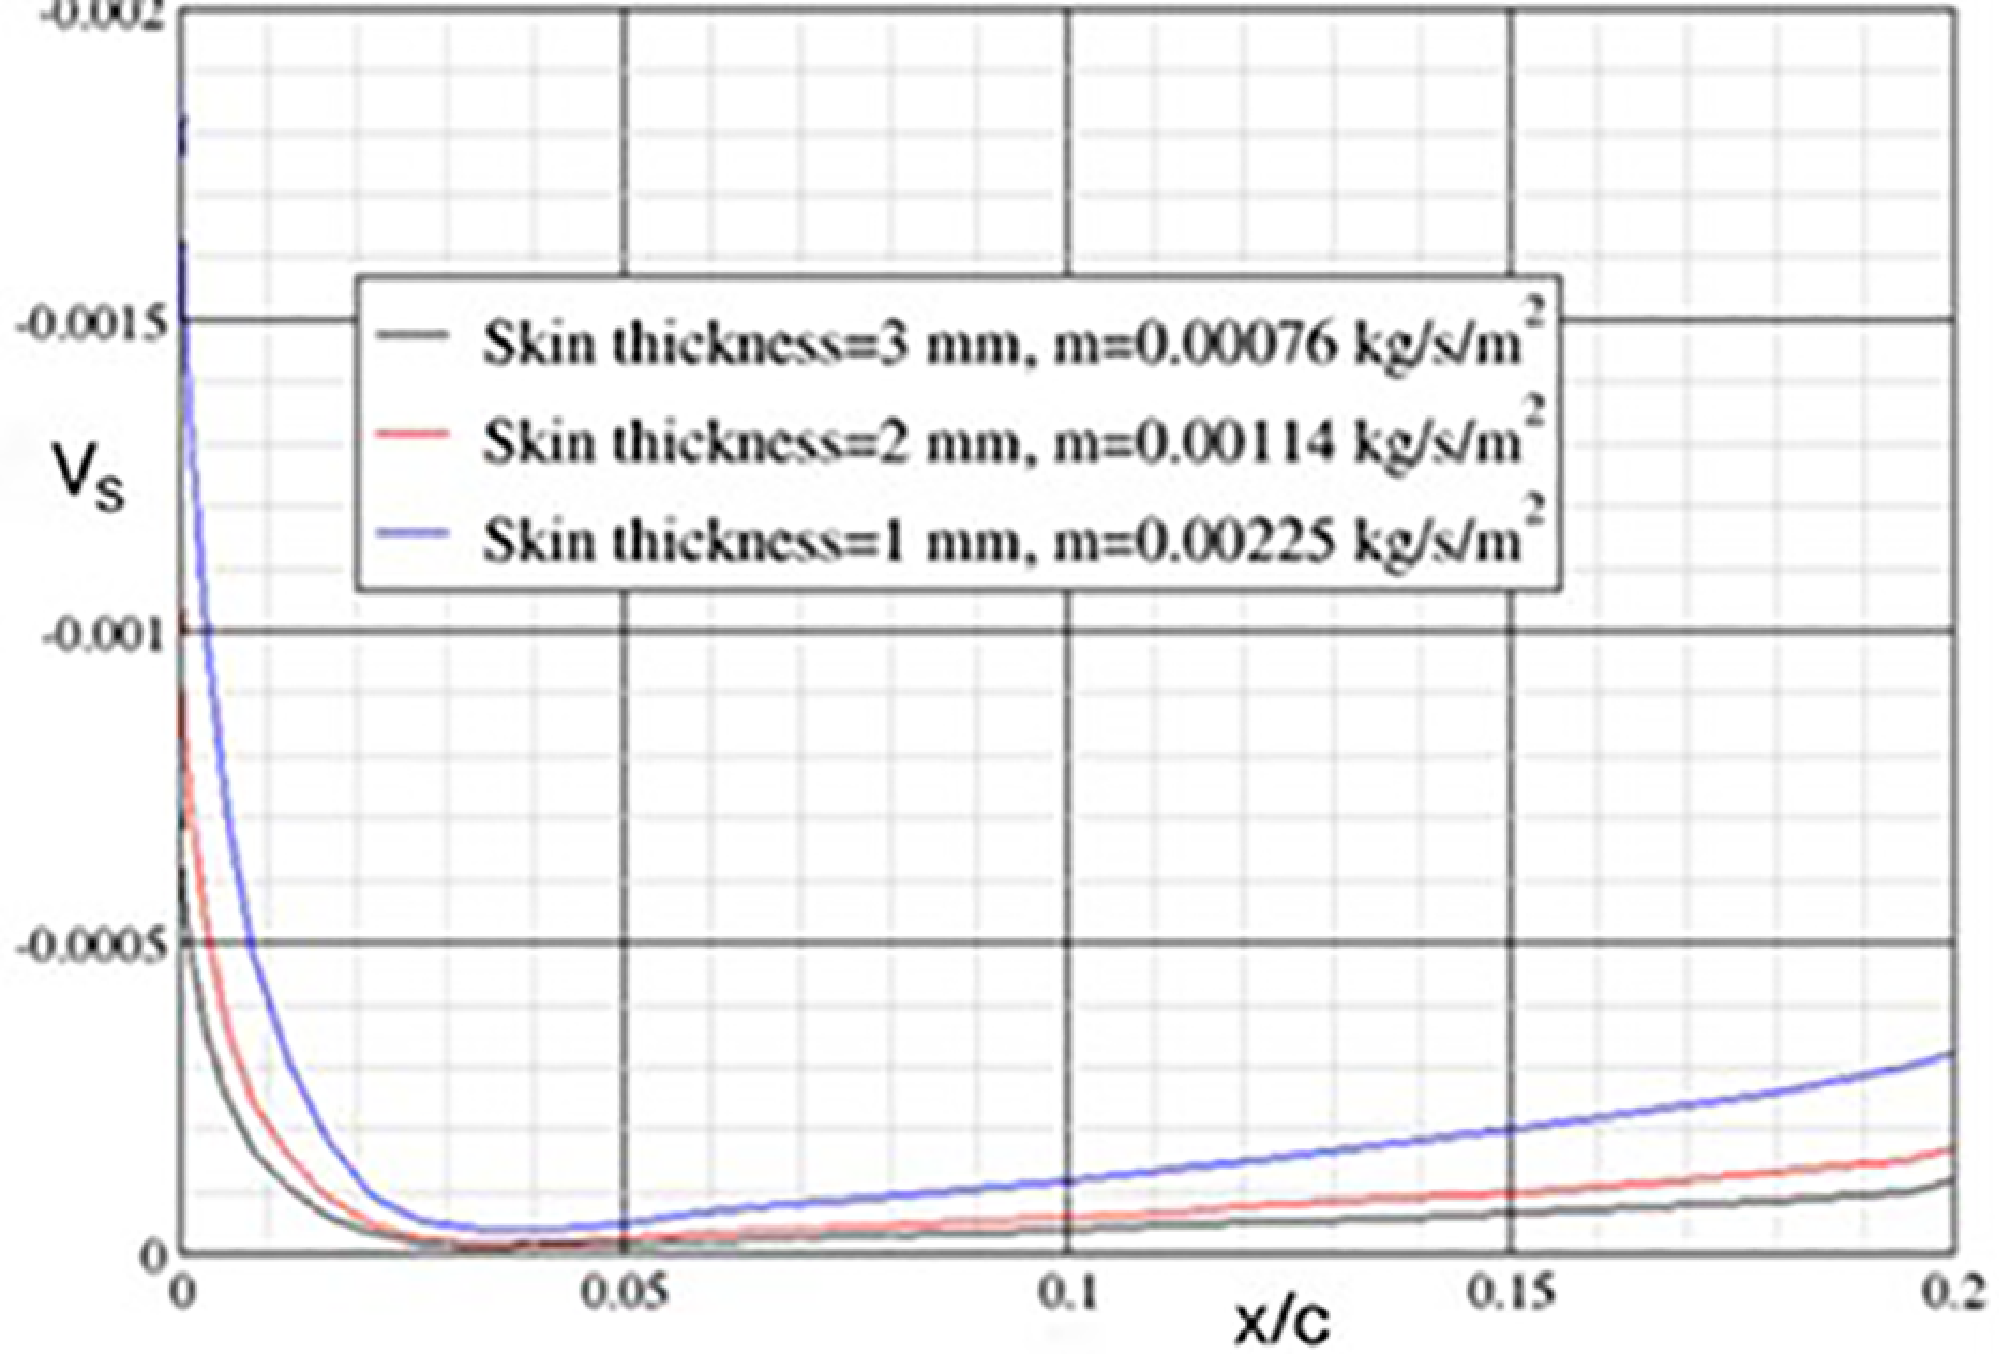
Effect of skin thickness on suction velocity distribution, Design C, chamber pressure = 13250 Pa, d = 50 μm.

For surface suction, the chamber pressure needs to be lower than the external surface pressure distribution, otherwise blowing would occur, which could cause transition. A lower chamber pressure would give a higher suction velocity and mass flow but requires a higher suction pump power. For the single chamber and variable porosity technique, the suction pump power requirement could be minimised by setting the chamber pressure at a level just low enough to avoid blowing. This chamber pressure is sufficient to provide an appropriate suction velocity across the porous panel for controlling the flow instabilities to delay transition. This is illustrated in Fig. 25, with a higher suction velocity in the initial steep pressure gradient region for controlling CF instability and a reduced level downstream of this region for controlling TS instability. The level of suction velocity distribution can be further controlled by a combination of the porosity variation, suction hole diameter and skin thickness, in order to achieve an appropriate level for delaying transition. For example, Fig. 26 shows that the level of suction can be increased by reducing the skin thickness. It should be noted that for the constant porosity distribution, it has not been possible to achieve an appropriate level of suction velocity distribution; it is either too high in the initial steep pressure gradient region (between 0 to 2% chord), which may have the problem of over-suction, or too low downstream of this region to delay transition. It was found that transition is mainly due to CF in the leading-edge region. A multi-chamber system could be used, but it would be more complex and difficult to manufacture and have a greater weight penalty than a single-chamber variable porisity system as shown in Ref. [Reference Wong and Walters7]. The single chamber and variable porosity concept can be easily adapted for different porosity distributions with various hole diameters and skin thicknesses. Future research is required to study the trade-off between the structural stiffness, weight and laser drilling in terms of hole spacing, hole diameter and skin thickness for the porous skin.
5.2 Structural integration
The single chamber and variable porosity suction system has been integrated on the computer-aided three-dimensional interactive application (CATIA) into the leading-edge wing structure of the Airbus A330 aircraft outer wing retrofit, with the WIPS and high lift system [Reference Wong and Walters7]. The structural integration was based on the modification of an existing multi-chamber geometry, with most of the structural features maintained. The resultant structural system is less complex than the multi-chamber geometry, and with an appreciable weight saving as shown in Table 1.
Comparison of weight estimates

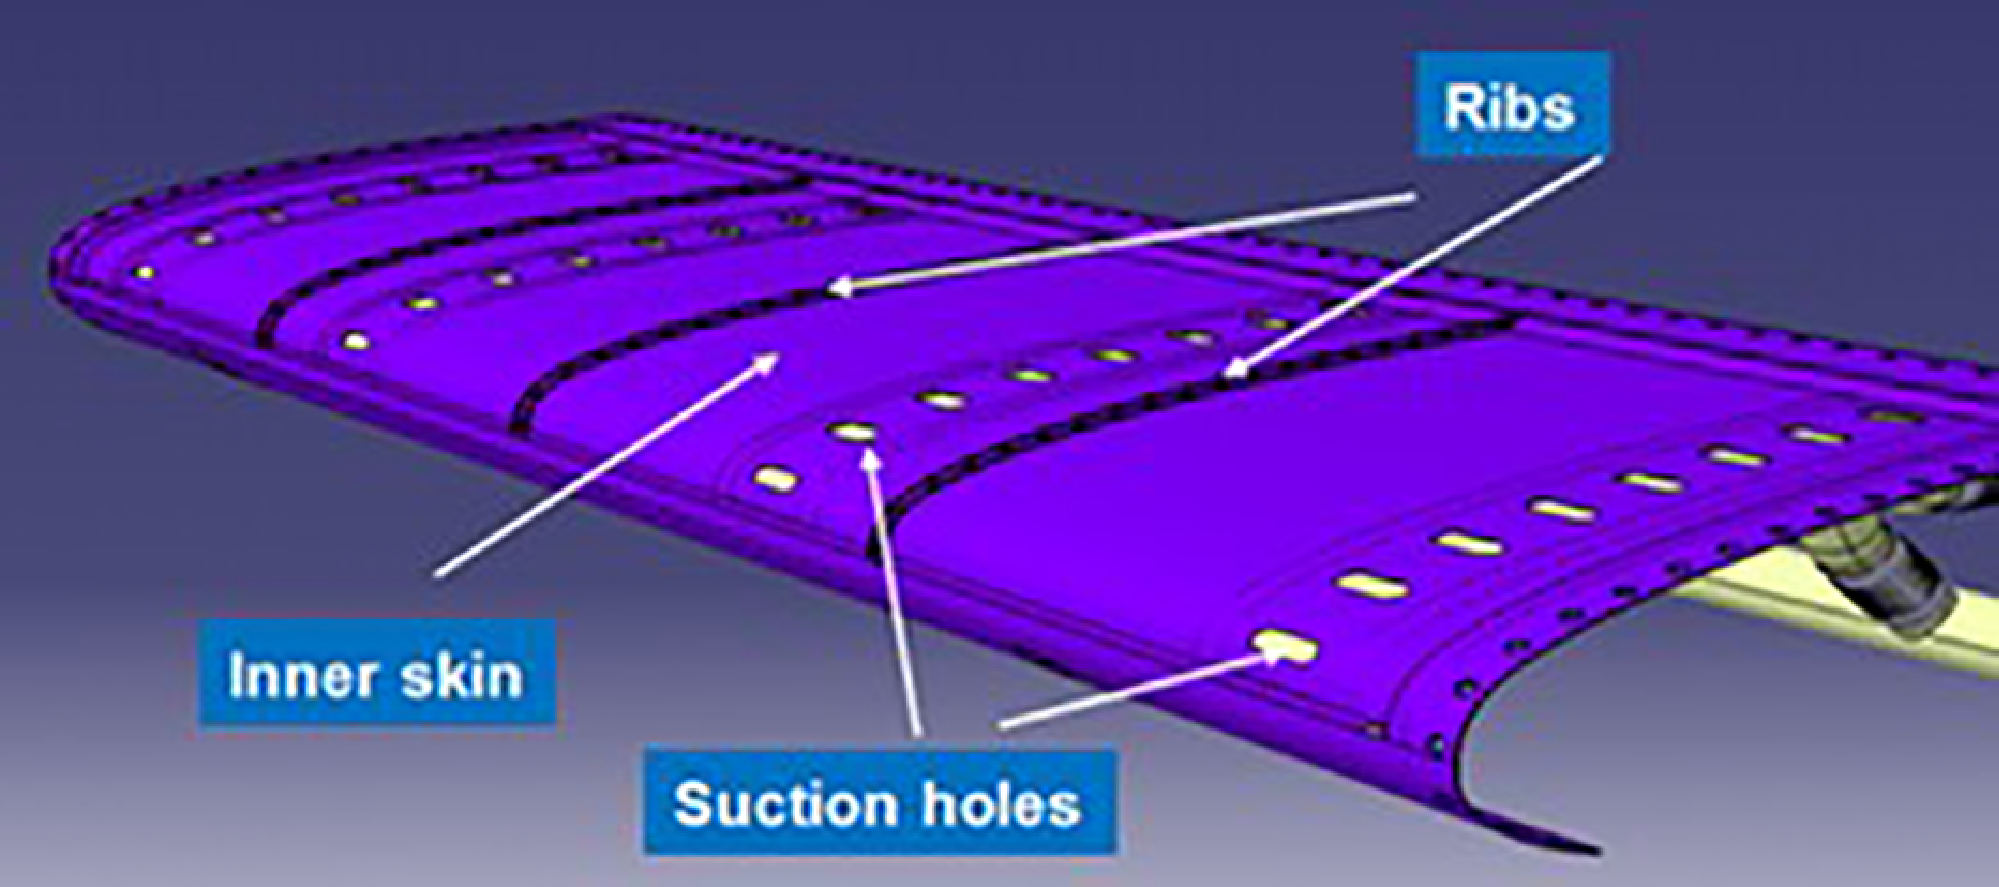
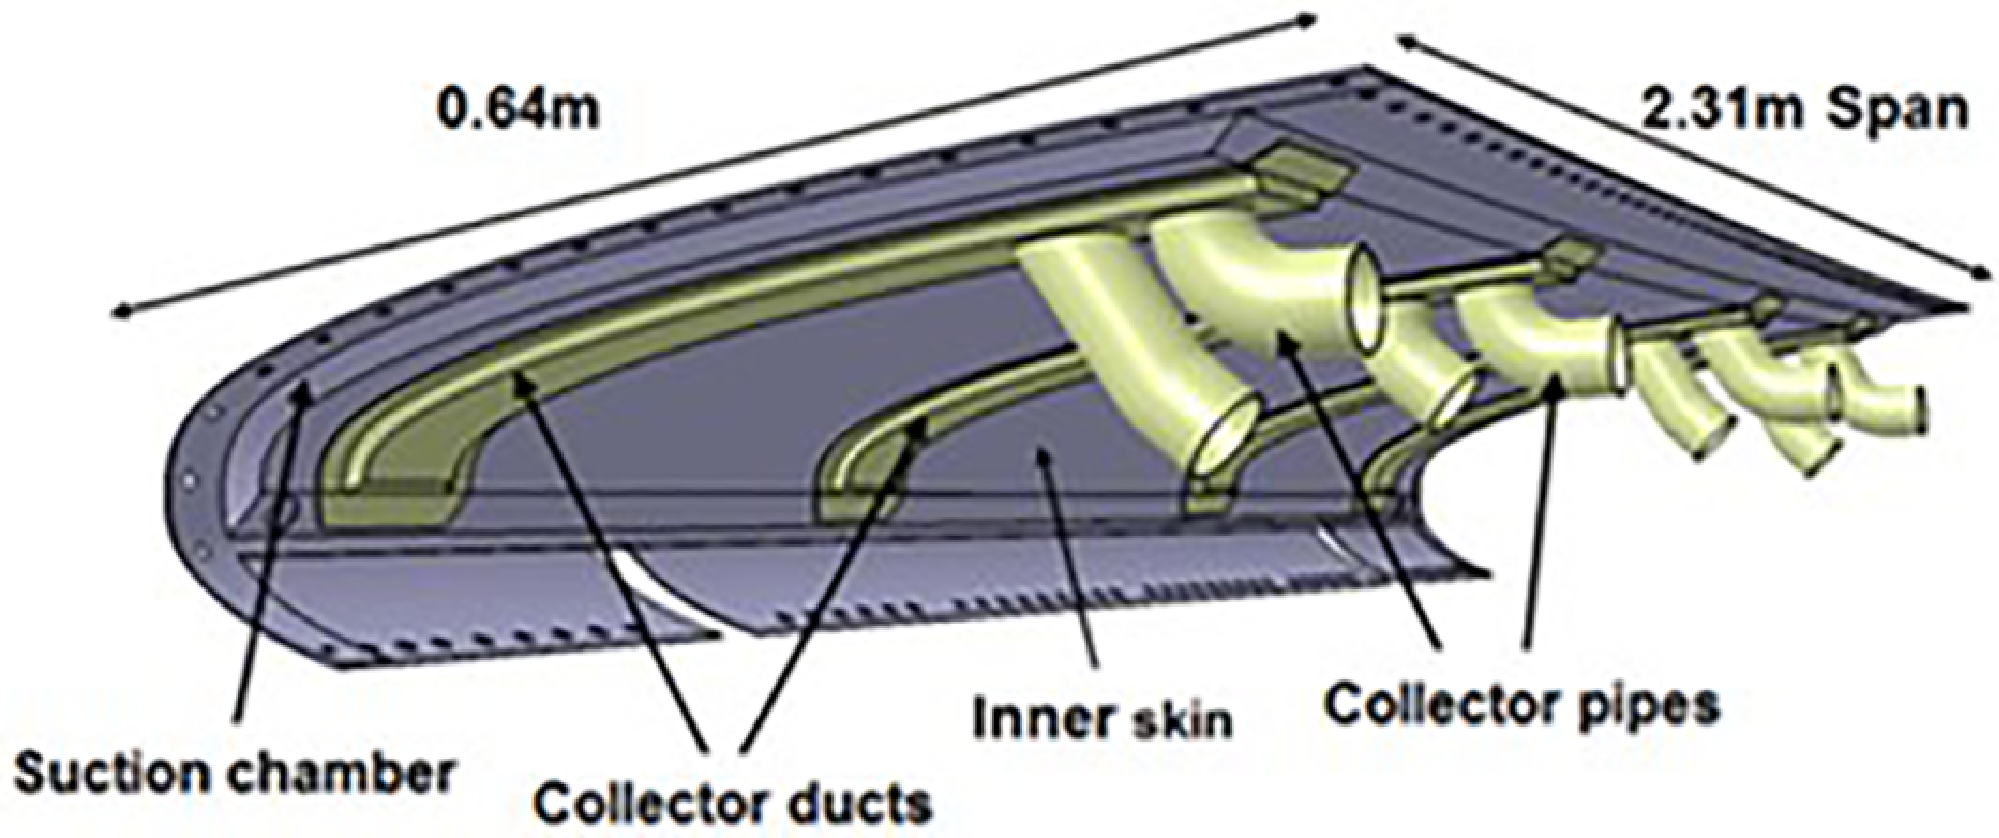
The single chamber consists of an outer porous skin and a solid inner skin with suction holes. The multi-chamber internal structures have been totally removed to create a single chamber, with the depth of the chamber between the outer and inner skin remaining the same. The multi-chamber system cannot be shown here for comparison due to company proprietary considerations with the company that has developed it. The outer skin with constant porosity of the multi-chamber geometry has been replaced with a skin with variable porosity distribution in the chordwise direction. There are three rows of internal ribs in the suction chamber to support the outer skin under load deflection as shown in Fig. 27. These ribs are evenly spaced across the span, with cuts to enable air to pass through in the spanwise direction. These ribs could be placed across the span, if necessary, instead of in the chordwise direction as currently shown. The inner skin has four rows of suction holes to minimise the spanwise variation in suction as shown in Fig. 27. The suction air is passed through these suction holes into the collector ducts underneath the inner skin as shown in Fig. 28. The collector ducts are connected to two trunk pipes via two collector pipes, one for the suction air supply and the other for the hot air supply for the WIPS.
Inner skin with suction holes and internal ribs.

Collector ducts and collector pipes underneath the inner skin.

The weight estimates for the part of the suction skin structural system for the single chamber and variable porosity concept illustrated in Fig. 28 are shown in Table 1. The weight for an equivalent structural system for the multi-chamber concept is also included for comparison. The weight estimation carried out for the HLFC structure as shown in Fig. 28 is purely for assessing the relative weight between the two concepts. It can be seen in Table 1 that the weight for single chamber concept is about 44% lighter than the multi-chamber concept with a wing span of 2.31 m. For the whole wing structure of an aircraft, the single chamber and variable porosity concept would have a significant weight saving compared with the multi-chamber concept.
6.0 Intermittency region
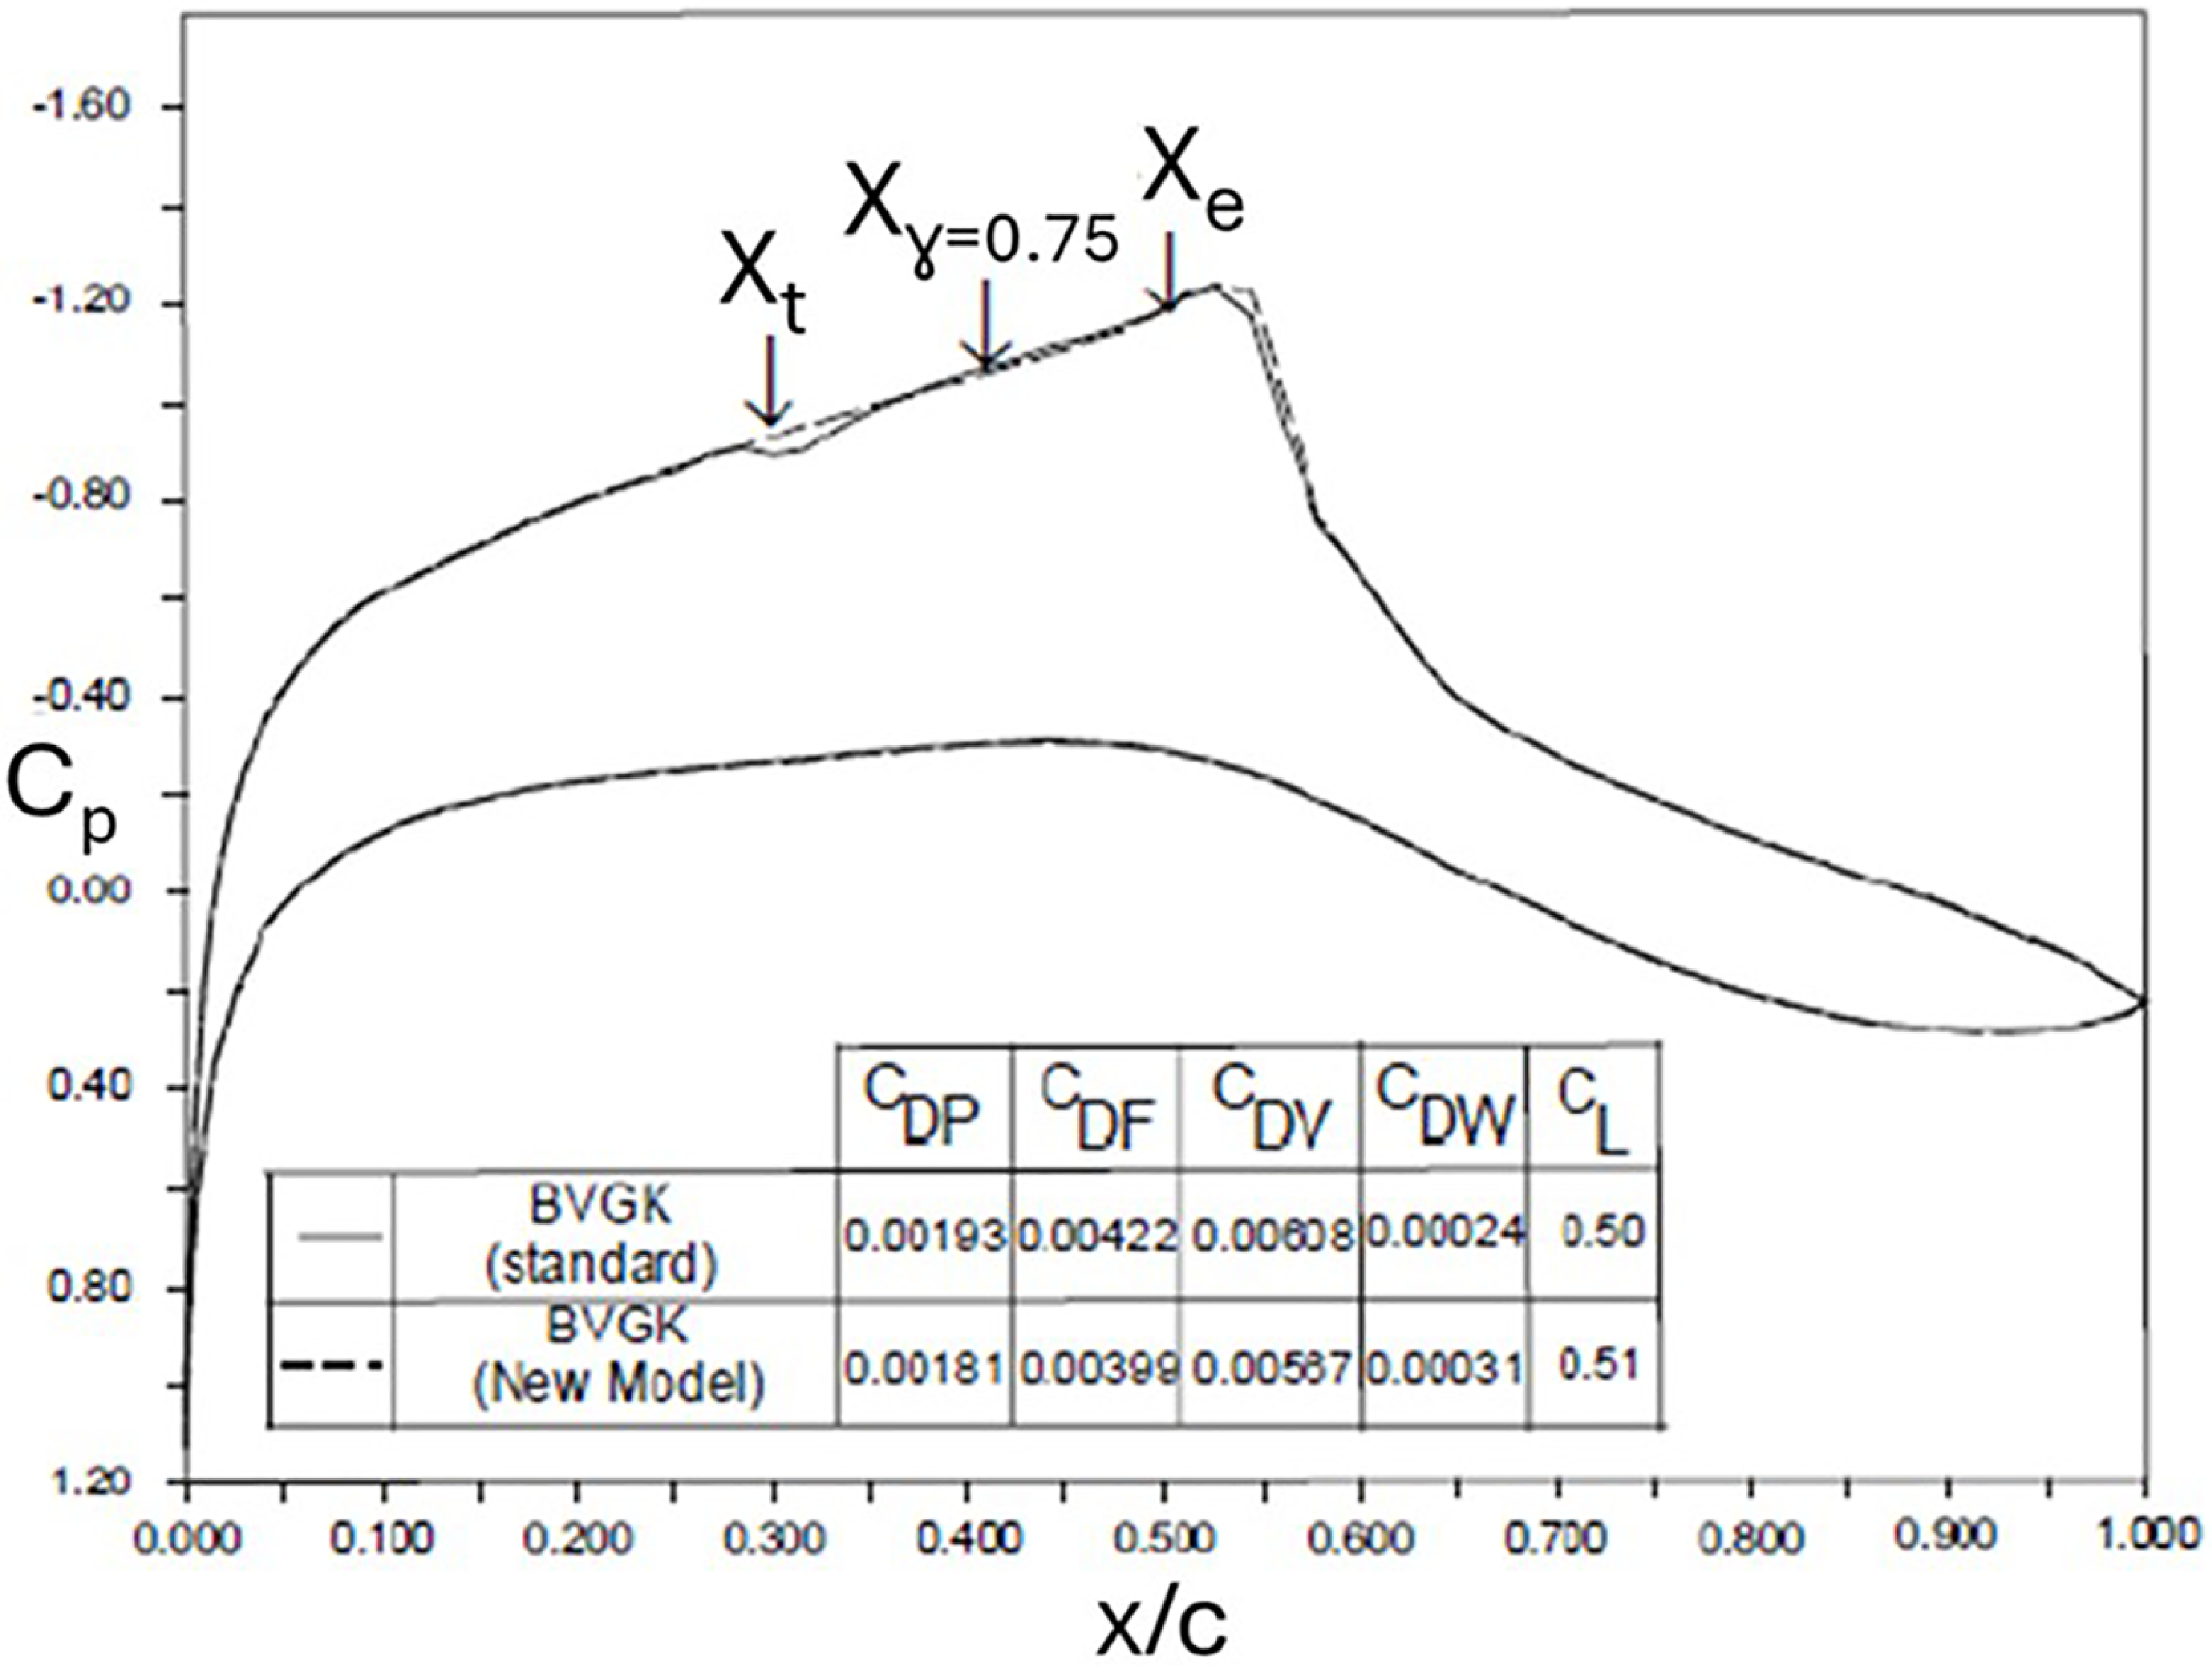
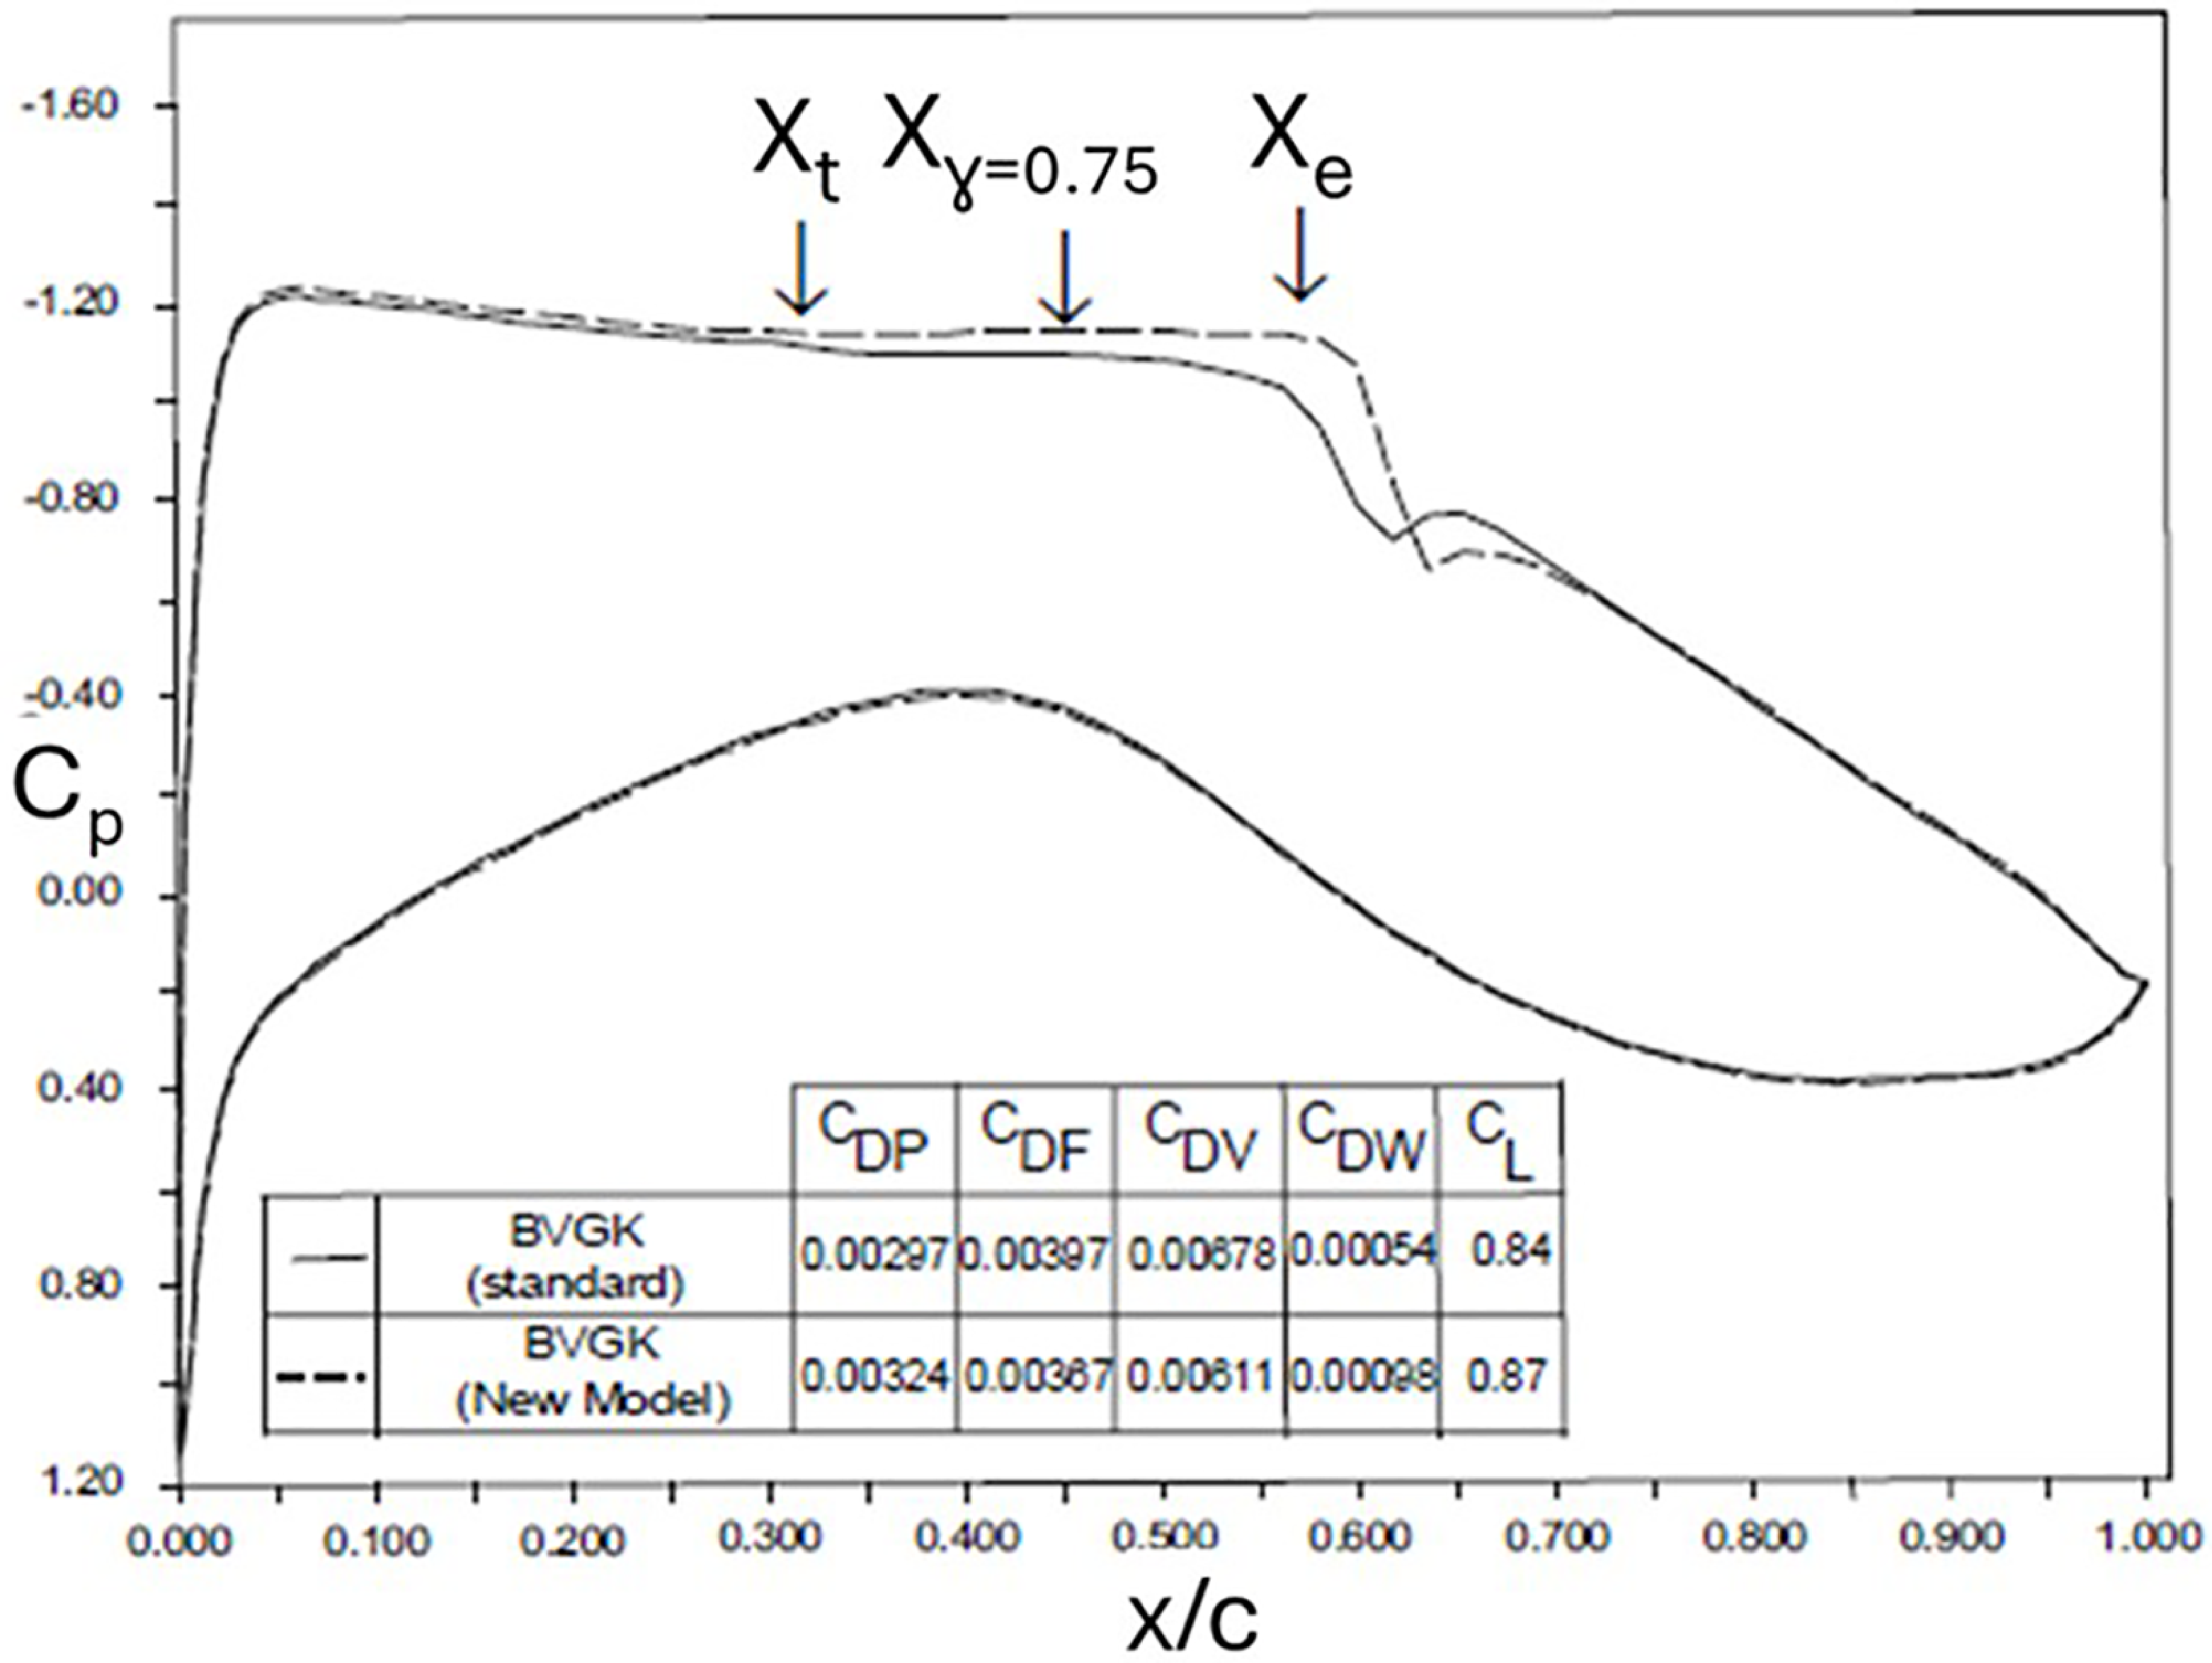
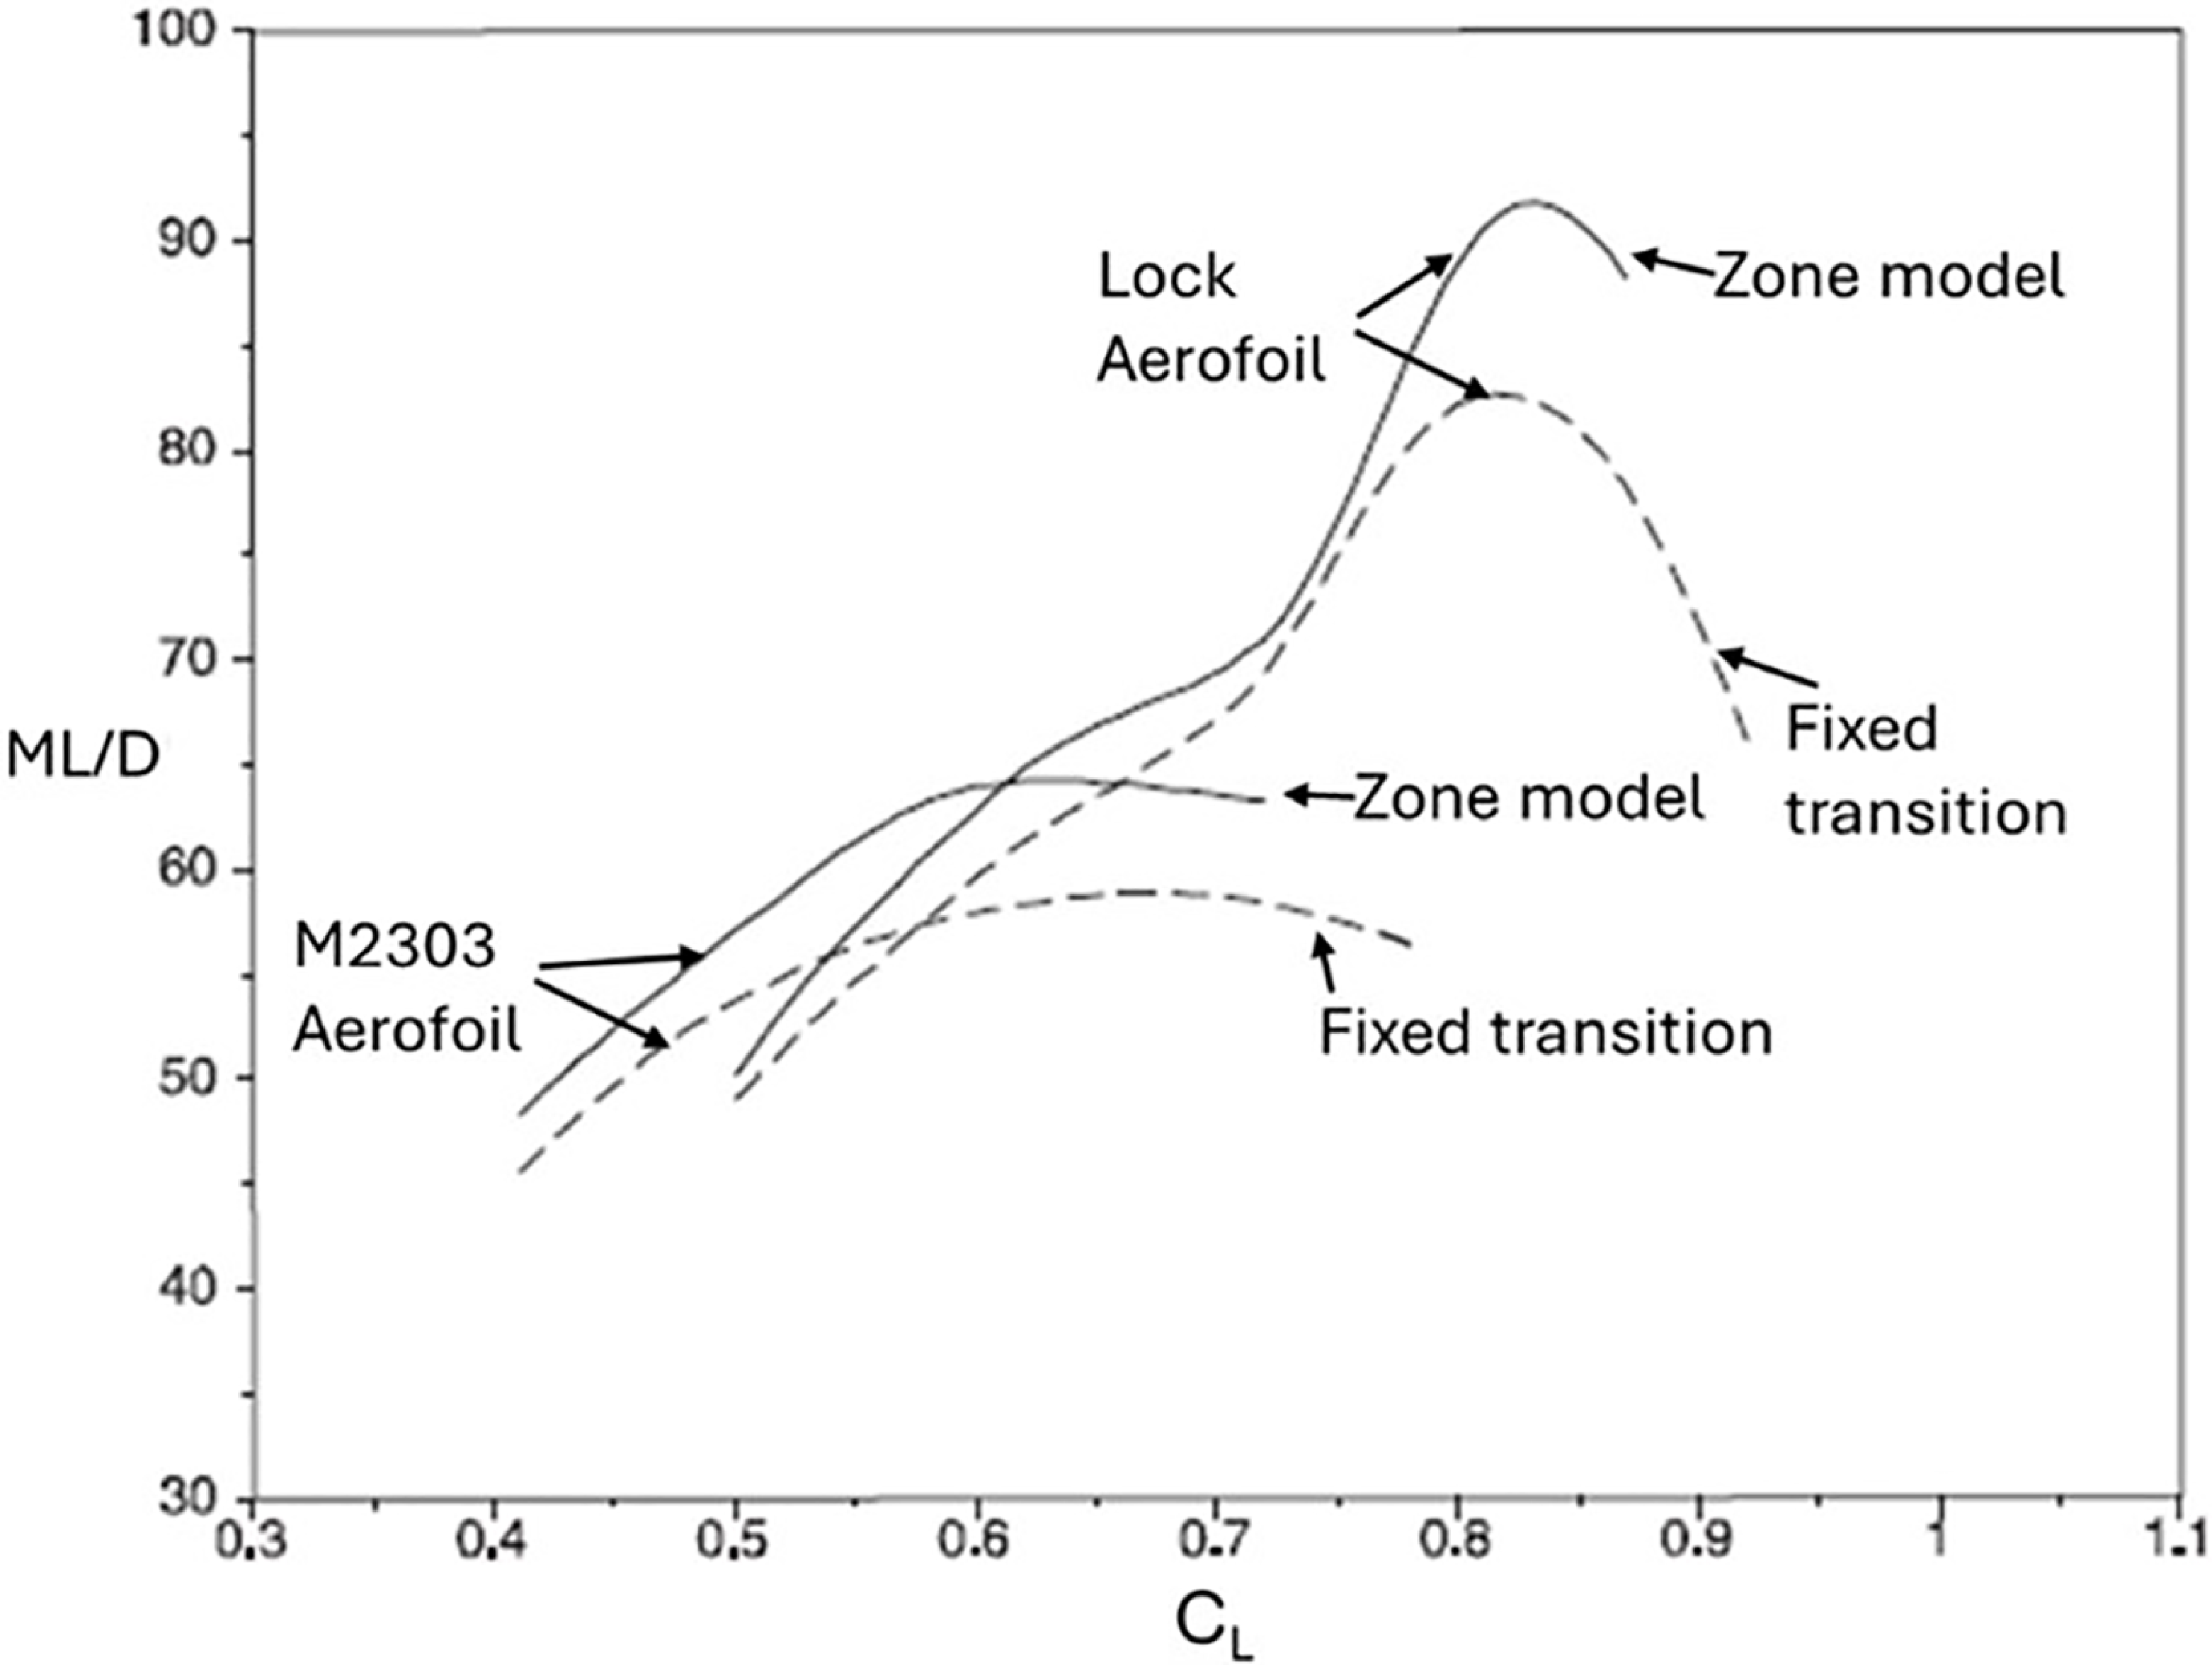
The analysis so far has been focusing on transition onset, but the influence of the transition region on the flow and the effect on the aerodynamic performance of HLFC aerofoils can be significant as shown in an investigation carried out at ARA [Reference Green and Wong8]. This can be seen in the results presented in Figs 29–31 for two aerofoils with different types of upper surface pressure distribution, one with a favourable ‘rooftop’ pressure gradient (M2303 aerofoil) and the other with an adverse gradient (Lock aerofoil).
Effect of transition zone on HLFC aerofoil performance, M2303 aerofoil, M = 0.68, R = 35 × 106, α = 2.8°.

Effect of transition zone on HLFC aerofoil performance, Lock aerofoil, M = 0.72, R = 35 × 106, α = 1.5°.

Effect of transition region on ML/D performance.

These results were obtained using an aerofoil computer code BVGK [Reference Ashill, Wood and Weeks19], where the ‘standard’ version is with transition fixed at the onset location and the ‘new model’ with a transition zone model based on modification of the boundary layer intermittency model due to Narasimha and Dey [Reference Narasimha and Dey20]. Derivation of the modified intermittency model and its implementation into the BVGK code is described in Ref. [Reference Green and Wong8]. The aerofoils have been assumed to be the two-dimensional sections equivalent to an infinite yawed wing with 35° leading-edge sweep. For these sections, transition onset, Xt, as shown in Figs 29 and 30, at a flight Reynolds number of 35 × 106 occurs at about 30% chord, where a suction velocity of −0.0007 from 0 to 5% chord and −0.0002 from 5 to 15% chord has been applied for suppressing the various modes of instability. The predicted transition zone length is about 15% chord, and its effect on the pressure distribution is small compared to a transition fixed case at the onset location, but its effect on the aerodynamic performance is significant as can be seen in the ML/D performance in Fig. 31. In Figs 29 and 30,
 $X_{\gamma =0.75}$
denotes the transition location corresponding to an intermittency factor of 0.75 in the transition zone model due to Narasimha and Dey [Reference Narasimha and Dey20], and X
e denotes end of transition. Various drag components given by BVGK [Reference Ashill, Wood and Weeks19] are also shown in the figures. The differences in ML/D between the fixed transition case and zone model case are mainly due to the reduction in viscous drag (C
DV in Figs 29 and 30) caused by the transition zone length. The results suggested that modelling of transition region should be included in aerodynamic methods for designing HLFC aerofoils and wings. The results presented here are to highlight the potential effects of transition zone on aerodynamic performance. The validity of the Narasimha and Dey intermittency model for HLFC in transonic and high Reynolds number flows and indeed the modified model in Ref. [Reference Green and Wong8] against experimental data have not been investigated. It is recommended that more research on transition zone modelling and its effects on HLFC aerodynamic performance should be carried out in the future.
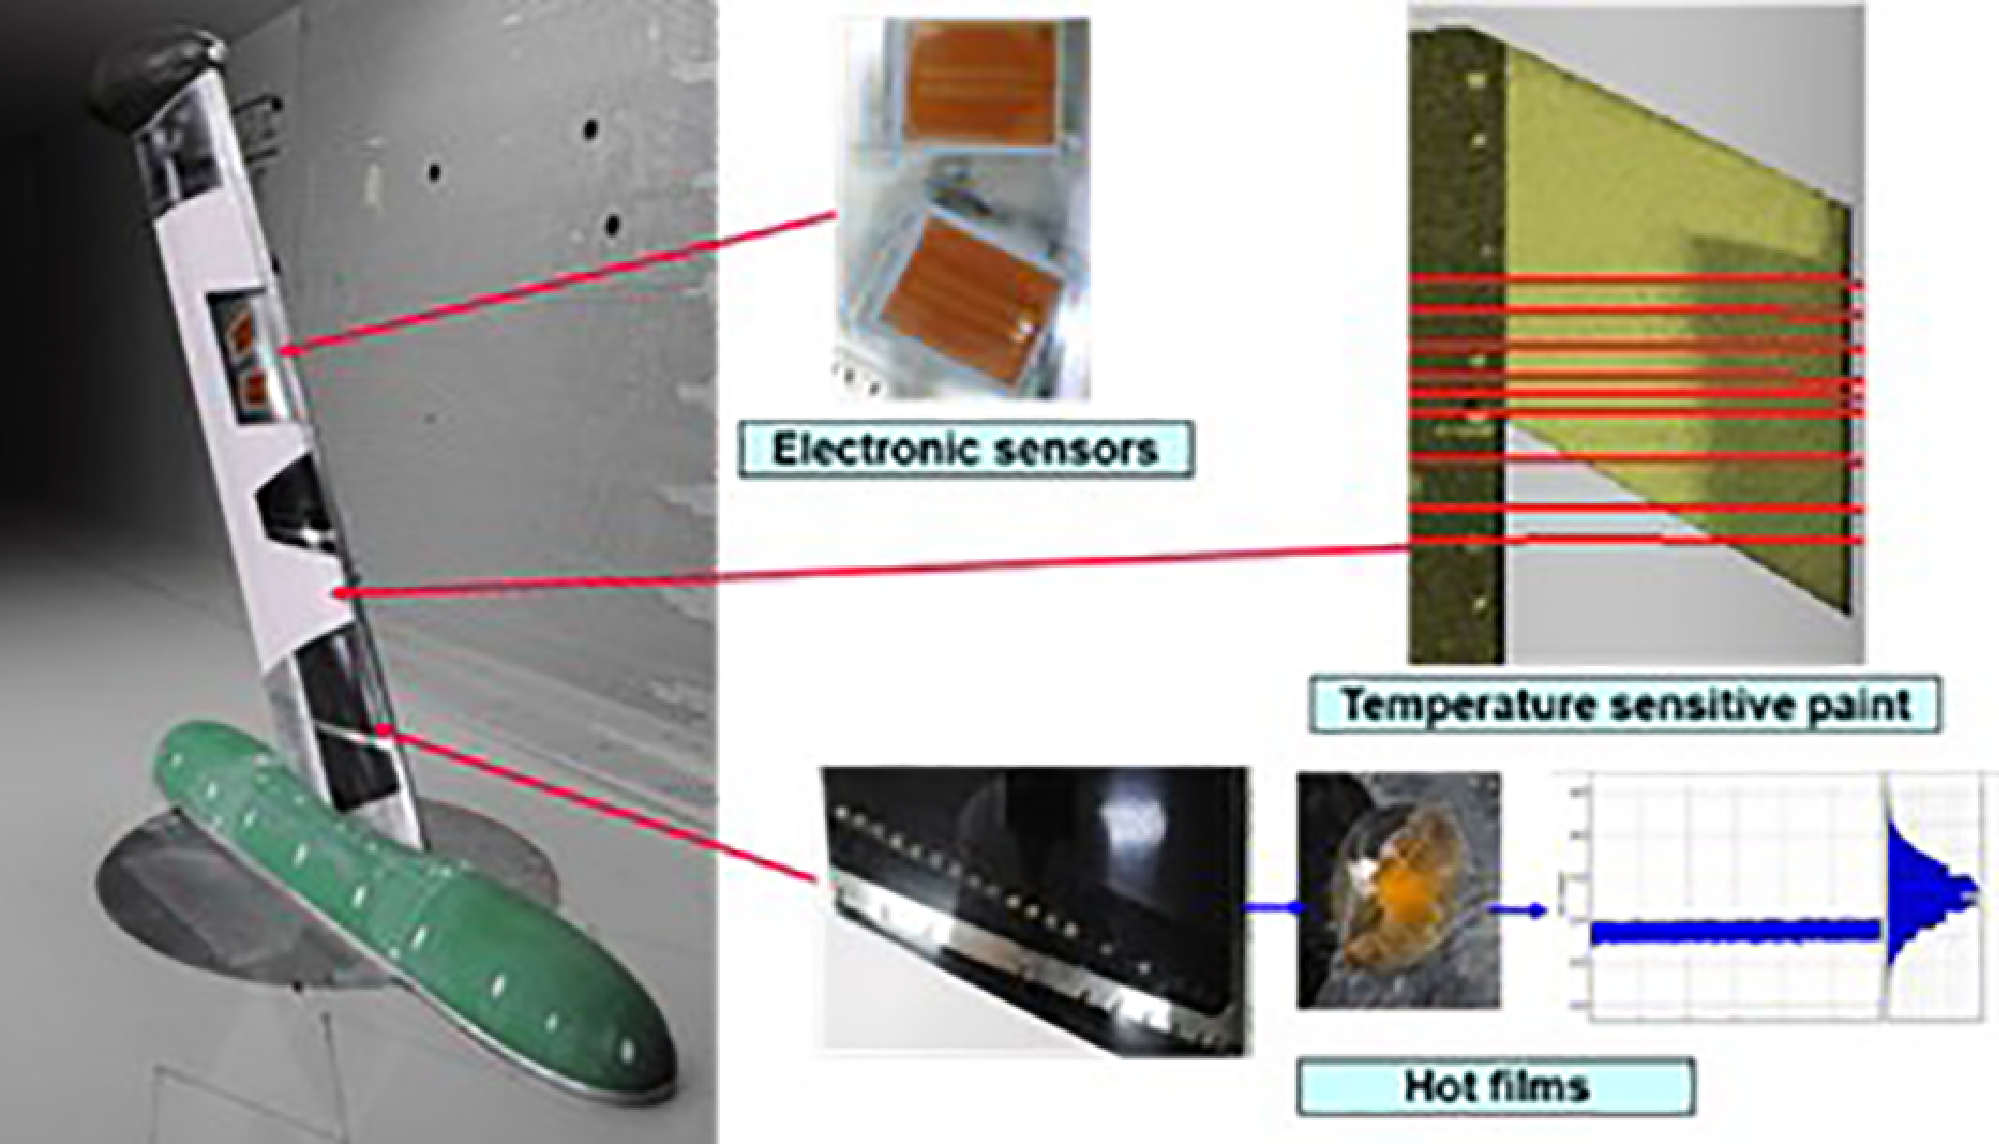
NLF wind tunnel model and instrumentation, sweep angles 0°, 25° and 30°, Mach numbers between 0.45 and 0.85.

Temperature sensitive paint for transition measurement.

7.0 Transition measurement and prediction
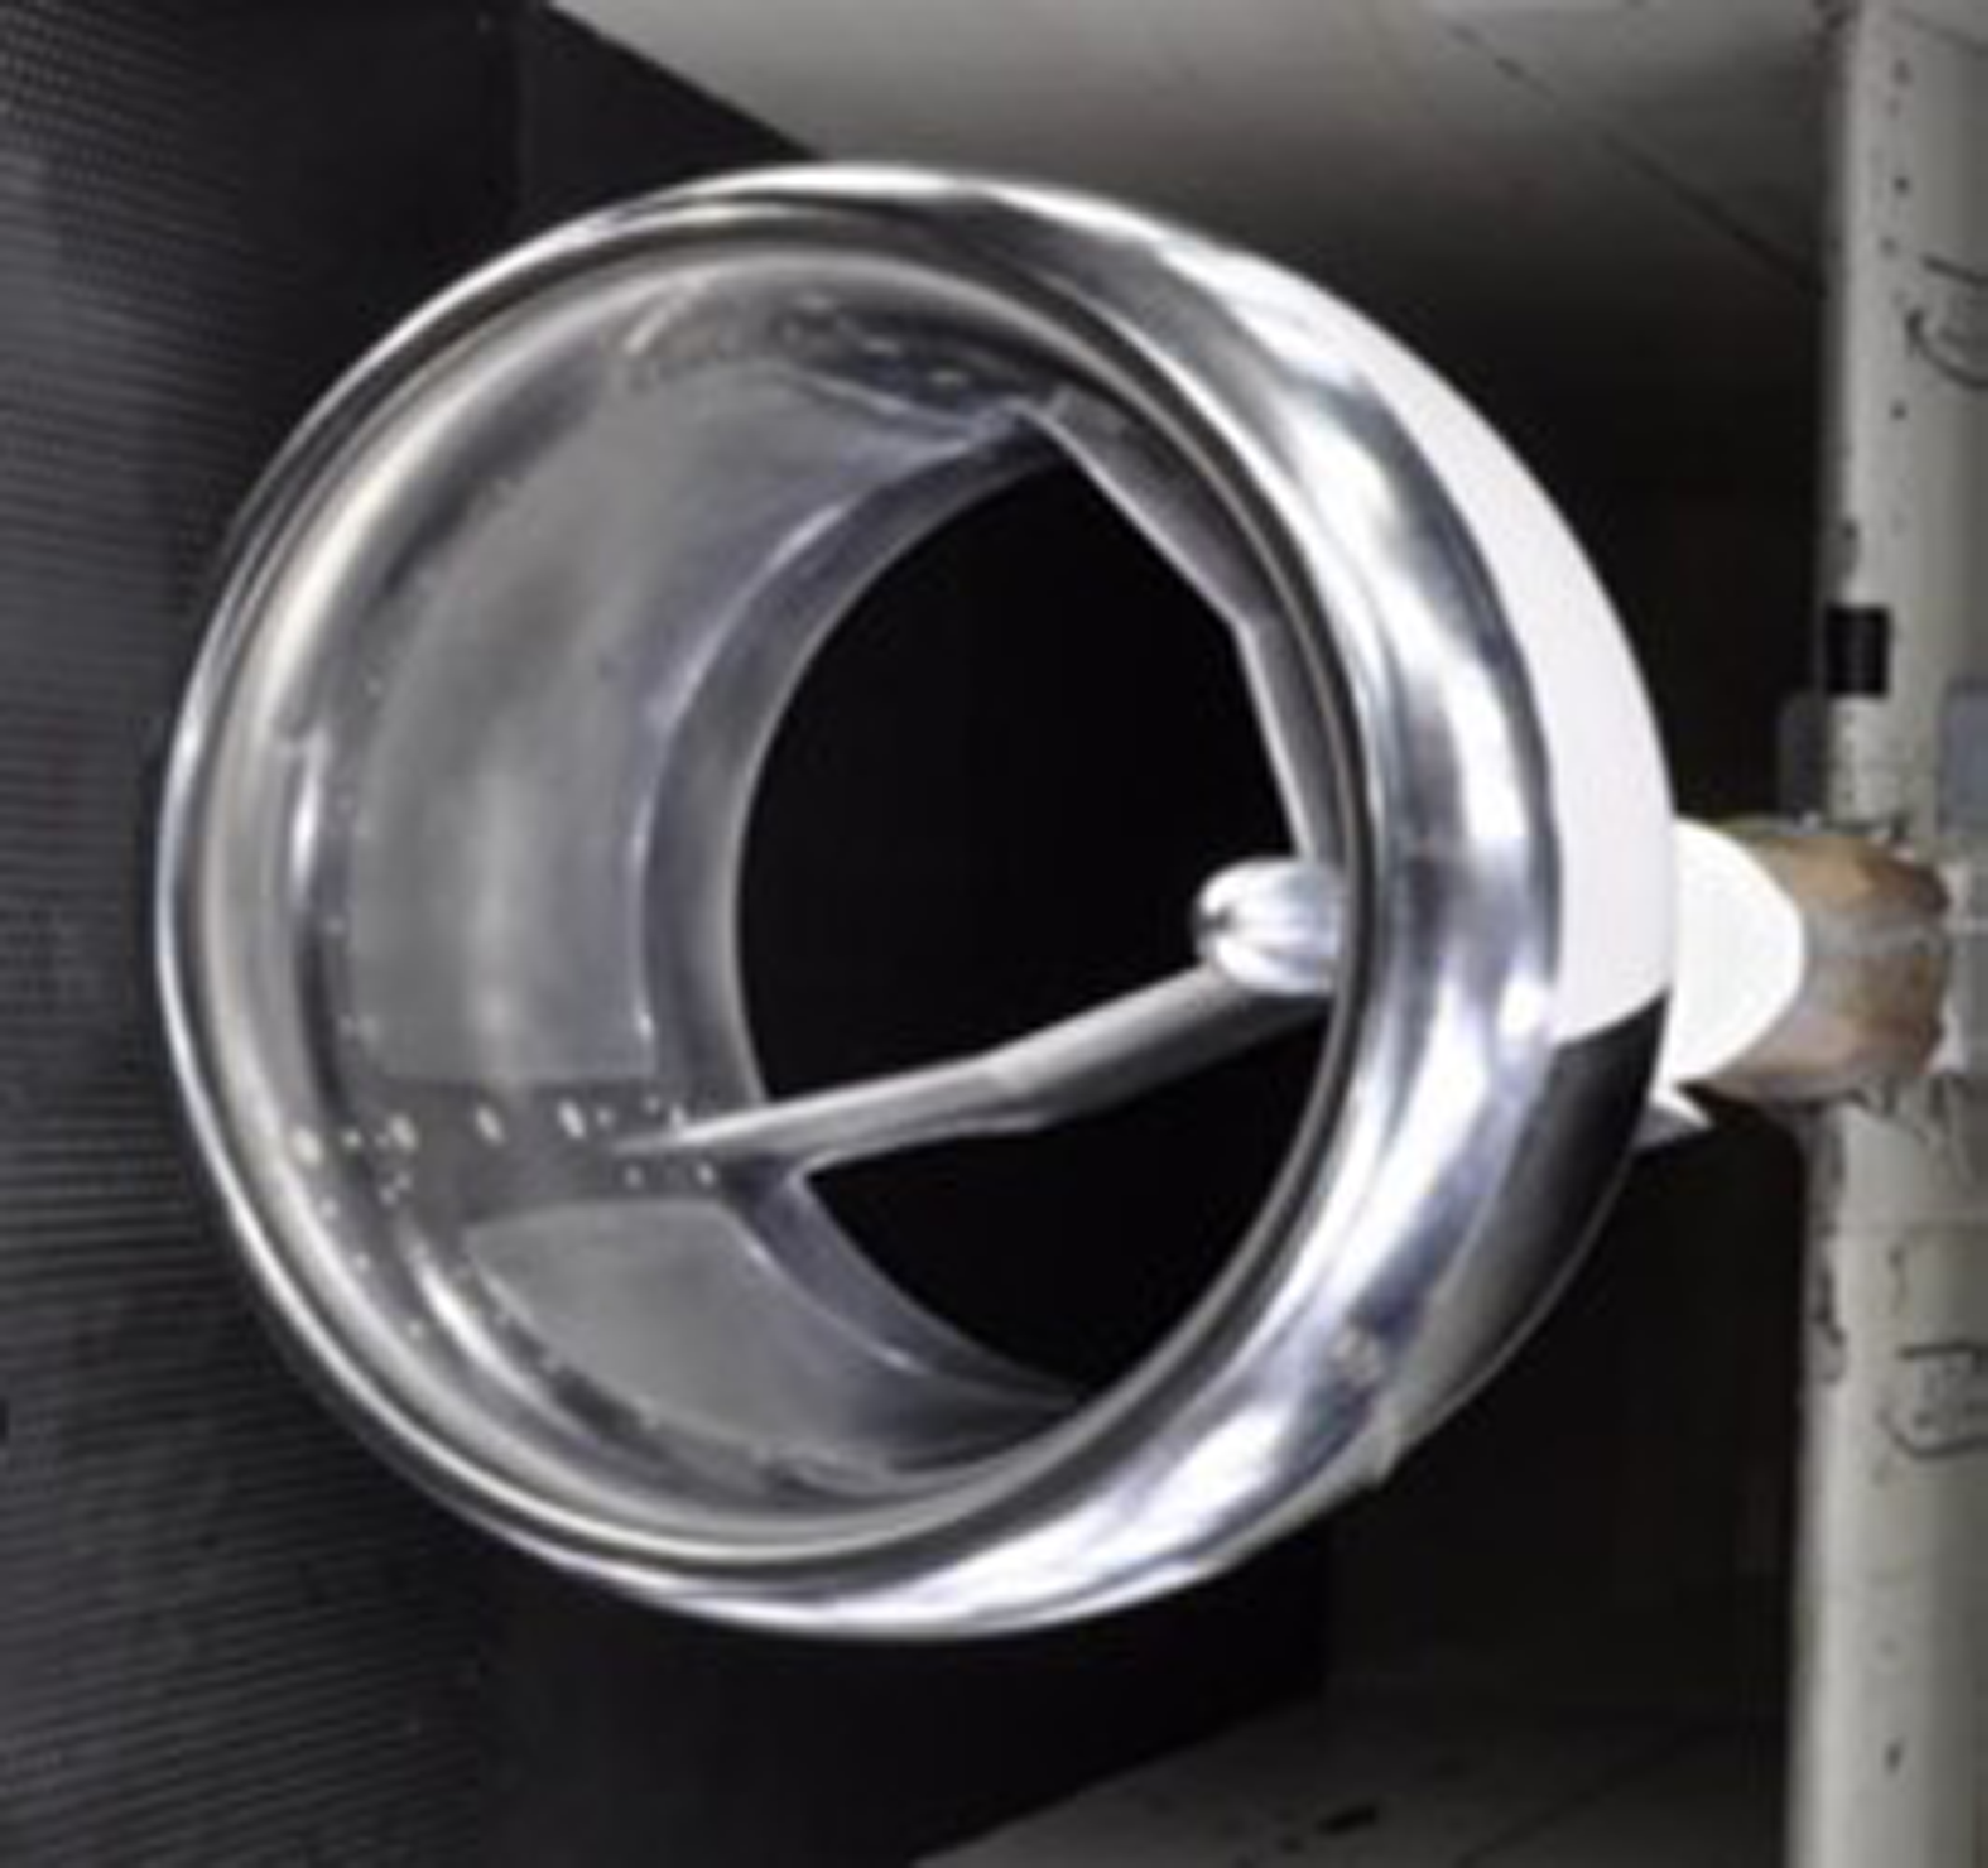
Several research projects have been carried out over the past years at ARA to develop wind-tunnel test techniques for detecting transition for NLF and HLFC configurations [Reference Allen, Lawson, Maina and Alderman9–Reference Lawson, Ciarella and Wong11]. The experiment in Ref. [Reference Allen, Lawson, Maina and Alderman9] involved a NLF-swept wing panel (Figs 32 and 33) with the aim of determining an N-factor for transition for the ARA TWT and to validate the linear stability analysis method for transition prediction [Reference Atkin14]. The wind tunnel test in Ref. [Reference Lawson and Ciarella10] measured the effects of small surface irregularities on laminar flow extent. The investigation in Ref. [Reference Lawson, Ciarella and Wong11] involved experimental techniques for a HLFC concept with a single chamber and variable porosity for delaying transition, where transition prediction analysis of the HLFC wind tunnel test data was carried out in Ref. [Reference Ciarella, Lawson and Wong21].
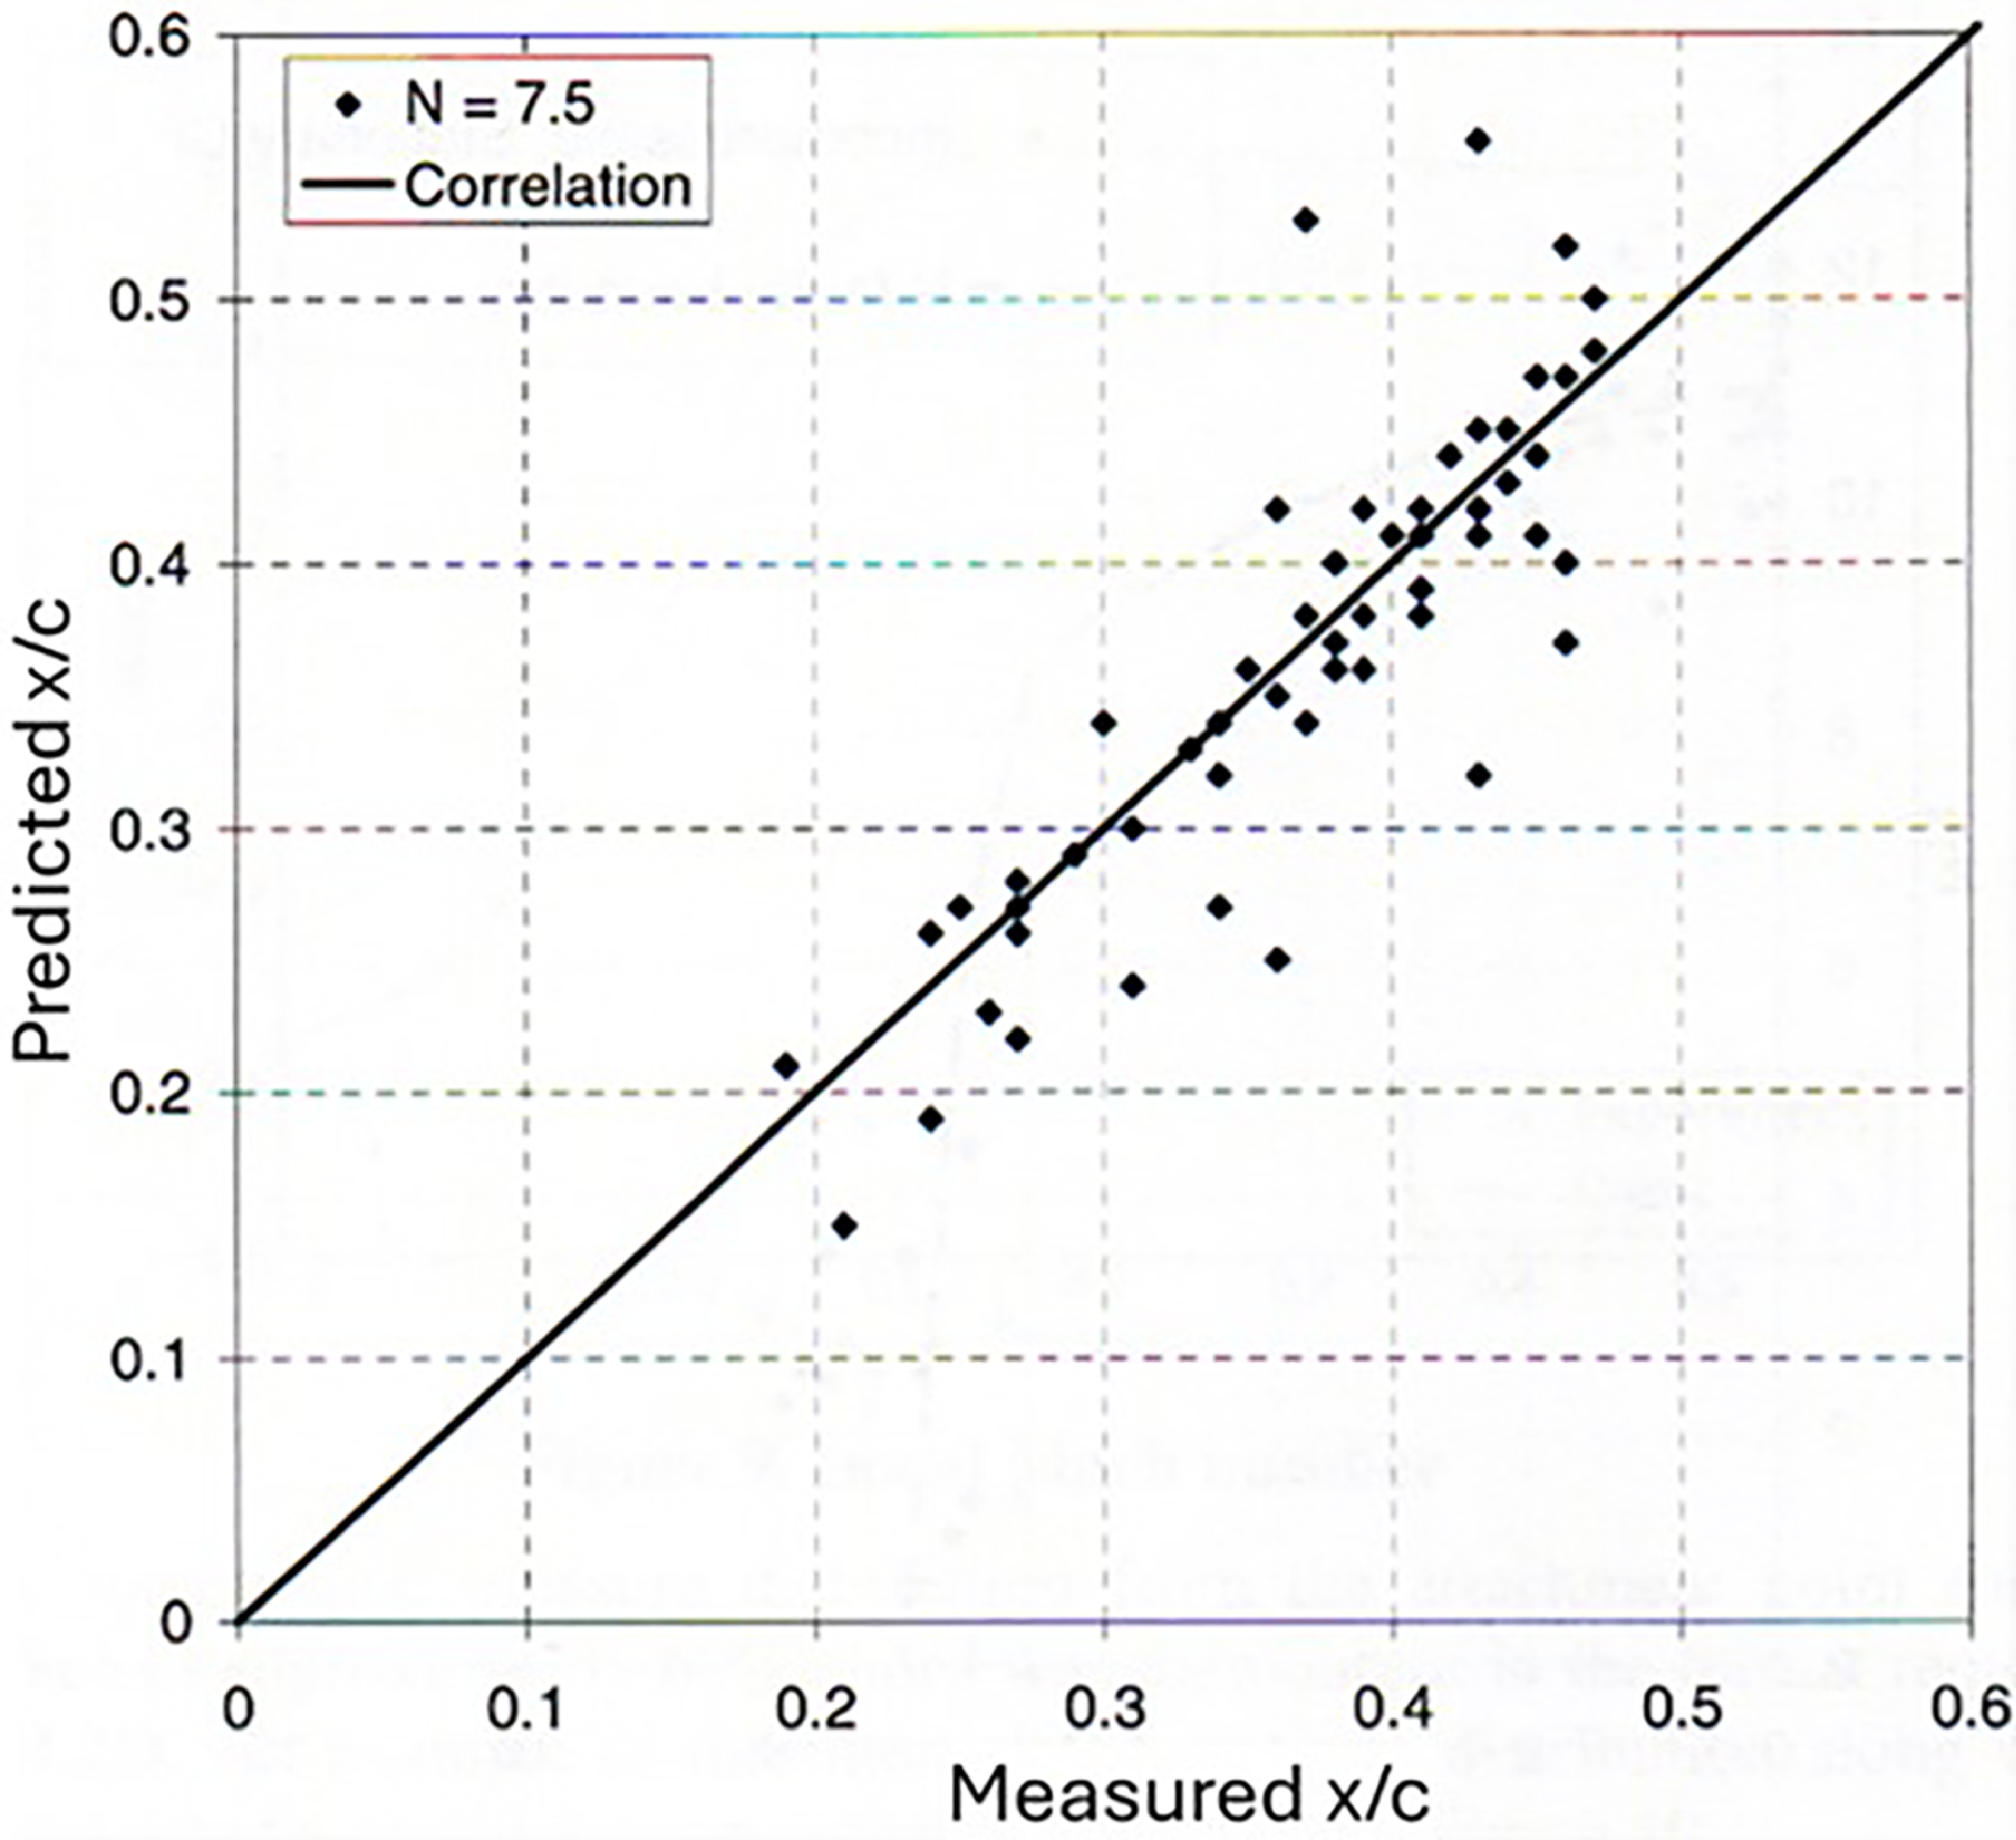
The transition onset locations for a range of wind tunnel conditions have been analysed with the linear stability analysis transition prediction method, CoDS [Reference Atkin14]. The flow environment, such as noise and turbulence, affects transition location, and the onset of transition is calibrated by the N-factor with the linear stability method. It was established that the N-factor for transition for ARA TWT is about 7.5 as shown in Fig. 34, which is well within the range for similar industrial transonic wind tunnels, indicating that the tunnel is suitable for laminar flow testing.
Predicted and measured transition locations of ARA TWT.

The wind tunnel data points shown in Fig. 34 are widely scattered. This was due to the practical nature and difficulties in transition measurement as also experienced in the experimental data obtained in the Defence Evaluation and Research Agency (DERA) wind tunnel in Ref. [Reference Mughal23]. The two tunnels have a similar size and speed. It was difficult to obtain a constant transition line across the span of the wind tunnel model, as transition is sensitive to surface roughness, manufacturing accuracy of the model and cleanliness of wind tunnel flow as a single dust particle impacted on the model surface could cause transition, as shown in Fig. 37. In Ref. [Reference Mughal23], two N-factors for transition were correlated, one for CF with 8 and another for TS with 6. The single N-factors of 7.5 for the ARA TWT is between these values, based on the linear stability analysis compressible method, CoDs [Reference Atkin14]. This method has been used for the design of the HLFC wind tunnel model (Fig. 39) described in Section 7.3, based on the correlated N-factor for transition obtained for ARA TWT. Detailed analysis of the measured data for the HLFC wind tunnel model has shown that the N-factor for transition is different for different instability mechanisms (see Section 7.3).
ALFET Model installed in the ARA TWT.

7.1 Surface imperfections
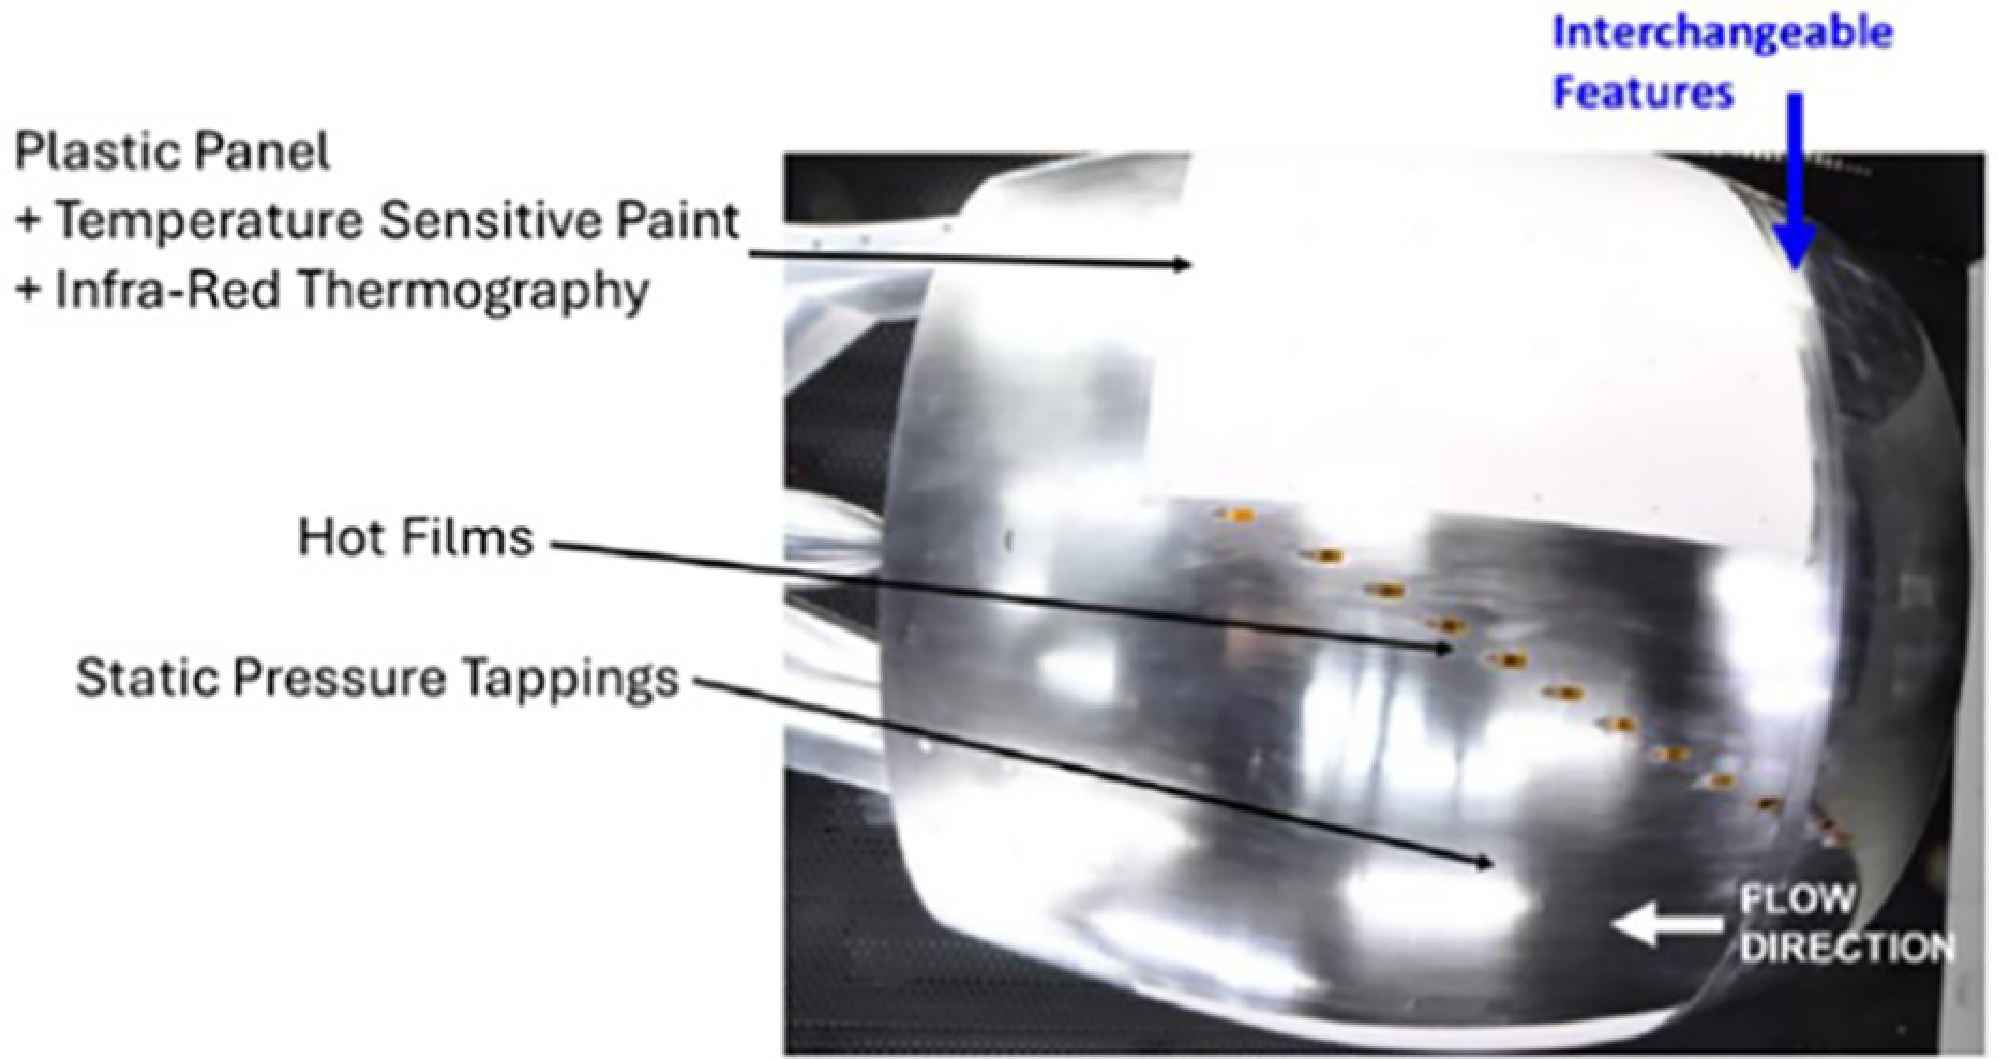
Surface imperfections in the wing leading-edge region could result from the structural integration of various components such as the high-lift devices and anti-icing system, where small steps or grooves may occur between these components. The effect of steps and grooves on transition has been investigated in the ARA TWT [Reference Lawson and Ciarella10] under the Advanced Laminar Flow Enabling Technologies (ATI/IUK ALFET) programme led by Airbus, which aimed to develop the understanding and tools required to design and build a natural laminar flow wing. A ring wing model shown in Fig. 35 was designed and manufactured with an NLF aerofoil section and provision to install a variety of surface imperfections. The model was manufactured with a high-quality surface finish and fitted with instrumentation to measure laminar flow extent, including an insulating panel for use with IR thermography and hot films as shown in Fig. 36.
Side view of the installed measurement system.

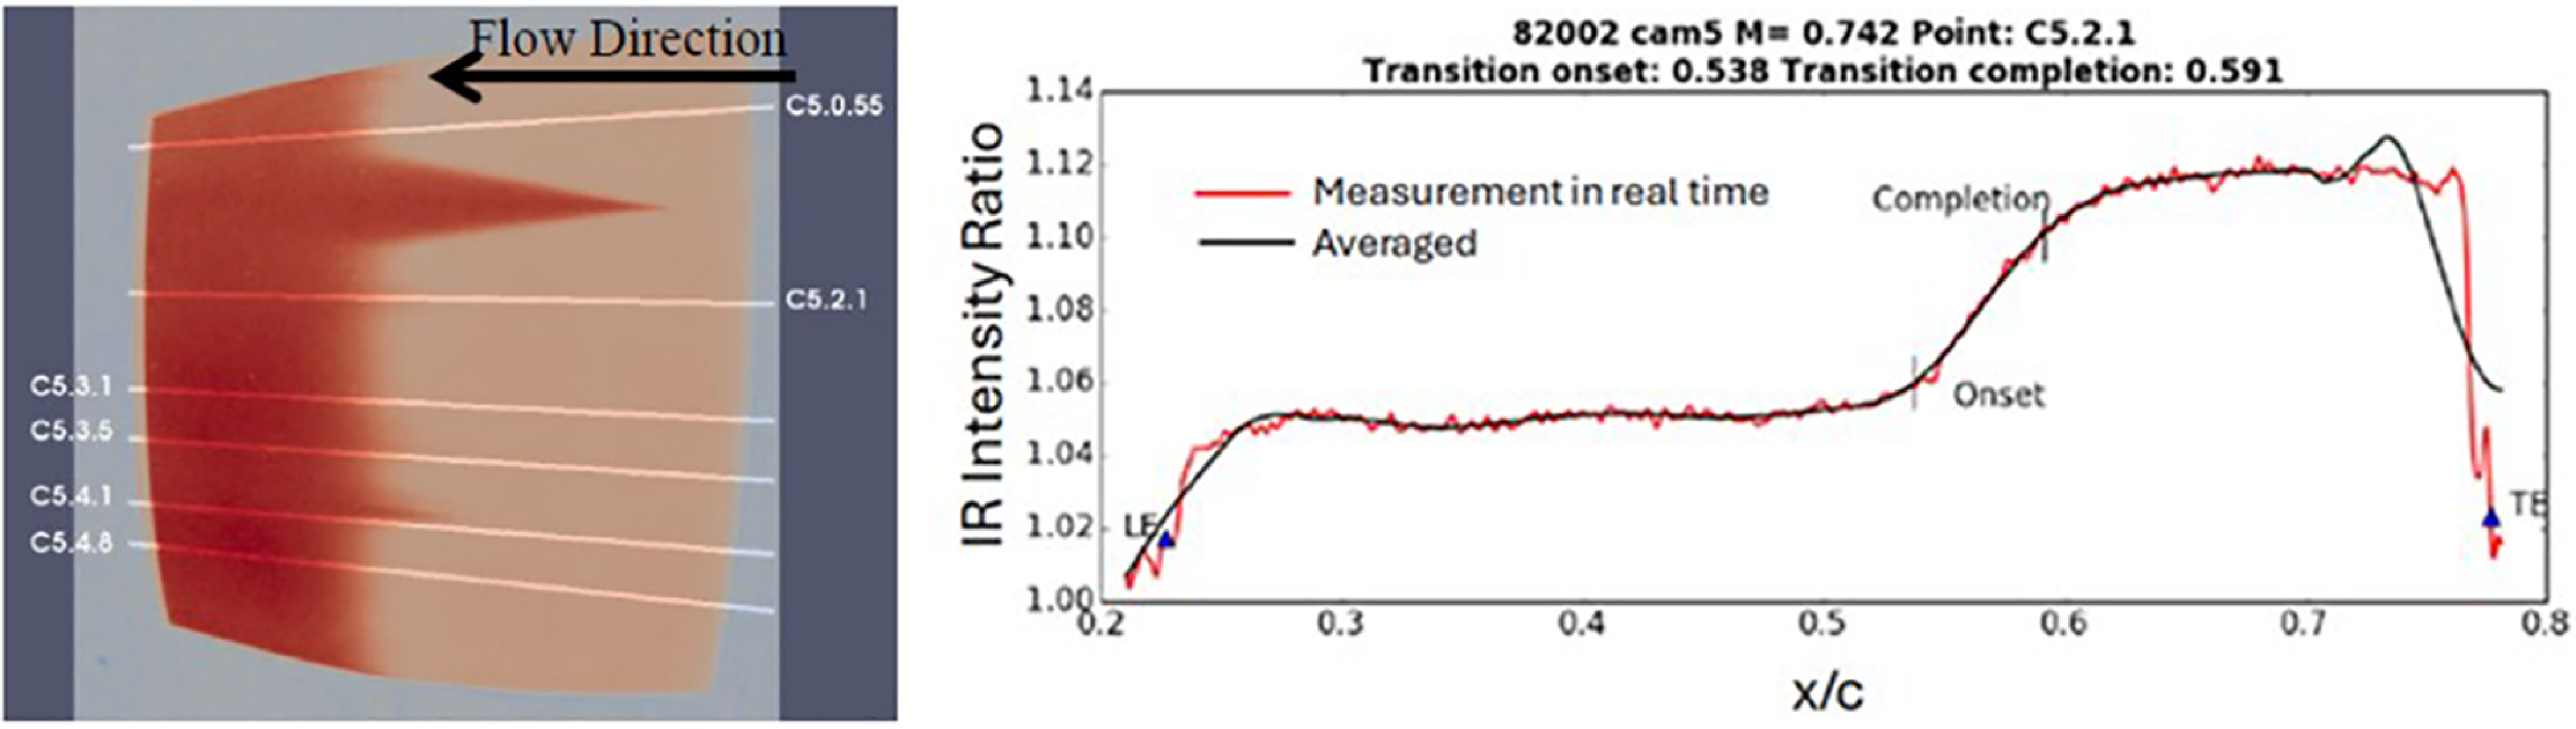
Infra-red example data.

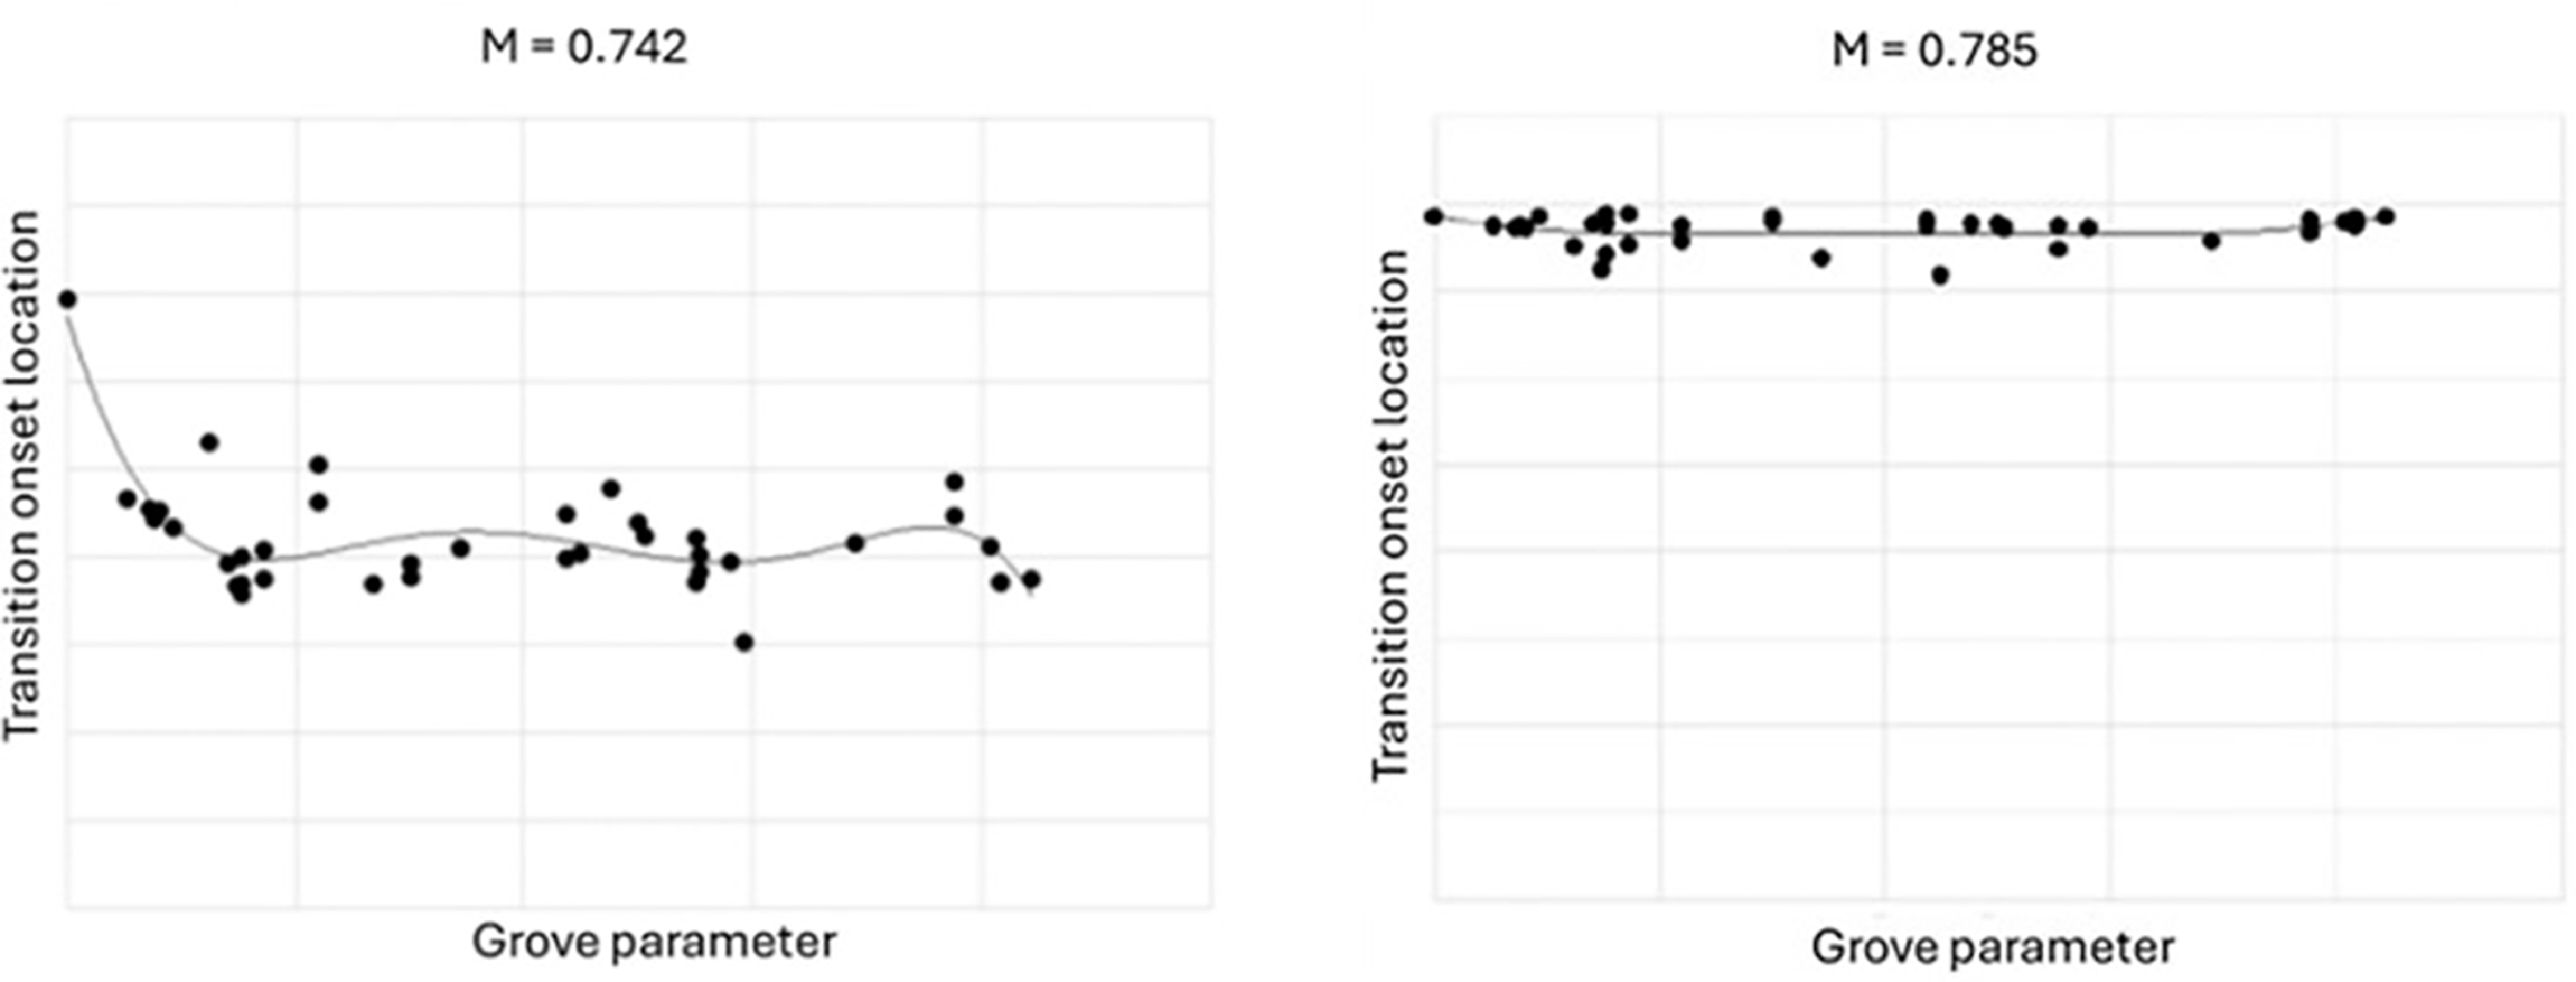
Effect of groove parameter on transition onset location.

HLFC wind tunnel model.

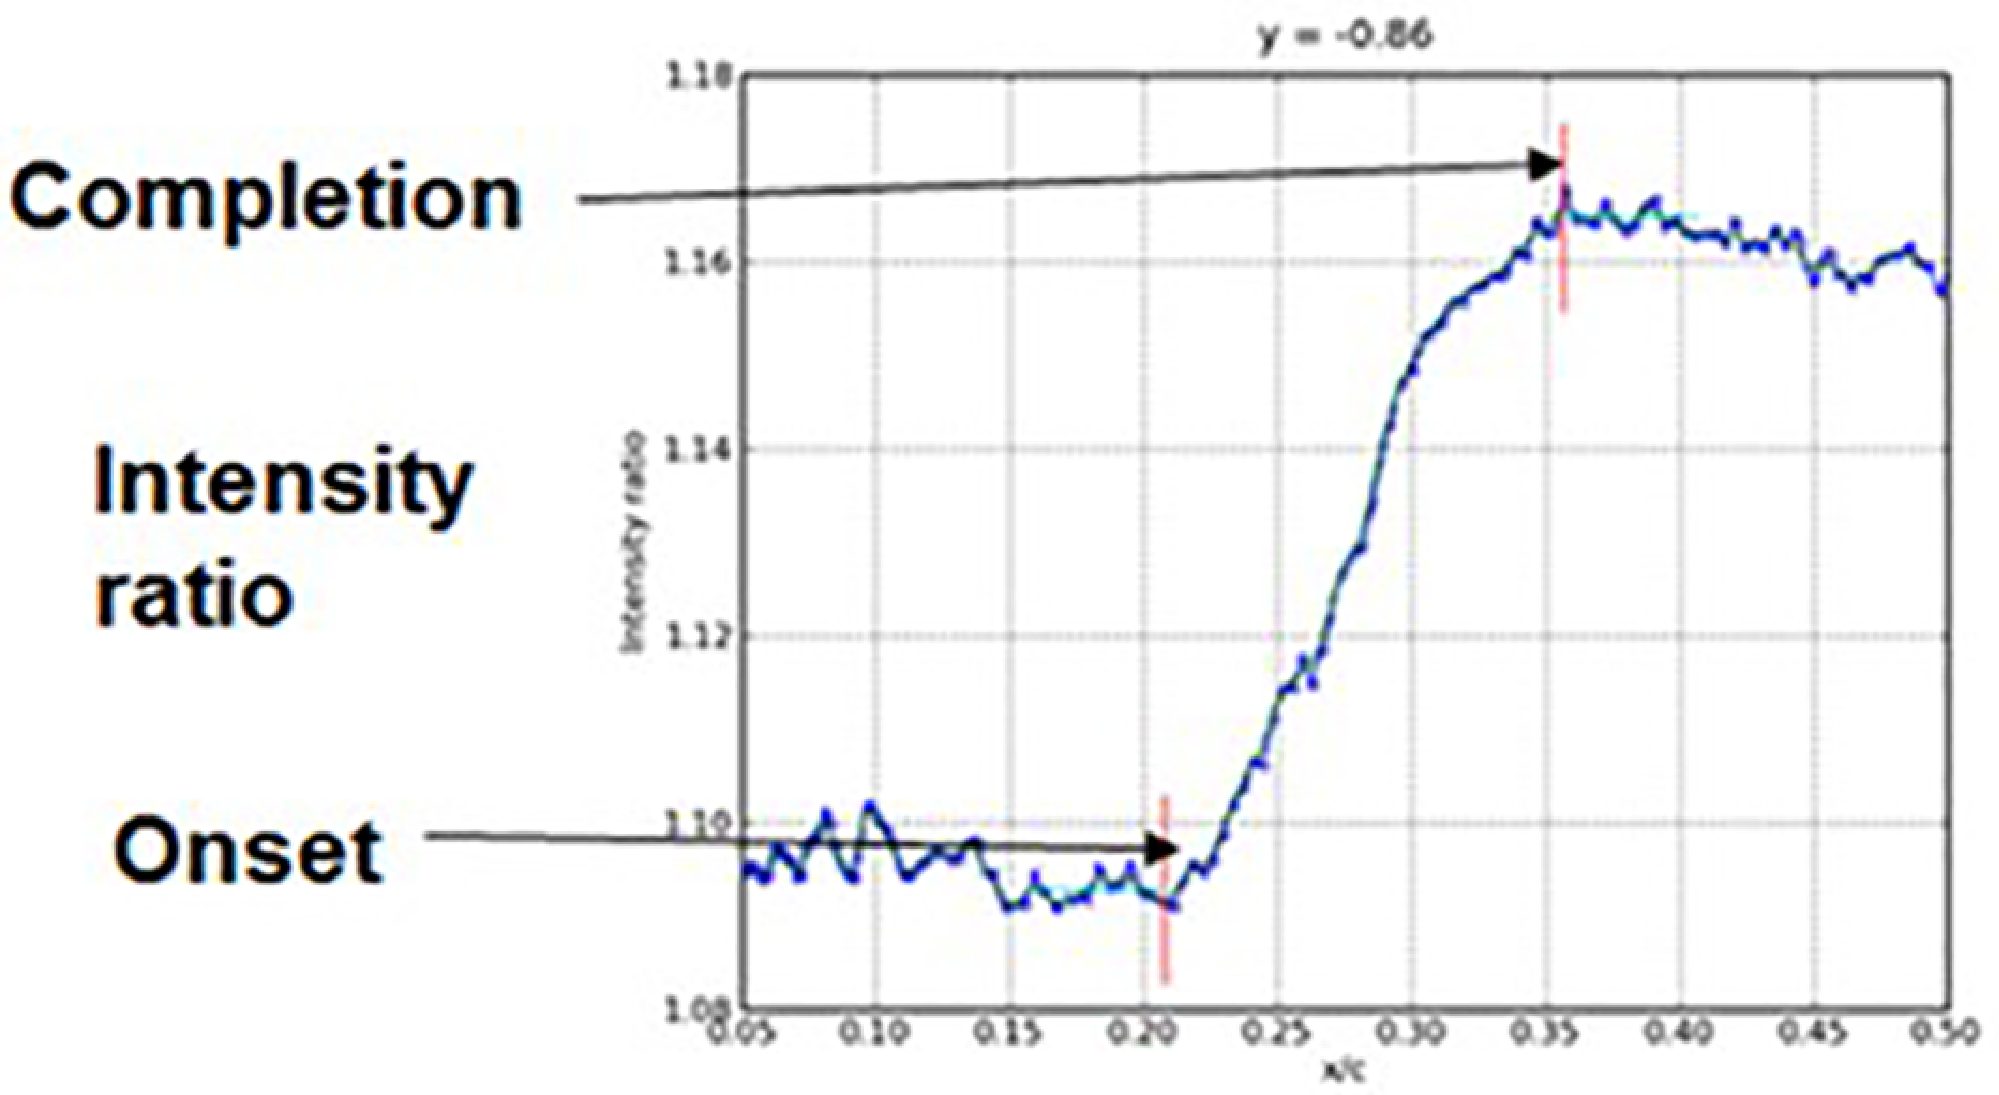
The model was tested over a range of Mach numbers from M ∞ = 0.574 to M ∞ = 0.785 for grooves of different depths, defined by a groove parameter. An example of an IR image showing transition onset locations is illustrated in Fig. 37. The location for transition onset and completion were obtained from the intensity ratio distribution from the IR data as shown in Fig. 37 for a slice at location 5.2.1. A large quantity of transition data for various groove parameters and Mach numbers were obtained. An example test result showing the effect of the groove parameter on transition onset location is presented in Fig. 38. The data are widely scattered, and it is difficult to deduce a definitive effect of various groove parameters on transition. It is acknowledged that uncertainty limits in the data should be indicated but not available. The line in Fig. 38 is an average curve fit through the data to aid visually for any trends in the scattered data points. However, it was found that the groove has the effect of forcing transition forward more strongly at lower than at higher Mach numbers [Reference Lawson and Ciarella10]. The transition onset location and definition of the grove parameter cannot be disclosed in this paper due to commercial confidentiality. The example of results presented here are to show that ARA has acquired the wind tunnel testing capability for measuring the effect of small features on transition in NLF, and the knowledge gained could be extended to HLFC to investigate the effect of suction on the disturbances due to various degrees of surface imperfections in the future.
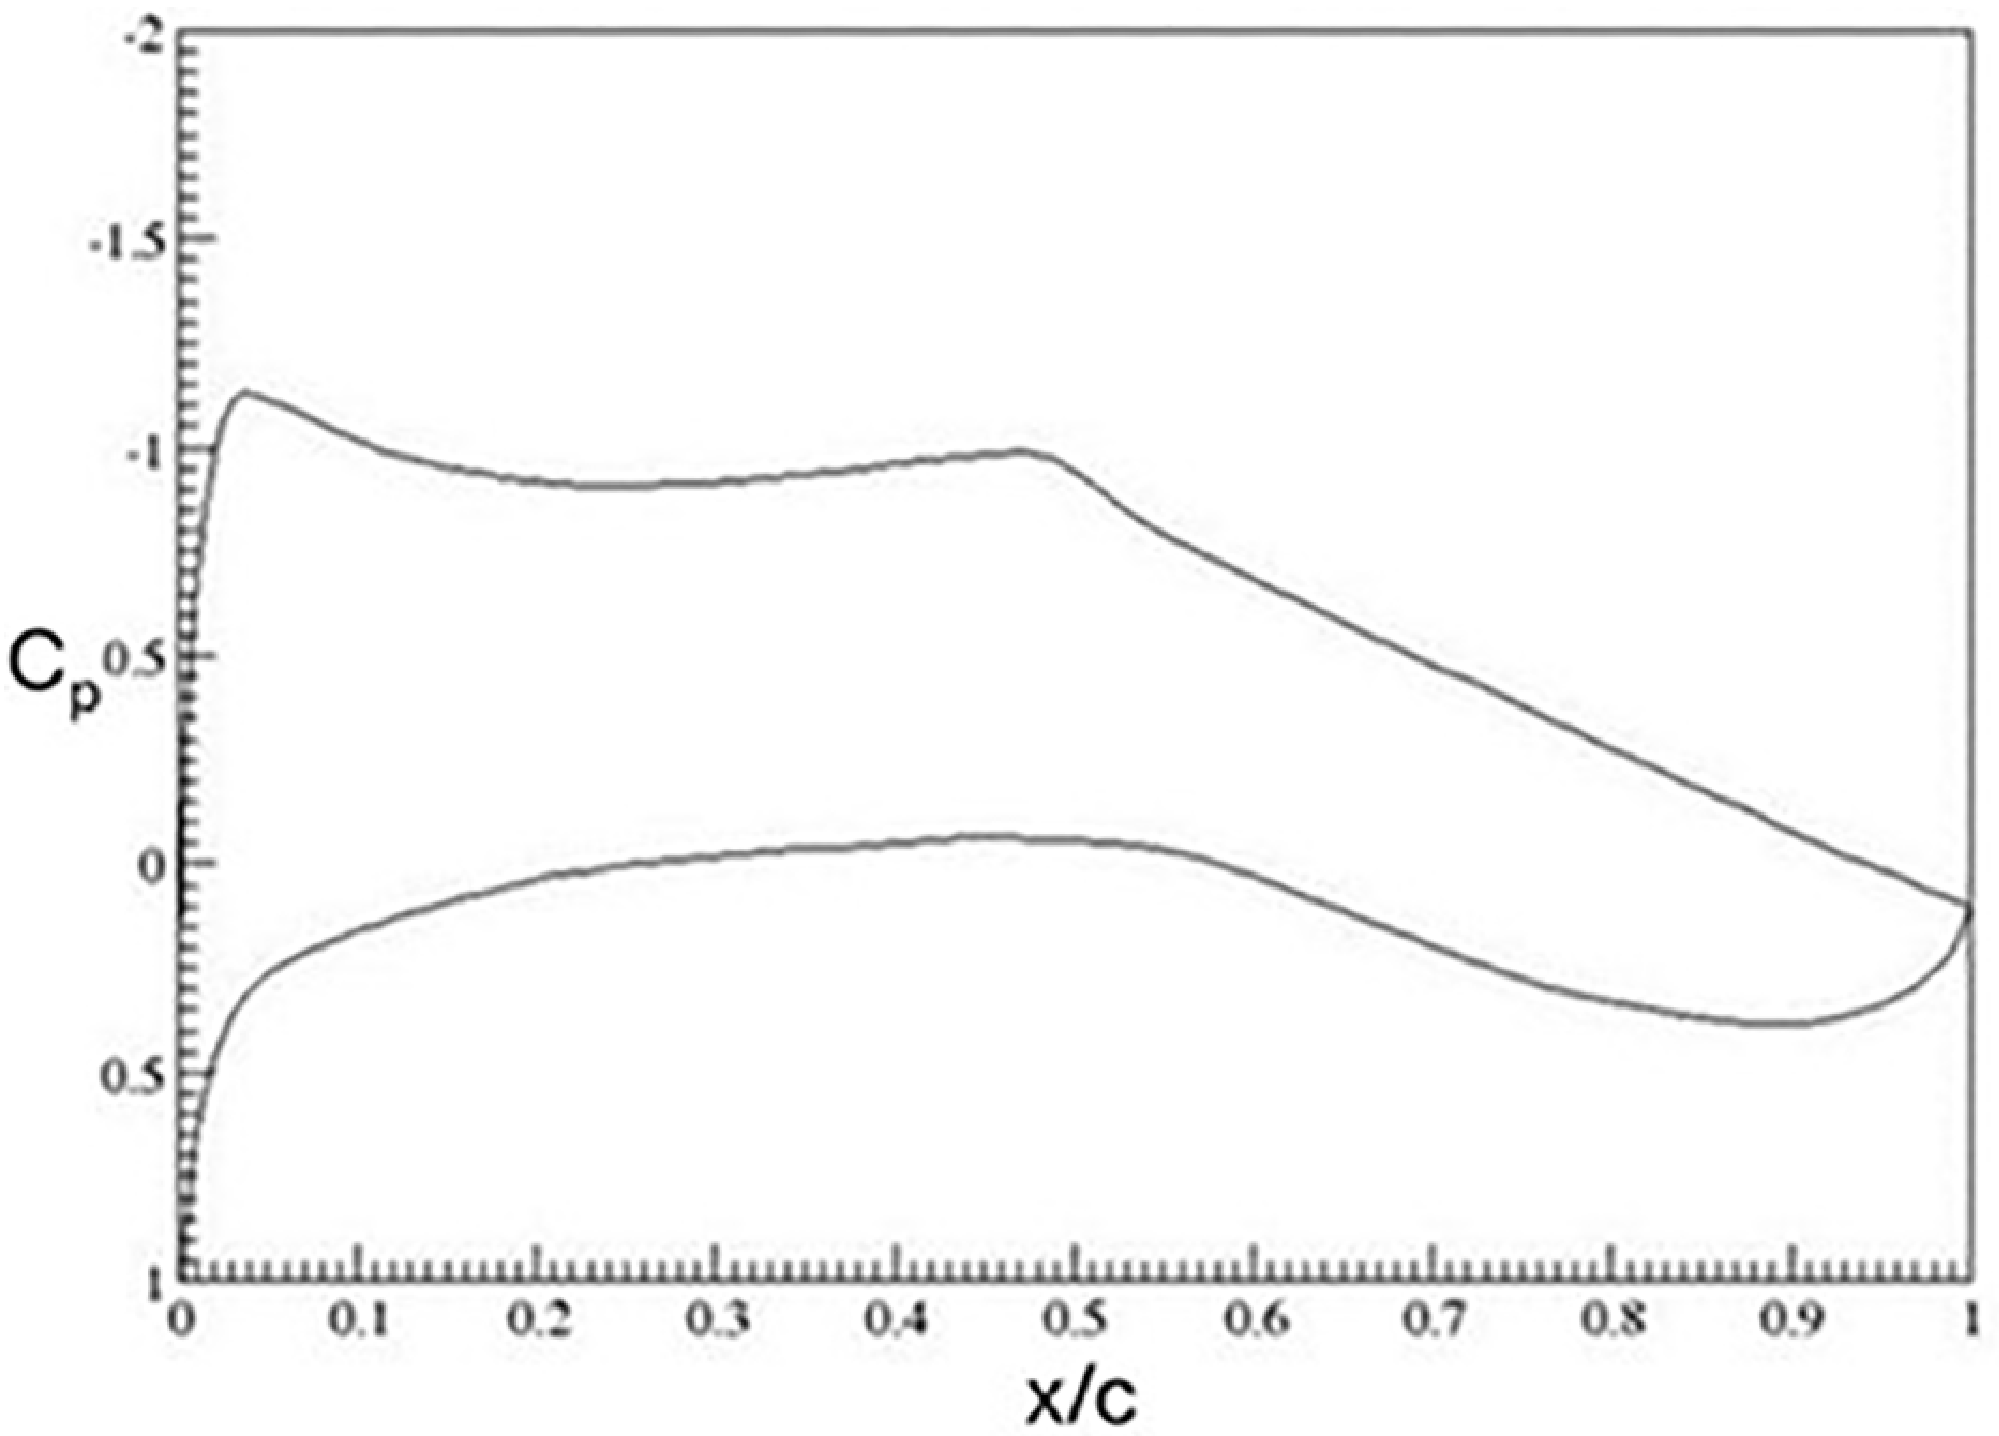
Two-dimensional pressure distribution, M 2D = 0.70, M ∞ = 0.85, Λ = 35°, α = 1.8°.

7.2 HLFC and variable porosity
A HLFC wind tunnel model with a variable porosity surface has been tested in ARA TWT [Reference Lawson, Ciarella and Wong11]. The HLFC wind tunnel model was specifically designed in a modular form, with the mid-span leading-edge region interchangeable for various porous panels, as shown in Fig. 39. The aim of the wind tunnel experiments was to demonstrate, for the types of pressure distribution relevant to civil transport aircraft design, the effectiveness of a range of transition control techniques. Additional test objectives included generating a data set for method validation and to evaluate the suction properties of porous plates. The pressure distribution of the aerofoil section normal to leading-edge sweep of 35° for the design condition at M
∞ = 0.85 is shown in Fig. 40. It was not possible to compare the design pressure distribution with measurement as the wind tunnel was not able to run at M = 0.85 during the test due to mechanical problems. Three different panels were tested: a solid panel, a constant porosity panel and variable porosity panel. The porous panels had 45
 $\unicode{x03BC}$
m diameter holes, providing porosity from the leading edge to 20% chord on the upper surface. The constant porosity panel had a hole spacing to hole diameter ratio (S
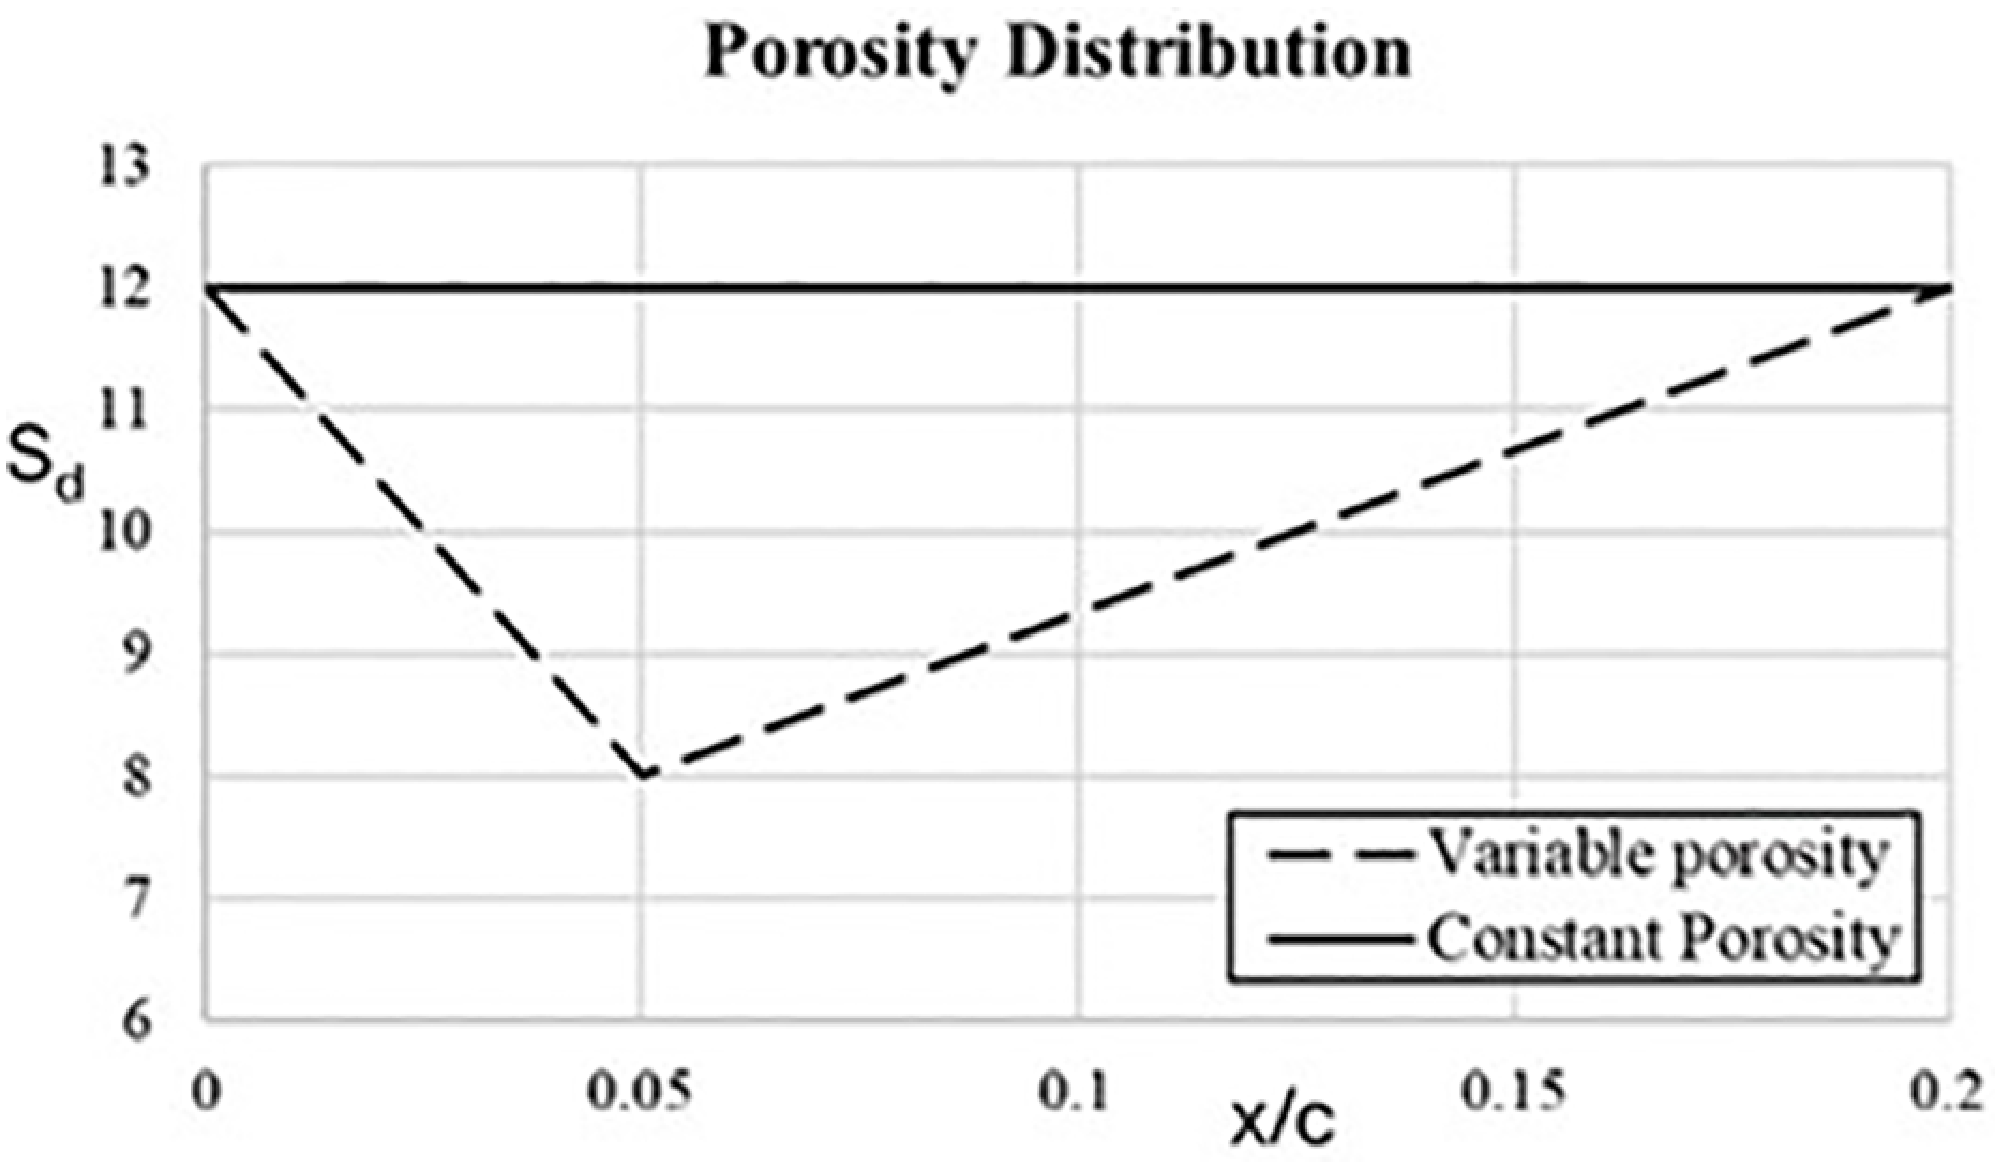
d) of 12, while the variable porosity panel had a linear variation of Sd from 12 at the leading edge to 8 at 5% chord returning back to 12 at 20% chord, as shown in Fig. 41. The hole diameter and porosity were determined based on the concept established in earlier research described in Section 2, to provide an appropriate level of surface suction to control CF and TS to delay transition sufficiently downstream in wind tunnel conditions. Wind tunnel tests using the HLFC model are described in Ref. [Reference Lawson, Ciarella and Wong11], and the analysis of the results using local linear stability [Reference Atkin14] and linear parabolised stability equations analysis [Reference Mughal23, Reference Mughal24] are given in Ref. [Reference Ciarella, Lawson and Wong21]. This work was undertaken as part of the Aerodynamic Research Testing Capability and Data (ARCADE) programme, a research project funded by the UK Department of Business, Energy & Industrial Strategy (BEIS) and Innovate UK (IUK).
Hole spacing to diameter ratio distribution for variable and constant porosity panels.

Transition N-factor correlated with I-R at M ∞ = 0.7.

In linear stability analysis for transition prediction, there are various approaches in determining the N-factor for transition. For example, in the analysis of the wind tunnel test data carried out in Ref. [Reference Mughal24], separate values of N-factor for transition onset due to CF and TS instability modes have been derived, whereas a variation in the N-factor between CF and TS instability modes for transition has been used by various researchers. In the analysis of ARA TWT test data [Reference Allen, Lawson, Maina and Alderman9] as outlined in Section 6.1, a single value of N-factor of about 7.5 for transition has been determined.
Wave angle at transition location at M ∞ = 0.7.

Measured pressure distributions in the freestream direction at M ∞ = 0.7, α = −1.24°, α = 1.82°.

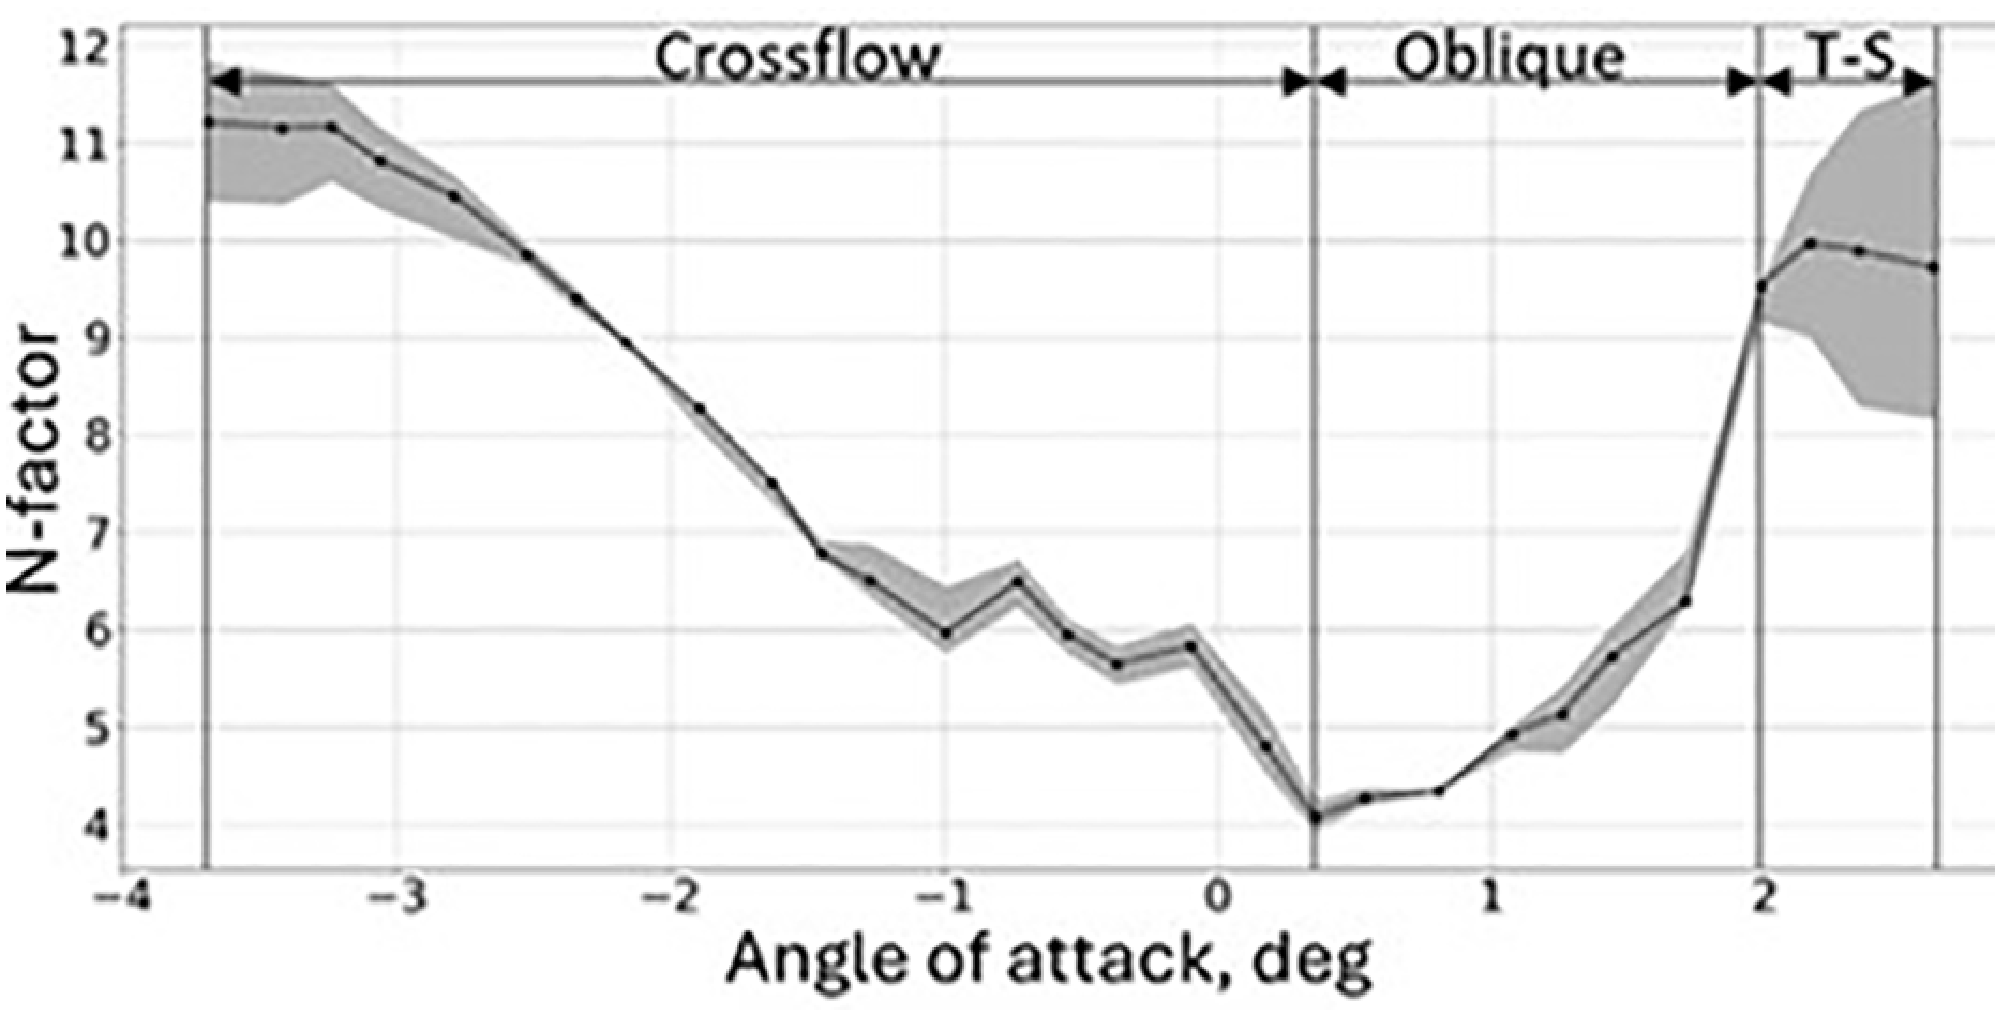
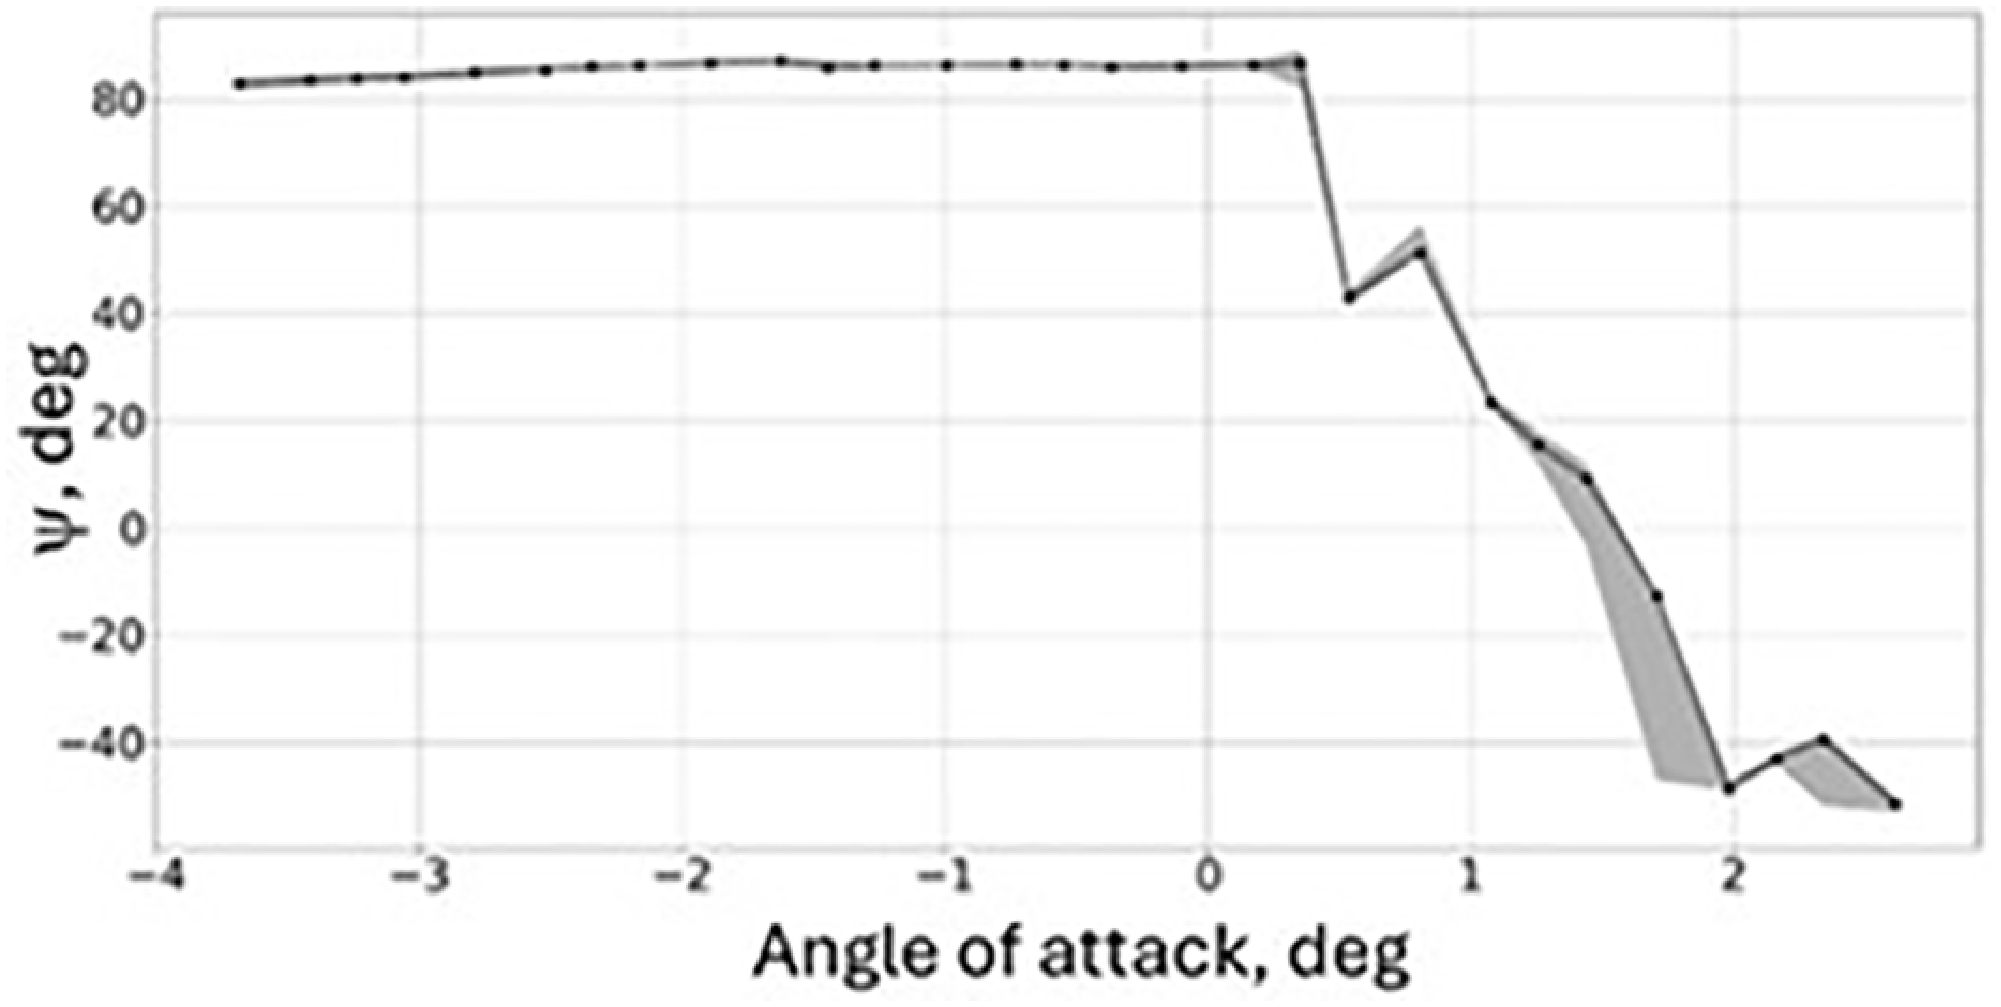
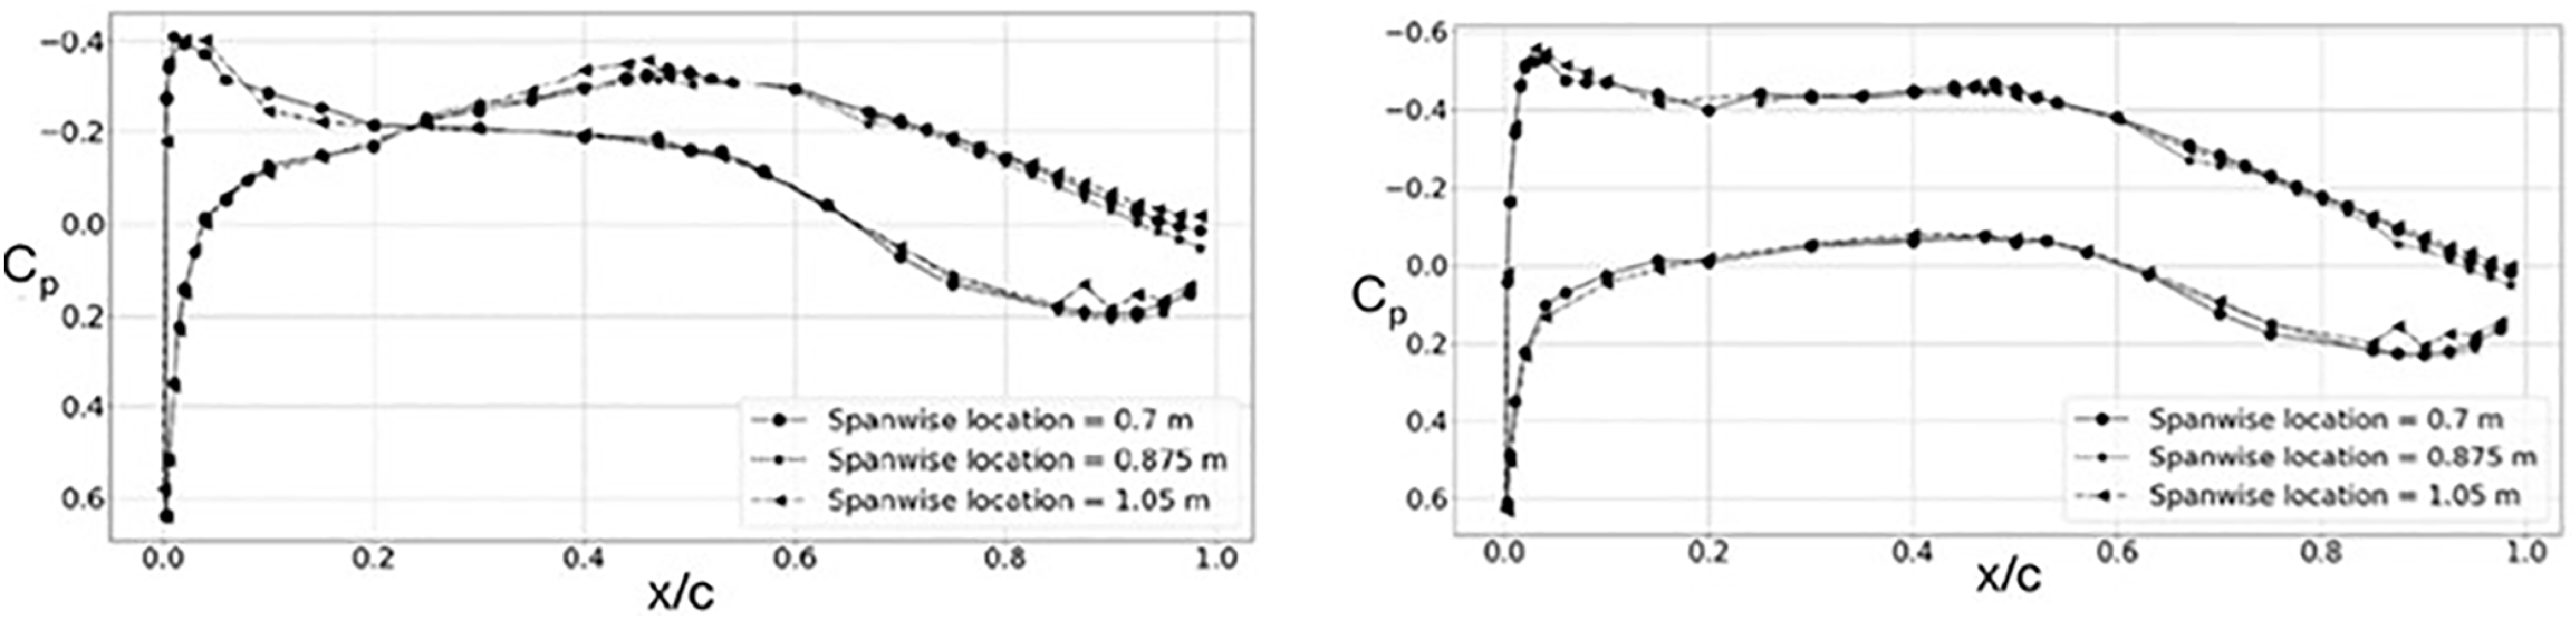
In the analysis of ARA TWT data for the HLFC model with a solid panel surface [Reference Ciarella, Lawson and Wong21], it was found that the N-factor for transition varies with angle of incidence as can be seen in Fig. 42, which is contrary to a single N-factor value that was previously assumed [Reference Allen, Lawson, Maina and Alderman9]. The wave angle at transition location for these cases is shown in Fig. 43. Based on the wave angles, transition is due to CF at negative angle of incidence and TS at higher angle of incidence. The results are consistent with the pressure distribution on the upper surface, with a favourable gradient at negative angles of incidence for CF and an adverse gradient at positive angles of incidence for TS, as shown in the pressure distributions presented in Fig. 44 for a case at M ∞ = 0.7. It should be noted that the adverse pressure gradient featuring in the initial 20% chord region shown in Fig. 40 and the α = 1.82° case in Fig. 44 was specifically designed to give TS transition at positive angles of attack for the wind tunnel tests in ARA TWT. It was apparent that the N-factor is particularly lower for conditions corresponding to cases with the presence of both strong CF and TS waves, identified as oblique waves in Fig. 42 for cases near zero angle of incidence. The results suggested that the low N-factor may be due to the limitation inherent in the linear methods for cases where there is a possibility of interaction between CF and TS waves. A preliminary investigation using linear and non-linear parabolised stability equations (PSE) methods [Reference Mughal23, Reference Mughal24] has also been carried out [Reference Ciarella, Lawson and Wong21]. The non-linear method requires an initial inflow state to seed the simulation, and the initial condition can affect the growth of the instability waves. Although the results with an assumed initial inflow state have provided support for the most likely instability waves that are responsible for the onset of transition as identified in the linear method, it requires detailed information of the tunnel environmental fluctuation measurements in order to provide a more accurate simulation. Detailed measurement of the tunnel environment and fluctuations within the boundary layer are required in the future to provide data for transition prediction investigations using methods such as non-linear PSE.
Chamber pressure difference across panel, M ∞ = 0.7, α = 1.82°, chamber pressure = 59825 Pa.

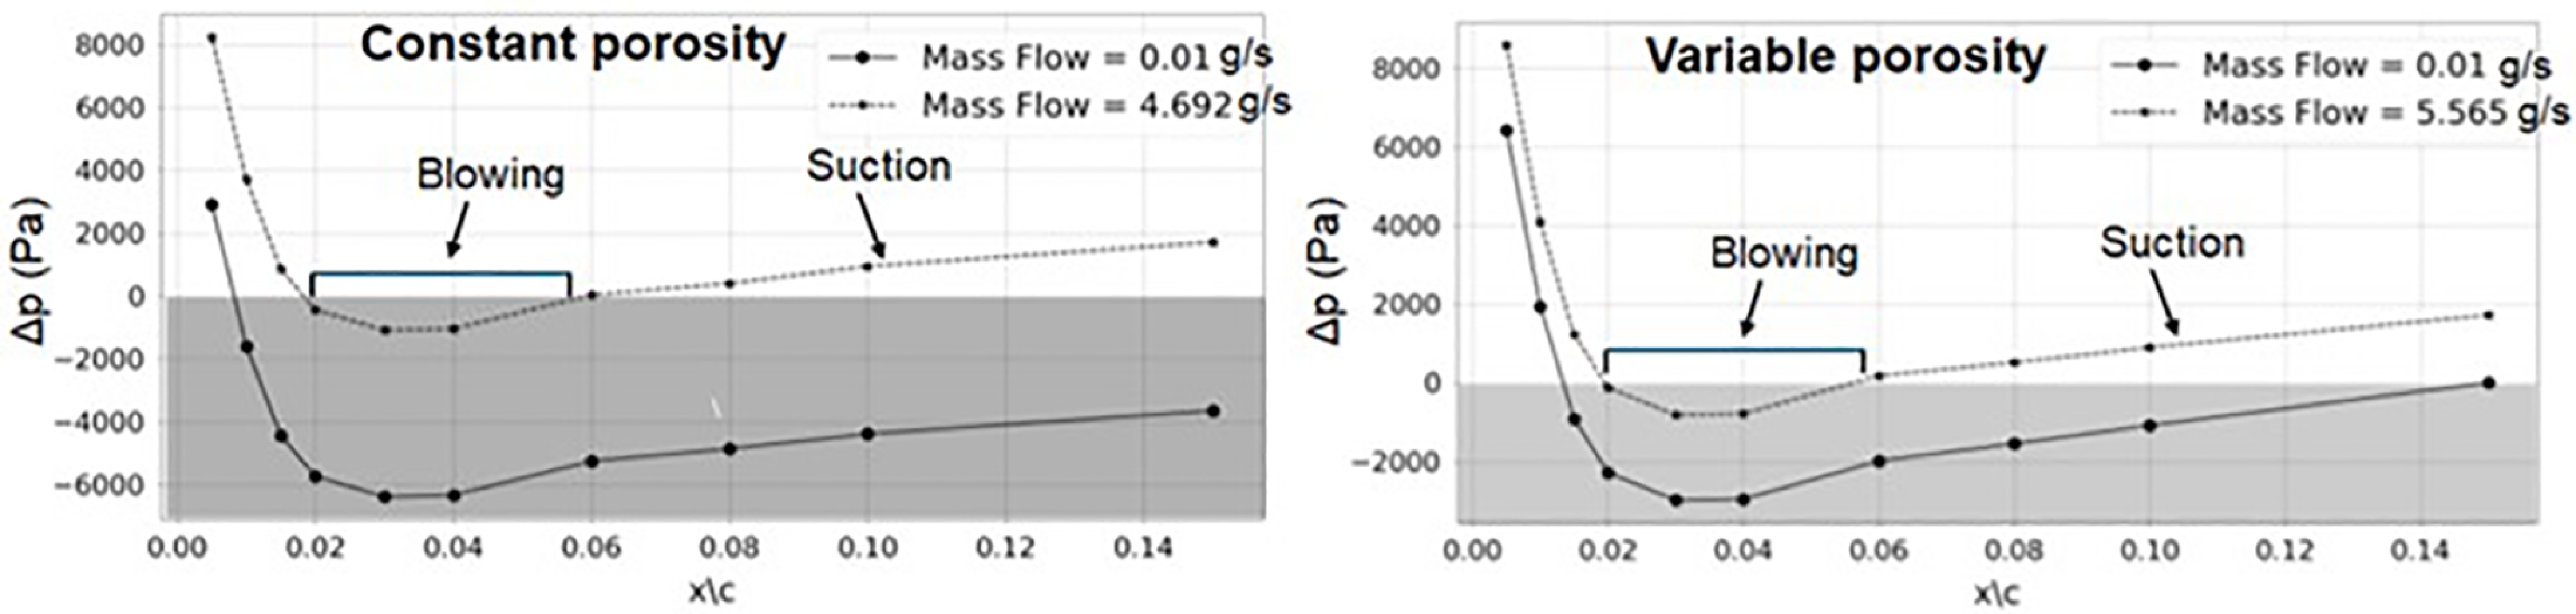
For porous panel cases, it was shown that the variable porosity panel has been able to provide a higher suction velocity than the constant porosity panel, as the design has intended. See Fig. 41 for the porosity distribution, where the variable porosity panel has a lower Sd than the constant porosity panel. This is illustrated in the results presented in Fig. 45 for M ∞ = 0.7 and α = 1.82° case with a chamber pressure of 59825 Pa, where the total suction mass flow is higher for variable porosity than constant porosity. It can be seen that for this chamber pressure, blowing is occurring between 2 and 6% chord indicated by the top curve in Fig. 45, where the pressure difference across the panel is negative. The pressure difference shown in Fig. 45 is given by the chamber pressure minus the pressure on the external surface of the porous panel, hence blowing occurs when the pressure difference is negative. The pressure on the external surface of the porous panel is given by the pressure distribution of the wing section measured by pressure taps, and the chamber pressure measured by pressure transducers. For this case, it is the pressure distribution at α = 1.82° shown in Fig. 44. In HLFC, the chamber pressure needs to be set low enough to avoid blowing, as blowing can cause transition. The suction mass flow rate for the variable porosity panel is higher than the constant porosity panel as shown in Fig. 45, due to the fact that the overall hole space to hole diameter ratio, Sd, for the variable porosity panel is lower than the constant porosity panel as shown in Fig. 41. For the constant porosity panel, blowing has caused transition within the porous panel region based on infra-red (IR) images recorded in the wind tunnel test. However, for the variable porosity panel case, although blowing was present as shown in Fig. 45, the amount of suction achievable downstream of blowing was able to stabilise the flow delaying the onset of transition at about 50% chord according to the IR images recorded in the wind tunnel test [Reference Ciarella, Lawson and Wong21]. This finding is unexpected and should be further investigated in the future, as this would have important implications on the possibility of using surface suction to stabilise the instability due to the effect of surface imperfections on transition.
8.0 Wind tunnel simulation methodology
Wind tunnel performance testing of aircraft design employing HLFC requires simulation of both the extent of laminar flow and turbulent boundary layer thickness that would occur in flight. For HLFC testing in a cryogenic tunnel, there may be scaling problems associated with the size of the suction holes at model scale at high Reynolds number, and transition is also very sensitive to small surface imperfections where the incorporation of the porous panel for surface suction would be a difficult challenge for model manufacture. For a conventional wind tunnel such as ARA TWT, although conditions at the lower Reynolds number are more favourable for maintaining the extent of laminar flow, there are difficulties in simulating the right turbulent boundary layer thickness at model scale. In addition, since the transition location is already far downstream with HLFC, there is limited margin left for the aft transition fixing technique [Reference Haines25] to simulate the effect of a higher Reynolds number.
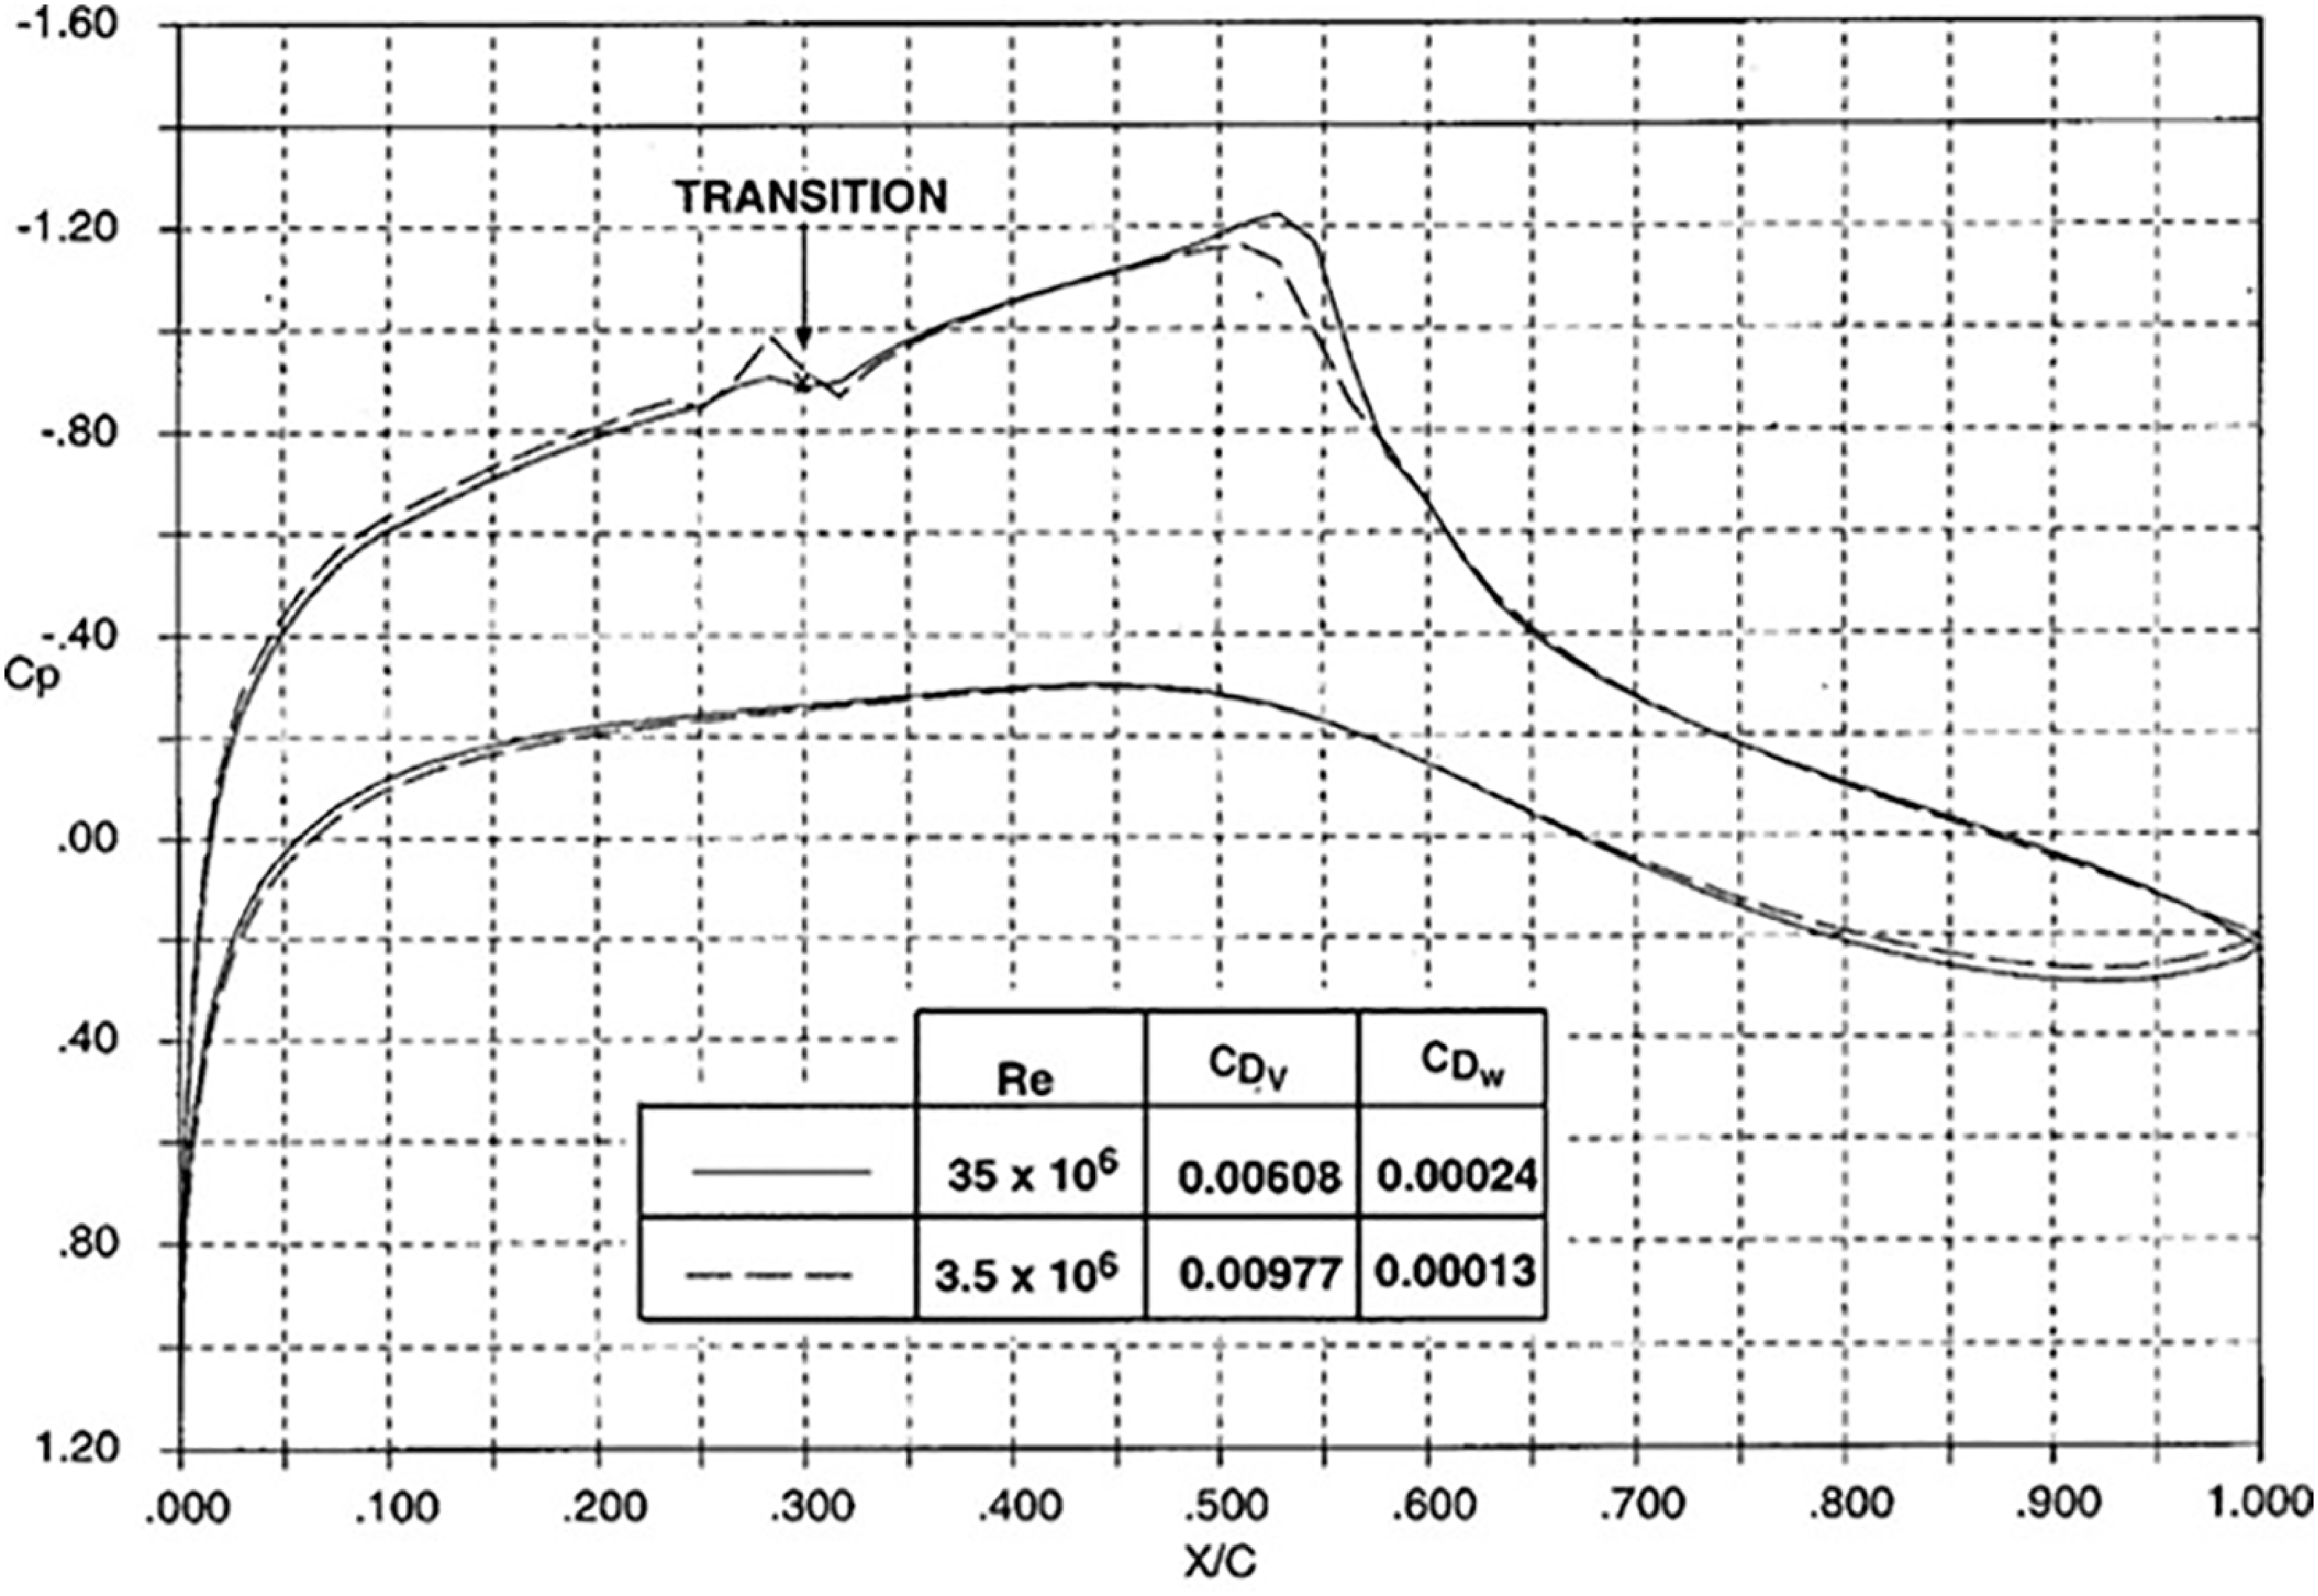
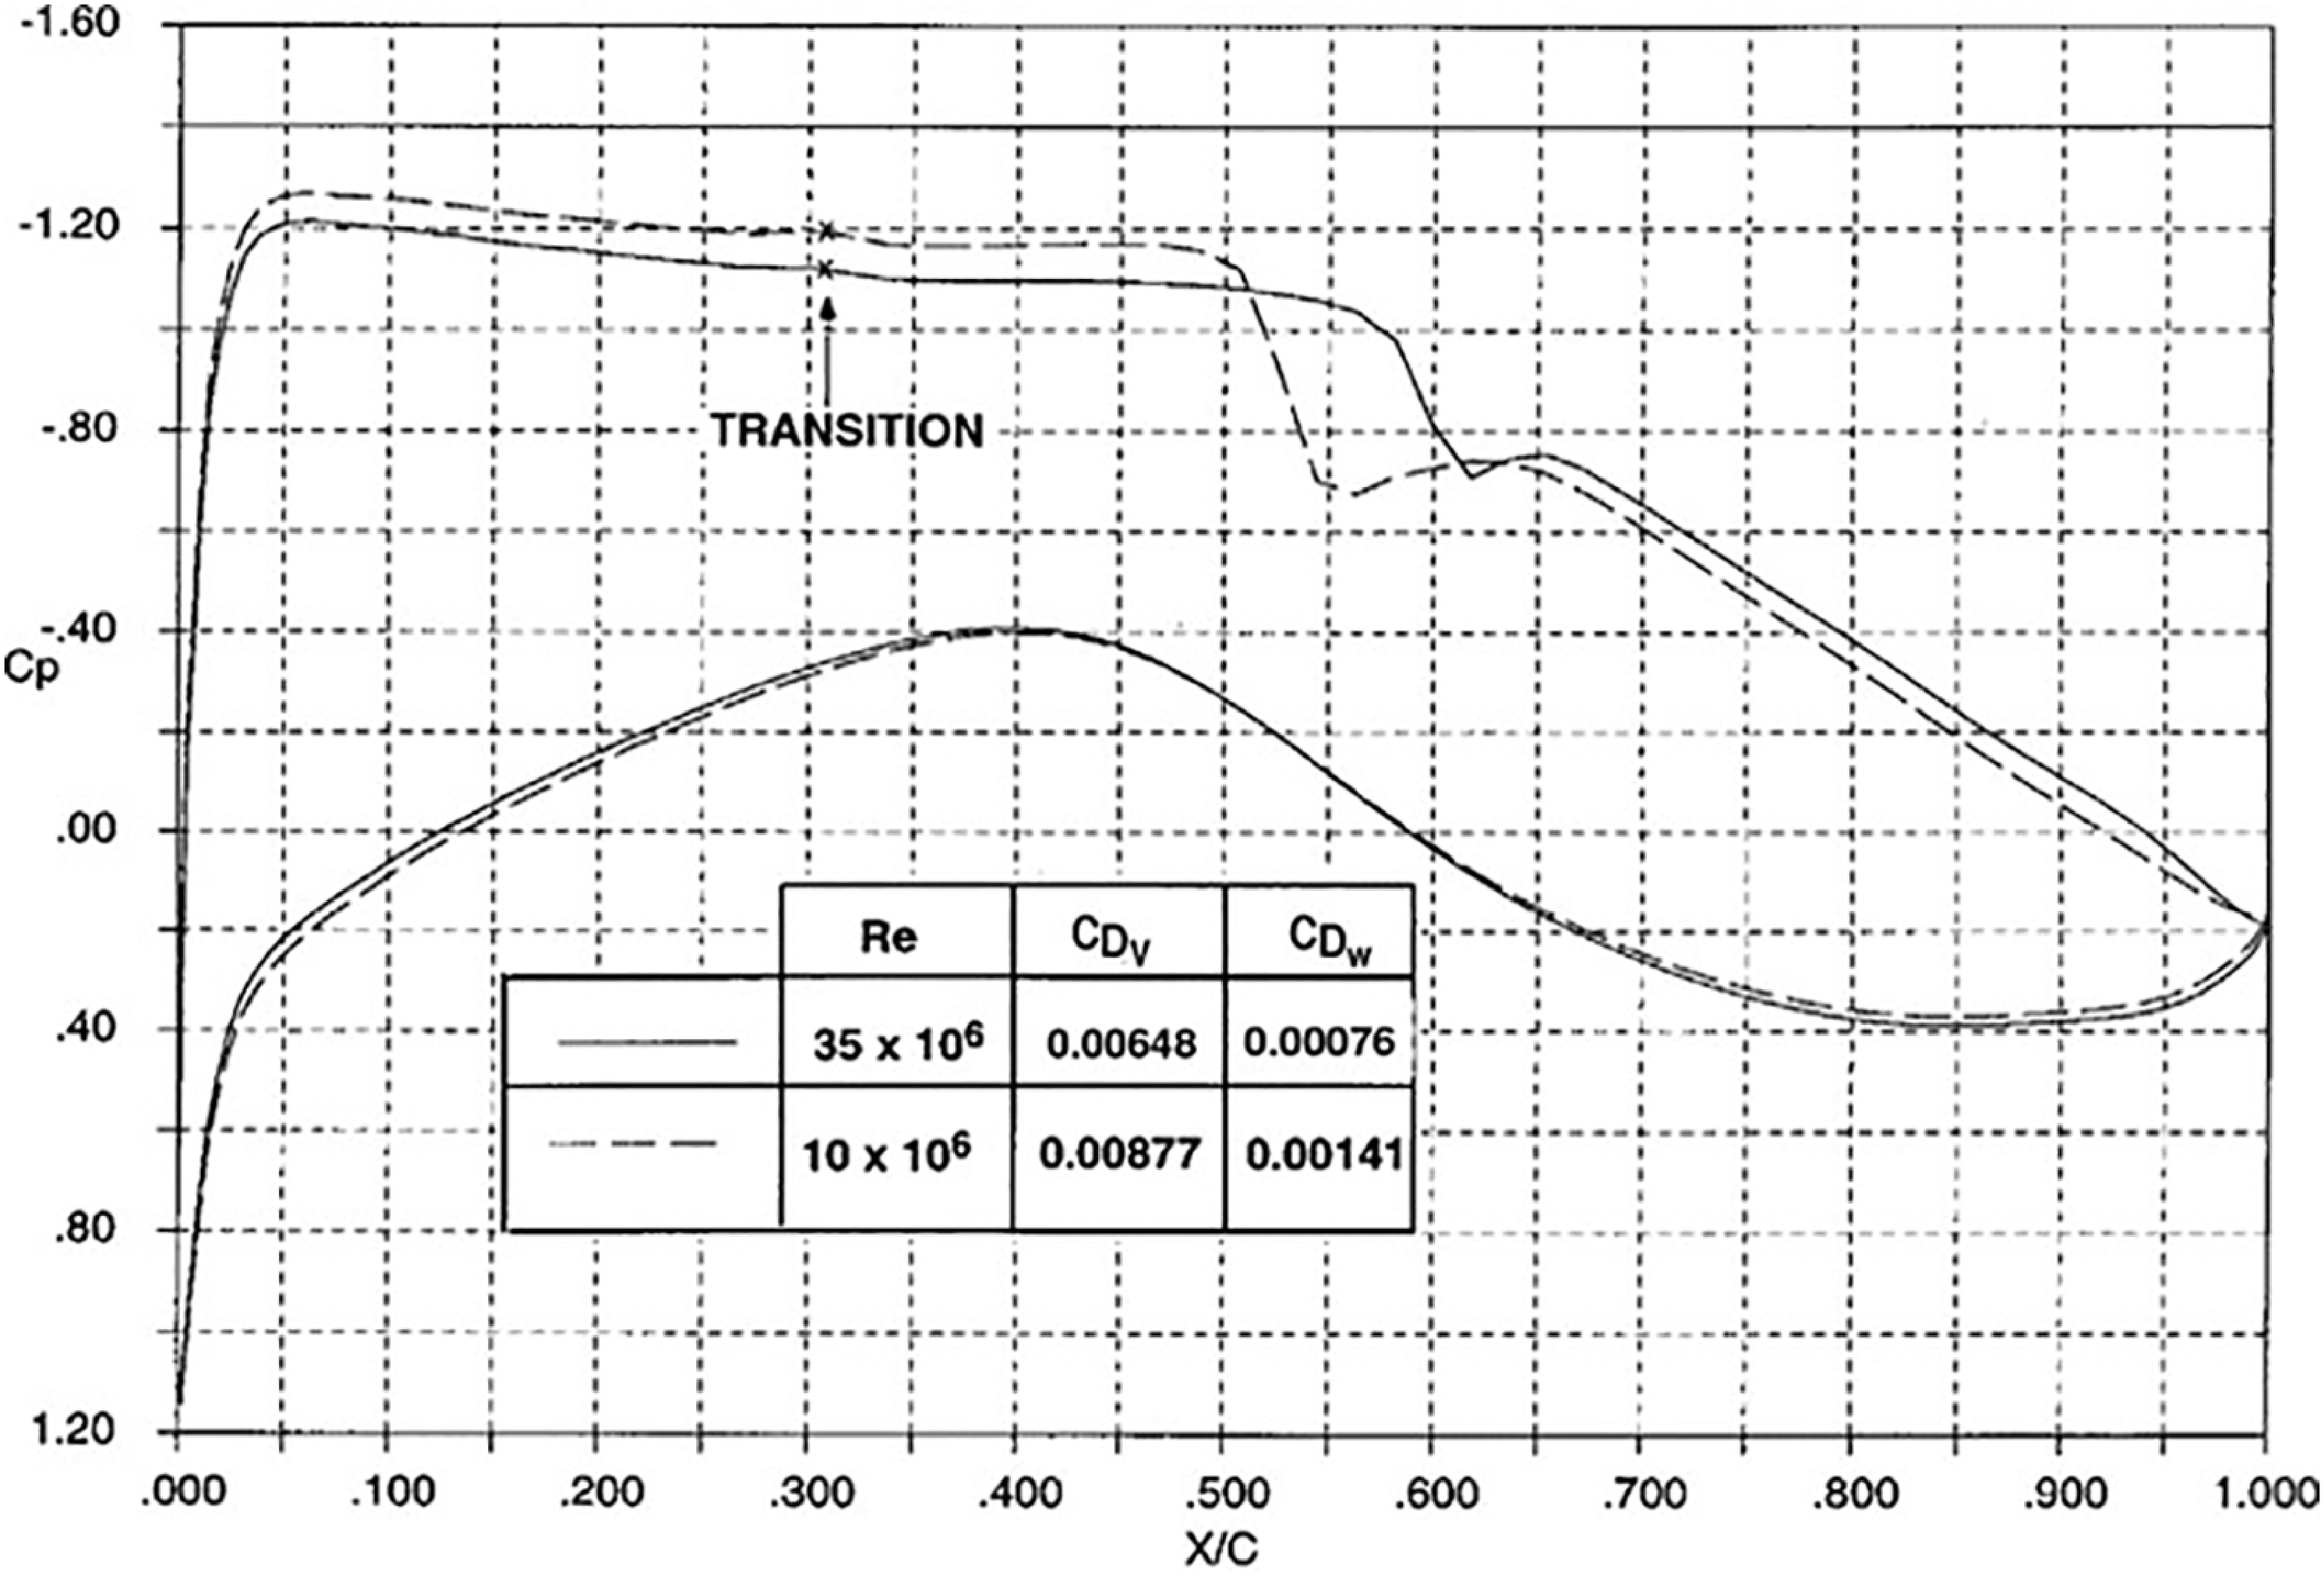
A theoretical study to address a number of issues involved in the wind tunnel testing of HLFC wings in a low Reynolds number tunnel and some of the problems related to scale effects has been carried out at ARA [Reference Atkin14]. These simulation issues are illustrated by the results shown in Figs 46 and 47 for the same two aerofoils with different types of rooftop pressure distribution as presented in Section 5 of the current paper. It should be noted that although these aerofoils have not been designed specifically for HLFC application, they are used here to illustrate wind tunnel simulation methodology. With the assumption that the laminar extent at flight scale can be achieved at a wind tunnel Reynolds number, there are differences in the pressure distributions, shock positions and drag values between the two Reynolds numbers, due to differences in the turbulent boundary layers development as would be expected. For the M2303 aerofoil shown in Fig. 46, a Reynolds number of 3.5 × 10⁶ is relevant to an atmospheric wind tunnel such as ARA TWT. A Reynolds number of 10 × 106 for the Lock aerofoil in Fig. 47 is relevant to a compressible wind tunnel where the tunnel pressure could be increased to achieve a higher Reynolds number up to a certain level, usually about 10 × 106 to 12 × 106.
Effect of Reynolds number, M2303 aerofoil, M = 0.68, C L = 0.5.

Effect of Reynolds number, Lock aerofoil, M = 0.72, C L = 0.84.

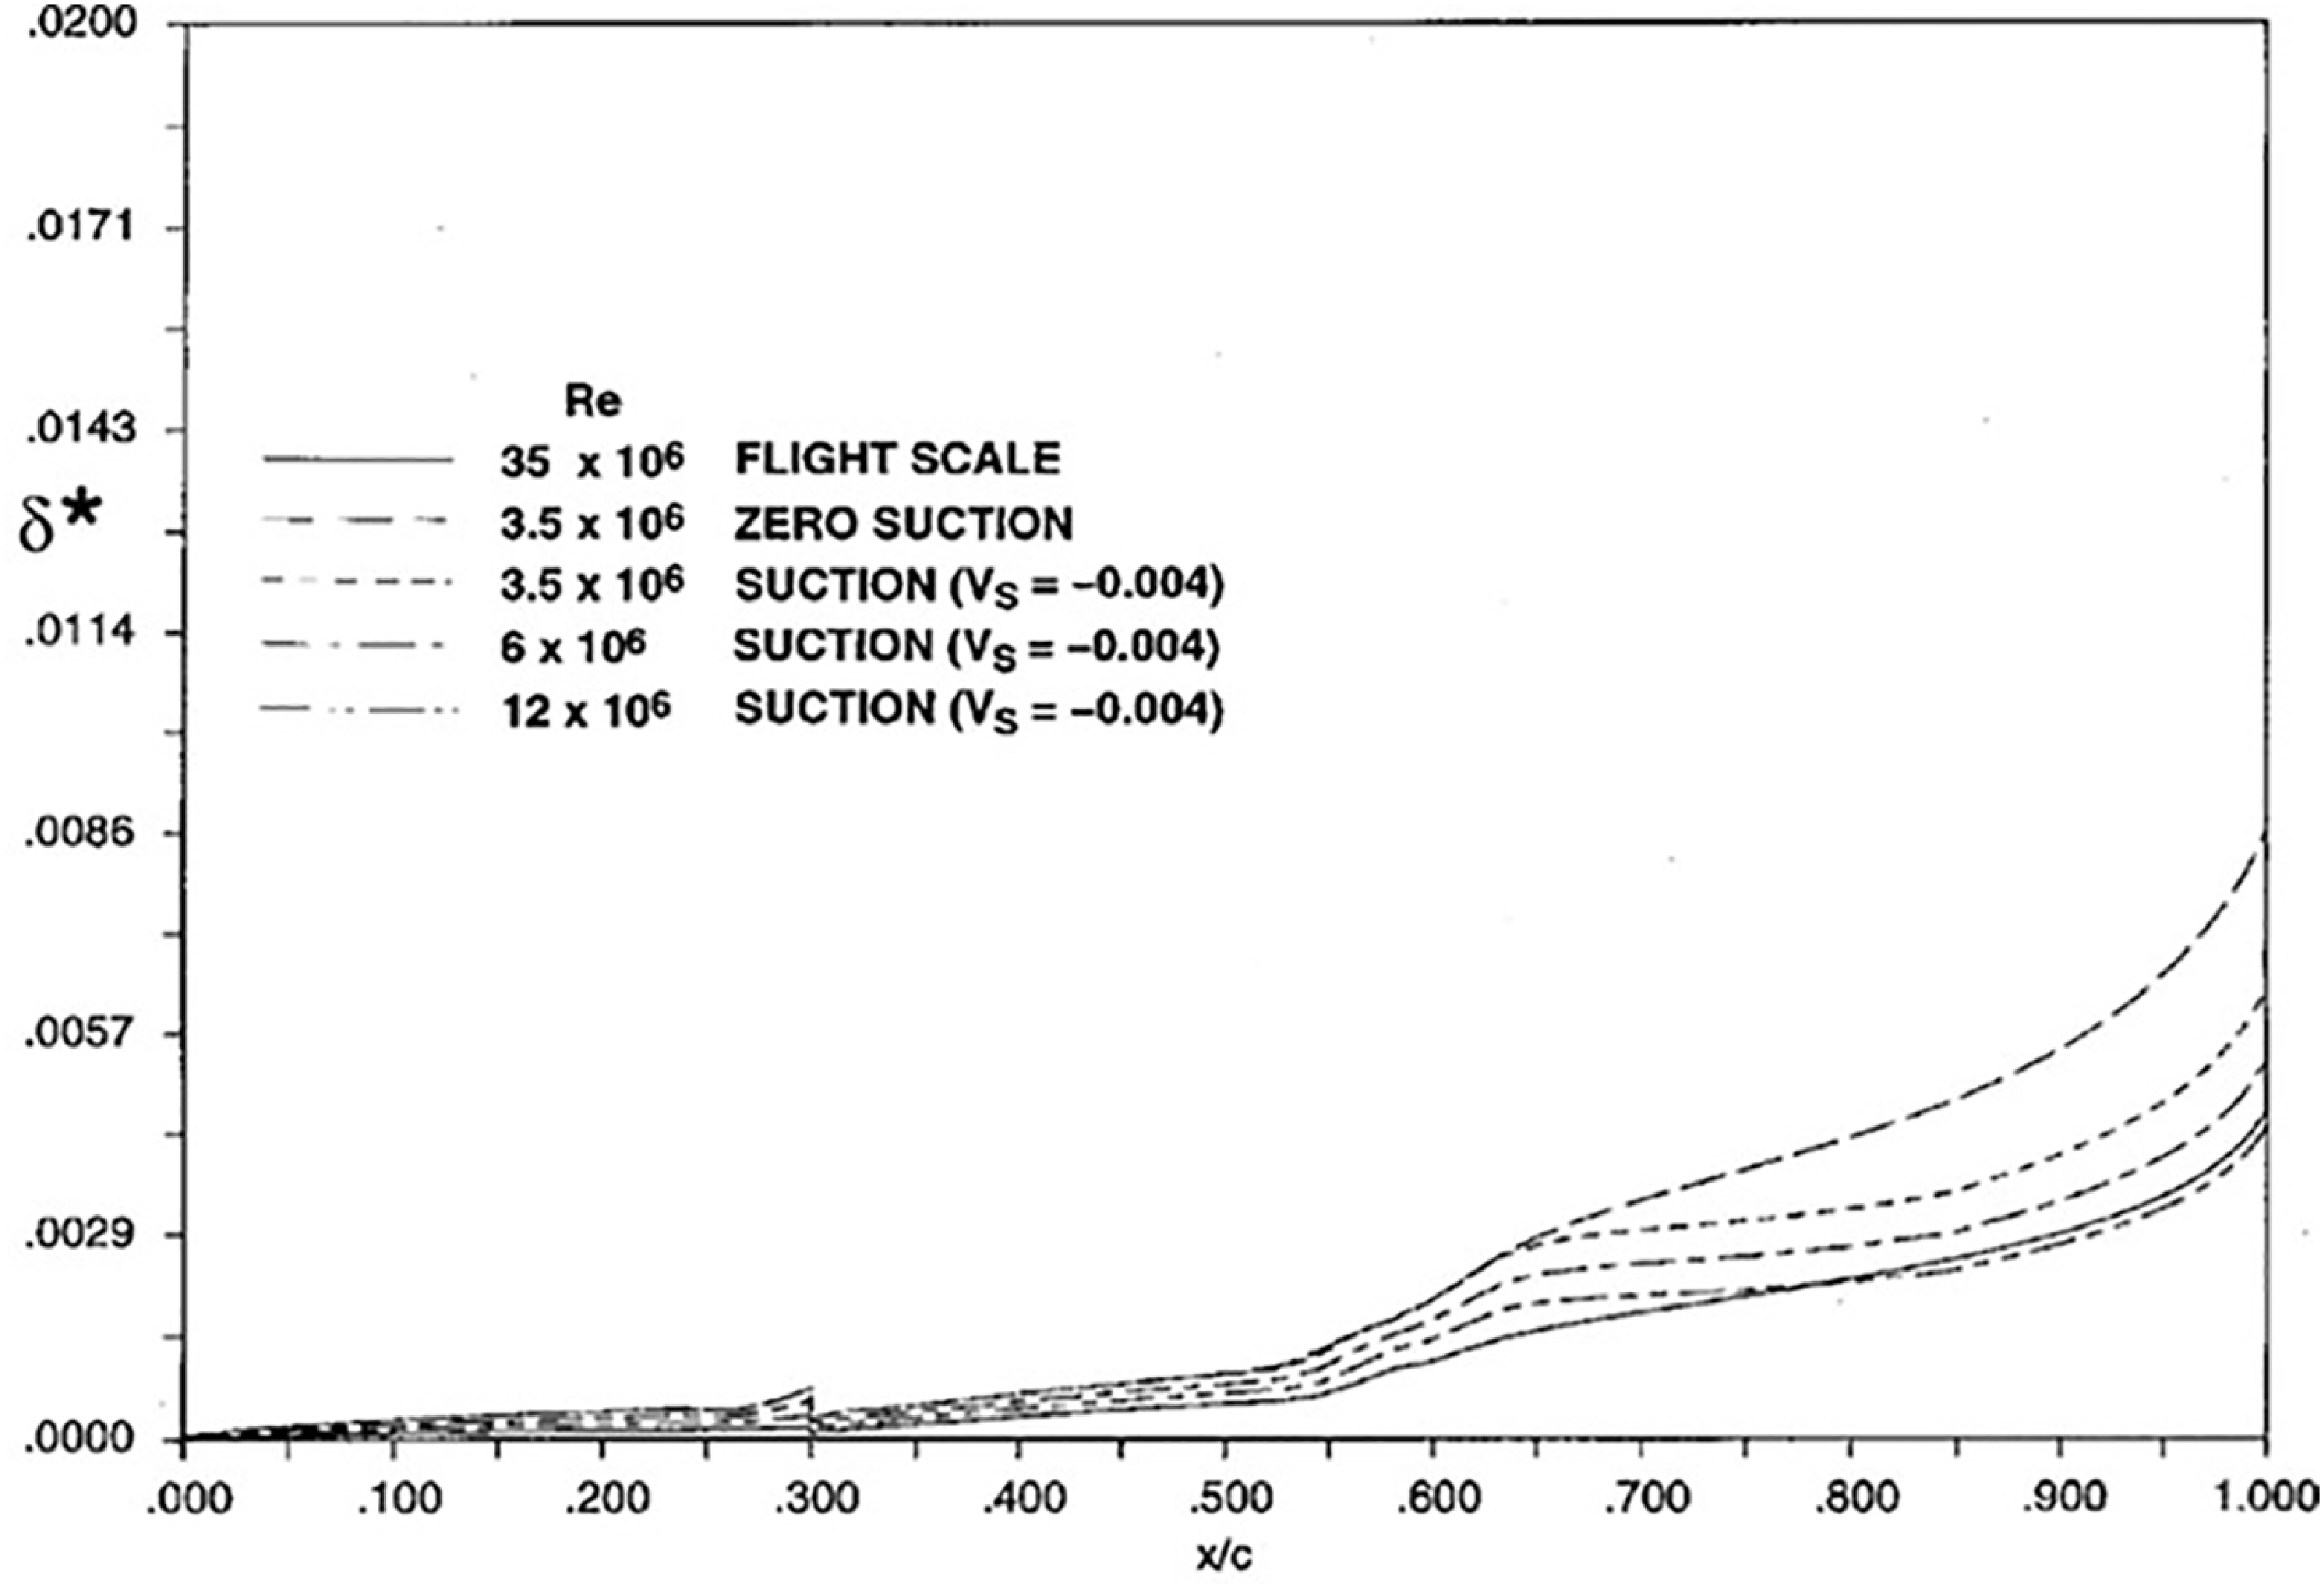
Upper surface displacement thickness, M2303 aerofoil, M = 0.68, C L = 0.5.

A technique for reducing the turbulent boundary layer thickness in tunnel scale to that of flight scale is the application of suction to thin the boundary layers. It was discovered that the correct simulation of the boundary layer displacement thickness at the trailing edge will result in a close simulation of the pressure distribution and hence overall aerodynamic performance. This concept has been demonstrated theoretically and experimentally in wind tunnel tests at ARA for a fully turbulent flow design 2D section and a 3D wing [Reference Green, Elliot and Wong26]. It should be noted that further study is required to understand the physics of the concept and the possibility of establishing a relationship between surface suction level and Reynolds number.
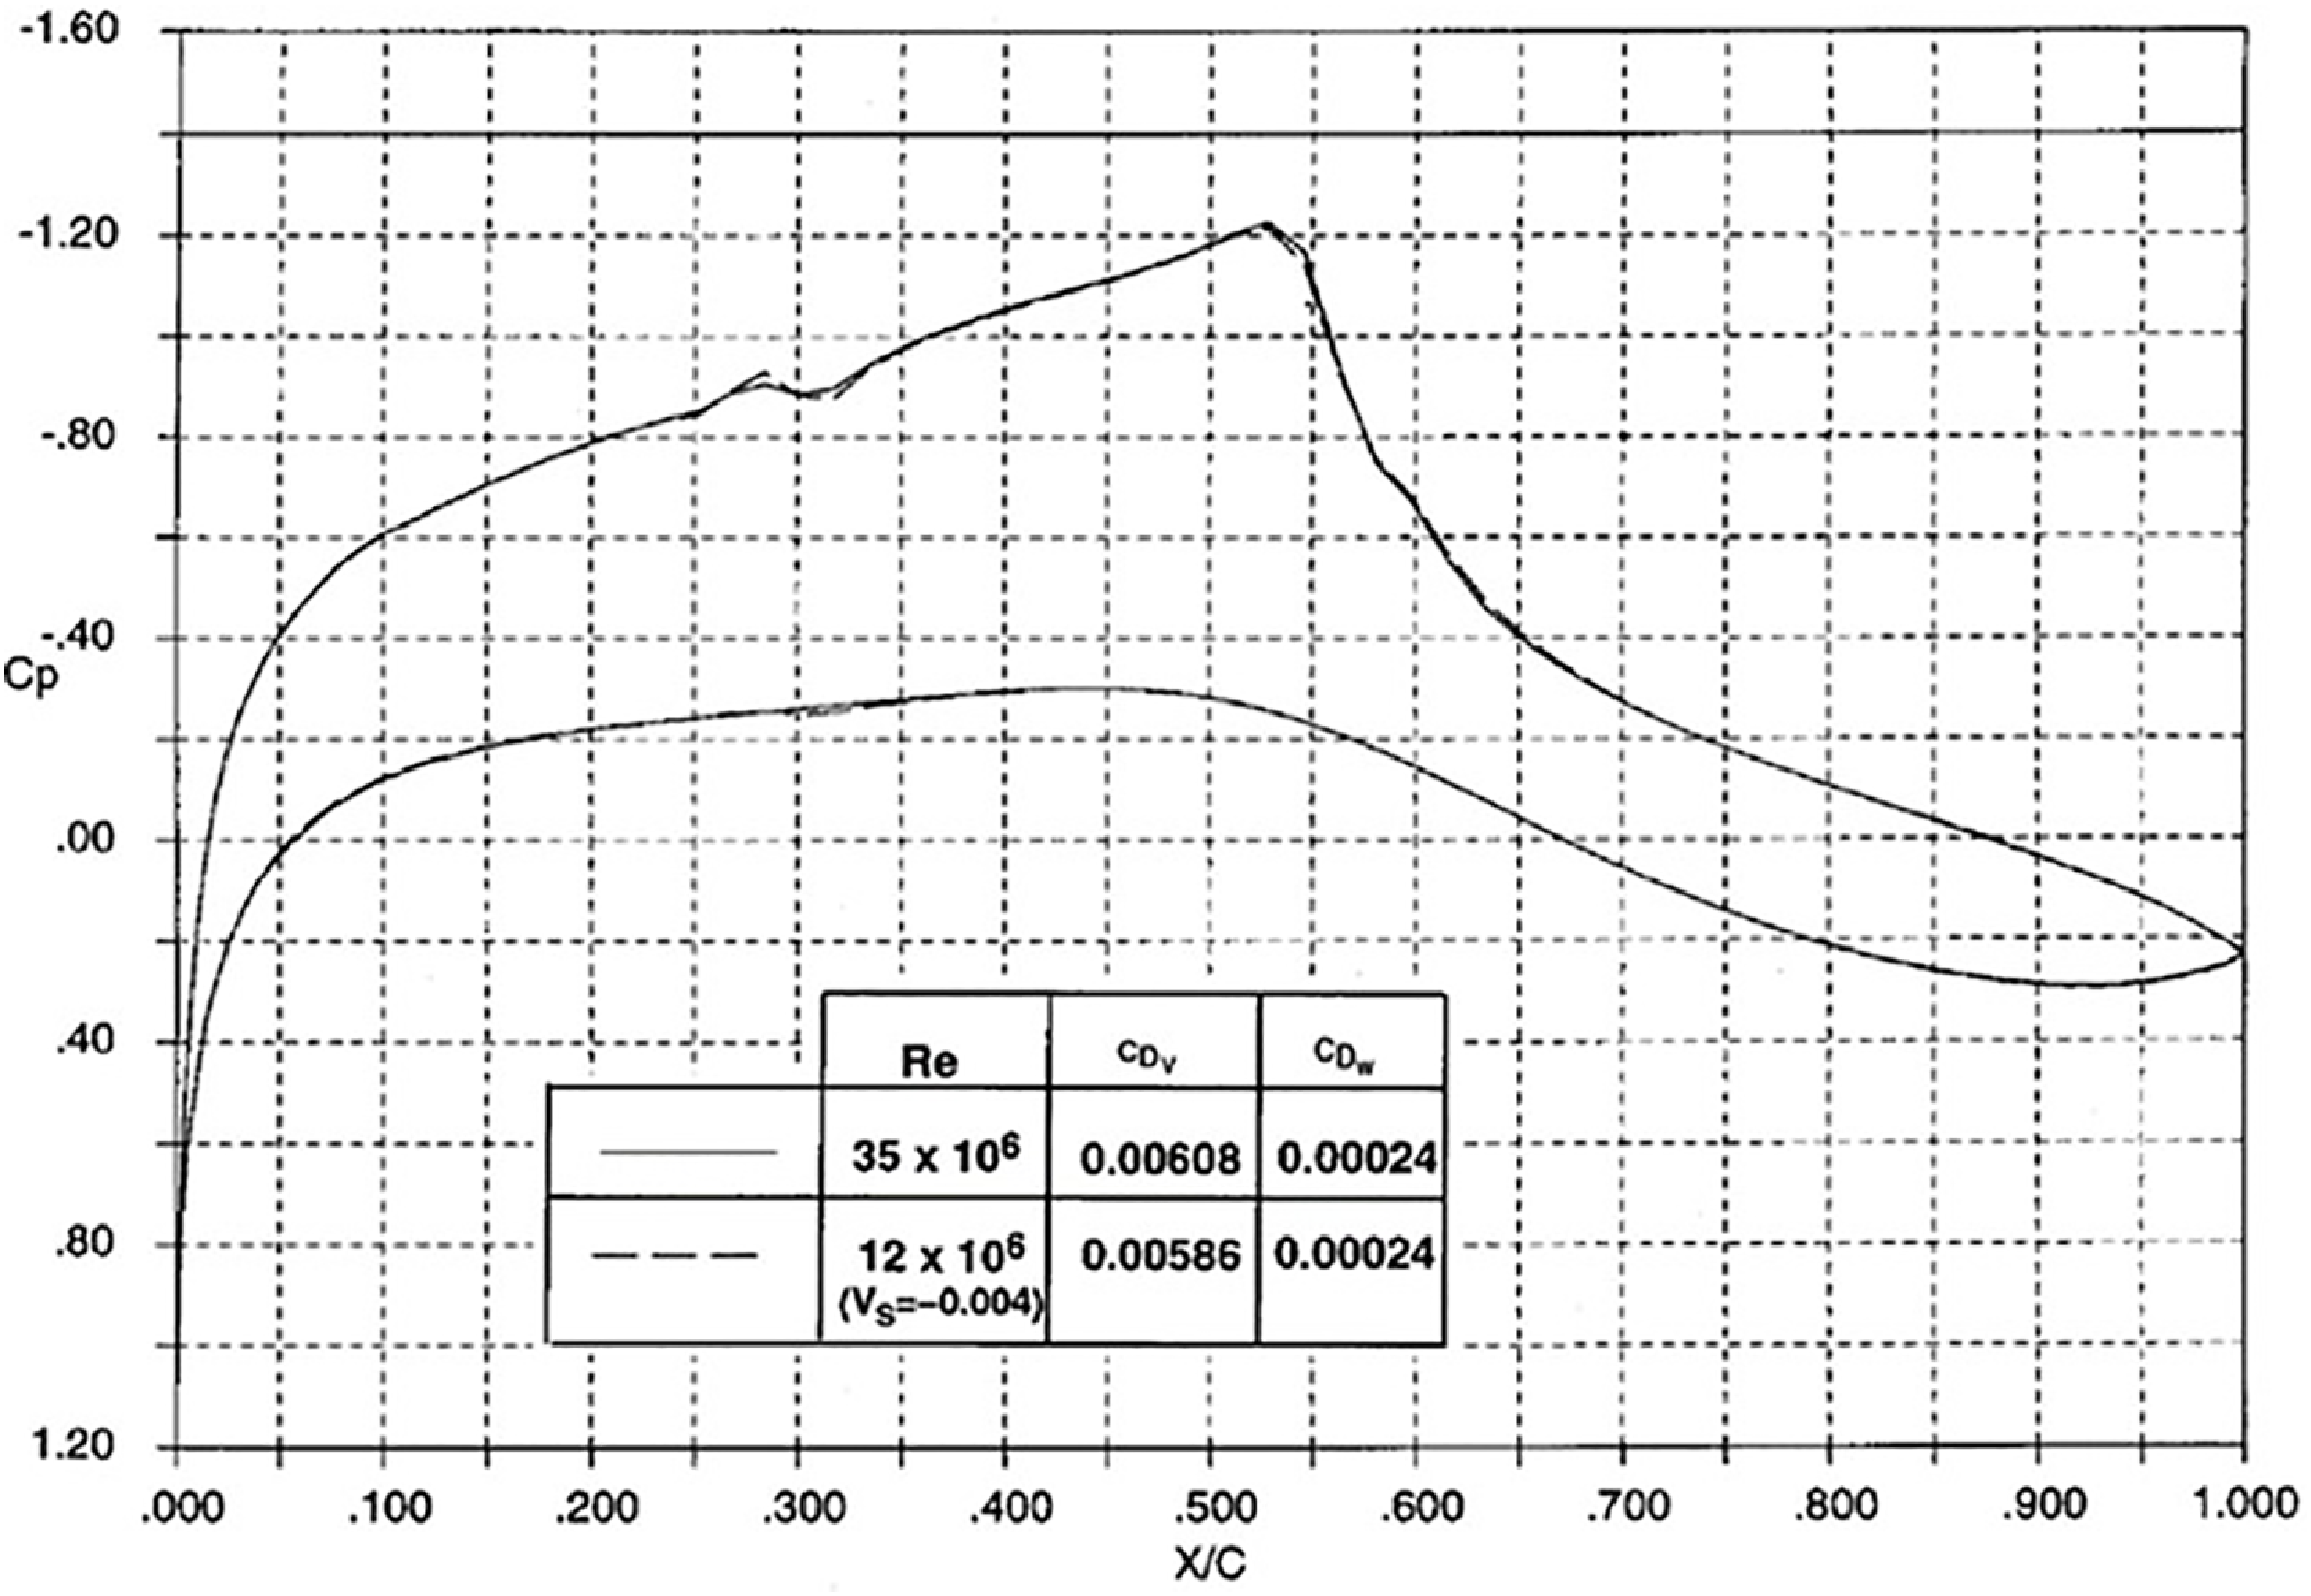
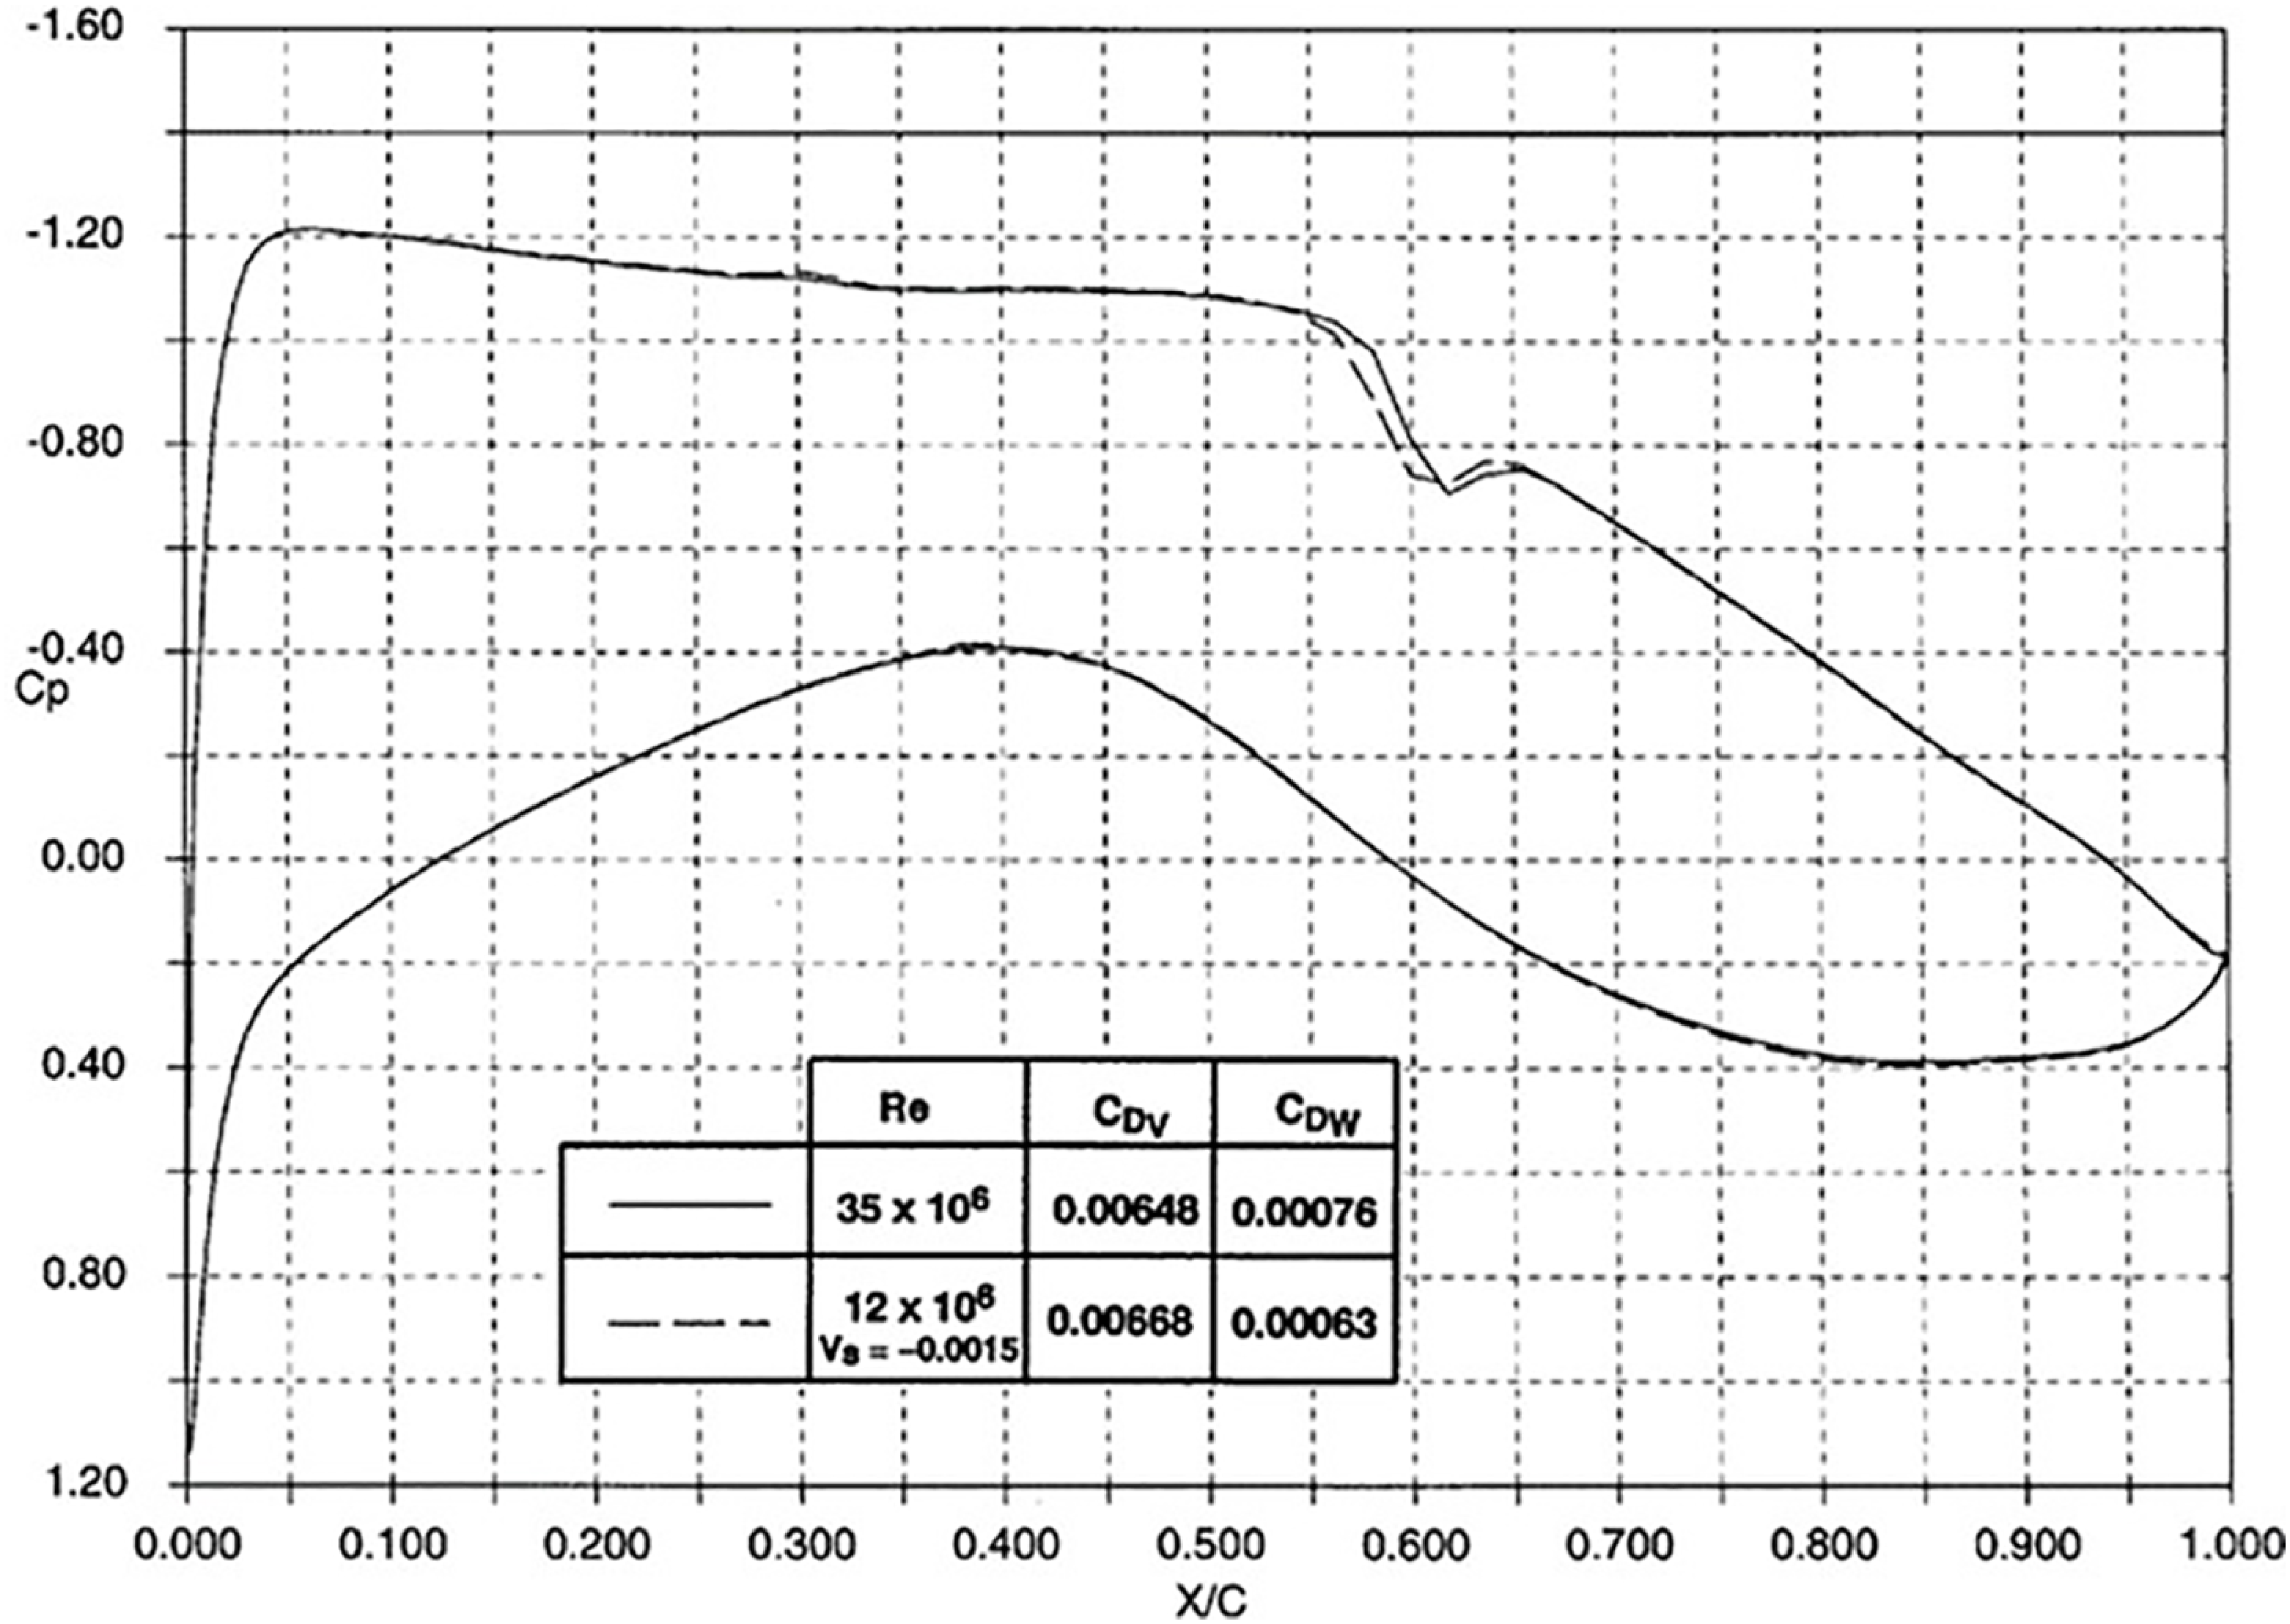
A theoretical study into the simulation of flight scale Reynolds number using surface suction to thin the turbulent boundary layers for HLFC has been carried out in Ref. [Reference Atkin14]. For a pressurised wind tunnel, a combination of increasing the tunnel pressure to achieve a higher Reynolds number up to a certain level, usually about 12 m, and surface suction to thin the turbulence boundary layer, is illustrated in the results shown in Figs 48–50. For HLFC testing in a pressurised tunnel, it would be preferable to keep the level of suction constant as the tunnel Reynolds is increased. For the M2303 aerofoil, with a suction velocity of −0.004 applied to the upper surface, the effect of increasing Reynolds number on the boundary layer displacement thickness distribution is shown in Fig. 48. A similar behaviour for the displacement thickness on the lower surface can be obtained using surface suction or with aft transition fixing [Reference Atkin14]. It can be seen that at a tunnel Reynolds number of 12 × 106, the trailing-edge displacement thickness at tunnel scale has been reduced close to that of flight scale, giving the pressure distributions and drag values nearly match the flight scale results as shown in Fig. 49. For the Lock aerofoil at 12 × 106 tunnel Reynolds number, a much lower suction velocity (V s = −0.0015) is required to achieve the flight scale results as shown in Fig. 50.
Comparison of pressure distribution between wind tunnel and flight Reynolds numbers, M2303 aerofoil, M = 0.68, C L = 0.5.

Comparison of pressure distribution between wind tunnel and flight Reynolds numbers, Lock aerofoil, M = 0.72, C L = 0.84.

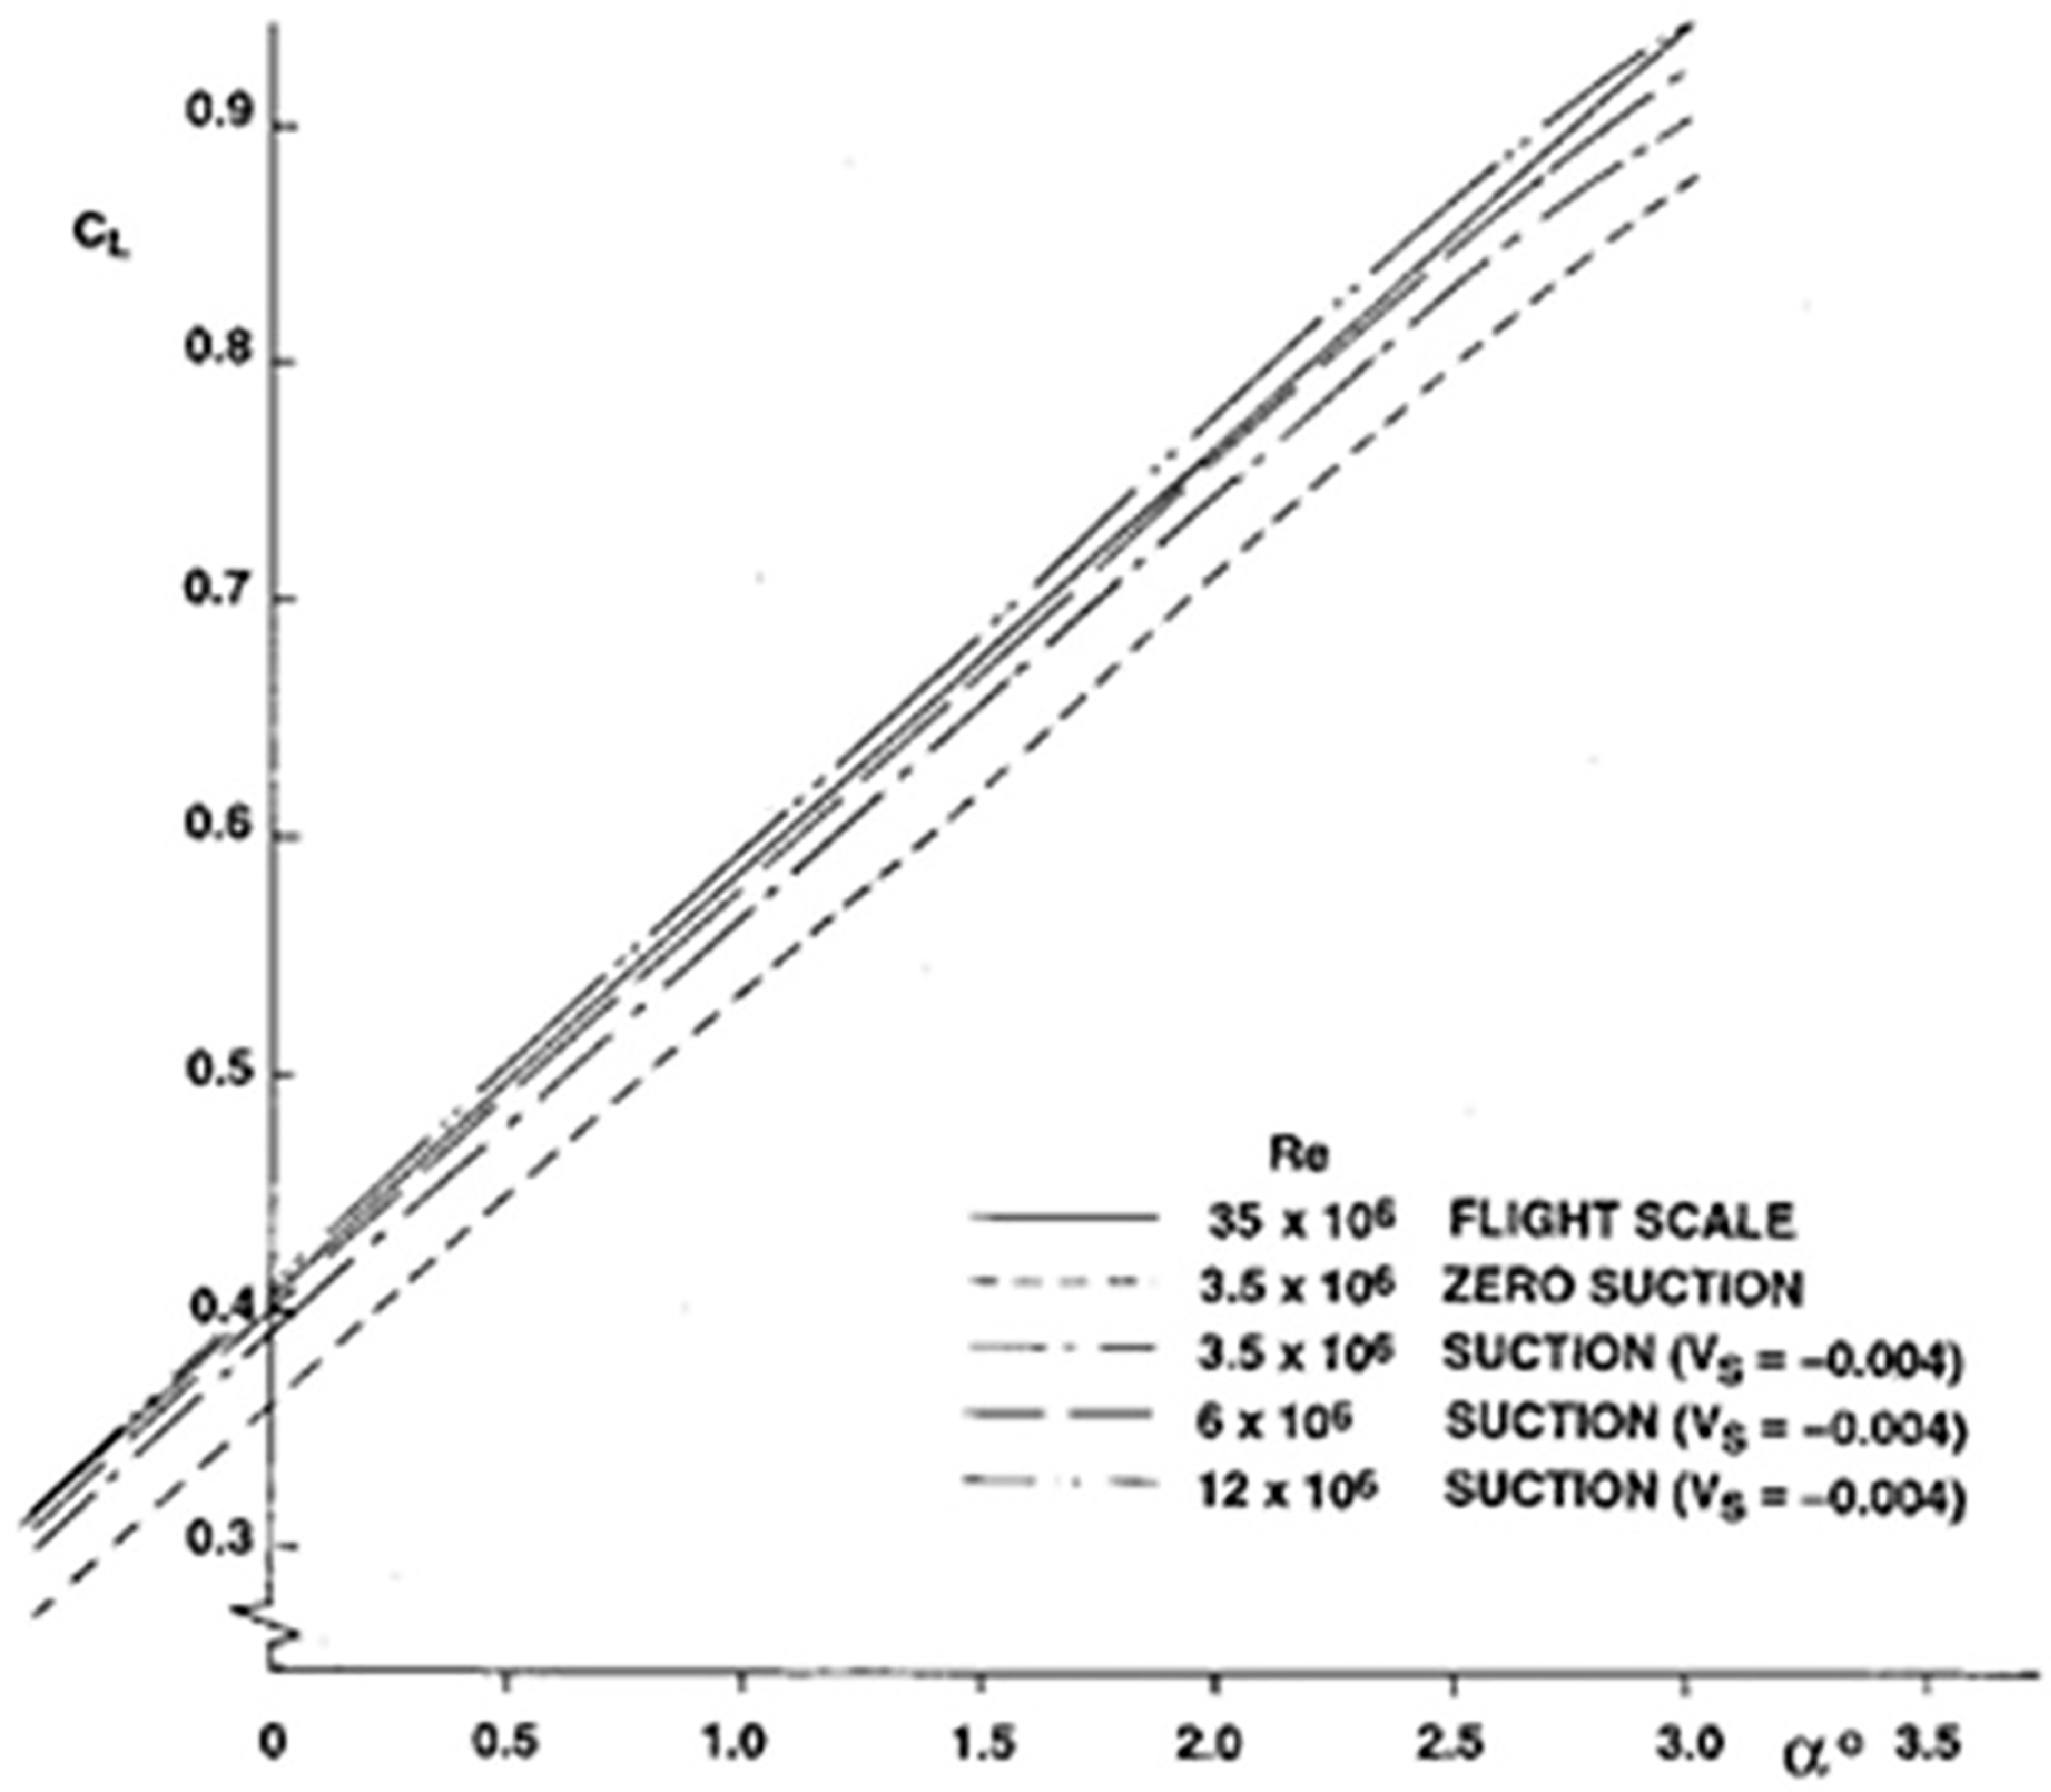
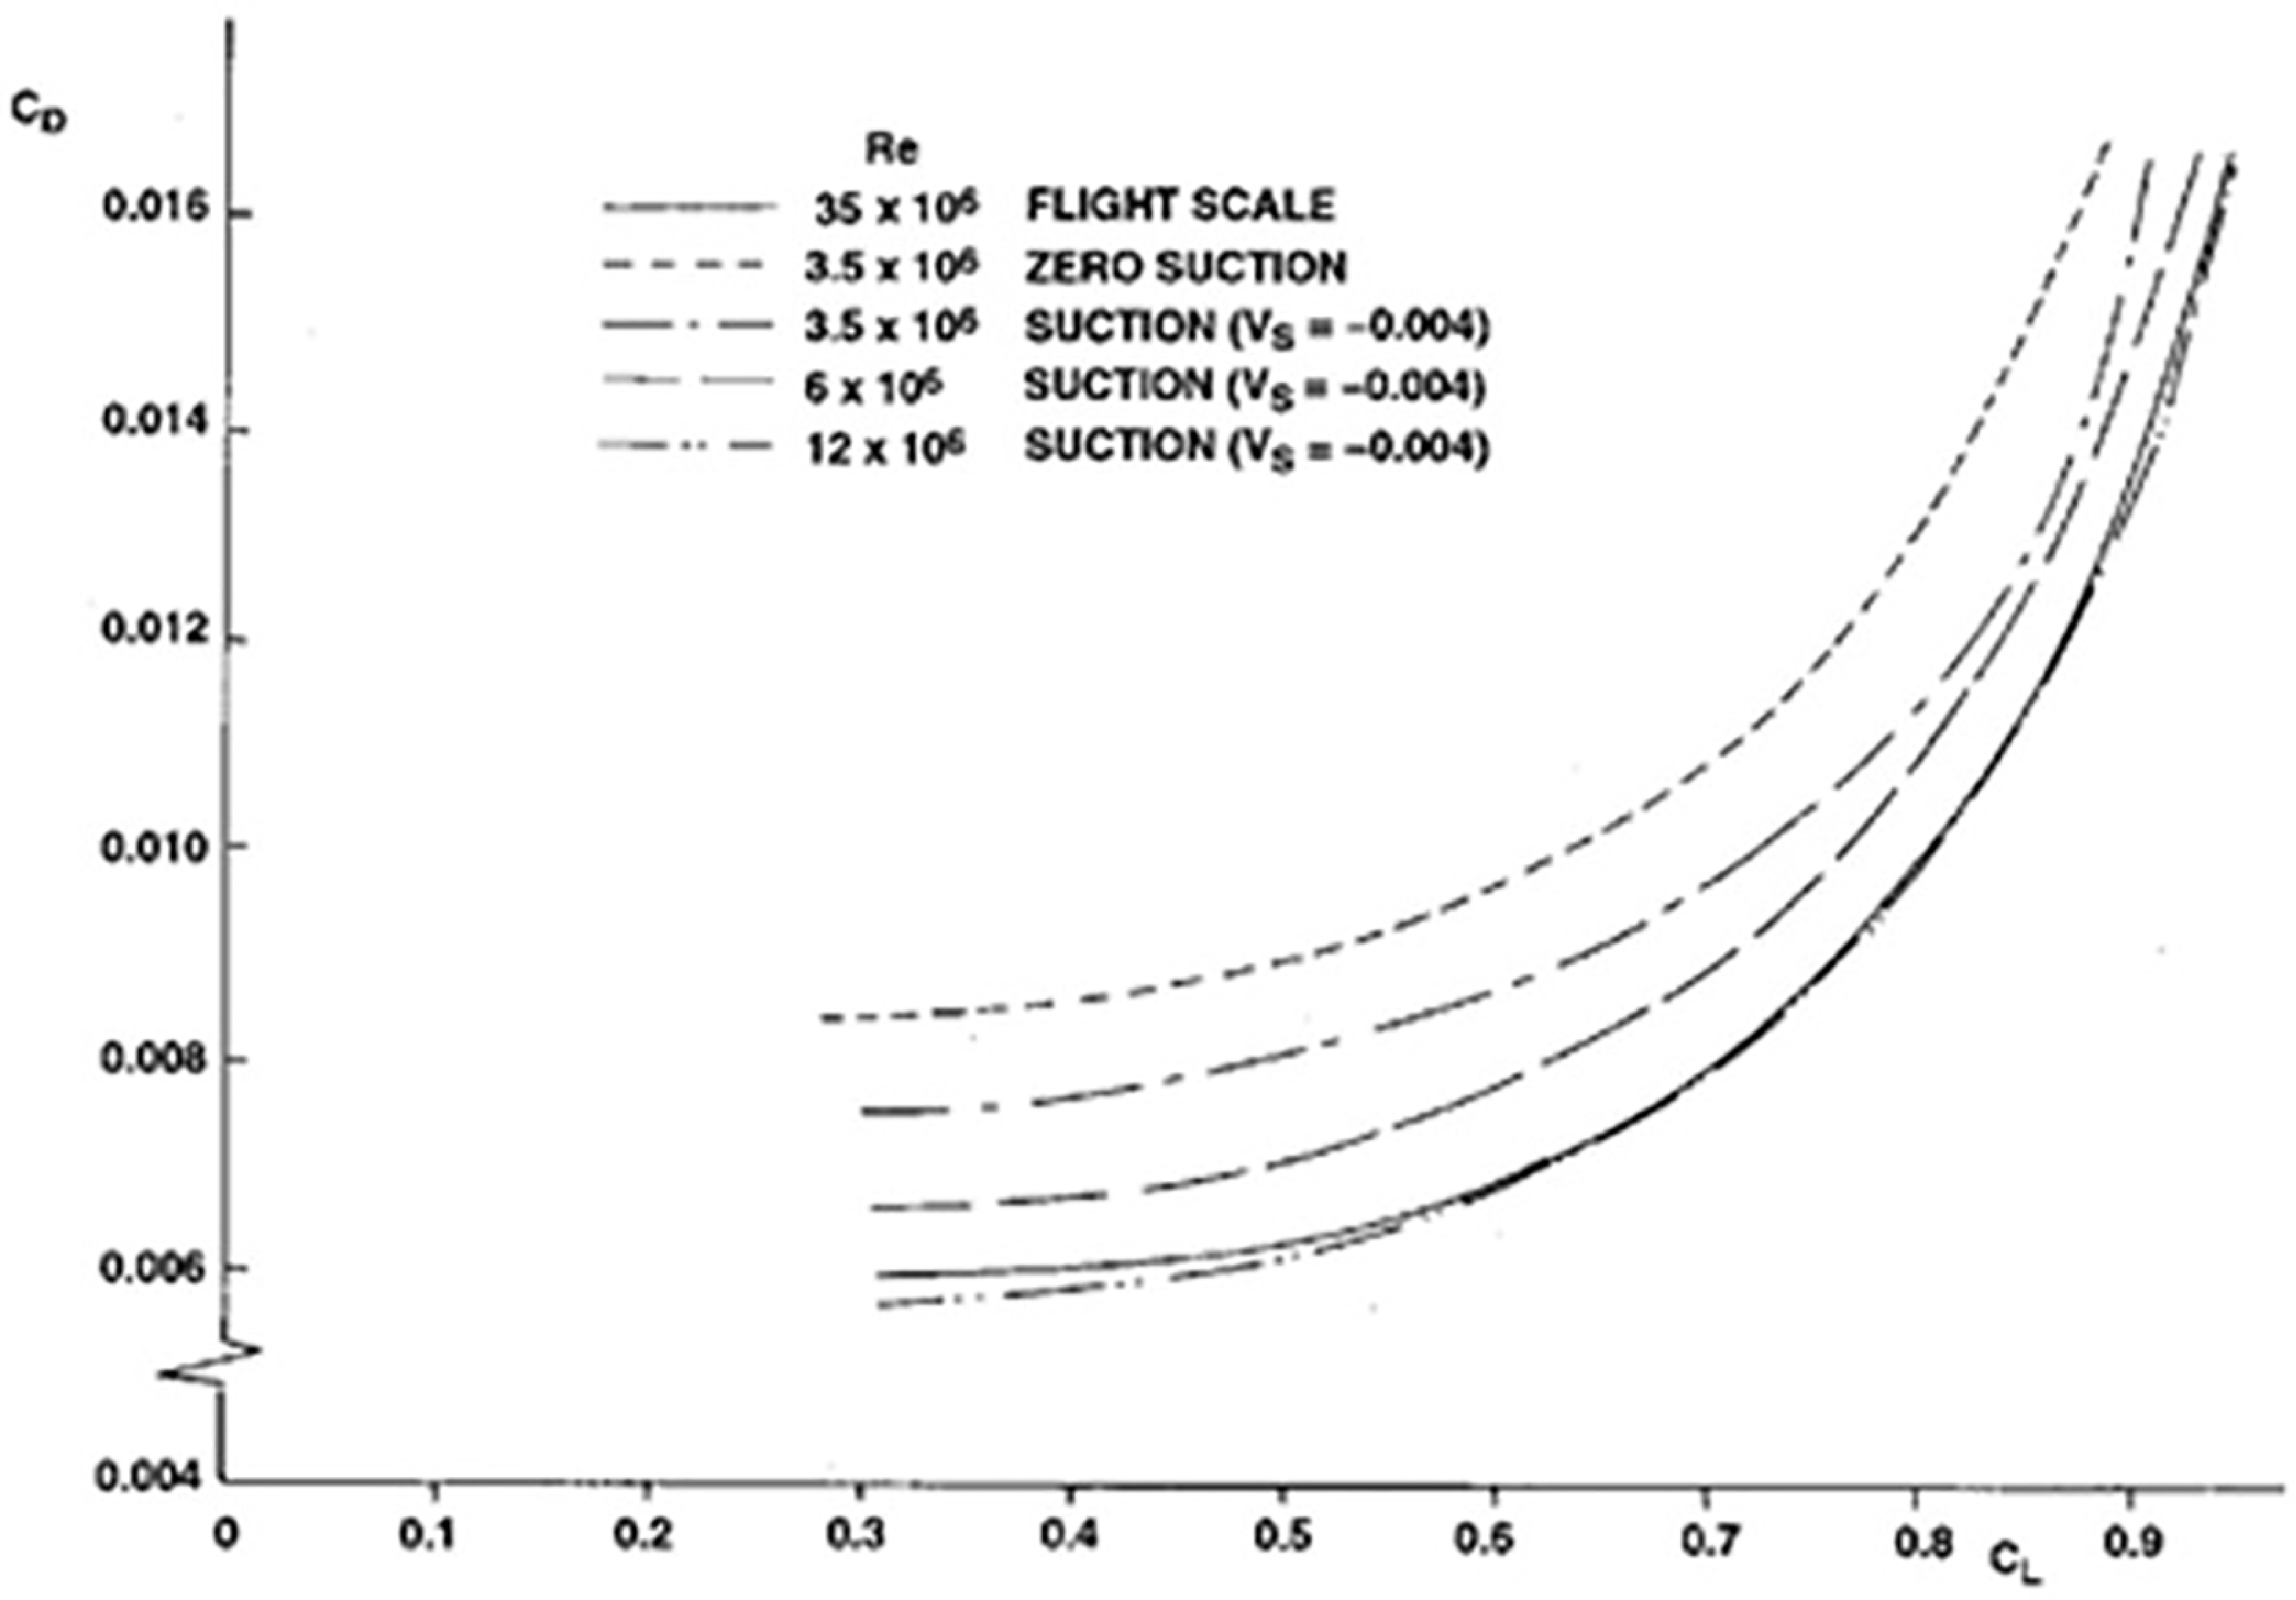
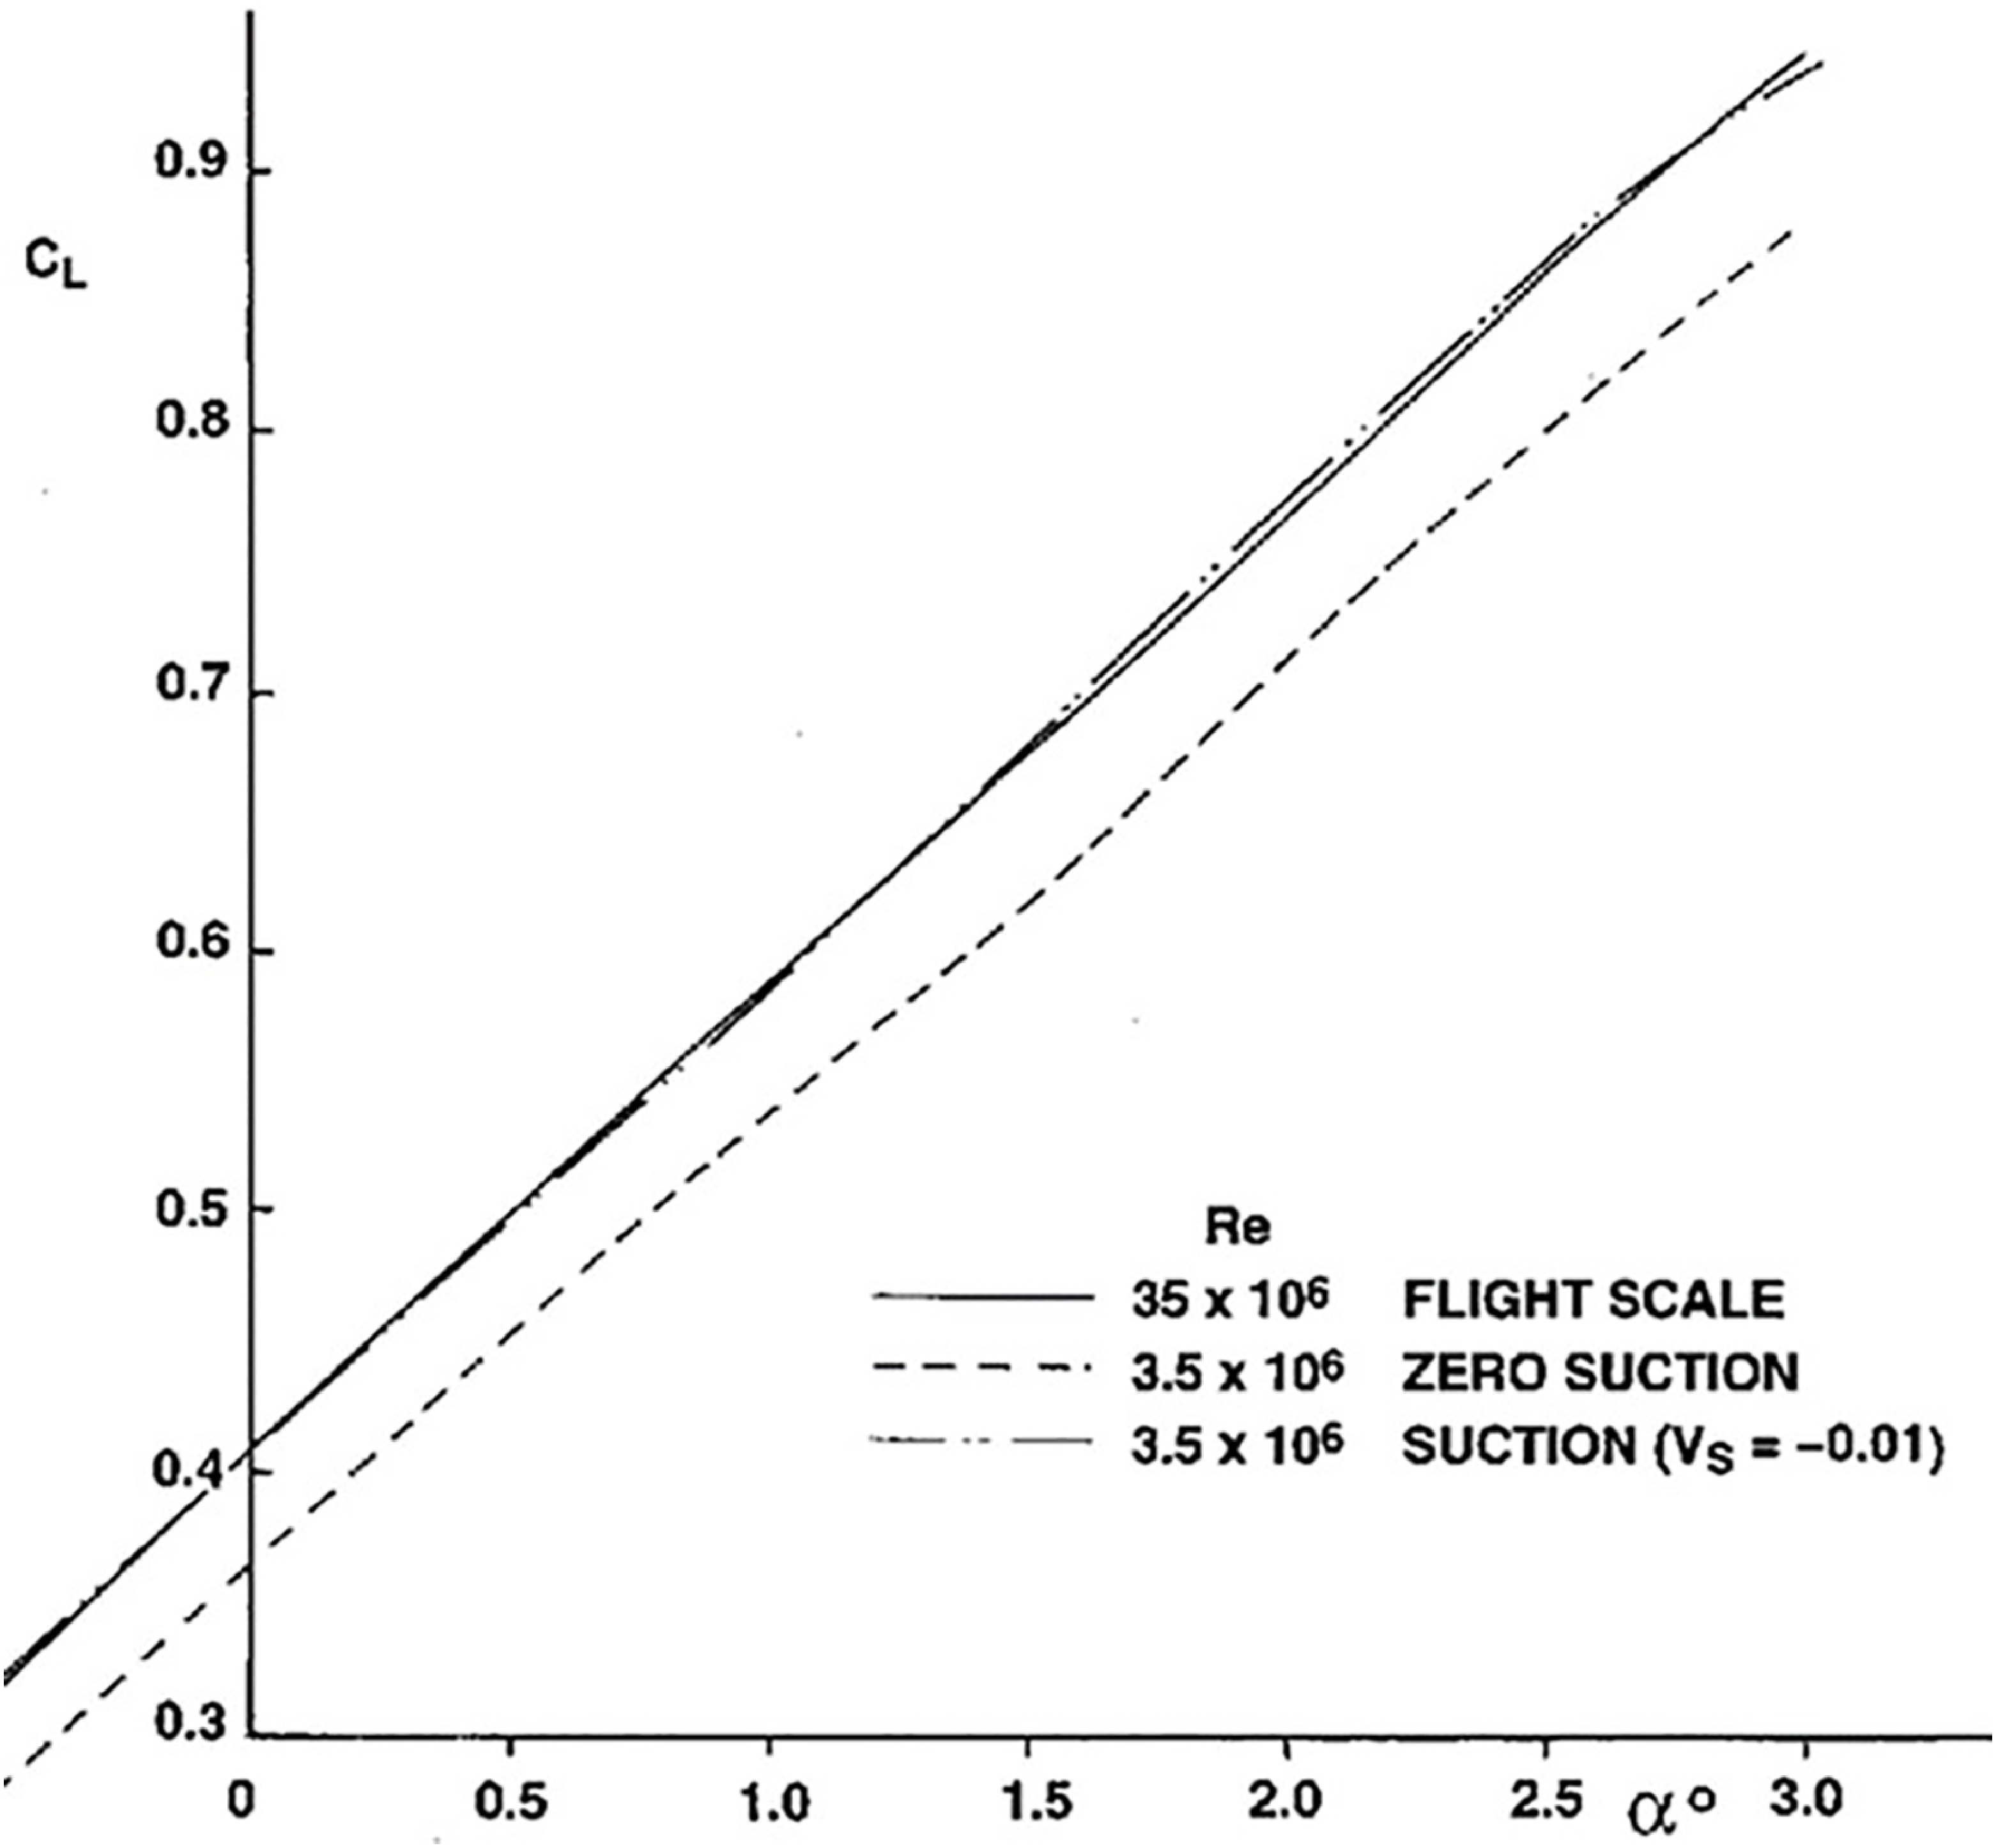
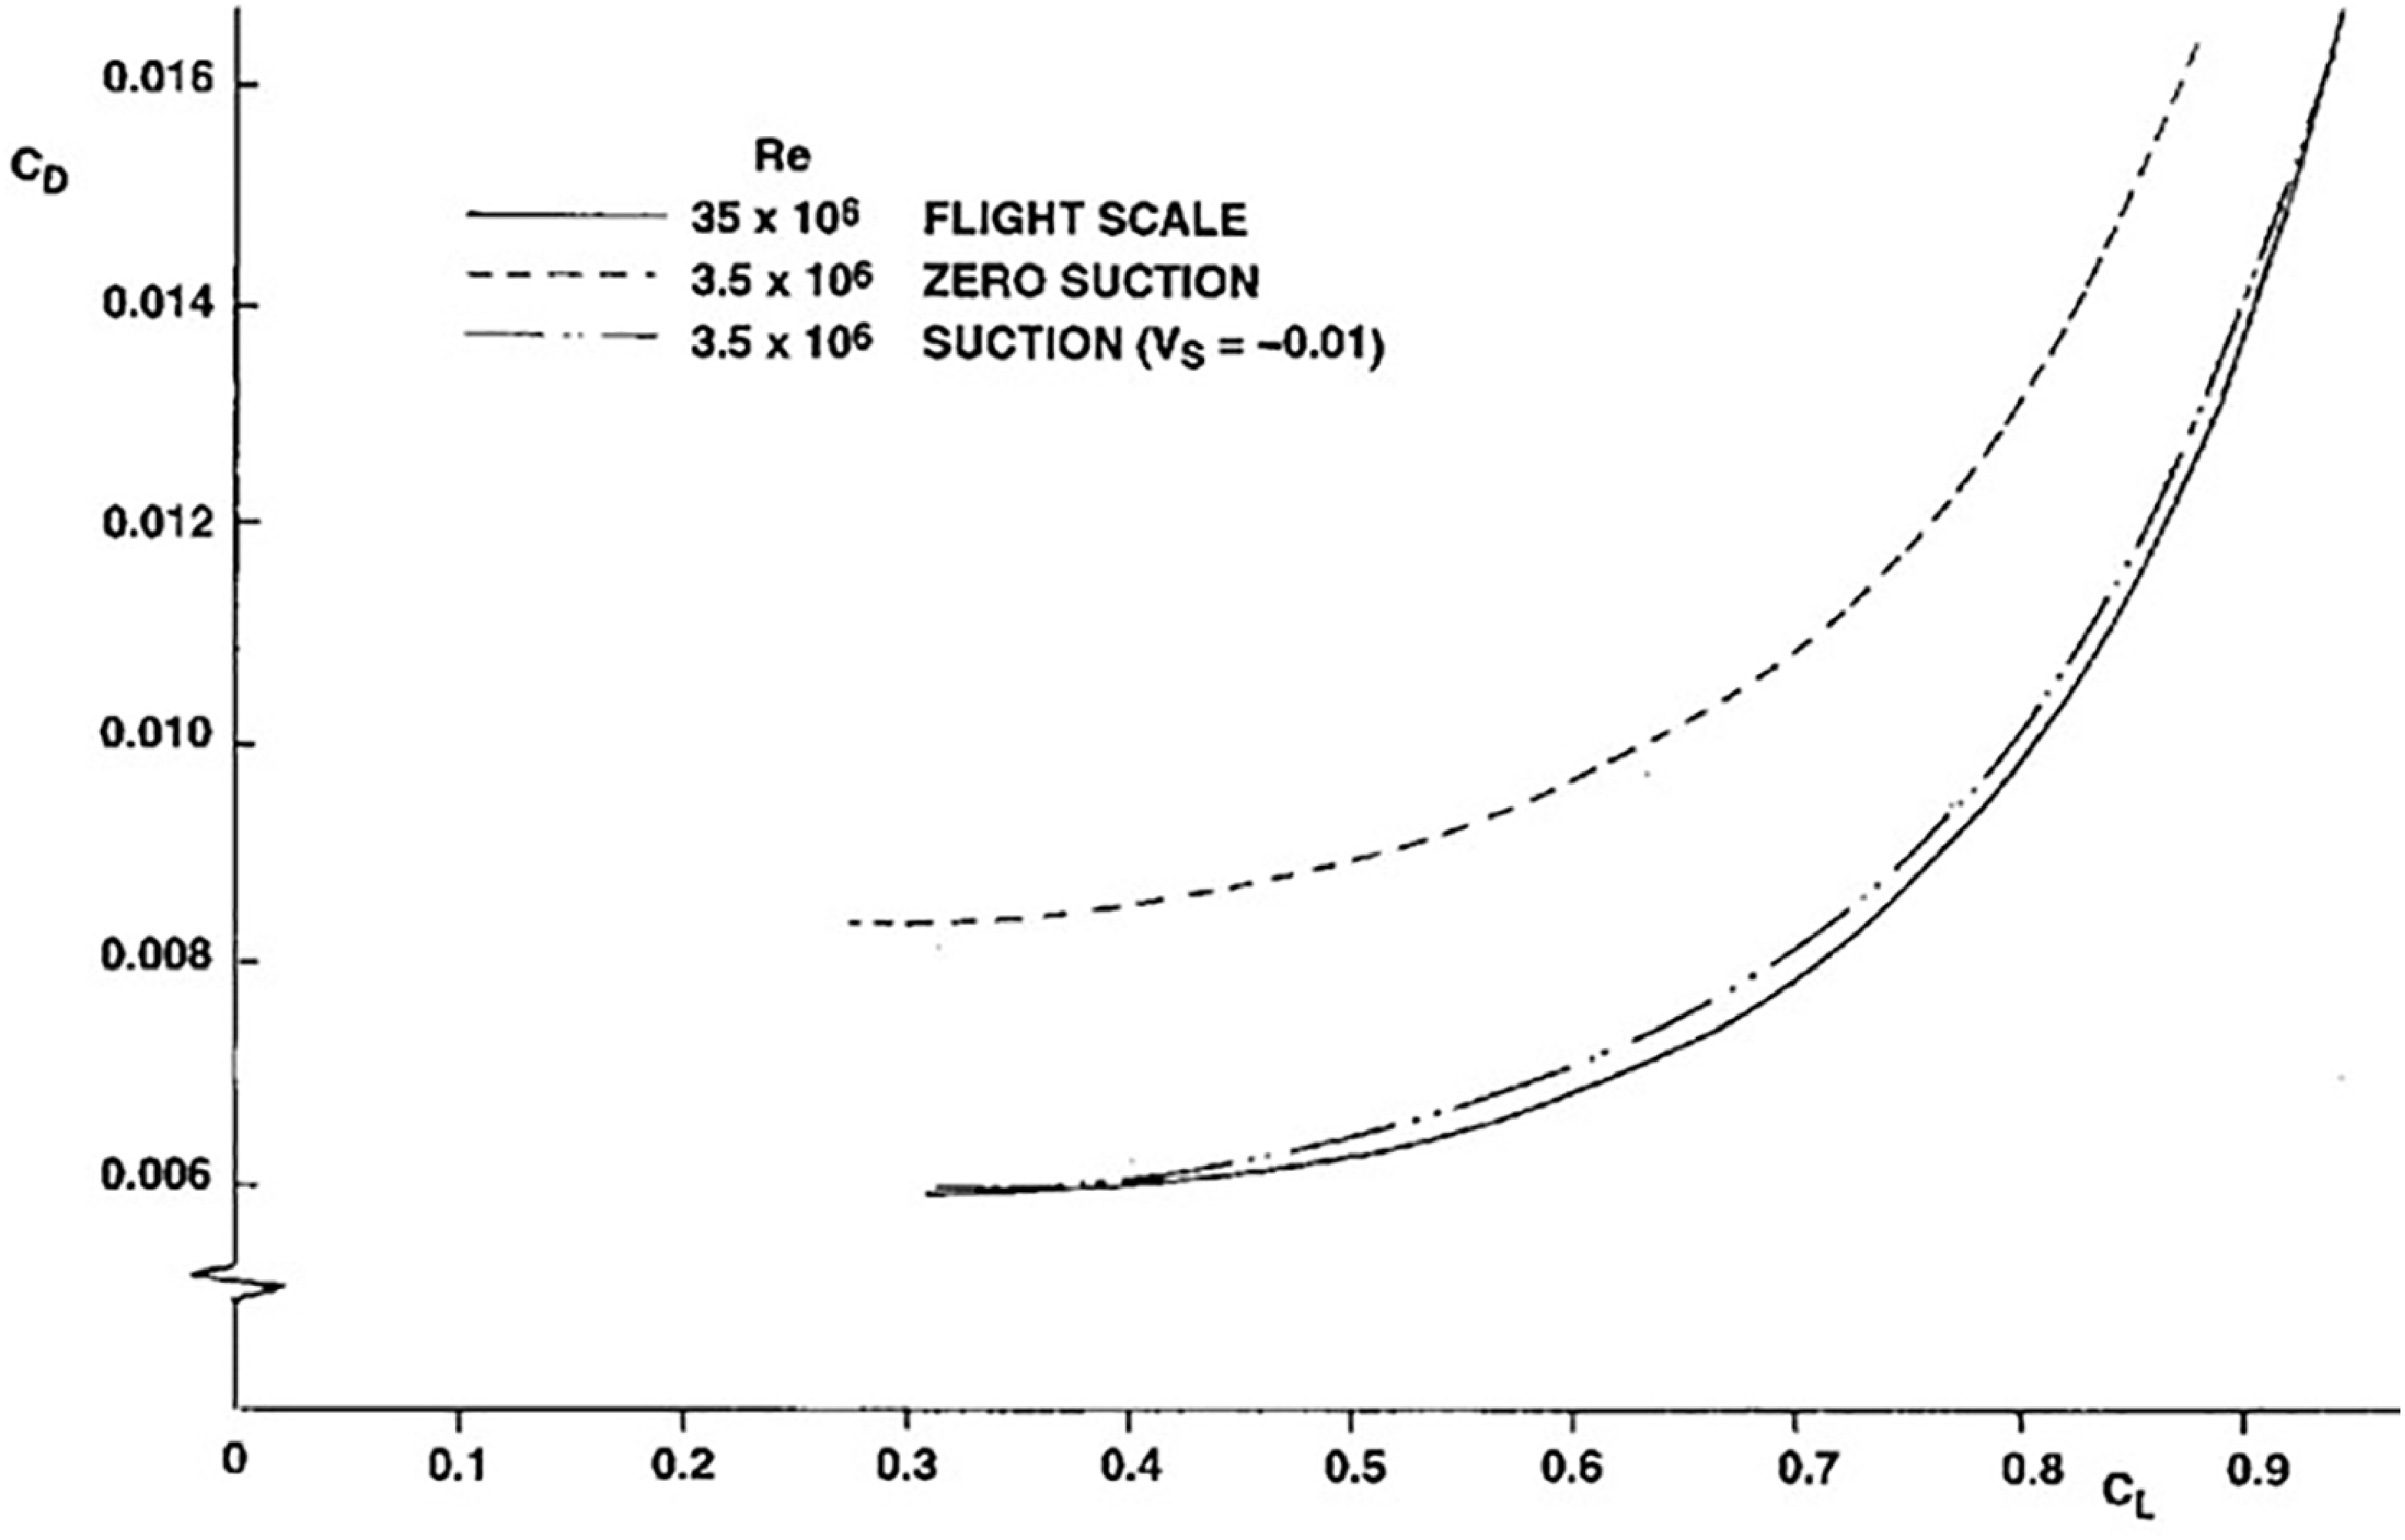
It was shown that the same suction velocity is applicable across the incidence range, which is of practical benefit for testing. This is illustrated in the results presented in Figs 51 and 52, where the lift and drag performance across the incidence range closely matches that at flight scale Reynolds number. For an atmospheric wind tunnel such as the ARA TWT, the suction quantities need to be increased to simulate the turbulent boundary layer at flight scale. For a chord Reynolds number of 3.5 × 10⁶, representative of the ARA tunnel, a suction velocity of −0.01 is required to match the flight scale results for the M2303 aerofoil, as shown in Figs 53 and 54.
Variation of C L with α, compressible wind tunnel, M2303 aerofoil, M = 0.68.

Variation of C D with C L , compressible wind tunnel, M2303 aerofoil, M = 0.68.

Variation of C L with α, atmospheric wind tunnel, M2303 aerofoil, M = 0.68.

Variation of C D with C L, atmospheric wind tunnel, M2303 aerofoil, M = 0.68.

It should be noted that this is a first-order simulation, with no attempt to ‘fine-tune’ the suction rate beyond the first significant figure. This has demonstrated that the technique could be developed into a practical method for high Reynolds number simulation in wind tunnel testing. For wings designed with fully turbulent flow, the use of surface suction in the turbulent flow region for flight scale Reynolds number simulation has been demonstrated successfully in an ARA wind tunnel test [Reference Green, Elliot and Wong26], hence the technique could be used for testing aircraft with HLFC wing design in the future. Further investigation is required to extend the technique to predict buffet onset. The issues involving simulation of the transition zone should also be studied.
9.0 Conclusions and future research recommendations
Extensive work at ARA into different HLFC concepts has explored several design philosophies and parametric trends, leading to the conclusions and recommendations presented below.
It is more effective to increase the suction extent than the suction velocity in order to delay transition. This implies that a greater extent of laminar flow would not be possible due to the structural constraint of limiting suction to the region forward of the front spar. This constraint may be overcome by the use of surface cooling instead of suction downstream of the front spar for suppressing TS instability in order to achieve a greater extent of laminar flow. The surface cooling rates required for suppressing TS waves are about 10% below the ambient temperature. There is current interest in the use of hydrogen fuel for engine propulsion for zero carbon emissions. The feasibility of using the liquid hydrogen to provide surface cooling to suppress the flow instabilities to delay transition for drag reduction should be investigated in the future.
It was shown that the single chamber and variable porosity concept can be incorporated into the wing leading-edge structure with a conventional hot air wing ice protection system and the potential with an electric wing ice protection system. The resulting structural system is less complex and weighs less than the multi-chamber concept. In the future, a more detailed design is required, including structural strength and manufacturing considerations, in order to mature the concept to the aircraft application level. The suction mass flow can be controlled by a combination of hole spacing, hole diameter and skin thickness with the variable porosity concept. The trade-off between the structural stiffness, weight and laser drilling in terms of these parameters for the porous skin should also be investigated.
Wave drag and lift capability are important considerations for HLFC wing design in addition to viscous drag reduction. It was shown that it is possible to use a turbulent type of pressure distribution for HLFC application as for an Airbus A330 retrofit wing, with transition delayed to as far downstream as the shock location. These wing sections have a higher L/D performance and better drag rise characteristics than wing sections with a favourable gradient type of pressure distribution. In the future, more analysis should be carried out to substantiate the aerodynamic performance compared with a conventional aircraft with a turbulent wing design, as this has the potential of being able to retain the performance of a conventional aircraft and implications on aircraft operation, in the case of suction system failure.
It is not possible to use a single critical N-factor for transition prediction with linear stability analysis method. It was found that the N-factor for transition is very low for cases near zero angle of incidence with the presence of strong CF and TS instabilities, where these waves may interact. These cases also coincide with a pressure distribution relevant to HLFC design. The low N-factor for transition may be due to the limitation of linear stability analysis methods in the case of interacting waves. More work is required to understand this phenomenon with non-linear methods. Detailed measurement of the tunnel environment and fluctuations within the boundary layer are required in the future to enable a more realistic detailed investigation with these methods. The investigation should also be carried out for flight scale Reynolds number, as the choice of N-factor for transition prediction with linear compressible or incompressible stability analysis methods would affect the type of pressure distribution that can be used for HLFC design. This issue needs to be resolved, since choosing a favourable or adverse type of ‘rooftop’ pressure distribution for HLFC design will have a significant effect on L/D performance and drag rise characteristics.
The effects of the transition region on the aerodynamic performance of HLFC aerofoils have been shown to be significant, indicating that the modelling of the transition region should be included in aerodynamic methods for designing HLFC aerofoils and wings. The full extent of transition from onset to completion has been measured in ARA wind tunnel tests. Analysis of these test data should be extended to transition zone prediction methods in the future.
The wind tunnel testing capability acquired at ARA for measuring the effect of small features on transition in NLF could be extended to HLFC to investigate the effect of suction on the disturbances due to various degree of surface imperfections. For a HLFC wind tunnel test case with variable porosity, it was shown that it may be possible to stabilise the flow even in the presence of blowing with sufficient suction downstream of blowing. The use of the variable porosity concept to provide a higher suction mass flow for controlling the disturbances due to surface imperfections should be investigated.
A wind tunnel testing methodology for HLFC aerofoils using surface to thin the turbulent boundary layer to simulate flight scale Reynolds number has been shown to be viable theoretically. The application of this technique has achieved a close simulation of the flight scale results in terms of pressure distributions and aerodynamic forces. This high Reynolds number wind tunnel simulation technique has already been demonstrated in ARA TWT for an aircraft with a fully turbulent flow wing design. The technique could be extended to an aircraft with a HLFC wing design. Further investigation is required to extend the technique to predict buffet onset and simulation of the transition zone. The possibility of establishing a relationship between surface suction level and Reynolds number should also be investigated.