In contrast to the view that survey key driver analysis (SKDA) is a misused and blind empirical process, we suggest it is a reasonable, hypothesis-driven approach that builds on cumulative knowledge drawn from both the literature and practice, and requires reasoned judgment about the relationships of individual items to the constructs they represent and the criteria of interest. The logic of key driver analysis in applied settings is no different than the logic of its application in fundamental research regarding employee attitudes (e.g., Dalal, Baysinger, Brummel, & LeBreton, Reference Dalal, Baysinger, Brummel and LeBreton2012). However, there are important survey design and analysis issues with respect to how key driver analyses are best conducted. Just some of these are discussed below.
We illustrate our thinking through reanalysis of portions of the data used by Cucina, Walmsley, Gast, Martin, and Curtin (Reference Cucina, Walmsley, Gast, Martin and Curtin2017), and amplify their points where our experience or their data are relevant. We limit our approach to relative weights analysis (RWA) for SKDA, as this is the dominant method used in the practitioner community for assessing relative importance. In the end, we argue that properly conducted SKDA is one manifestation of theory-driven model building and as such has a place in survey practice, just as cross-sectional analyses have a place in the I-O literature.
SKDA Is One Tool of Many
Survey stakeholders are often interested in identifying levers for change and related intervention strategies. SKDA is but one tool in a larger context. In our work, key driver results are typically presented as part of a presentation with key stakeholders, one that is primarily focused on organization-level results and includes an overview of item and theme response favorability both in relative terms and with respect to relevant benchmarks. The structure of the presentation is grounded in the context of the business and operating environment, as that is the primary framework for determining survey content. It therefore makes sense to identify those elements of the work context that bear the strongest relationship to the criteria of interest. Thus, SKDA is one way of focusing attention and the allocation of scarce resources.
Cucina et al. (Reference Cucina, Walmsley, Gast, Martin and Curtin2017) suggest that an examination of survey results should lead to hypotheses worth examining. We completely agree but suggest the very kinds of analyses one would conduct include a SKDA. Cucina et. al recommend a more limited approach, looking for intervention areas based on differences from norms. Thus, although they outline an experimental method for evaluating their intervention, their method of choosing issues requiring intervention is not necessarily more robust than other strategies. Norms are indeed useful reference points but are not always available and may be flawed in other ways. Thus, we recommend a balanced approach considering the overall favorability of items, thematic consistency, historical results, normative data, differences among important subgroups, the distribution of data at the unit level, and the SKDA to determine where interventions may be most impactful.
Survey Content and SKDA Are Based on Reasoned Judgment
Survey content is determined in multiple ways. First, surveys are sometimes used to measure progress, and thus some content reflects the need for continuity. Second, survey items are often drawn from those that have been used elsewhere to benchmark outcomes against relevant organizations. Third, some items may reflect the particular interests of sponsors such as strategic priorities for service, safety, or innovation. Thus, the survey content domain is not random and is determined by prior knowledge and organizational priorities that presume the influence of work conditions on relevant outcomes, that is, cause and effect relationships. Also, both content and hypotheses are informed by the literature. For example, the nature of work generally materializes as a key driver of job satisfaction (Saari & Judge, Reference Saari and Judge2004). Therefore, SKDA is not an example of dustbowl empiricism but, rather, one approach to generating reasonable hypotheses about the efficacy of potential interventions. Importantly, we use the term “driver” fully aware of the limitations of cross-sectional research.
SKDA Is by Definition Relative
The survey content domain is a limiting factor in identifying what is most important. As noted above, final survey content is often determined by multiple and competing interests. Also, shorter surveys are often desirable to organizations with limited resources. In practical terms, the results of a SKDA can only be interpreted in the context of the driver pool. Therefore, errors of omission have important consequences for the interpretation of the results. Further, in multivariate analyses, the weights or impact attributed to survey items are necessarily impacted by the shared variance among the items in the predictor space. In a relative way, including known drivers of important outcomes provides a useful means to assess the importance of other potential drivers. Thus, LeBreton, Hargis, Griepentrog, Oswald, and Ployhart (Reference LeBreton, Hargis, Griepentrog, Oswald and Ployhart2007) suggest that incremental importance should be evaluated in the context of relative importance.
Not All Survey Items Belong in a SKDA
MacKenzie, Podsakoff, and Jarvis (Reference MacKenzie, Podsakoff and Jarvis2005) distinguish between formative and reflective measurement models, and suggest the correct ways of specifying each type. Classical measurement theory assumes a reflective model, in which an underlying latent variable is viewed as “causing” each of the indicators. Conversely, formative indicators are viewed as combining to form the latent variable. Formative indicators may each measure facets of the underlying construct and may not be interchangeable or even highly correlated. Thus, the classical measurement model applied by Cucina et al. (Reference Cucina, Walmsley, Gast, Martin and Curtin2017) is not applicable to these measures, although techniques such as factor analysis are most certainly appropriate to investigating reflective models. In employee opinion research, survey content is often a mix of both reflective and formative indicators. However, reflective indicators of the criterion construct should not be considered as part of the potential pool of drivers. From our standpoint, SKDAs should include as drivers (a) items that are judiciously considered formative indicators, or (b) scales comprising reflective indicators that are in turn viewed as representing an implied cause–effect relationship with the criterion. Thus, it may be the case that a hierarchical survey content model may include both formative and reflective indicators. These points should be taken into consideration prior to SKDA and ideally in the survey design process.
Defining “Key”
In our discussions with clients, we want to highlight those items or scales that are most impactful. In practical terms, this means defining just what is “key.” One means of determining this limited set is to examine the scree plot of the driver weights to identify reasonable break points, as opposed to setting an arbitrary cutoff such as the “top-five” or “top-10” items. It is also helpful to calculate confidence limits for the relative weights to ensure that the cut-off based on the scree plot is reasonable. This is straightforward using a bootstrap approach (Tonidandel, LeBreton, & Johnson, Reference Tonidandel, LeBreton and Johnson2009).
To illustrate our perspective, we reanalyzed the 2006, 2008, and 2010 data reported by Cucina et al. (Reference Cucina, Walmsley, Gast, Martin and Curtin2017) to distinguish the three attitudinal criteria (job satisfaction, satisfaction with the organization, and willingness to recommend the organization) detailed in their appendix. All analyses reported below were conducted using 37 itemsFootnote
1
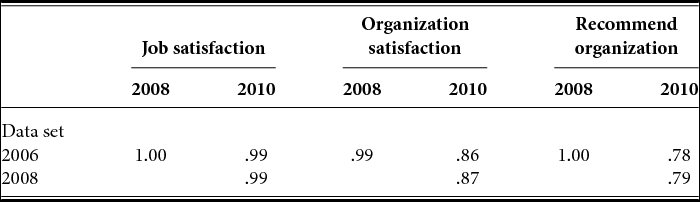
common to the three data sets that in our subjective view were hypothesized to have an impact on one or more of the criteria. We did not include items that were evaluative rather than descriptive or measures of facet satisfaction. Relative weights were calculated (Johnson, Reference Johnson2000) using listwise deletion for missing data (N = 158,634 for 2006; 151,054 for 2008; 162,321 for 2010). The intercorrelations of the predictor (driver) weights are presented in Table 1 and reflect remarkable stability, particularly for the job satisfaction criterion.
Table 1.
Correlations of Item Relative Weights by Year
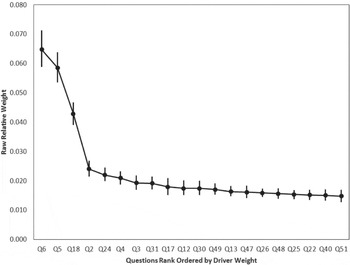
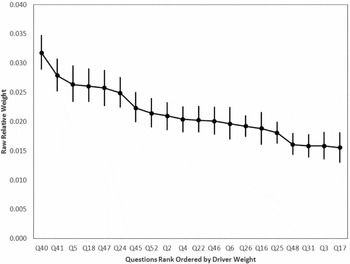
To illustrate how we determine what is key, we calculated confidence intervals for 1,000 bootstrap samples of 10,000 cases for the job satisfaction (Q61; Figure 1) and organization satisfaction (Q63; Figure 2) criteria. This sample size (10,000) was chosen to represent what might be considered a large division within a major private-sector organization or a modest size total organization.
Figure 1.
Raw relative weights and the 95% confidence intervals for the top-20 drivers of job satisfaction calculated from 1,000 bootstrap samples of 10,000 cases each of the 2008 data.
Figure 2.
Raw relative weights and the 95% confidence intervals for the top-20 drivers of organization satisfaction calculated from 1,000 bootstrap samples of 10,000 cases each of the 2008 data.
The scree plots are of a very different form and thus are instructive as to what SKDA can and cannot tell us. For Q61, the opportunity to do work that one likes, that provides a feeling of personal accomplishment, and that uses one's talents are the most important predictors of satisfaction with the job—as would be expected given our knowledge of the literature. Now, that is not the point here, but what is relevant is that for one criterion (Q61), there is a clear ordering of the top drivers that can serve as an argument for the kind of job crafting interventions reported by Bakker (Reference Bakker2011). In contrast, for Q63, the scree is relatively flat, although the first two items (Q40 and Q41) would appear to be particularly important to consider. Both of these items reflect the larger leadership context of the organizations(s). However, a second elbow in the scree plot might suggest identifying six key drivers representing a broader set of issues, and thus the driver analysis for Q63 is seemingly less definitive. The choice of the items to be designated “key” can be supported by nonparametric bootstrapping tests. The important points are that SKDA does not guarantee that either significant or meaningful differences will exist in relative importance, that some degree of subjectivity is inherent in defining what is “key,” and that statistical tests are both relevant and useful.
It should be noted that we treated all 37 items as formative indicators by calculating relative weights for each. Alternatively, it may be appropriate to create composite indices to represent formative constructs, perhaps based upon a factor analysis. The analyses reported here were conducted to be consistent with the approach of Cucina et al. (Reference Cucina, Walmsley, Gast, Martin and Curtin2017). However, it should be noted that if items reflect a common underlying construct, the weight of that construct will be shared between them (Johnson, Reference Johnson2000). This is a particular issue in using RWA with reflective indicators. That is, if constructs are disproportionately represented by the number of reflective indicators, the relative item weights for a more frequently represented construct may be lower than the relative item weights for a less frequently represented construct, all other things being equal.
Boundary Conditions on Reporting SKDA
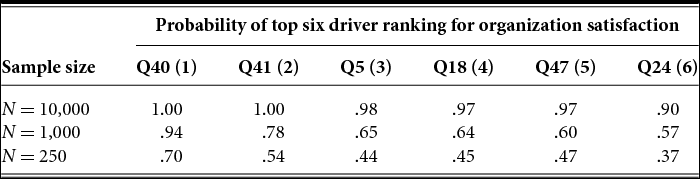
Our experience leads us to agree with Cucina et al. (Reference Cucina, Walmsley, Gast, Martin and Curtin2017) that the analysis and reporting of individual work group key driver statistics should be discouraged; the confidence limits on driver weights may be considerably larger than many practitioners might expect. This is particularly true for driver rankings, which are sometimes used to describe key SKDA results rather than relative weights. To illustrate, Table 2 displays the probability of a given driver being ranked among the top six drivers of Q63 in the 2008 data. Results are provided for 1,000 bootstrapped samples of size 250, 1,000, and 10,000. These probabilities represent the proportion of times each of the top six drivers determined through the RWA based on the complete sample appeared in the bootstrap samples. Even with moderate to very large samples, it can be seen that the probability of an item being correctly identified as a key driver (i.e., nominally as one of the top six) diminishes rapidly as the depth of ranking increases. For example, the probability of identifying Q40—the nominal top driver of Q63—as one ranked in the top six is 0.70 for a sample size of 250.
Table 2.
Probability of Ranking in Top Six
The Weak Case for Situational Specificity
In agreement with Cucina et al. (Reference Cucina, Walmsley, Gast, Martin and Curtin2017), Macey and Bakker (Reference Macey and Bakker2012) argue that there is at best weak evidence for situational specificity of engagement drivers. However, they suggest that driver differences might emerge across cultural lines. By extension, differences would be expected in key driver weights across organizational boundaries if those boundaries reflect differences in cultural values. Such differences might clearly come into play in large, multinational organizations, justifying the use of multiple SKDAs. Arguably, this logic might extend to differences in employee preferences across gender, generational, or other lines, but we are not aware of evidence to this effect.
The Efficacy of Key Driver Analysis
The subjectivity in defining what is key and the requirements for relatively large samples might beg the question whether SKDA is worthwhile. We argue it is particularly so when considering the relative importance of new content (LeBreton et al., Reference LeBreton, Hargis, Griepentrog, Oswald and Ployhart2007). That is, past experience might suggest what the key drivers should be, but the inclusion of new content that reflects shifting priorities creates the opportunity to assess the relative importance of both new and old content.
Cucina et al. (Reference Cucina, Walmsley, Gast, Martin and Curtin2017) directly question the value of SKDA on the basis of analyses indicating that a subset of items chosen at random demonstrated validities nearly as high as items chosen on the basis of SKDA. In their analysis, they created two random samples of items, one of five and the other 10, and found validities only slightly lower than those found through stepwise regression. We believe the data lead to a different conclusion. We analyzed the 2008 data in a different way, comparing the R2 obtained using the most impactful drivers to the average of random sets of items of all potential 37 key drivers. Based on the three highest ranked items, the R2 for Q61 was .56 and the average of 1,045 correlations based on randomly selected sets of three items (without replacement) was .43 (SD = .05). The R2 for Q63 was 0.59 based on the highest six drivers, and the average of 1,032 correlations based on randomly selected sets of six items was .53 (SD = .02). In our view, the differences between the amount of variance accounted for by the top ranked drivers and the average random sets is meaningful, if modest, for both criteria.
Restriction in Range and Ceiling Effects
Cucina et al. (Reference Cucina, Walmsley, Gast, Martin and Curtin2017) demonstrate significant and positive correlations between driver weights and item standard deviations using organization satisfaction as a criterion. To extend their analysis, we computed correlations separately by criterion. These results are reported in Table 3. It can be seen that the correlation of key driver weights and item standard deviations varies across the three criteria. The average of the nine correlations was .03. Cucina et al. report a correlation of .51 between the item relative weights and standard deviations (SDs), whereas we obtained a correlation of 0.35. This difference can be attributed to the fact that we used only a subset (37 items) of those used by Cucina et al. Thus, the correlation reported by Cucina et al. between the bivariate correlations and item SDs was 0.62, yet among the 37 items used in our more restricted analyses was .45. On balance, based on the RWAs conducted with three separate criteria, it does not appear that restriction in range is influencing the results of key driver analysis.
Table 3.
Correlations Between Item Relative Weights and Item Standard Deviations
Further, it is true that an item with very low favorability will also have low variance. However, typical employee survey data are negatively skewed, and such is the case in the data analyzed here; the correlations between means and standard deviations for the 37 predictors described above averaged –.79 across the 2006, 2008, and 2010 data sets.
Recommendation
SKDA has evolved over the last 20 years, particularly as influenced by the literature on relative importance and in particular RWA. We encourage the use of SKDA within the context of a broader toolkit, with the particular caveats of sample size considerations, cross-sectional research, and cultural influences.
Our emphasis in this commentary has been on the application of RWA to SKDA. Interested readers will find the discussion on the limitations of RWA by Tonidandel and LeBreton (Reference Tonidandel and LeBreton2011) to be important, particularly regarding concerns over model misspecification. As one reviewer noted, uncertainty in model selection (Burnham & Anderson, Reference Burnham and Anderson2002) is often ignored in practice. We might extend that reviewer's comments to consideration of content misspecification errors, particularly errors of omission. Indeed, the very differences in analytic outcomes between those reported by Cucina et al. (Reference Cucina, Walmsley, Gast, Martin and Curtin2017) and what we presented here reflect how critical choices in survey content can be for the conversations we would have with clients regarding SKDA results.





In contrast to the view that survey key driver analysis (SKDA) is a misused and blind empirical process, we suggest it is a reasonable, hypothesis-driven approach that builds on cumulative knowledge drawn from both the literature and practice, and requires reasoned judgment about the relationships of individual items to the constructs they represent and the criteria of interest. The logic of key driver analysis in applied settings is no different than the logic of its application in fundamental research regarding employee attitudes (e.g., Dalal, Baysinger, Brummel, & LeBreton, Reference Dalal, Baysinger, Brummel and LeBreton2012). However, there are important survey design and analysis issues with respect to how key driver analyses are best conducted. Just some of these are discussed below.
We illustrate our thinking through reanalysis of portions of the data used by Cucina, Walmsley, Gast, Martin, and Curtin (Reference Cucina, Walmsley, Gast, Martin and Curtin2017), and amplify their points where our experience or their data are relevant. We limit our approach to relative weights analysis (RWA) for SKDA, as this is the dominant method used in the practitioner community for assessing relative importance. In the end, we argue that properly conducted SKDA is one manifestation of theory-driven model building and as such has a place in survey practice, just as cross-sectional analyses have a place in the I-O literature.
SKDA Is One Tool of Many
Survey stakeholders are often interested in identifying levers for change and related intervention strategies. SKDA is but one tool in a larger context. In our work, key driver results are typically presented as part of a presentation with key stakeholders, one that is primarily focused on organization-level results and includes an overview of item and theme response favorability both in relative terms and with respect to relevant benchmarks. The structure of the presentation is grounded in the context of the business and operating environment, as that is the primary framework for determining survey content. It therefore makes sense to identify those elements of the work context that bear the strongest relationship to the criteria of interest. Thus, SKDA is one way of focusing attention and the allocation of scarce resources.
Cucina et al. (Reference Cucina, Walmsley, Gast, Martin and Curtin2017) suggest that an examination of survey results should lead to hypotheses worth examining. We completely agree but suggest the very kinds of analyses one would conduct include a SKDA. Cucina et. al recommend a more limited approach, looking for intervention areas based on differences from norms. Thus, although they outline an experimental method for evaluating their intervention, their method of choosing issues requiring intervention is not necessarily more robust than other strategies. Norms are indeed useful reference points but are not always available and may be flawed in other ways. Thus, we recommend a balanced approach considering the overall favorability of items, thematic consistency, historical results, normative data, differences among important subgroups, the distribution of data at the unit level, and the SKDA to determine where interventions may be most impactful.
Survey Content and SKDA Are Based on Reasoned Judgment
Survey content is determined in multiple ways. First, surveys are sometimes used to measure progress, and thus some content reflects the need for continuity. Second, survey items are often drawn from those that have been used elsewhere to benchmark outcomes against relevant organizations. Third, some items may reflect the particular interests of sponsors such as strategic priorities for service, safety, or innovation. Thus, the survey content domain is not random and is determined by prior knowledge and organizational priorities that presume the influence of work conditions on relevant outcomes, that is, cause and effect relationships. Also, both content and hypotheses are informed by the literature. For example, the nature of work generally materializes as a key driver of job satisfaction (Saari & Judge, Reference Saari and Judge2004). Therefore, SKDA is not an example of dustbowl empiricism but, rather, one approach to generating reasonable hypotheses about the efficacy of potential interventions. Importantly, we use the term “driver” fully aware of the limitations of cross-sectional research.
SKDA Is by Definition Relative
The survey content domain is a limiting factor in identifying what is most important. As noted above, final survey content is often determined by multiple and competing interests. Also, shorter surveys are often desirable to organizations with limited resources. In practical terms, the results of a SKDA can only be interpreted in the context of the driver pool. Therefore, errors of omission have important consequences for the interpretation of the results. Further, in multivariate analyses, the weights or impact attributed to survey items are necessarily impacted by the shared variance among the items in the predictor space. In a relative way, including known drivers of important outcomes provides a useful means to assess the importance of other potential drivers. Thus, LeBreton, Hargis, Griepentrog, Oswald, and Ployhart (Reference LeBreton, Hargis, Griepentrog, Oswald and Ployhart2007) suggest that incremental importance should be evaluated in the context of relative importance.
Not All Survey Items Belong in a SKDA
MacKenzie, Podsakoff, and Jarvis (Reference MacKenzie, Podsakoff and Jarvis2005) distinguish between formative and reflective measurement models, and suggest the correct ways of specifying each type. Classical measurement theory assumes a reflective model, in which an underlying latent variable is viewed as “causing” each of the indicators. Conversely, formative indicators are viewed as combining to form the latent variable. Formative indicators may each measure facets of the underlying construct and may not be interchangeable or even highly correlated. Thus, the classical measurement model applied by Cucina et al. (Reference Cucina, Walmsley, Gast, Martin and Curtin2017) is not applicable to these measures, although techniques such as factor analysis are most certainly appropriate to investigating reflective models. In employee opinion research, survey content is often a mix of both reflective and formative indicators. However, reflective indicators of the criterion construct should not be considered as part of the potential pool of drivers. From our standpoint, SKDAs should include as drivers (a) items that are judiciously considered formative indicators, or (b) scales comprising reflective indicators that are in turn viewed as representing an implied cause–effect relationship with the criterion. Thus, it may be the case that a hierarchical survey content model may include both formative and reflective indicators. These points should be taken into consideration prior to SKDA and ideally in the survey design process.
Defining “Key”
In our discussions with clients, we want to highlight those items or scales that are most impactful. In practical terms, this means defining just what is “key.” One means of determining this limited set is to examine the scree plot of the driver weights to identify reasonable break points, as opposed to setting an arbitrary cutoff such as the “top-five” or “top-10” items. It is also helpful to calculate confidence limits for the relative weights to ensure that the cut-off based on the scree plot is reasonable. This is straightforward using a bootstrap approach (Tonidandel, LeBreton, & Johnson, Reference Tonidandel, LeBreton and Johnson2009).
To illustrate our perspective, we reanalyzed the 2006, 2008, and 2010 data reported by Cucina et al. (Reference Cucina, Walmsley, Gast, Martin and Curtin2017) to distinguish the three attitudinal criteria (job satisfaction, satisfaction with the organization, and willingness to recommend the organization) detailed in their appendix. All analyses reported below were conducted using 37 itemsFootnote 1 common to the three data sets that in our subjective view were hypothesized to have an impact on one or more of the criteria. We did not include items that were evaluative rather than descriptive or measures of facet satisfaction. Relative weights were calculated (Johnson, Reference Johnson2000) using listwise deletion for missing data (N = 158,634 for 2006; 151,054 for 2008; 162,321 for 2010). The intercorrelations of the predictor (driver) weights are presented in Table 1 and reflect remarkable stability, particularly for the job satisfaction criterion.
Correlations of Item Relative Weights by Year
Correlations are for 37 items included in the RWA.
To illustrate how we determine what is key, we calculated confidence intervals for 1,000 bootstrap samples of 10,000 cases for the job satisfaction (Q61; Figure 1) and organization satisfaction (Q63; Figure 2) criteria. This sample size (10,000) was chosen to represent what might be considered a large division within a major private-sector organization or a modest size total organization.
Raw relative weights and the 95% confidence intervals for the top-20 drivers of job satisfaction calculated from 1,000 bootstrap samples of 10,000 cases each of the 2008 data.
Raw relative weights and the 95% confidence intervals for the top-20 drivers of organization satisfaction calculated from 1,000 bootstrap samples of 10,000 cases each of the 2008 data.
The scree plots are of a very different form and thus are instructive as to what SKDA can and cannot tell us. For Q61, the opportunity to do work that one likes, that provides a feeling of personal accomplishment, and that uses one's talents are the most important predictors of satisfaction with the job—as would be expected given our knowledge of the literature. Now, that is not the point here, but what is relevant is that for one criterion (Q61), there is a clear ordering of the top drivers that can serve as an argument for the kind of job crafting interventions reported by Bakker (Reference Bakker2011). In contrast, for Q63, the scree is relatively flat, although the first two items (Q40 and Q41) would appear to be particularly important to consider. Both of these items reflect the larger leadership context of the organizations(s). However, a second elbow in the scree plot might suggest identifying six key drivers representing a broader set of issues, and thus the driver analysis for Q63 is seemingly less definitive. The choice of the items to be designated “key” can be supported by nonparametric bootstrapping tests. The important points are that SKDA does not guarantee that either significant or meaningful differences will exist in relative importance, that some degree of subjectivity is inherent in defining what is “key,” and that statistical tests are both relevant and useful.
It should be noted that we treated all 37 items as formative indicators by calculating relative weights for each. Alternatively, it may be appropriate to create composite indices to represent formative constructs, perhaps based upon a factor analysis. The analyses reported here were conducted to be consistent with the approach of Cucina et al. (Reference Cucina, Walmsley, Gast, Martin and Curtin2017). However, it should be noted that if items reflect a common underlying construct, the weight of that construct will be shared between them (Johnson, Reference Johnson2000). This is a particular issue in using RWA with reflective indicators. That is, if constructs are disproportionately represented by the number of reflective indicators, the relative item weights for a more frequently represented construct may be lower than the relative item weights for a less frequently represented construct, all other things being equal.
Boundary Conditions on Reporting SKDA
Our experience leads us to agree with Cucina et al. (Reference Cucina, Walmsley, Gast, Martin and Curtin2017) that the analysis and reporting of individual work group key driver statistics should be discouraged; the confidence limits on driver weights may be considerably larger than many practitioners might expect. This is particularly true for driver rankings, which are sometimes used to describe key SKDA results rather than relative weights. To illustrate, Table 2 displays the probability of a given driver being ranked among the top six drivers of Q63 in the 2008 data. Results are provided for 1,000 bootstrapped samples of size 250, 1,000, and 10,000. These probabilities represent the proportion of times each of the top six drivers determined through the RWA based on the complete sample appeared in the bootstrap samples. Even with moderate to very large samples, it can be seen that the probability of an item being correctly identified as a key driver (i.e., nominally as one of the top six) diminishes rapidly as the depth of ranking increases. For example, the probability of identifying Q40—the nominal top driver of Q63—as one ranked in the top six is 0.70 for a sample size of 250.
Probability of Ranking in Top Six
The six top drivers identified in the 2008 data set (using item 63 as the criterion) are shown, with their rankings in the full sample of 151,054 in parentheses. The probabilities that they would remain in the top six across repeated samples were computed using 1,000 bootstrap samples each for large, moderate, and small sample sizes.
The Weak Case for Situational Specificity
In agreement with Cucina et al. (Reference Cucina, Walmsley, Gast, Martin and Curtin2017), Macey and Bakker (Reference Macey and Bakker2012) argue that there is at best weak evidence for situational specificity of engagement drivers. However, they suggest that driver differences might emerge across cultural lines. By extension, differences would be expected in key driver weights across organizational boundaries if those boundaries reflect differences in cultural values. Such differences might clearly come into play in large, multinational organizations, justifying the use of multiple SKDAs. Arguably, this logic might extend to differences in employee preferences across gender, generational, or other lines, but we are not aware of evidence to this effect.
The Efficacy of Key Driver Analysis
The subjectivity in defining what is key and the requirements for relatively large samples might beg the question whether SKDA is worthwhile. We argue it is particularly so when considering the relative importance of new content (LeBreton et al., Reference LeBreton, Hargis, Griepentrog, Oswald and Ployhart2007). That is, past experience might suggest what the key drivers should be, but the inclusion of new content that reflects shifting priorities creates the opportunity to assess the relative importance of both new and old content.
Cucina et al. (Reference Cucina, Walmsley, Gast, Martin and Curtin2017) directly question the value of SKDA on the basis of analyses indicating that a subset of items chosen at random demonstrated validities nearly as high as items chosen on the basis of SKDA. In their analysis, they created two random samples of items, one of five and the other 10, and found validities only slightly lower than those found through stepwise regression. We believe the data lead to a different conclusion. We analyzed the 2008 data in a different way, comparing the R2 obtained using the most impactful drivers to the average of random sets of items of all potential 37 key drivers. Based on the three highest ranked items, the R2 for Q61 was .56 and the average of 1,045 correlations based on randomly selected sets of three items (without replacement) was .43 (SD = .05). The R2 for Q63 was 0.59 based on the highest six drivers, and the average of 1,032 correlations based on randomly selected sets of six items was .53 (SD = .02). In our view, the differences between the amount of variance accounted for by the top ranked drivers and the average random sets is meaningful, if modest, for both criteria.
Restriction in Range and Ceiling Effects
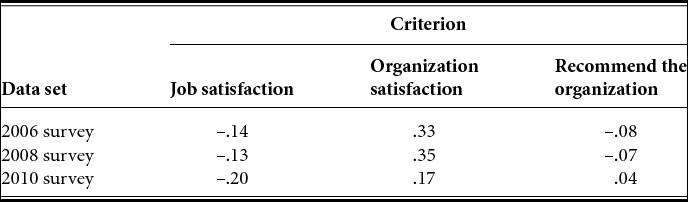
Cucina et al. (Reference Cucina, Walmsley, Gast, Martin and Curtin2017) demonstrate significant and positive correlations between driver weights and item standard deviations using organization satisfaction as a criterion. To extend their analysis, we computed correlations separately by criterion. These results are reported in Table 3. It can be seen that the correlation of key driver weights and item standard deviations varies across the three criteria. The average of the nine correlations was .03. Cucina et al. report a correlation of .51 between the item relative weights and standard deviations (SDs), whereas we obtained a correlation of 0.35. This difference can be attributed to the fact that we used only a subset (37 items) of those used by Cucina et al. Thus, the correlation reported by Cucina et al. between the bivariate correlations and item SDs was 0.62, yet among the 37 items used in our more restricted analyses was .45. On balance, based on the RWAs conducted with three separate criteria, it does not appear that restriction in range is influencing the results of key driver analysis.
Correlations Between Item Relative Weights and Item Standard Deviations
Correlations are for 37 items included in the RWA.
Further, it is true that an item with very low favorability will also have low variance. However, typical employee survey data are negatively skewed, and such is the case in the data analyzed here; the correlations between means and standard deviations for the 37 predictors described above averaged –.79 across the 2006, 2008, and 2010 data sets.
Recommendation
SKDA has evolved over the last 20 years, particularly as influenced by the literature on relative importance and in particular RWA. We encourage the use of SKDA within the context of a broader toolkit, with the particular caveats of sample size considerations, cross-sectional research, and cultural influences.
Our emphasis in this commentary has been on the application of RWA to SKDA. Interested readers will find the discussion on the limitations of RWA by Tonidandel and LeBreton (Reference Tonidandel and LeBreton2011) to be important, particularly regarding concerns over model misspecification. As one reviewer noted, uncertainty in model selection (Burnham & Anderson, Reference Burnham and Anderson2002) is often ignored in practice. We might extend that reviewer's comments to consideration of content misspecification errors, particularly errors of omission. Indeed, the very differences in analytic outcomes between those reported by Cucina et al. (Reference Cucina, Walmsley, Gast, Martin and Curtin2017) and what we presented here reflect how critical choices in survey content can be for the conversations we would have with clients regarding SKDA results.