


Introduction
Through various metamorphic processes a snowpack undergoes multiple transformations. With diurnal temperature fluctuations several heterogeneous features, i.e. melt–freeze crusts, ice layers, ice columns, ice lenses, root-like and finger-like features, may evolve within snow, causing significant changes in the snowpack structure. A layer of faceted crystals adjacent to a crust may form a weak layer within the snowpack that can affect snowpack stability. Reference McClung and SchaererMcClung and Schaerer (1993) stated that weak bonding is the most important crustal feature for avalanche formation. The failures leading to slab release may occur either within the faceted layer or between the faceted layer and the crust (Reference Colbeck and JamiesonColbeck and Jamieson, 2001). Reference Adams and BrownAdams and Brown (1983) described the mechanism for the development of a layer of faceted crystals over a crust. They monitored the growth of a layer of faceted crystals to enhanced temperature gradient across the snow layer adjacent to the crust. Reference Jamieson and JohnstonJamieson and Johnston (1997) and Jamieson and others (2001) observed a layer of faceted crystals over a crust that was the weak layer in many fatal avalanches in three different mountain ranges of western Canada. This weak layer formation has also been observed in the Greater Himalayan Range, India. A major slab avalanche occurred on 1 March 2006 near SASE’s A-113 avalanche site at Patsio, Greater Himalayan Range, due to the development of a faceted layer over a hard crust.
Crust evolution within a snowpack primarily depends on the generation of meltwater through absorption of solar energy, retention of meltwater by a particular layer of snow, prevailing refreezing conditions and the permeability of snow layers. During the percolation of water into snow, some of the water is checked against the water retention capacity of snow, and the water in excess of the water retention capacity is considered as runoff. Numerous authors (Reference Colbeck and AndersonColbeck and Anderson, 1982; Reference Coléou and LesaffreColéou and Lesaffre, 1998) have determined the irreducible water saturation of snow as nearly 7% of its pore volume. A detailed investigation by Reference Kapil and SatyawaliKapil and Satyawali (2008) on water retention capacity and irreducible water saturation for various snow types has shown the water retention property of snow decreasing with its ripening and aging. Reference Bøggild, Forsberg and ReehBøggild and others (2005) studied the effect of water retention on the evolution of ice sheets. A numerical model for meltwater retention in snow has also been developed by Reference Bøggild, Hellström and FrankensteinBøggild (2006) after analyzing the effect of temperature gradient and thermal properties on superimposed ice formations. Capillary forces are primarily responsible for liquid water retention in snow, which depends on structure and grain morphology. For quantitative examination of capillary effects in meltwater percolation through homogeneous snow, Reference ColbeckColbeck (1974) introduced a capillary pressure–saturation relationship, reporting that the effects of capillarity along the flow remain <10% of the total force and the rest is due to gravity flow.
At the snow surface, meltwater is produced due to absorption of long- and shortwave radiation; in addition, subsurface melting can occur due to penetration of shortwave radiation up to a certain depth. In a frequency-modulated continuous-wave (FM-CW) radar survey of a snowpack, Reference Koh and JordanKoh and Jordan (1995) reported subsurface melting up to a depth of 7–8cm from the snow surface, even under sub-zero temperature conditions. Reference Pfeffer and HumphreyPfeffer and Humphrey (1996) studied the heterogeneous location of water movement and ice-layer formation within sub-freezing snow. Reference BengtssonBengtsson (1982) evaluated the effects of sub-zero temperatures on the location of freezing fronts of meltwater in a snowpack. He showed that the propagation of meltwater occurs once the water saturation at any point exceeds the irreducible water saturation of snow. Reference Pfeffer and HumphreyPfeffer and Humphrey (1998) reported the formation of ice layers in the polar or subpolar glaciated snow mass due to initial subzero conditions as a combined effect of meltwater infiltration and refreezing of water within the snowpack. Reference ColbeckColbeck (1973) studied the effects of stratigraphic layers on water flow through snow, mentioning the diversion of flow across different textures of snow grains. Reference ColbeckColbeck (1991) reported that an icy layer of low permeability would probably block the upward movement of water vapour, so the vapour would be deposited beneath the crust, resulting in increased growth of faceted grains under the temperature gradient.
Thermal regime of a snowpack is one of the dominant influences on the evolution of a crust. The mechanism behind crust formation within the snowpack can be described by the way a freezing front develops during propagation of water waves. A ‘freezing front’ is actually an interface between frozen and wetted snow. If snow temperature remains below 0°C, refreezing occurs, resulting in grain growth and grain clustering. Consequently the effective pore volume decreases, thereby reducing the permeability of the snow layer. The reduced permeability will impede future water flow across the layer, and if the above processes continue for some time, an impermeable or semi-permeable crust will evolve within the snow.
In the present work, evolutions of ice crusts within a snowpack at Patsio are studied during the mid-winters of 2008 and 2009. To collect vertical profiles of water saturation within the snowpack, we used a parallel-probe saturation profiler (PPSP) device, developed by Reference Kapil, Prasher, Chasmai and SatyawaliKapil and others (2009). The effects of diurnal freeze-thaw processes on the evolution of the crusts are studied using the saturation profiles, as well as the manually observed snow stratigraphy. The three-dimensional (3-D) variation in percolation depth on a south-facing slope was also studied to understand the maximum percolation depth during mid-winter. Spatial variations in percolation depth are also studied on slopes of different aspects at the study site.
Study Area and Associated Climatic Conditions
In this work, three experimental sites were selected (Fig. 1a-c) near the SASE’s field research station at Patsio (32°45′14′′ N, 77°15′38′′ E; 3794 m a.s.l.). The aim behind the first experimental site (Fig. 1a) was to study the midwinter evolution of impermeable horizons within a seasonal snowpack as a result of freeze-thaw processes caused by diurnal temperature changes. The second experimental site (Fig. 1b) was selected to monitor 3-D variations in midwinter percolation depths in a seasonal snowpack, and the third site (Fig. 1c) was designed to study spatial variations in percolation depth on slopes of different aspect.
The study sites selected near the SASE’s field research station at Patsio (32°45′14″N, 77°15′38″ E): (a) experimental site to monitor the evolution of melt–freeze crusts; (b) a partially wet south-facing slope to monitor 3-D distribution of percolation depths; (c) terrain section with slopes of different aspects to study the spatial variations in percolation depth.

During winter, a south-facing slope (in the Northern Hemisphere) receives more solar radiation as compared to other slopes, so meltwater production would be maximum there. The first experimental site (Fig. 1a) is a south-facing slope with an approximate area of 840 m2 at an altitude of 3821 m. While collecting topographic information about the site before the onset of snowfall it was observed that the ground cover is composed of fine silt with gravels and small partially or fully buried boulders. The site remains snow-covered from November to May. Due to strong wind activity, snowdrifting frequently occurs in this region (see patterns in Fig. 1a).
To study the spatial variations in percolation depth, a partially wet south-facing area of 10 m × 10 m was selected, marked ABCD (Fig. 1b). The inclination of this site is ∼318. Total snow depth varied from 124 to 147 cm. The ground surface is smooth with a few small boulders. The elevation is 3790 m (near point A). The square ABCD was subdivided into smaller 2m × 2m cells, resulting in a total of 25 cells. Saturation profiles were collected in each corner of each cell. Since it is cumbersome work to collect hundreds of saturation profiles, it was not feasible to reduce the cell size below 2 m.
To monitor the spatial variations in maximum percolation depth on slopes of different aspects, an axis of 86 m total length was marked A′B′C′D′E′ (Fig. 1c), including the aspects north (N), south (S), northwest (NW) and south (S). The elevation near point A was 3808 m. The saturation profiles were collected along the line A′B′C′D′E′ with a spatial interval of 2 m. The ground surface was variable, smooth and rugged, and along the line there were two large boulders of approximate sizes 3.5 and 7.5 m. Total snow depth varied between 145 and 78 cm; on the boulders it decreased to 48 cm. Due to strong wind, snow distribution was uneven. Snow depth was maximum in the north aspect.
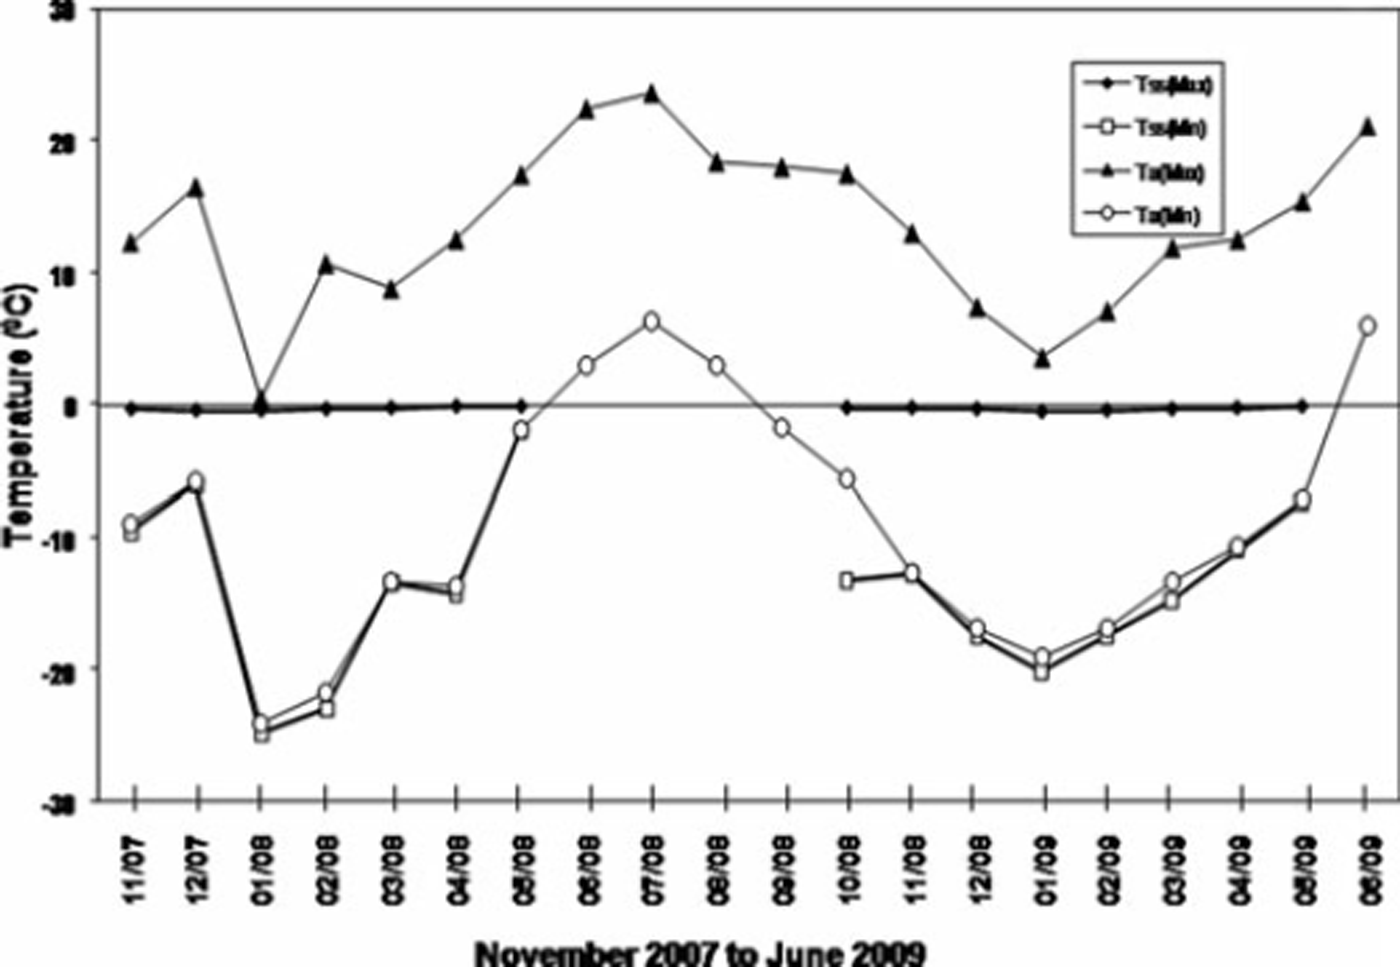
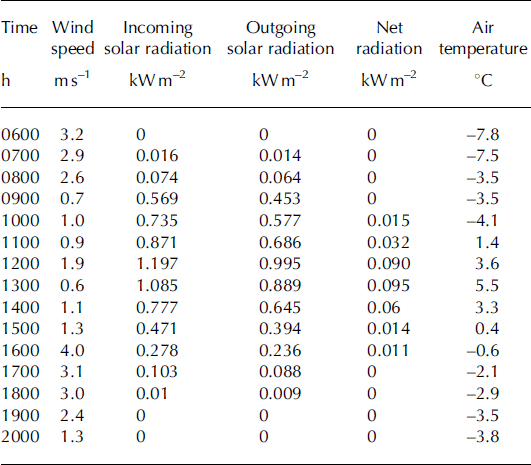
At the peak of winter, the minimum air temperature recorded in this region is –24°C, and for most of the day (approximately 16hours) air temperature remains below freezing point. Snow and air temperature data for the period November 2007 to June 2009 are presented in Figure 2. The maximum solar radiation (during clear sky conditions) was observed to vary between 910 and 1040Wm−2. Hourly variations (0600–2000 h) in incoming solar radiation, outgoing solar radiation, net radiation, wind speed and air temperature are presented in Table 1, for 25 February 2009. These data were collected by an automatic weather station (AWS) installed near the study area (Fig. 1a). The AWS includes a snowpack temperature profiler (array of thermistors), a pyranometer (0.30–3.0 μm), a net radiometer (0.20–40.0mm), a wind-speed and wind-direction sensor (anemometer), a snow surface temperature sensor (IR sensor), a snow height sensor (ultrasonic sensor) and a humidity sensor. Average wind speed in this area is high (7ms−1). After 3 days of continuous snowfall from 22 to 24 February 2009, clear sky prevailed, so we carried out the studies from 25 February 2009 onwards. The peak incoming solar radiation and wind speed on 25 February 2009 were 1197Wm−2 and 4.0 ms−1, respectively. The climatic conditions pertinent to the study area (intense solar radiation, subfreezing temperatures and strong winds) are very conducive to the formation of melt–freeze crusts inside the snowpack. Table 1. Hourly values of the meteorological conditions at Patsio on 25 February 2009 (0600–2000h) as shown in Figure 2a
Maximum and minimum values (monthly average) of air temperature T a and snow surface temperature T ss for the period November 2007 to June 2009. No data are shown for T ss(max) and T ss(min) from April 2008 to October 2008, as the site was then snow-free.
Hourly values of the meteorological conditions at Patsio on 25 February 2009 (0600–2000 h) as shown in Figure 2a
Experimental Method
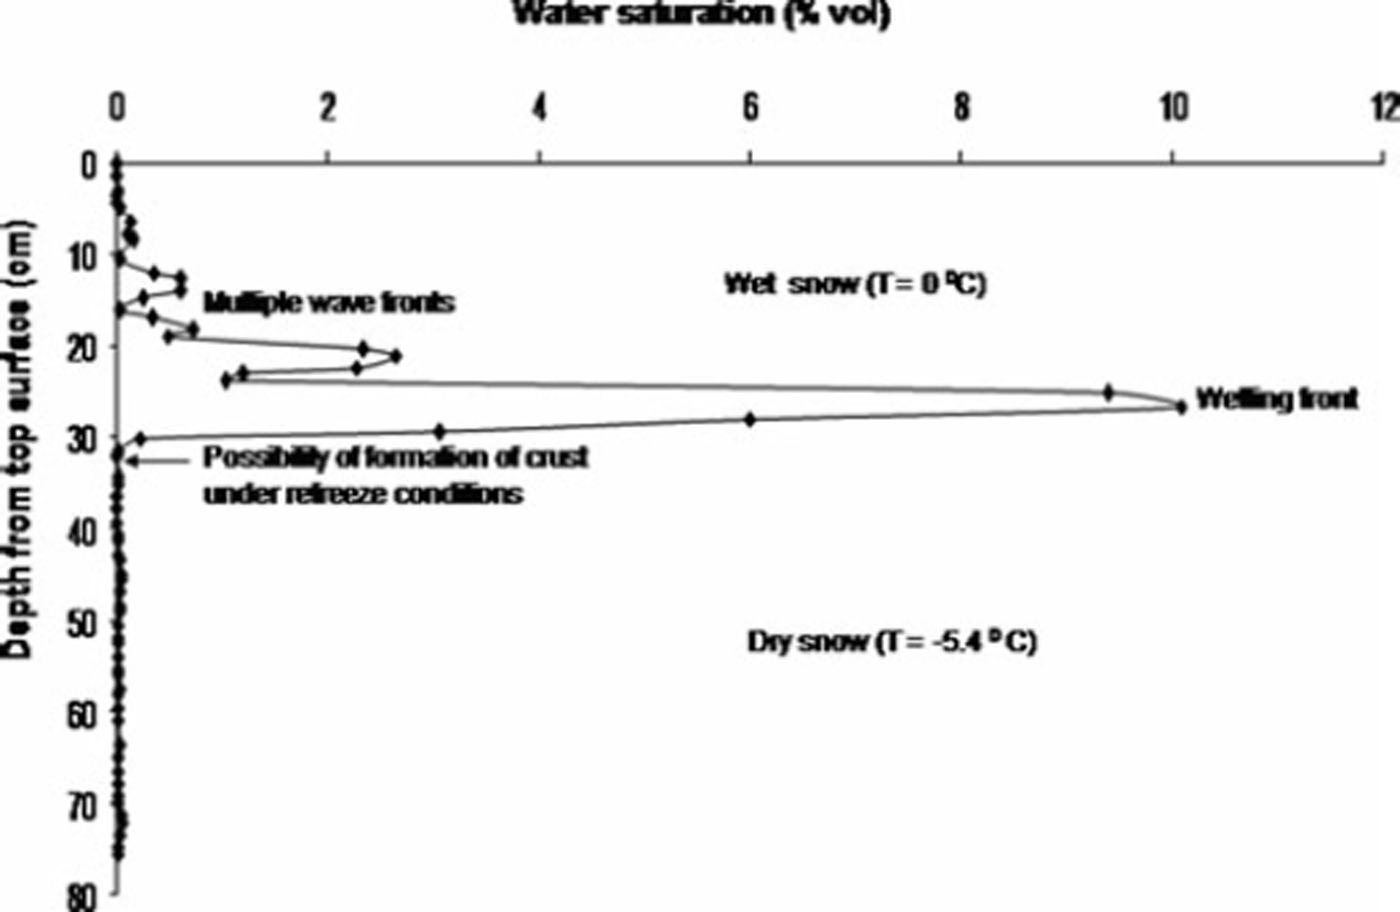
For precise measurement of the water saturation at different depths in the snowpack, we used a PPSP device developed by Reference Kapil, Prasher, Chasmai and SatyawaliKapil and others (2009), a largely non-destructive method for measuring water saturation. Figure 3 shows the PPSP mounted over the snow cover at Patsio. The basic principle behind the development of this device utilizes the polar nature of the water molecule to detect water saturation. When a specimen containing liquid water is kept under the action of an external electric field, its molecules tend to orient in the direction of the applied electric field, from their initial random directions, and during this process some energy is absorbed by the molecules from the applied field. The energy absorbed is thus proportional to the liquid water content and, correspondingly, to the water saturation of the sample. Details of the device, which has been tested for a variety of snow conditions, can be found in Reference Kapil, Prasher, Chasmai and SatyawaliKapil and others (2009). The accuracy of the PPSP is ±2.8%. Its maximum penetration capacity is about 130 N, so it can penetrate most of the melt–freeze or thin ice crusts formed within a snowpack. A typical saturation profile recorded by the PPSP is shown in Figure 4. This profile was collected from a partially wet snow cover at Patsio during March 2008. It provides insightful information on water wave propagation inside a snowpack, accompanying multiple wave fronts and a wetting front, as described by Reference ColbeckColbeck (1975).
The PPSP device used to record the water saturation profiles.

A typical saturation profile recorded with the PPSP from a partially wet snow cover at Patsio.
Results and Discussion
In our present investigation, a partially wet snow cover (Fig. 1a) was selected to monitor the evolution of melt–freeze or ice crusts in relation to the vertical distribution of meltwater as recorded by the PPSP. After a snowfall period from 22 to 24 February 2009 with height of new snow 29 cm, clear sky conditions prevailed on 25 February 2009 and the following days. Due to absorption of solar radiation during daytime, sufficient melting occurred within the snow, and meltwater saturation profiles were recorded at 1515 h, before refreezing started. Even under the same aspect or inclination conditions, the surface melting of a snowpack was not uniform due to variations in the absorption patterns of snow having microscopic changes in its composition, causing non-uniform localized heating. In Figure 1a, greyish patches (darker shades) indicate areas with surface melting, whereas whitish patches (light shades) indicate areas without surface melting.
On 25 February 2009 the solar radiation was intense (1197 W m−2), wind speeds were moderate (2–4 m s−1), minimum air temperature and snow surface temperature were –7°C and –11°C, respectively, and ground temperature was close to 0°C (Table 1; Fig. 5). It is also clear from Figure 5 that after 1515 h air temperature dropped below 0°C, significantly reducing the temperature across the snowpack.
Quarter-hourly values of snow surface temperature T ss, air temperature T a, ground temperature T g and snow temperature T s at different depths within the snowpack (10, 20, 40, 60, 80 and 100 cm) measured by AWS at Patsio on 25 February 2009.
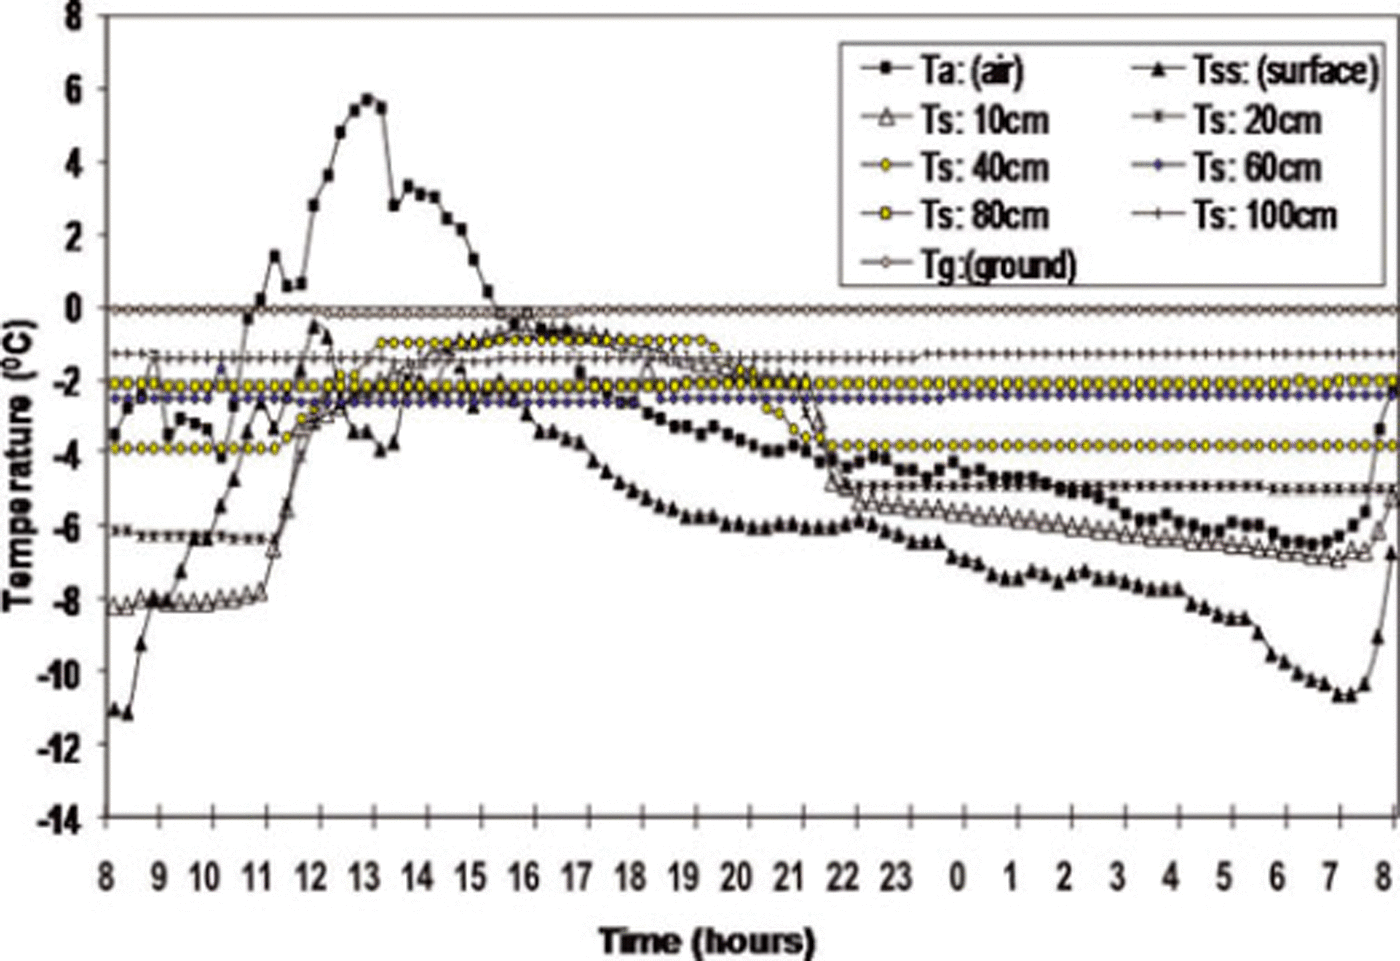
As a result of the absorption of solar radiation, the surface as well as the subsurface melting occurred within the snowpack. The meltwater thus generated within the snow started percolating downwards, but after 1600 h snow temperatures fell rapidly. Snow surface temperature decreased to –5.7°C by 1845 h and was –10.6°C by the next morning (0700 h). Due to sub-freezing night-time temperatures within the snowpack, the meltwater held by the snow started refreezing to form crusts, followed by the development of a freezing front, as discussed above.
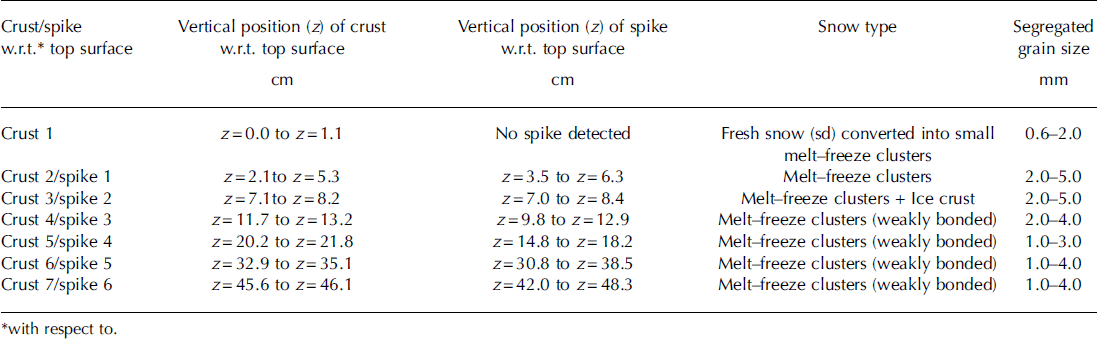
To verify crust evolution within the snowpack, manual observation of snow stratigraphy was conducted on the next day (26 February 2009) at 0700h (before the onset of the next melt–freeze cycle) (Table 2). A comparison between the saturation profile recorded after a thaw cycle (and before a refreeze cycle) and the actual layer structure as observed after the refreeze cycle is shown in Figure 6a. Six saturation spikes (abrupt increases in saturation) are shown, at depths of 6.3 cm (spike 1), 7.7 cm (spike 2), 9.8 cm (spike 3), 16.1 cm (spike 4), 32.2 cm (spike 5) and 43.4 cm (spike 6). These spikes indicate the development of semi-permeable or impermeable crusts within the snowpack. Once a freezing front develops near the interface of the wet and dry snow (under sub-zero temperature conditions), the growth of a crust occurs, with decreased water permeability across it, causing meltwater accumulation over it that increases the water saturation of snow in the vicinity above this crust.
Positions within the snowpack and characteristics of the crusts as observed manually
(a) Comparison between the positions of the manually identified crusts (left) and the saturation spikes observed in the saturation profile (right), immediately after the first melt cycle and before a refreeze cycle on 25 February 2009. (b) Ram resistance profile after the refreeze cycle. (c) Positions of the crusts and the saturation spikes collected immediately after the second melt cycle (26 February 2009).

After the refreeze cycle, the manual observation revealed seven crusts (Fig. 6a, left). The depth positions of the crusts (with respect to the top surface) were 0–1.1 cm (crust 1), 2.1–5.3 cm (crust 2), 7.1–8.2 cm (crust 3), 11.7–13.2 cm (crust 4), 20.2–21.8 cm (crust 5), 32.9–35.1 cm (crust 6) and 45.6–46.1 cm (crust 7). Comparing the depth positions of the saturation spikes and those of the crusts (Fig. 6a) suggests good one-to-one correspondence between spikes 1–6 and crusts 2–7, respectively. No saturation spike was observed in the saturation profile corresponding to crust 1 (top layer). The topmost layer was probably frozen due to cooling caused by wind before the saturation profile was collected. Figure 4 suggests that there was a significant amount of melt as detected by the PPSP (evident from saturation spikes) below the snow surface, although snow temperatures were well below freezing. Subsurface melting of snow at subfreezing temperatures must have been primarily due to significant melt generated by the penetration of intense shortwave radiation into the snowpack (Reference Koh and JordanKoh and Jordan, 1995). In the comparative analysis of Figure 6a, there is a small shift in the positions of spike 4 and crust 5, due to further downward movement of the wetting front which continued after the saturation profile was collected. Once the refreeze cycle started, the freezing front also propagated downward (with respect to the snow surface interfaced with surrounding air at some finite speed. The freezing front pursued the wetting front until overtaking it to form a crust. In the case of spike 5, still further downward movement of the wetting front occurred after the saturation profile was recorded, increasing the thickness of crust 6 to 22 mm. However, in the case of spike 6 (crust 7), further downward movement of the wetting front may have occurred even after the saturation profile was recorded, and water may have drained non-uniformly through preferential flow channels so that it did not contribute to the crust thickness.
To measure the penetration resistance of these crusts, a ram penetration profile was collected at the study site (Fig. 6b). The maximum penetration resistance corresponded to crusts 2 and 3. The ram resistance decreased continuously from crust 4 to crust 7, in agreement with their granular composition (Table 2) having weakly bonded melt–freeze clusters. The underlying crusts consisted of well-bonded and weakly bonded melt–freeze clusters including the ice layer. In the surface layer, there was a thin (∼1 mm) sun crust generated from new snow crystals under intense solar radiation coupled with wind-induced cooling on the snow surface.
The saturation profile was also recorded immediately after the second melt cycle on 26 February 2009 (Fig. 6c). Results indicate that saturation spike 3 as shown in Figure 6a did not exist (Fig. 6c) and generally lower saturation values were recorded except for saturation spike 1 where higher saturation occurred. These observations suggest that crust 1 (corresponding to spike 1) transformed into an impermeable crust, so that most of the meltwater was accumulated above the crust, hindering further infiltration. Therefore, saturation values above the crusts deeper in the snowpack decreased significantly. Since the growth of any crust is directly proportional to the water content before refreezing, maximum growth should be in crust 2 as compared with the other underlying crusts. Also, the ablation from crust 1 is larger than that from the underlying crusts because of the direct interaction of this crust with solar radiation and wind.
Three-dimensional variations in percolation depths were studied for a 10m × 10m area selected on a south-facing slope on 13 March 2008. Maximum percolation depths were estimated from saturation profiles collected by the PPSP. A maximum of three melt–freeze layers was recorded. The surface plot corresponding to the percolation depth within the square ABCD (Fig. 1b) is shown in Figure 7. In our observations the percolation depths were larger towards the CD side than towards the AB side. The average percolation depth during the second week of March 2008 varied between 13 and 29cm.
Surface plot of the maximum percolation depth on a south-facing slope (study site as shown in Fig. 2b).
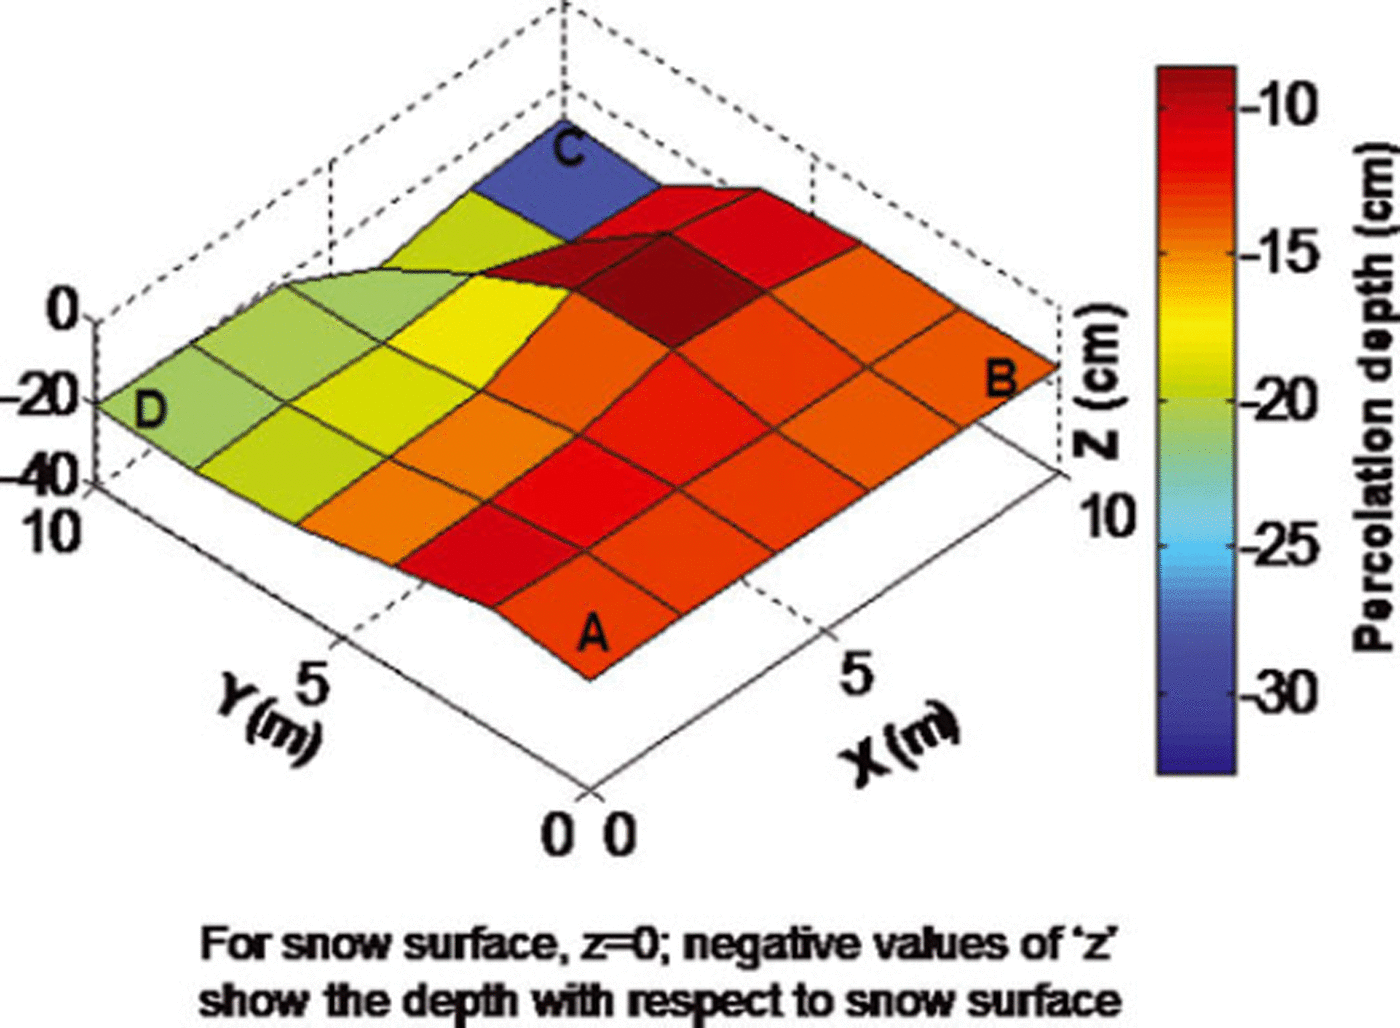
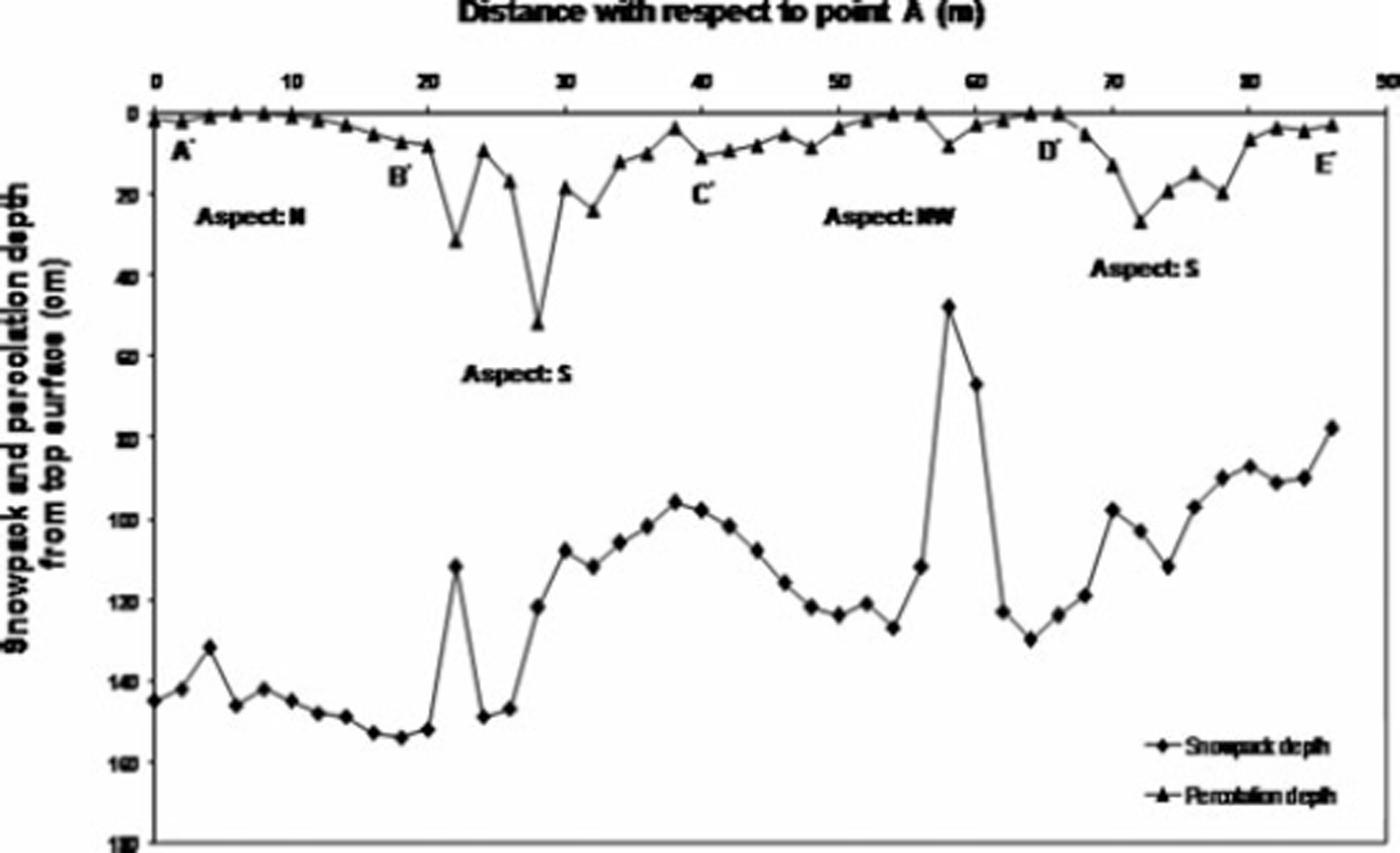
Figure 8 shows percolation depth (derived from saturation profiles) along the line A′B′C′D′E′ (Fig. 1c) covering different aspects relative to snowpack depth. We also measured air temperature and snow surface temperatures at this site during the experimental work. The air temperature was +5.6°C and the snow surface temperatures on the various aspects were –0.9°C (S), –2.7°C (N), –1.8°C (NW) and –1.1°C (S). The average maximum percolation depths along the axes A′B′ (aspect: N), B′C′ (aspect: S), C′D′ (aspect: NW) and D′E′ (aspect: S) were 1.6, 17, 3.6 and 11 cm, respectively. Between B′C′ and C′D′, two large buried boulders with approximate sizes of 3.5 m (boulder 1) and 7.5 m (boulder 2) were manually identified after recording the saturation profiles. The two humps in the curve as shown in Figure 8 correspond to these boulders. The not surprisingly larger percolation depth found on southerly slopes means that the degree of heterogeneity due to melt–freeze action within a snowpack should be largest on south-facing slopes.
Spatial variations in percolation depth relative to snowpack depth along a line across slopes of different aspects (study site as shown in Fig. 2c).
Conclusions
Crusts frequently evolve within the snowpack of the Greater Himalayan region. The primary ingredients for the development of a crust are the availability of free water through melting of snow or infiltration of rainwater, the retention of water by a particular snow layer, preferential flow paths characterized by snow microstructure, and prevailing subzero snow temperatures.
Using a PPSP device we studied the evolution of crusts, due to diurnal effects of melting and freezing, in a snowpack at Patsio immediately after a snowfall. The saturation spikes observed in the saturation profiles, collected immediately after the first melt cycle, agreed well with the evolution of melt–freeze or ice crusts as identified by a snow profile manually observed the morning after the overnight refreeze cycle. A good one-to-one correspondence between the positions of saturation spikes and the actual crusts formed within the snowpack suggests that the PPSP can be used as a non-destructive method to predict or locate crusts within a snowpack. Three-dimensional variations in maximum percolation depth were estimated from regularly spaced saturation profiles, suggesting significant differences in percolation depth on a given slope. Measurements along an axis with various aspects showed percolation depth to be largest on south-facing and smallest on north-facing slopes, in agreement with the predominant driver of meltwater production: solar radiation.
Acknowledgements
We are profoundly grateful to A. Ganju for his consistent encouragement to carry out this work. We also extend cordial thanks to P. Singh and Y. Tamgadge for their support during the stratigraphic survey of snowpack at Patsio. We also thank S. Patel and P. Ranjan for support during the field observations and stratigraphic work. We cordially acknowledge J. Schweizer, E. Adams and two anonymous reviewers for their critical suggestions to shape the manuscript into the present form.



