

1. Introduction
Silicic (granitic and rhyolitic) rocks are found in most continental flood basalt (CFB) provinces of the world, sometimes in volumetrically significant amounts. Notable volumes of rhyolite, for example, occur in the Karoo and Paraná CFB provinces (e.g. Cleverly et al. Reference Cleverly, Betton, Bristow and Erlank1984; Garland et al. Reference Garland, Hawkesworth and Mantovani1995) and in the Snake River Plain ‘hotspot track’ associated with the Columbia River CFB province (e.g. Ellis et al. Reference Ellis, Wolff, Boroughs, Mark, Starkel and Bonnichsen2013). The Deccan Traps CFB province of India, though poor in silicic rocks overall, has significant concentrations of these rocks in its western and northwestern parts, along the western Indian rifted margin. As in many other rifted-margin CFB provinces like the Karoo (Melluso et al. Reference Melluso, Cucciniello, Petrone, Lustrino, Morra, Tiepolo and Vasconcelos2008), silicic magmatism in the Deccan generally postdates thick flood basalt sequences (e.g. Sheth & Melluso, Reference Sheth and Melluso2008; Owen-Smith et al. Reference Owen-Smith, Ashwal, Torsvik, Ganerød, Nebel, Webb and Werner2013; Sheth & Pande, Reference Sheth, Pande, Sheth and Vanderkluysen2014; Shellnutt et al. Reference Shellnutt, Yeh, Suga, Lee, Lee and Lin2017).
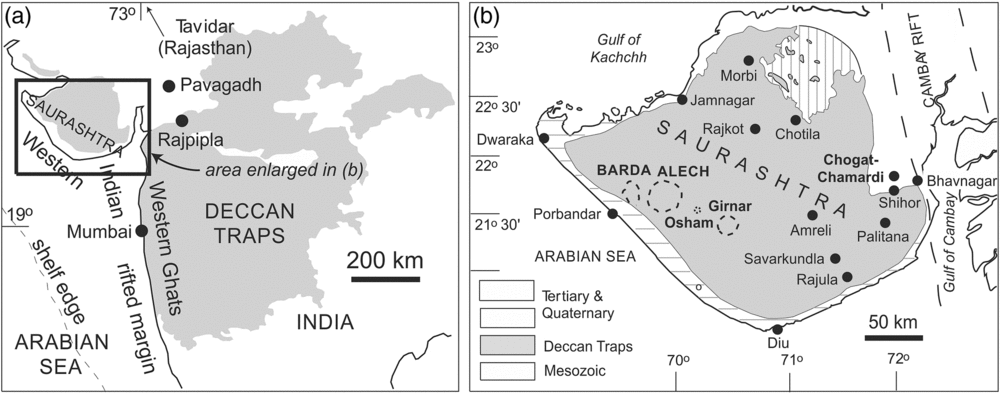
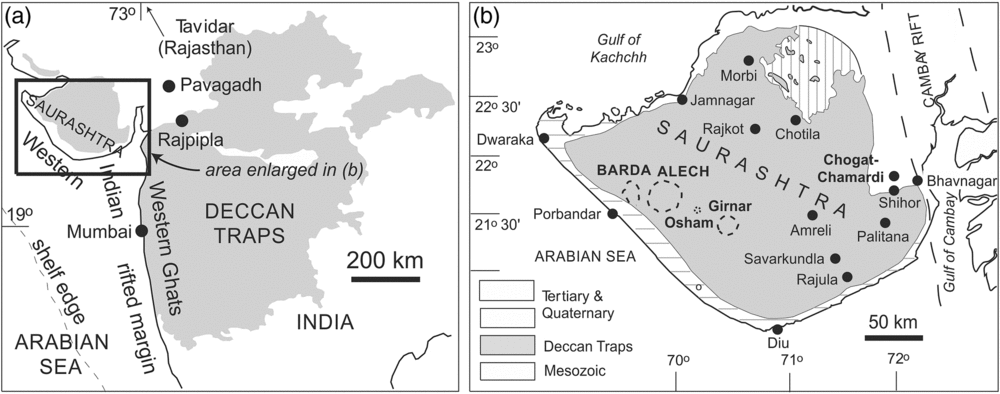
The Barda Hills (dominantly composed of granophyre) and Alech Hills (dominantly rhyolite) in Saurashtra, NW Deccan Traps, form the largest silicic complexes in the entire province (Fig. 1a, b). Each complex covers several tens of kilometres in diameter. Yet there has been no focused study of the Barda complex since those by Dave (Reference Dave1971) and De & Bhattacharyya (Reference De and Bhattacharyya1971), and almost no geological, petrological or geochemical information on the Alech complex is available in the otherwise vast Deccan Traps literature. The petrogenesis of silicic rocks in CFB provinces is a topic of considerable interest, and we have carried out a mineralogical and geochemical–isotopic study of select Barda–Alech silicic rocks to understand their petrogenetic evolution. We have also dated, by the 40Ar–39Ar incremental heating technique, three of the Barda granophyres. The combined results show that the silicic rocks are products of fractional crystallization of early basaltic magmas, with little or no input from pre-existing crust, and, in contrast to the general observation in CFB provinces, the Barda granophyre plutons significantly pre-date the main (66–65 Ma) Deccan CFB eruptions.
Simplified geological maps of the Deccan Traps (a) and of Saurashtra (b), with the important central complexes and locations in Saurashtra marked (after De, Reference De, Subbarao and Sukheswala1981; Misra, Reference Misra, Subbarao and Sukheswala1981).
2. Geological background
The large (present-day areal extent 500,000 km2) Deccan Traps CFB province in west-central India is made up of flat-lying flood tholeiite lavas reaching a stratigraphic thickness of 3.5 km in the Western Ghats escarpment (Fig. 1a). The Saurashtra peninsula in the NW part of the Deccan province, also covered by the Deccan lavas, is nearly flat and low-lying, with few thick vertical sections through the lavas and its coastal fringes covered by Tertiary or Quaternary limestones and alluvium. However, special features of Saurashtra’s Deccan geology, noted for a long time, include several volcano–plutonic complexes (e.g. Fedden, Reference Fedden1884; Adye, Reference Adye1914; Mathur et al. Reference Mathur, Dubey and Sharma1926; Auden, Reference Auden1949), a great range of rock types including primitive picrites (e.g. Krishnan, Reference Krishnan1926; Chatterjee, Reference Chatterjee1932; West, Reference West1958; Krishnamacharlu, Reference Krishnamacharlu1972; Krishnamurthy & Cox, Reference Krishnamurthy and Cox1977), and an abundance of rhyolite and granophyre (e.g. Dave, Reference Dave1971; De & Bhattacharyya, Reference De and Bhattacharyya1971; Subba Rao, Reference Steiner, Jahns and Luth1971; De, Reference De, Subbarao and Sukheswala1981; Chatterjee & Bhattacharji, Reference Chatterjee and Bhattacharji2001). A large ring dyke of granophyre or silicic porphyry cuts the gabbro–diorite–monzonite plutonic complex of Mount Girnar (1117 m, Fig. 1b; Mathur et al. Reference Mathur, Dubey and Sharma1926). Osham Hill (314 m) to the NW of Mount Girnar exposes flows of rhyolite and pitchstone capping tholeiitic flows. These silicic rocks show spectacular flow layering and flow folding (Wakhaloo, Reference Wakhaloo1967; Sheth et al. Reference Sheth, Choudhary, Cucciniello, Bhattacharyya, Laishram and Gurav2012) and appear to represent rheomorphic, lava-like ignimbrites.
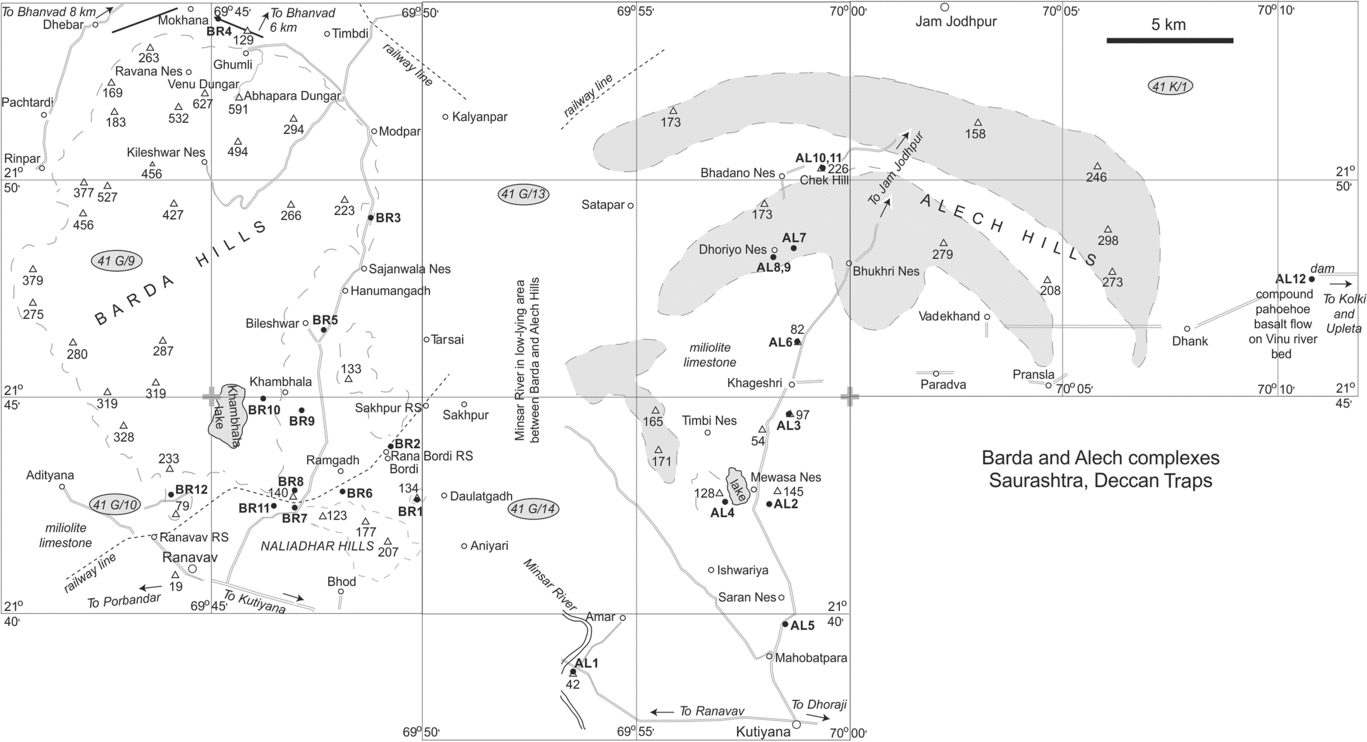
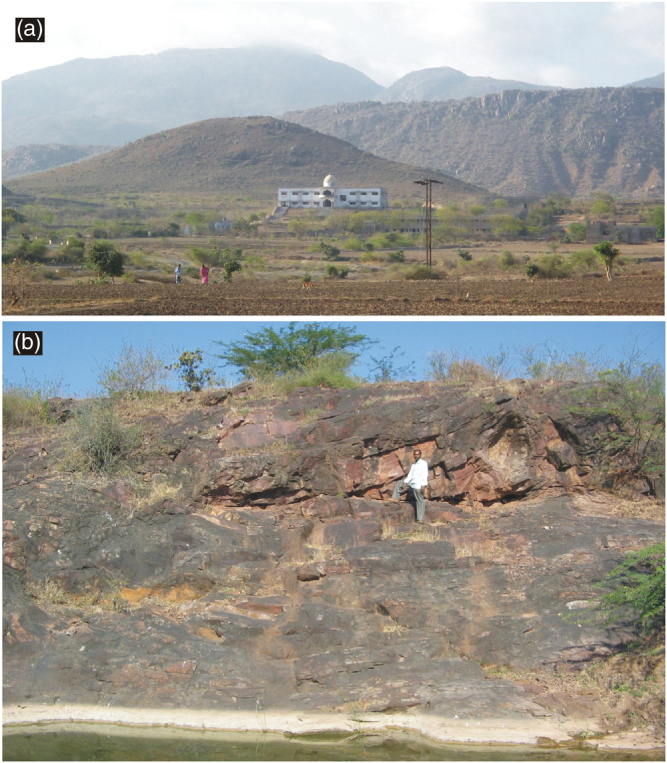
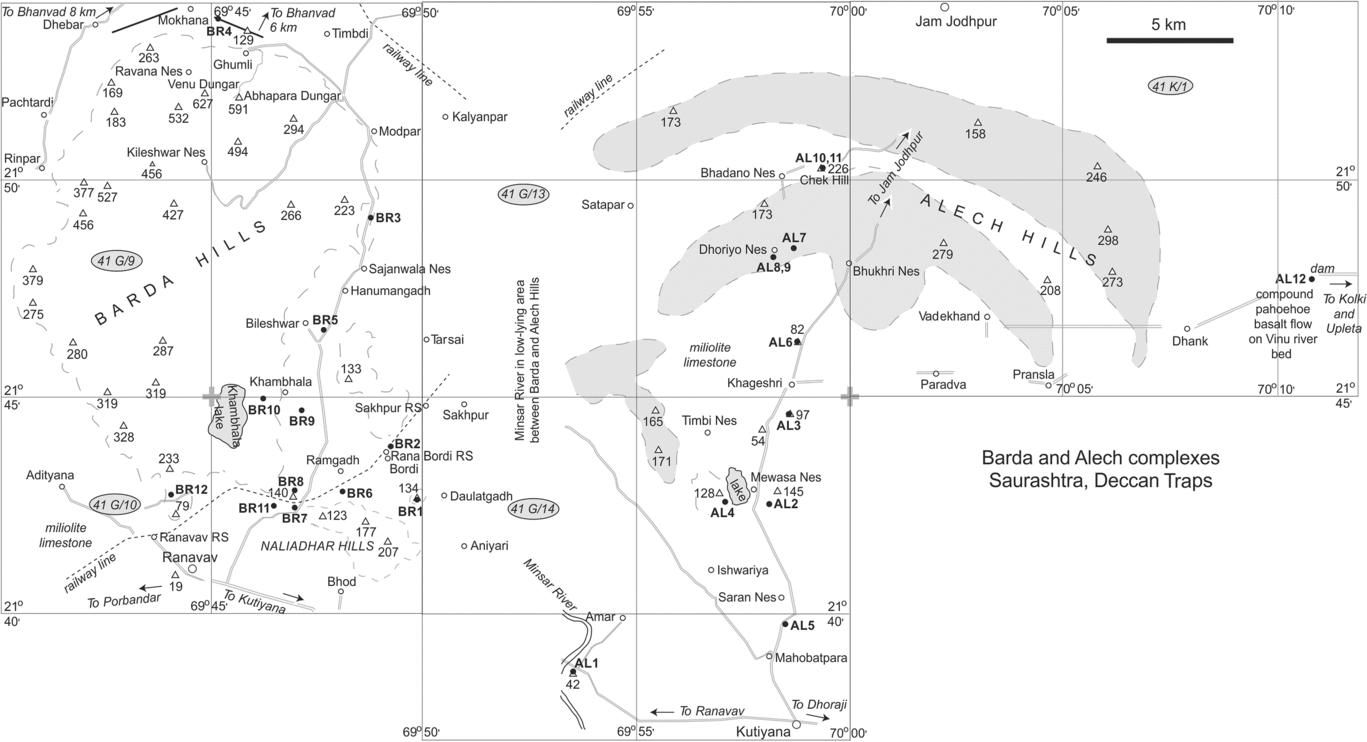
The Barda Hills, near Porbandar town on the Arabian Sea and composed dominantly of granophyre, reach a substantial height of 627 m above mean sea level (amsl) (Figs. 2 and 3a). There are many individual granophyre stocks emplaced through low-lying basaltic lava flows (Dave, Reference Dave1971; De & Bhattacharyya, Reference De and Bhattacharyya1971). Barda granophyres generally form rounded and massive outcrops and are intruded by mafic dykes in the northern parts (e.g. BR4, Fig. 2). The peripheries of the Barda Hills are occupied by the Quaternary-age Miliolite Limestone (e.g. Lele, Reference Lele1973; Marathe et al. Reference Marathe, Rajaguru and Lele1977) which provides raw material for cement factories in the area.
Topography and localities in the Barda and Alech complexes, Saurashtra, with the sample locations marked. Numbers within grey ellipses are the numbers of the Survey of India topographic sheets of 1:50,000 scale, and numbers near triangles are the elevations of points above mean sea level.
Field photographs showing (a) imposing landscape of the granophyre hills near Porbandar, Barda complex. Building and farmers provide a scale. (b) Flow folding in brown Alech rhyolite (sample AL7) near Dhoriyo Nes. Person provides a scale.
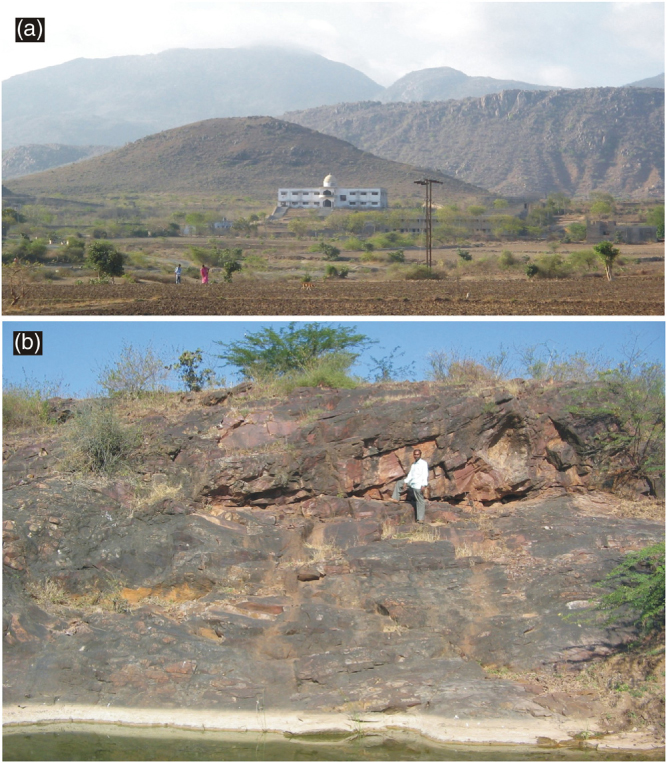
In comparison, the Alech Hills, dominantly composed of rhyolites, form a series of low (∼150–298 m amsl) and distinctly arcuate to concentric hill ranges whose intervening depressions are also covered by Miliolite Limestone. Few exposed sections across these ranges are available. Misra (Reference Misra, Subbarao and Sukheswala1981) has considered these arcuate hill ranges to represent ring dykes. However, we have observed a small outcrop of volcanic tuff 2 km north of Khageshri village, near the centre of the ring complex (Fig. 2). More suggestively, the rhyolite just east of Dhoriyo Nes hamlet (sample AL7, Fig. 2) shows large-scale flow layering and flow folding (Fig. 3b), and may be a rheomorphic, lava-like ignimbrite. If so, the Alech Hills rhyolites may represent large-scale ring-fracture lavas and lava-like ignimbrites like those erupted from calderas of the Snake River Plain (e.g. Coble & Mahood, Reference Coble and Mahood2012). The Alech rhyolites are cut by dark-coloured silicic dykes such as AL4 and AL11 (Fig. 2).
3. Petrography
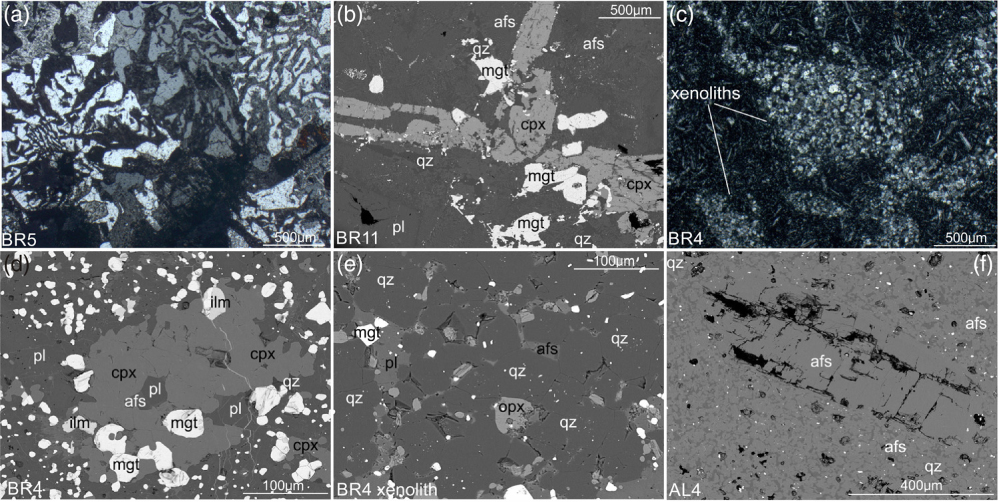
The Barda granophyres (samples BR1, 2, 3, 5, 6, 7, 8, 9, 10, 11, 12) are fine- to medium-grained rocks. They exhibit well-developed granophyric texture (Fig. 4a). Some of the samples are porphyritic (e.g. BR3). The rocks are made up of alkali feldspars (often perthitic, and generally making up 50–70 % of the rock), quartz (subhedral to anhedral, making up 20–30 % of most samples), minor plagioclase, and Fe–Ti oxides. Clinopyroxene grains have been observed in some samples (BR3, BR7, BR11, BR12; Fig. 4b). Accessory minerals are zircon, baddeleyite, titanite and fluorite. De & Bhattacharyya (Reference De and Bhattacharyya1971) observed Fe-rich olivine and ferroaugite in some of the granophyres.
Photomicrographs and backscattered electron (BSE) images of the Barda and Alech rocks. (a) Granophyre BR5 with typical granophyric intergrowths of quartz and alkali feldspar (crossed nicols). (b) Granophyre BR11 with alkali feldspar, quartz, plagioclase, clinopyroxene and magnetite (BSE). (c) Basaltic andesite dyke BR4 with crustal basement xenoliths (crossed nicols). (d) Groundmass of dyke BR4 with clinopyroxene, plagioclase, orthopyroxene, quartz, magnetite and ilmenite (BSE). (e) Granoblastic-polygonal texture (with quartz, orthopyroxene, plagioclase, alkali feldspar and magnetite) in quartzite basement xenolith in dyke BR4 (BSE). (f) Rhyolite AL4 with alkali feldspar microphenocryst in a groundmass of alkali feldspar and quartz (BSE). Mineral names have been abbreviated as follows: afs, alkali feldspar; cpx, clinopyroxene; opx, orthopyroxene; qz, quartz; mgt, magnetite; ilm, ilmenite; plag, plagioclase.
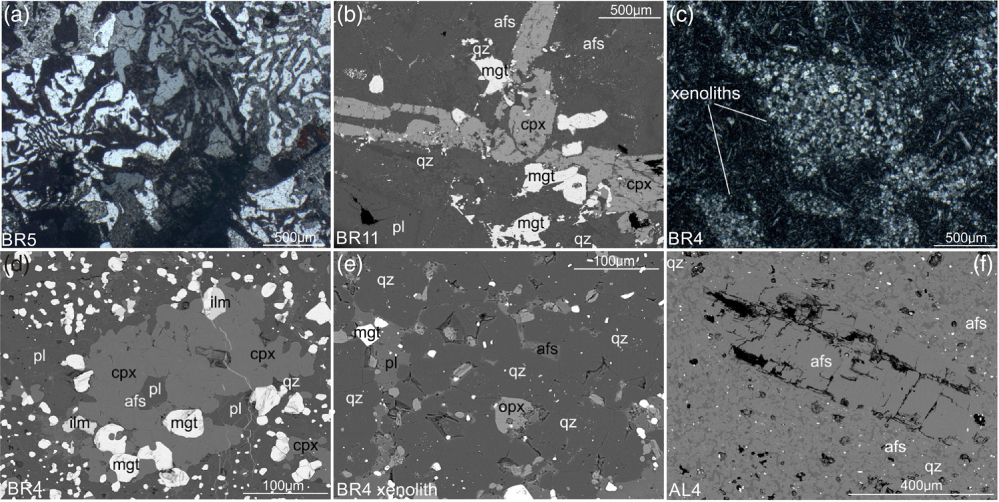
Basalt and dolerite dykes in the Barda Hills, with phenocrysts of olivine, plagioclase (often forming glomeroporphyritic aggregates) and clinopyroxene set in a groundmass of plagioclase, clinopyroxene and glass, have been reported by Dave (Reference Dave1971). A basaltic andesite dyke exposed to the north of Ghumli village (Fig. 2; our sample BR4) consists of plagioclase phenocrysts set in a fine-grained groundmass with plagioclase, clinopyroxene, orthopyroxene, quartz, alkali feldspars and opaque oxides (Fig. 4c, d). Centimetre-size quartzite xenoliths containing quartz (mode 90 %), plagioclase, orthopyroxene, alkali feldspars and magnetite, and with a granoblastic–metamorphic texture (Fig. 4c, e), are found in the dyke BR4. They may be samples of the Precambrian basement crust under Saurashtra. This is the first reported occurrence of basement xenoliths in the Deccan Traps of Saurashtra, though zircon xenocrysts from Precambrian crust are known in some Rajula silicic dykes (Chatterjee & Bhattacharji, Reference Chatterjee, Bhattacharji, Sheth and Pande2004).
De & Bhattacharyya (Reference De and Bhattacharyya1971) reported monzodiorite (showing a hypidiomorphic texture with plagioclase, clinopyroxene, quartz, Fe–Ti oxides and apatite) ∼3 km northwest of Sajanwala Nes (Fig. 2), and small dykes of aplite west of the Naliadhar Hills in the southern part of the Barda Hills (Fig. 2). The aplites consist of anhedral equigranular quartz and alkali feldspar (commonly in a micrographic intergrowth), opaque oxides, aegirine, and traces of riebeckite. Dave (Reference Dave1971) and De & Bhattacharyya (Reference De and Bhattacharyya1971) also reported amphibole (riebeckite) in some Barda samples, though no primary hydrous phases are observed in our Barda (and Alech) rock samples.
The Alech rhyolites and dacites (samples AL1, 2, 4, 5, 7, 8, 9, 10, 11) are aphyric to weakly porphyritic (up to 10 % phenocrysts). Alkali feldspar is a common phenocryst phase (Fig. 4f). Quartz occurs as phenocryst or microphenocryst in rhyolite AL9 with a fine-grained groundmass of quartz, alkali feldspars, magnetite, monazite and fluorocarbonates. Many Alech samples are visibly altered in hand specimen and under the microscope; the alteration ranges from slight alteration of alkali feldspar phenocrysts to complete replacement of alkali feldspars and mesostasis by clay, zeolites, quartz and calcite. Magnetite is partially replaced by red oxides or oxyhydroxides.
4. Analytical methods
4.a. Mineral chemical analyses
Seven rock samples from the Barda complex and nine from the Alech complex were chosen for mineral chemical analysis. Mineral compositions in the mafic rocks were determined at the University of Naples, using an Oxford Instruments Microanalysis Unit equipped with an INCA X-act detector and a JEOL JSM-5310 microscope in energy-dispersive spectrometry (EDS). The standard operating conditions included a primary beam voltage of 15 kV, filament current of 50–100 μA and variable spot size from 30,000 to 200,000× magnification, 20 mm WD. Measurements were made with an INCA X-stream pulse processor and with Energy software. Energy uses the XPP matrix correction scheme developed by Pouchou & Pichoir (Reference Pouchou, Pichoir and Newbury1988), and the pulse pile-up correction. The quant optimization is carried out using cobalt (FWHM – full width at half maximum peak height – of the strobed zero = 60–65 eV). The following standards were used for calibration: diopside (Ca), San Carlos olivine (Mg), anorthoclase (Al, Si), albite (Na), rutile (Ti), fayalite (Fe), Cr2O3 (Cr), rhodonite (Mn), orthoclase (K), apatite (P), fluorite (F), barite (Ba), strontianite (Sr), zircon (Zr, Hf), synthetic Smithsonian orthophosphates (REE, Y, Sc), pure vanadium, niobium and tantalum (V, Nb, Ta), Corning glass (Th and U), sphalerite (S, Zn), galena (Pb), sodium chloride (Cl) and pollucite (Cs). The Kα, Lα or Mα lines were used for calibration, according to the element. Backscattered electron (BSE) images were obtained with the same instrument (Fig. 4b–f). The mineral analyses are reported in Tables 1–4 and plotted in Figure 5.
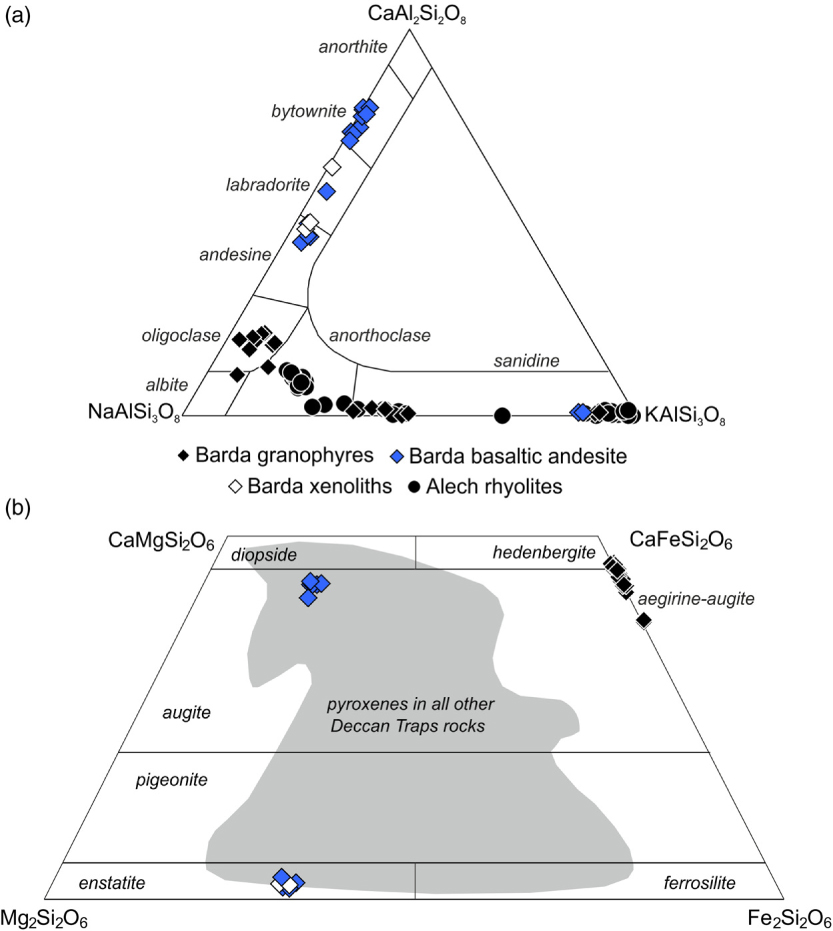
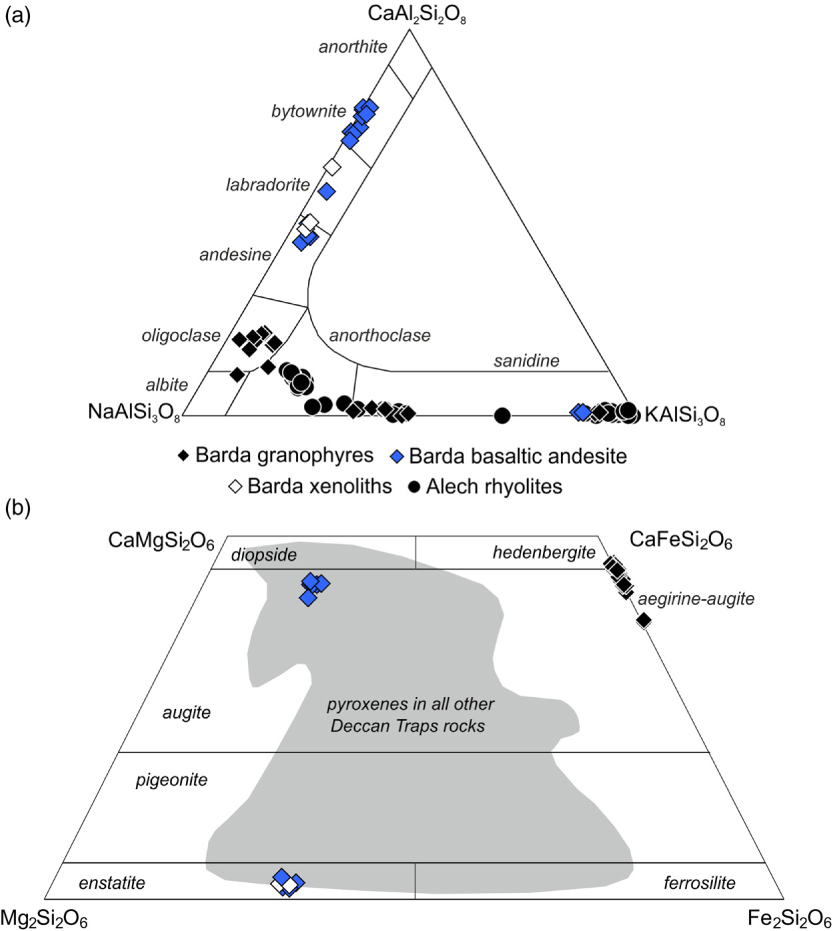
Mineral compositions. (a) Feldspar compositions observed in the Barda and Alech rocks. (b) Pyroxene compositions of Barda–Alech rocks projected in the Ca–Mg–Fe quadrilateral. Grey shaded field contains pyroxene analyses for all analysed Deccan rocks taken together (Cucciniello et al. Reference Cucciniello, Demonterova, Sheth, Pande and Vijayan2015 and references therein).
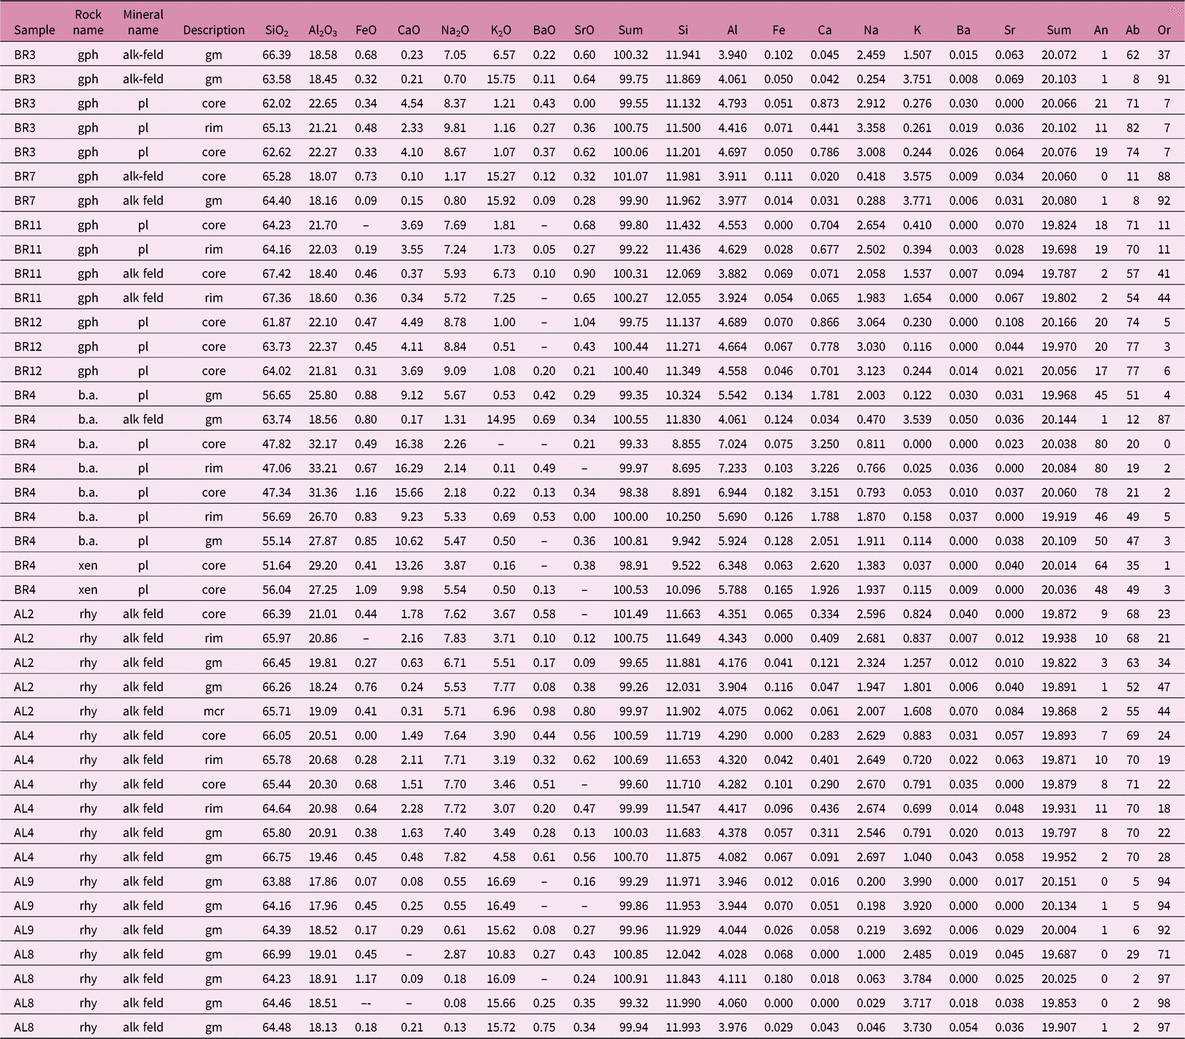
Representative chemical analyses (in wt %) and structural formulas (in atom per formula units (apfu), calculated on basis of 32 oxygens and 20 cations) of feldspars in the Barda–Alech rocks, Saurashtra, NW Deccan Traps
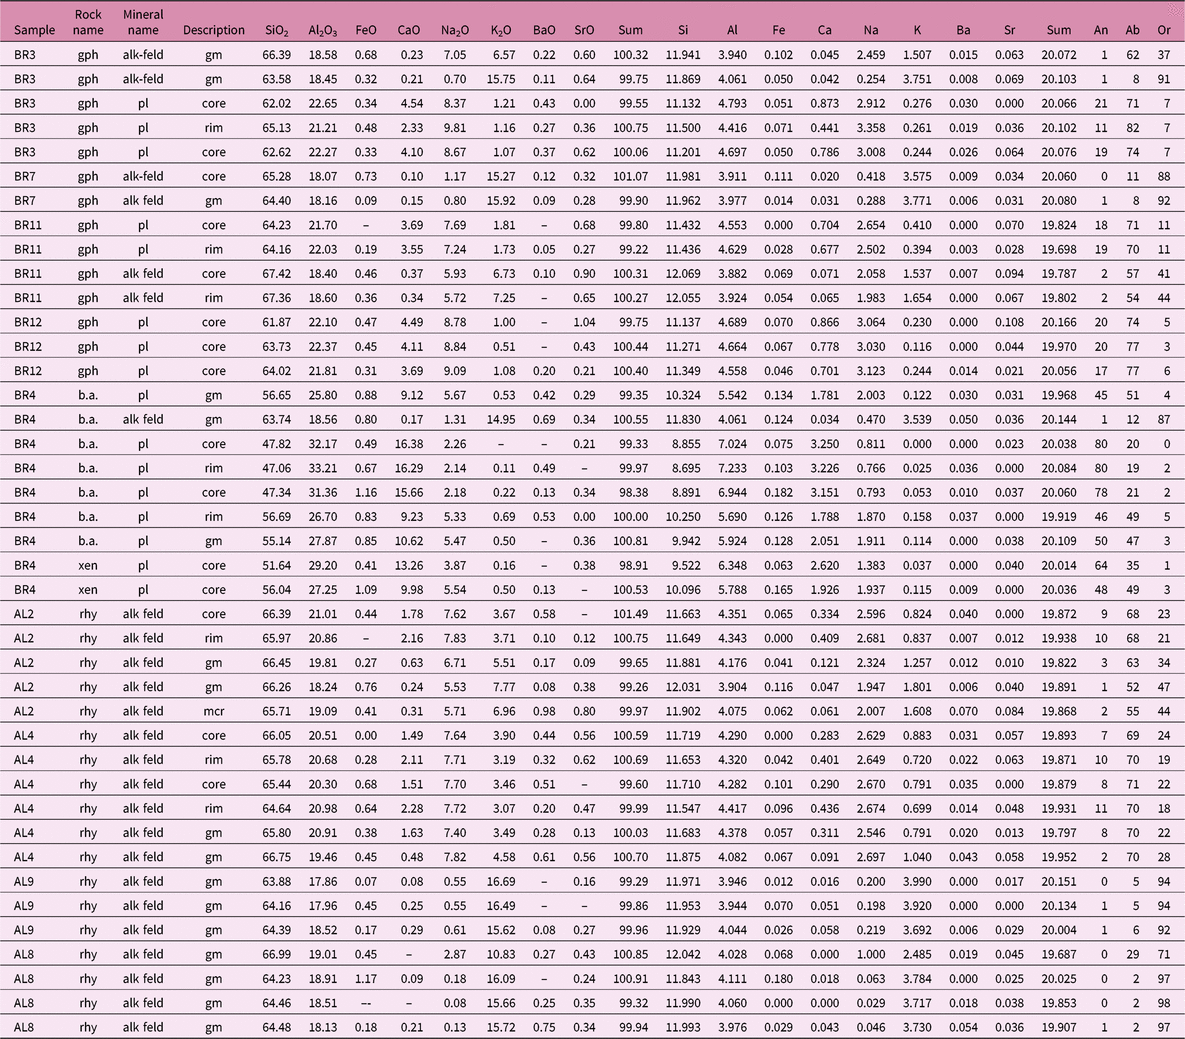
pl = plagioclase; alk feld = alkali feldspar; mcr = microphenocryst; gm = groundmass. An, Ab and Or in mol %.
gph = granophyre; b.a. = basaltic andesite; xen = xenolith in BR4 sample; rhy = rhyolite. Samples BR4 (mafic) and AL4 (rhyolitic) are dykes.
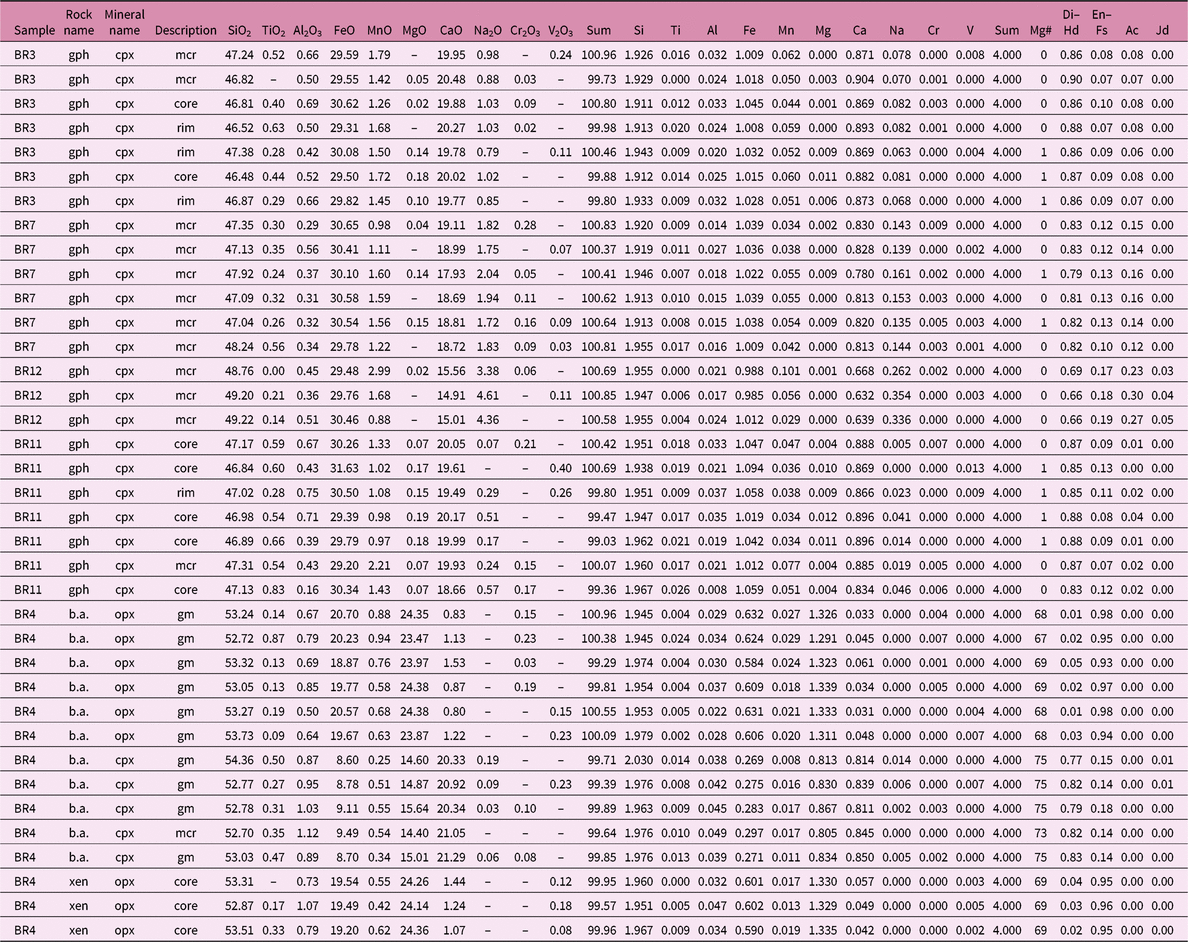
Representative chemical analyses (in wt %) and structural formulas (in apfu, calculated on basis of 6 oxygens and 4 cations) of pyroxenes in the Barda rocks, Saurashtra
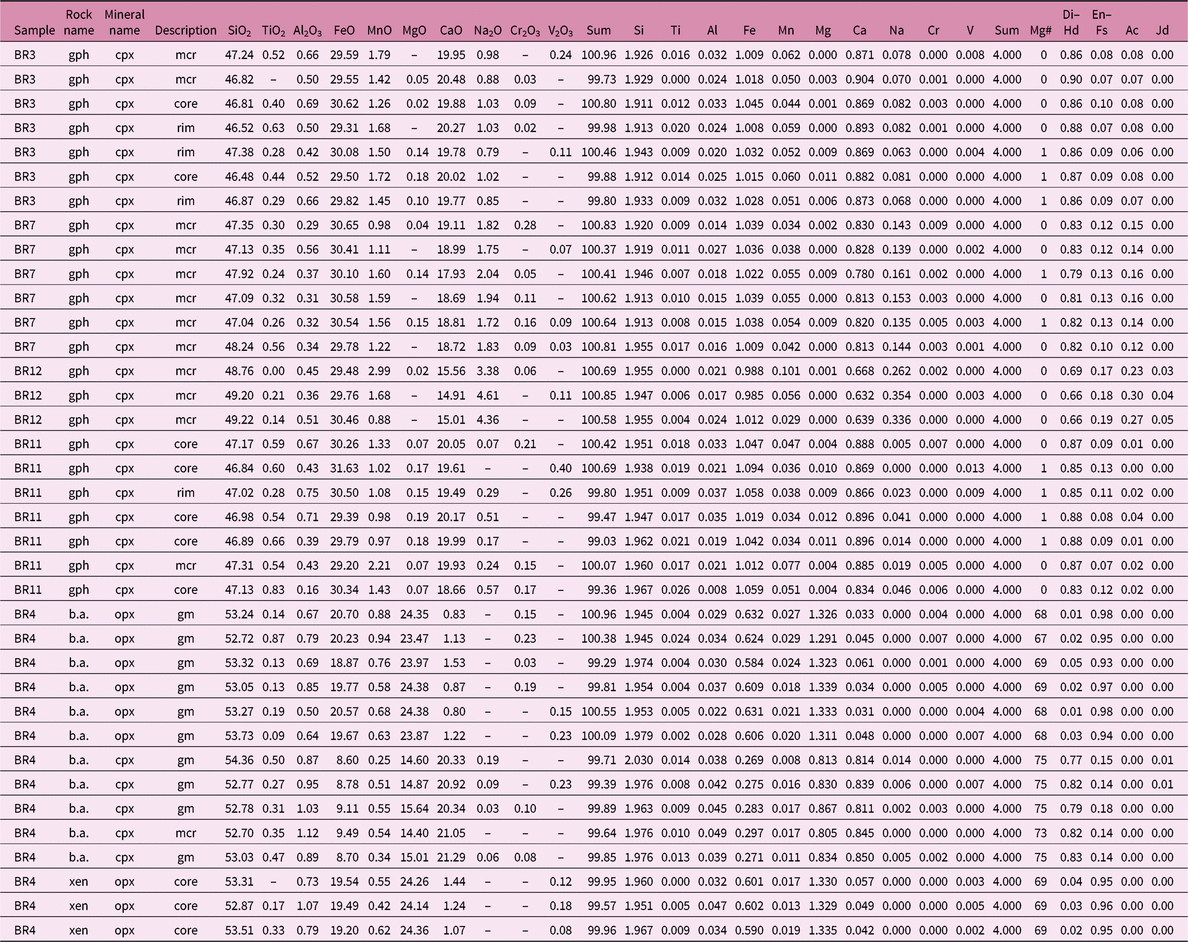
gph = granophyre; b.a. = basaltic andesite; xen = xenolith in BR4 sample. mcr = microphenocryst; gm = groundmass; opx = orthopyroxene; cpx = clinopyroxene. Mg# = atomic 100*(Mg+Fe).
Pyroxene components: Di–Hd = diopside–hedenbergite; En–Fs = enstatite–ferrosilite; Ac = acmite; Jd = jadeite.
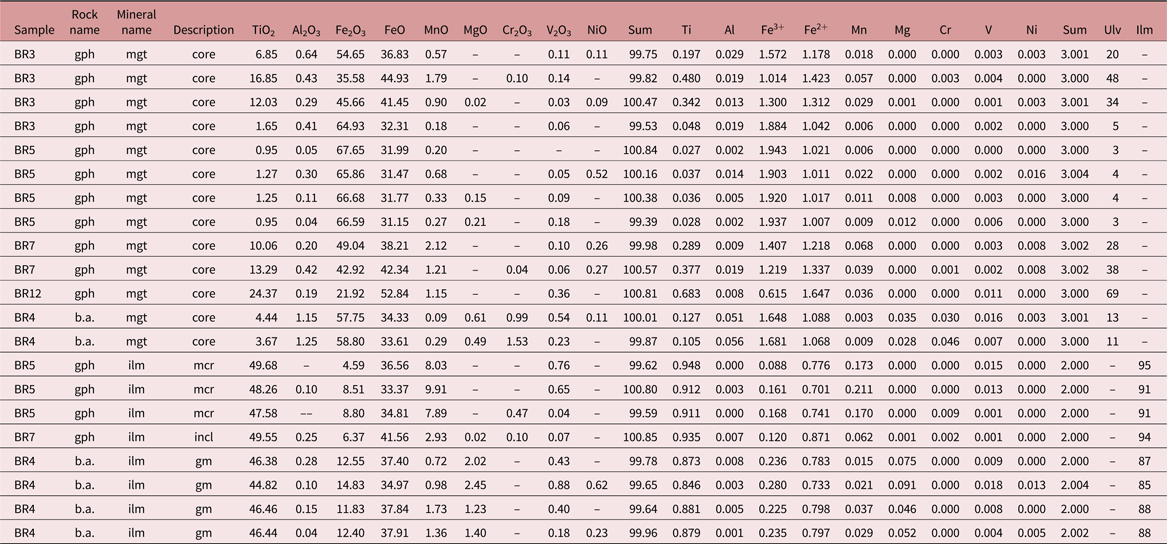
Representative chemical analyses (in wt %) and structural formulas (in apfu) of magnetites and ilmenites in the Barda rocks, Saurashtra
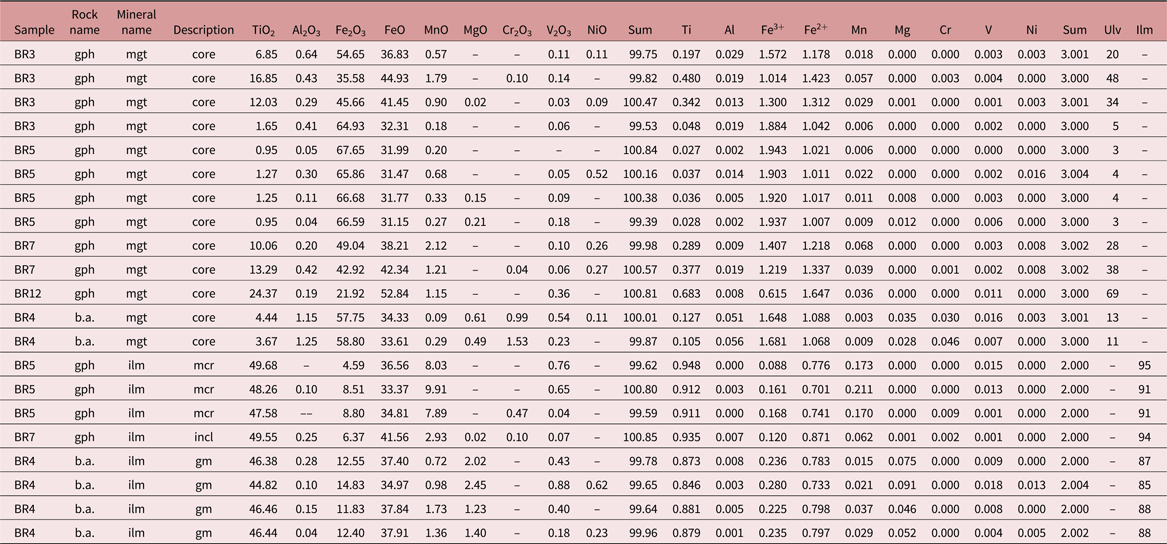
gph = granophyre; b.a. = basaltic andesite; gm = groundmass; incl = inclusion; mcr = microphenocryst; mgt = magnetite; ilm = ilmenite. Ulv = ulvöspinel mol. %; Ilm = ilmenite mol. %
magnetites were calculated on the basis of 4 oxygens and 3 cations; ilmenites were calculated on the basis of 3 oxygens and 2 cations.
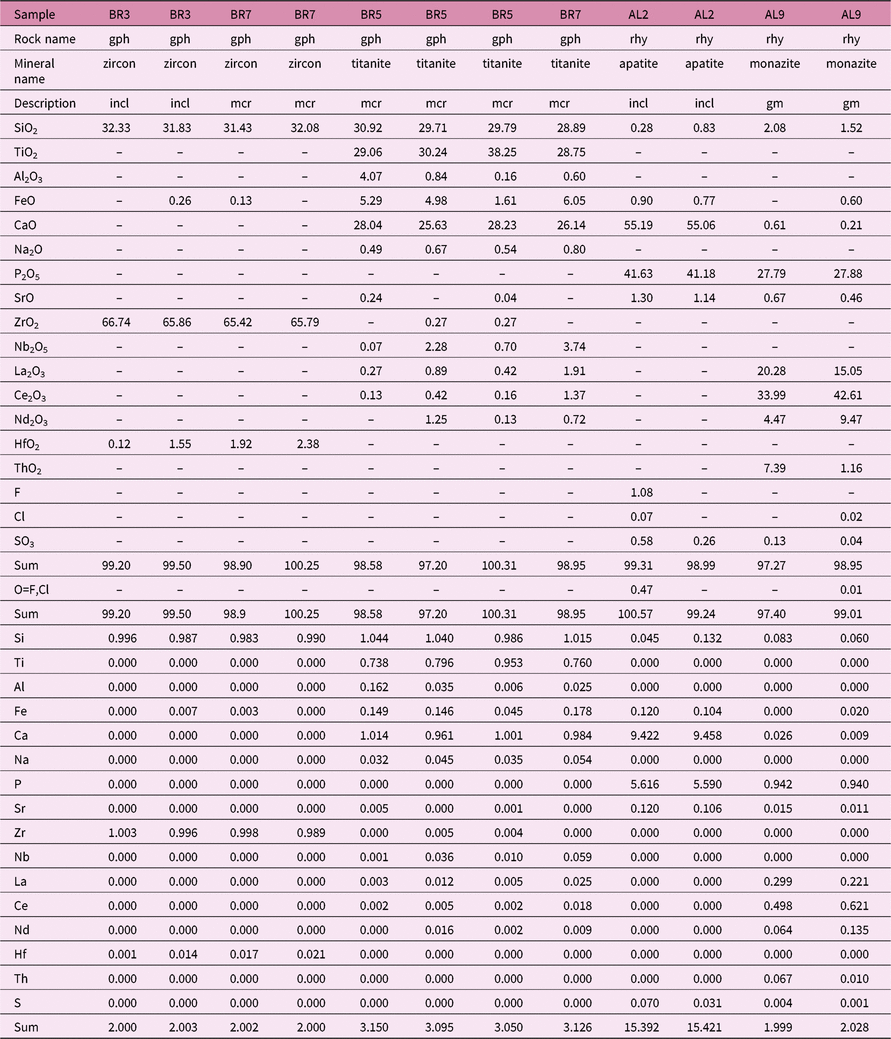
Representative chemical analyses (in wt %) and structural formulas (in apfu) of zircons, titanites, apatites and monazites in the Barda–Alech rocks, Saurashtra
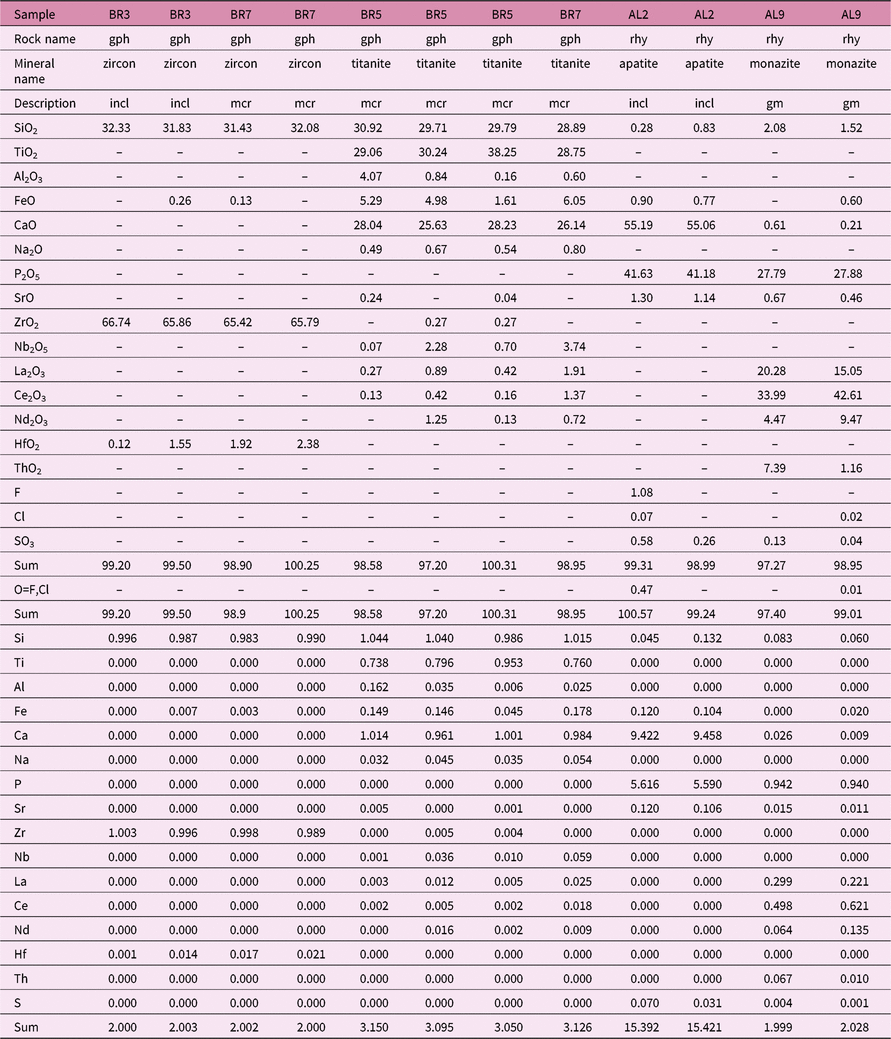
gph = granophyre; rhy = rhyolite; mcr = microphenocryst; gm = groundmass.
zircons were calculated on the basis of 4 oxygens and 2 cations; titanites were calculated on the basis of 5 oxygens and 3 cations.
apatites were calculated on the basis of 24 oxygens and 16 cations; monazites were calculated on the basis of 4 oxygens and 2 cations.
4.b. 40Ar–39Ar geochronology
Three whole-rock samples of the Barda granophyres were dated using the 40Ar–39Ar incremental heating technique. Samples BR3 and BR5 were collected from low-lying outcrops on the Ranavav–Bhanvad road, north and south of Sajanwala Nes and Hanumangadh, respectively (Fig. 2). Sample BR12 was taken from the base of a jointed granophyre hillock north of Ranavav railway station (Fig. 2). None of the Alech rock samples were suitable for 40Ar–39Ar dating because of their significant alteration.
Fresh rock chips were crushed, sieved, and cleaned in deionized water in an ultrasonic bath. About 0.02 g of each was packed in aluminium capsules. Minnesota hornblende (MMhb-1, age 523.1 ± 2.6 Ma, Renne et al. Reference Renne, Swisher, Deino, Karner, Owens and DePaolo1998) and high-purity CaF2 and K2SO4 salts were used as monitor samples. High-purity nickel wires were placed in both sample and monitor capsules to monitor the neutron fluence variation, which was typically ∼5 %. The aluminium capsules were kept in a 0.5 mm thick cadmium cylinder and irradiated in the heavy-water-moderated DHRUVA reactor at the Bhabha Atomic Research Centre (BARC), Mumbai, for ∼100 h. The irradiated samples were repacked in aluminium foil and loaded on the extraction unit of a Thermo Fisher Scientific noble gas preparation system. Argon was extracted in a series of steps up to 1400 °C in an electrically heated ultrahigh vacuum furnace. The argon released in each step, after purification using Ti–Zr getters, was analysed with a Thermo Fisher ARGUS VI mass spectrometer, located at the National Facility for 40Ar–39Ar Geo-thermochronology in the Department of Earth Sciences, IIT Bombay. The mass spectrometer is equipped with five Faraday cups fitted with 1011 Ω resistors.
Interference corrections for Ca- and K-produced Ar isotopes based on analysis of CaF2 and K2SO4 salts were (36Ar/37Ar)Ca, (39Ar/37Ar)Ca and (40Ar/39Ar)K = 0.000471, 0.001145 and 0.006842, respectively. 40Ar blank contributions were 1–2 % or less for all temperature steps. The irradiation parameter J for each sample was corrected for neutron flux variation using the activity of nickel wires irradiated with each sample. Values of fluence-corrected J for various samples are as follows: BR3, 0.000480 ± 0.000002; BR5, 0.000490 ± 0.000002; BR7, 0.000487 ± 0.000002; BR12, 0.000516 ± 0.000003. The plateau ages reported comprise a minimum of 50 % of the total 39Ar released and four or more successive degassing steps whose mean ages overlap at the 2σ level excluding the error contribution (0.5 %) from the J value. The data were plotted using the program Isoplot/Ex v. 3.75 (Ludwig, Reference Ludwig2012).
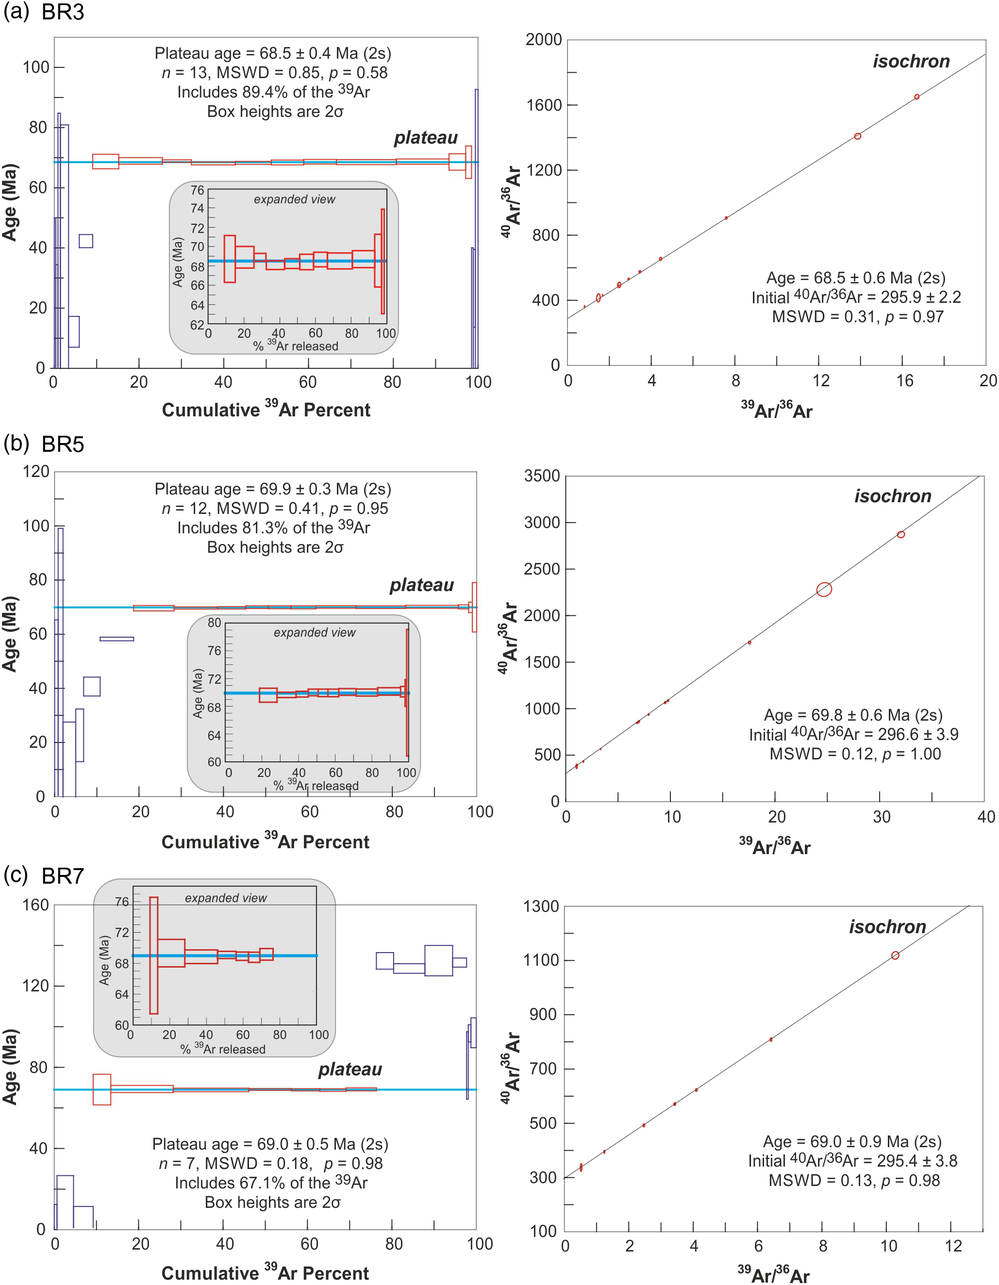
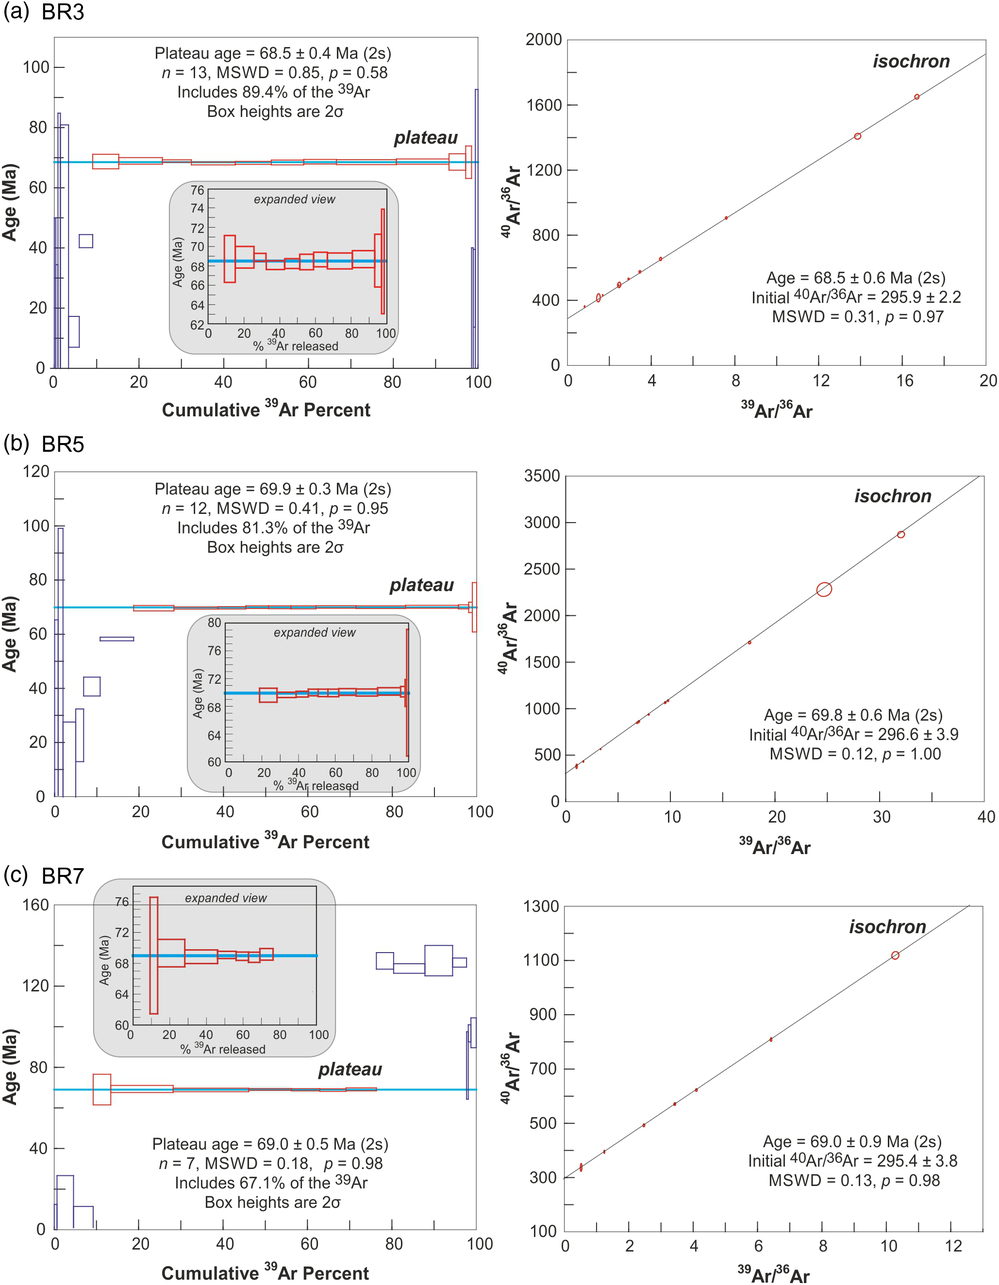
Table 5 gives the summary of the 40Ar–39Ar dating results (plateau, isochron and inverse isochron ages with 2σ uncertainties) for the three Barda granophyre samples. Plateau spectra and isochron plots for the three samples are shown in Figure 6. The full, stepwise analytical data are given in Supplementary Table S1 (available online at https://doi.org/10.1017/S0016756818000924).
40Ar–39Ar plateau spectra (left panels) and isochron plots (right panels) for the Barda granophyre samples (a) BR3, (b) BR5 and (c) BR12. In the plateau spectra, the plateau steps are shown with red outlines and the non-plateau steps with dark blue outlines. Also shown are values of the MSWD (mean square weighted deviate) and probability (p). Inset figures show the enlarged views of the plateau spectra.
Summary of 40Ar–39Ar dating results for granophyres of the Barda complex, Saurashtra

Notes: Trap is initial 40Ar/36Ar ratio (trapped component), MSWD is mean square weighted deviate and p is the corresponding probability.
Errors are reported at the 2σ confidence level and monitor mineral is MMHb (523.1 ± 2.6 Ma, Renne et al. Reference Renne, Swisher, Deino, Karner, Owens and DePaolo1998).
4.c. Major- and trace-element analyses
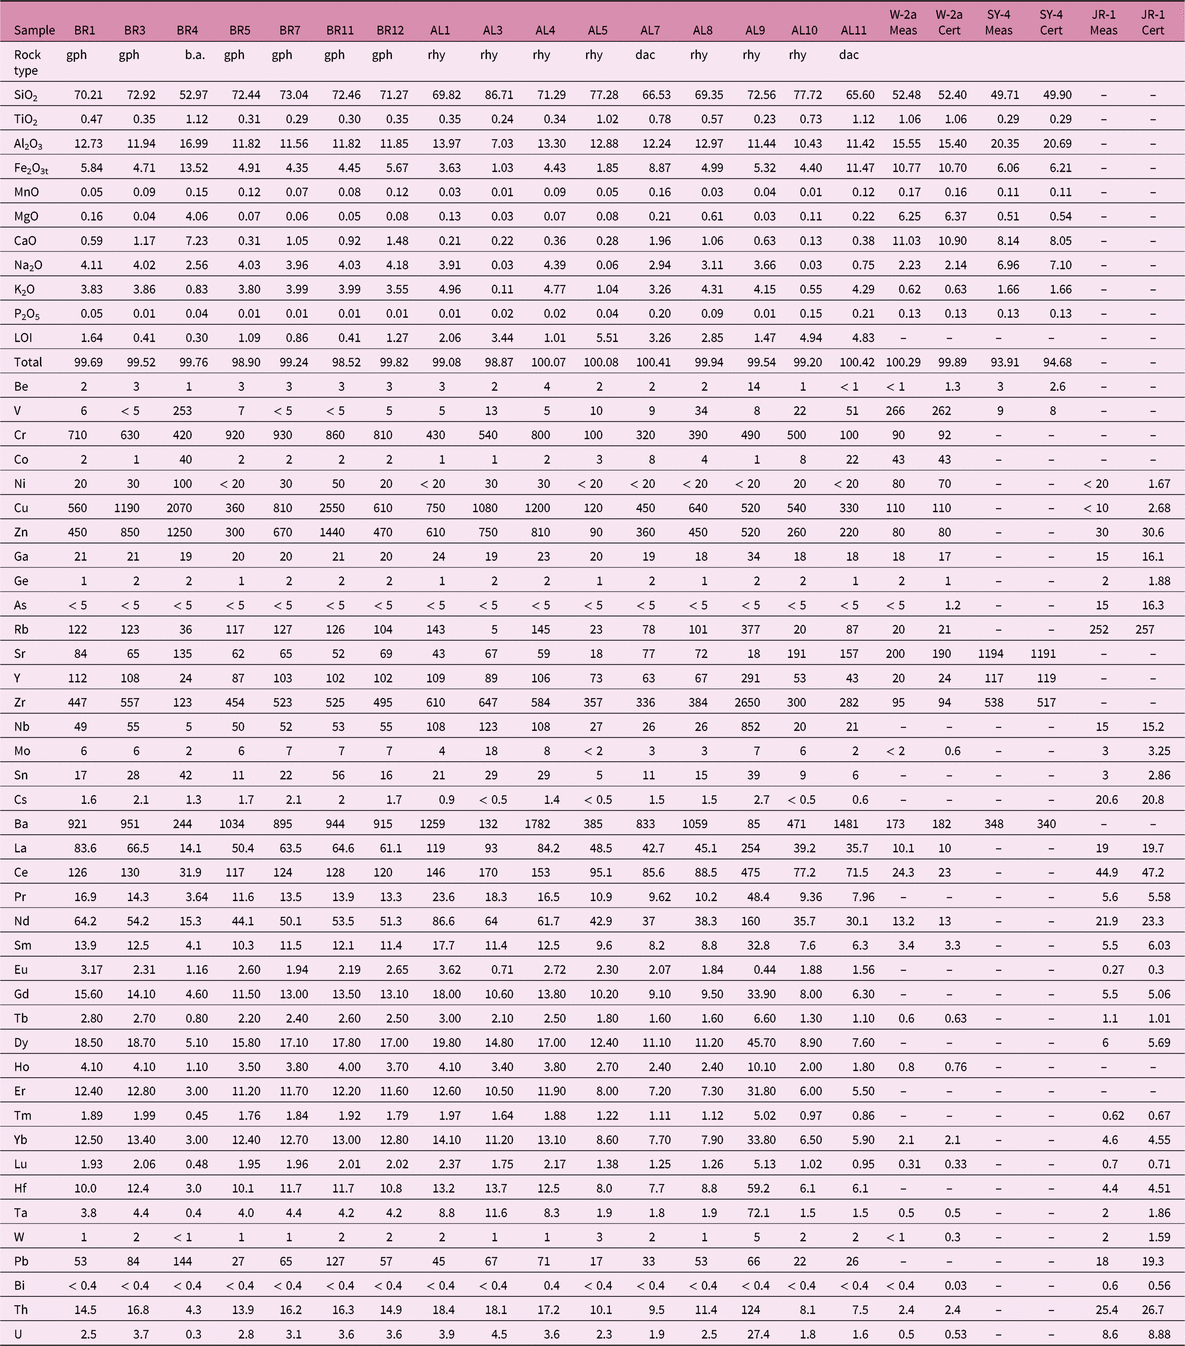
The seven rock samples from the Barda complex and nine from the Alech complex analysed for mineral chemical compositions were also analysed for whole-rock major and trace element (including rare earth element (REE)) concentrations at Activation Laboratories (Actlabs), Ancaster, Ontario, Canada. Rock powders were mixed with fluxes lithium metaborate and lithium tetraborate and fused in an induction furnace. The molten samples were immediately poured into a solution of 5 % nitric acid containing an internal standard and mixed continuously until completely dissolved (∼30 min). The samples were analysed for major oxides and selected trace elements (Ba, Be, Sc, Sr, V, Y and Zr) on a combination simultaneous/sequential Thermo Jarrell-Ash ENVIRO II ICP or a Varian Vista 735 ICP. Calibration was performed using seven USGS and CANMET certified reference materials. One of the seven standards was used during the analysis for every group of ten samples. The fused sample solutions were diluted and analysed by a Perkin Elmer Sciex ELAN 6000, 6100 or 9000 ICP/MS for other trace elements (Cr, Co, Ni, Cu, Zn, Ga, Ge, As, Rb, Nb, Mo, Sn, Cs, La, Ce, Pr, Nd, Sm, Eu, Gd, Tb, Dy, Ho, Er, Tm, Yb, Lu, Hf, Ta, W, Pb, Bi, Th and U). Three blanks and five control samples (three before the sample group and two after) were analysed per group of samples. Duplicates were fused and analysed after every 15 samples. Analyses of international standards are reported in Table 6. The weight loss on ignition was determined with gravimetric techniques, by firing at 1000 °C small aliquots of powders previously dried at 110 °C overnight. Major and trace element (including the REE) data for the Barda–Alech rocks are presented in Table 6.
Major and trace element data for rocks of the Barda and Alech complexes, Saurashtra
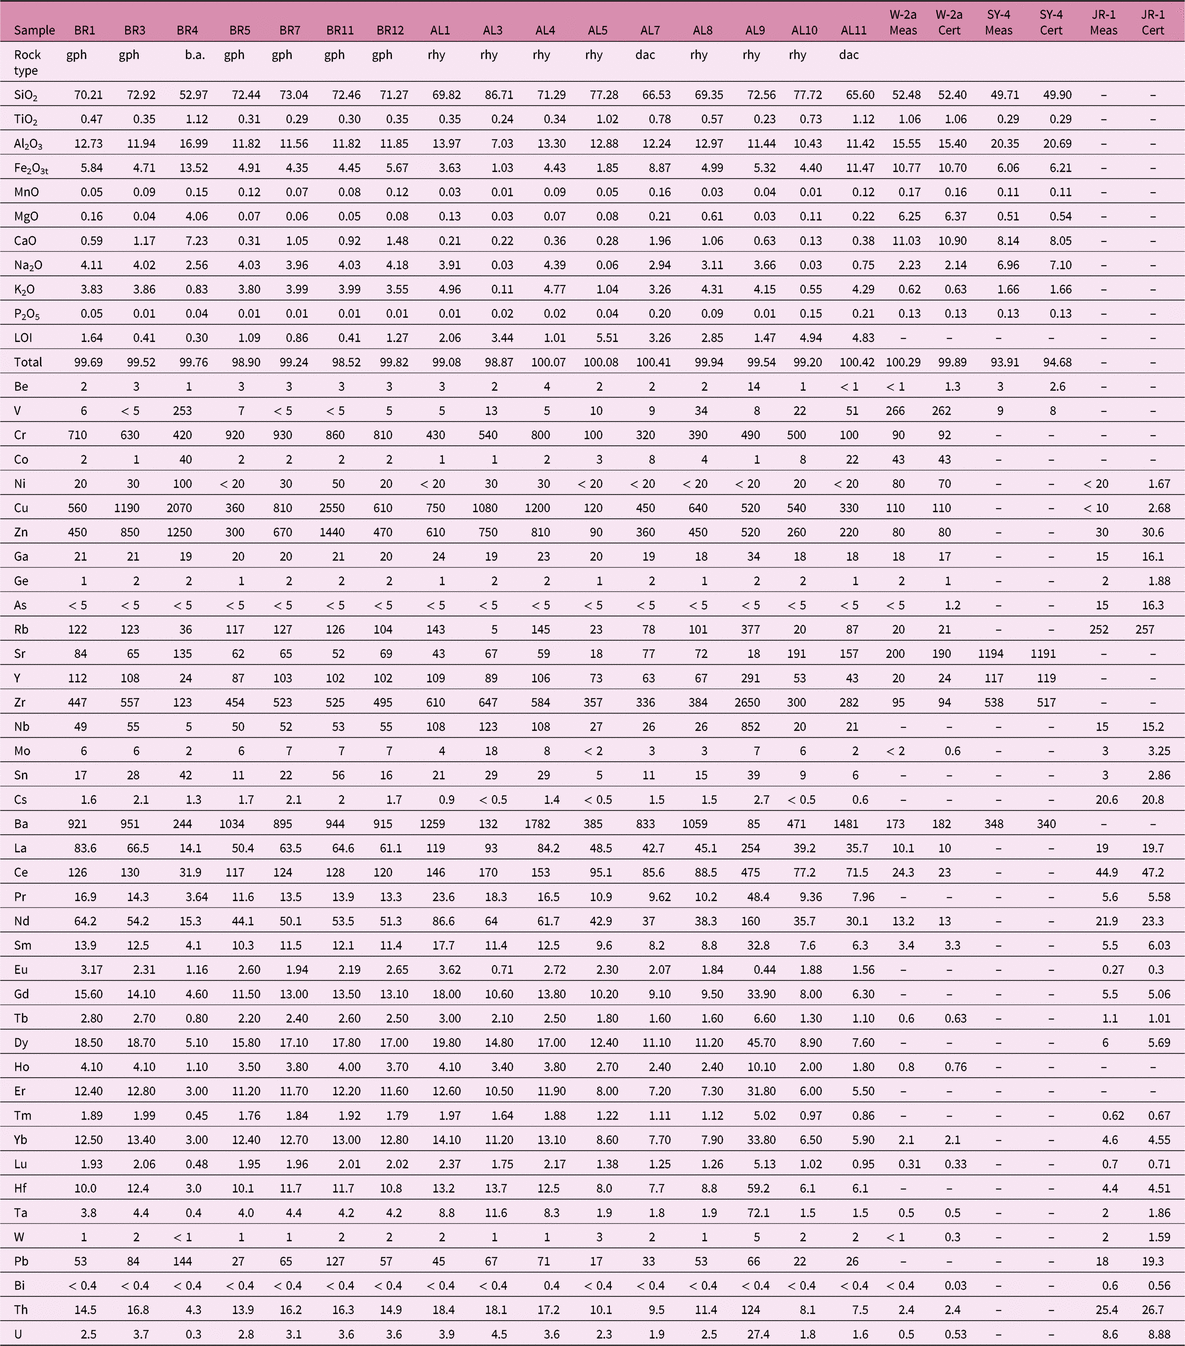
Notes: Major oxides are in weight per cent and trace elements in parts per million (ppm). Rock names (gph, granophyre; b.a., basaltic andesite; rhy, rhyolite; dac, dacite) are from the SINCLAS program of Verma et al. (Reference Verma, Torres-Alvarado and Sotelo-Rodriguez2002) which uses LOI-free recalculated data and the TAS diagram of Le Bas et al. (Reference Le Bas, Le Maitre, Streckeisen and Zanettin1986). Samples BR4, AL4 and AL11 are dykes. LOI is loss in weight on ignition.
‘Cert.’ are the recommended values and ‘Meas.’ the measured values on USGS and CANMET reference materials.
4.d. Sr–Nd isotopic analyses
Sr–Nd isotopic analyses were performed on 12 samples (six Barda granophyres, the Barda basaltic andesite dyke BR4 and five Alech rhyolitic rocks), using a fully automatic Thermo Fisher TRITON multicollector thermal ionization mass spectrometer (TIMS), located at the National Facility for Isotope Geology and Geochronology, Indian Institute of Technology Roorkee. Sample dissolution procedures and other analytical details are as described by Sheth et al. (Reference Sheth, Choudhary, Bhattacharyya, Cucciniello, Laishram and Gurav2011, Reference Sheth, Choudhary, Cucciniello, Bhattacharyya, Laishram and Gurav2012). The Sr–Nd isotopic data are reported in Table 7.
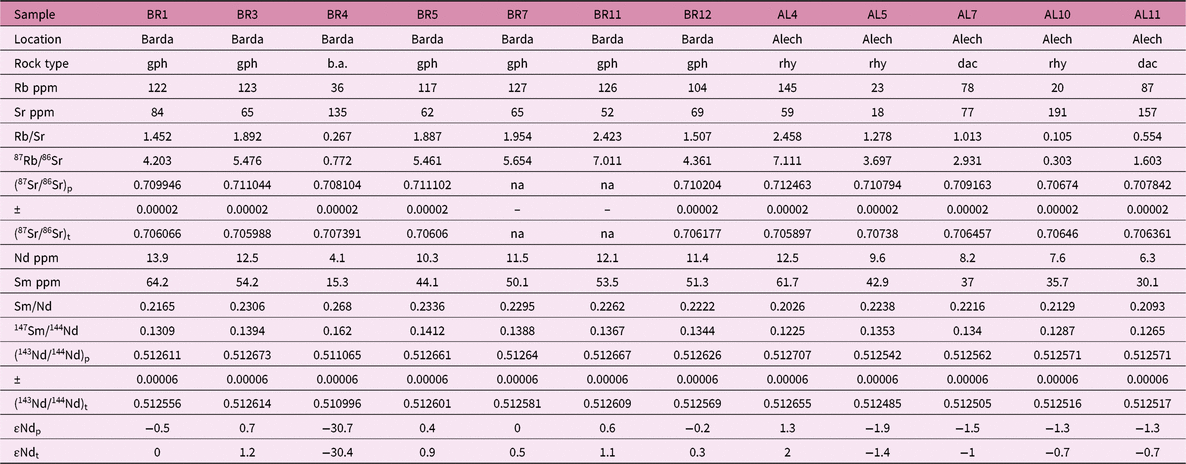
Sr and Nd isotopic data for rocks of the Barda and Alech complexes, Saurashtra
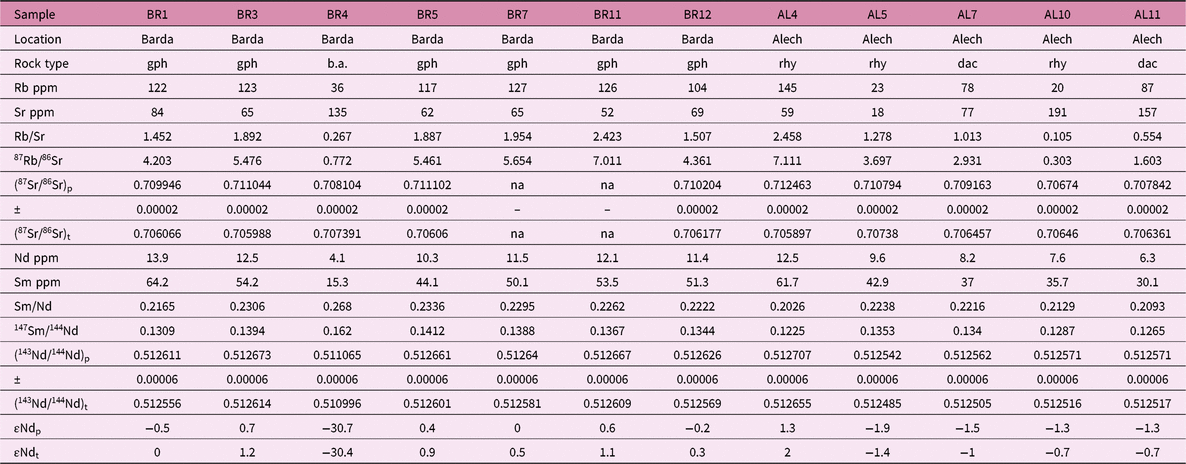
Notes: Samples BR4 (basaltic andesite), AL4 (rhyolite) and AL11 (dacite) are dykes, gph are granophyres.
The Sr and Nd isotopic data are age-corrected to 65 Ma using inductively coupled plasma mass spectrometer (ICP-MS) values of Rb, Sr, Sm and Nd. Epsilon Nd (ϵNd) values have been calculated for the rocks using a chondritic average value of 143Nd/144Nd = 0.512638 and 147Sm/144Nd = 0.1967 (present-day). Using the ages obtained in this study (such as 69 Ma instead of 65 Ma for the Barda granophyres) gives (87Sr/86Sr)t ratios that are lower by 0.00004–0.00031 in the different samples, and makes no significant difference in the (143Nd/144Nd)t ratios and ϵNdt values.
Since most samples are not dated, 65 Ma is the preferred age for correcting present-day ratios and for direct comparison with previous studies.
‘na’ indicates not analysed/available.
5. Results
5.a. Mineral chemistry
Plagioclase in Barda granophyres ranges in composition from oligoclase (An21-19Ab72-74Or7) to albite (An11Ab82Or7). De & Bhattacharyya (Reference De and Bhattacharyya1971) determined similar plagioclase phenocryst compositions of An15 to An21 from optic axial angle measurements. Unexsolved alkali feldspars in Barda granophyres range from An1Ab62Or37 to An1Ab7Or92 (Table 1; Fig. 5a).
In Barda basaltic andesite dyke BR4, plagioclase phenocrysts are bytownite (An71-80Ab27-20Or1-0) whereas groundmass plagioclase ranges from labradorite (An58Ab39Or3) to andesine (An46-45Ab49-51Or5-4). Rare K-feldspar (An1Ab11Or88) is found in the groundmass (Fig. 5a). Plagioclase in the basement xenoliths in dyke BR4 ranges from labradorite (An64Ab35Or1) to andesine (An50-48Ab47-49Or3), and the xenoliths contain rare K-feldspar (An0Ab6Or94).
Phenocrysts of alkali feldspar in the Alech rhyolites (AL2, AL4) are anorthoclase (An12-3Ab71-63Or17-34) (Table 1; Fig. 5a). Groundmass alkali feldspars range from An2Ab60Or38 to An1Ab50Or49. Sanidine occurs in the groundmass of Alech rhyolites AL8 and AL9 (Fig. 5a).
Pyroxenes in Barda granophyres (Table 2) are hedenbergite (Ca43-46Mg0Fe57-54; Mg# = Mg*100/(Mg+Fet) = 0) and aegirine–augite (Na2O = 1.8–4.6 wt %; Mg# = 0), typical of alkaline rocks (Fig. 5b). De & Bhattacharyya (Reference De and Bhattacharyya1971) reported similar compositions. TiO2 is generally low (0–0.8 wt %) and tends to decrease with decreasing FeO content of the clinopyroxene. In the basaltic andesite dyke BR4, augite (Ca43-41Mg41-44Fe16-15; Mg# = 73–75) and orthopyroxene (Ca2-3Mg65-66Fe31-32; Mg# = 67–69) are the two pyroxenes (Fig. 5b). Orthopyroxene with similar composition (Ca2-3Mg66-67Fe31-32) is observed in the basement xenoliths of dyke BR4. Equilibration temperatures based on clinopyroxene-liquid geothermometer (Putirka, Reference Putirka, Putirka and Tepley2008) range from 1003 °C to 1043 °C. Two-pyroxene geothermometry (Putirka, Reference Putirka, Putirka and Tepley2008) yields values close to 900 °C.
Titaniferous magnetite in the Barda granophyres has variable TiO2 (1.0–24.4 wt %; 3–69 mol. % ulvöspinel) and low Al2O3 (<0.7 wt %) contents (Table 3). In dyke BR4 the titaniferous magnetite has low ulvöspinel (11–26 mol. %) contents. Ilmenite has a limited range of solid solution with haematite (ilmenite from 85 to 95 mol. %). MgO ranges from 1.2 to 2.4 wt % in ilmenites in dyke BR4. Equilibrium magnetite–ilmenite pairs in the Barda granophyres and basaltic andesite yield temperature and log fO2 of 583–750 °C and –14 to –20, respectively (calculated using the ILMAT program of Lepage, Reference Lepage2003), indicating late-stage subsolidus requilibration.
Zircon and titanite are ubiquitous in the Barda granophyres as euhedral, prismatic microcrystals and show a homogeneous major element composition. Zircon contains up to 2.4 wt % HfO2 (Table 4). Monazite-(Ce) has been observed as accessory phase in the Alech rhyolite AL9. It contains La2O3 in the range 15.1–20.3 wt % and Ce2O3 from 34.0 to 42.6 wt %. Thorium concentration ranges from 1.1 to 7.4 wt % ThO2 (Table 4).
5.b. 40Ar–39Ar dating
Granophyre BR3 yielded an 11-step plateau constituting as much as 89.4 % of the total 39Ar release, and an age of 68.5 ± 0.4 Ma (2σ) (Fig. 6a). Granophyre BR5 yielded a 12-step plateau constituting 81.3 % of the 39Ar release, and an age of 69.9 ± 0.3 (2σ) (Fig. 6b). Granophyre BR12 yielded a seven-step plateau constituting 67.1 % of the 39Ar release, and an age of 69.0 ± 0.5 (2σ) (Fig. 6c). All three samples have isochron ages and inverse isochron ages that are statistically indistinguishable from the plateau ages (Fig. 6a–c; Table 5). The isochrons and inverse isochrons also have acceptable MSWD values and intercepts showing atmospheric values (295.5) of the trapped 40Ar/36Ar ratio, which suggests, along with the well-developed plateau spectra for all samples, that these ages are true crystallization ages. We take the plateau ages of the three granophyre samples to represent their intrusion and crystallization ages.
5.c. Whole-rock geochemistry
5.c.1. Alteration effects
Like hand specimen and petrographic observations, LOI values indicate that several samples (particularly of the Alech rocks, e.g. AL3, 5, 10, 11) are altered. LOI values range from 0.30 to 1.64 wt % for Barda rock samples and from 1.10 to 5.51 wt % for Alech rock samples. The extremely high SiO2 content in some Alech rhyolites (e.g. 86.71 wt % in AL3) indicates silicification processes mostly associated with alkali mobility. Alteration also appears to have variably affected K, Na, Rb and Ba contents in the Alech samples, as noted from poor correlations between K, Na, Rb and Ba and more alteration-resistant elements such as Zr or Nb. We therefore do not use Rb, Ba, K and Na data in this study and use only the alteration-resistant elements (Ti, Zr, Nb, Y, Th and REE) and their ratios for geochemical interpretations.
5.c.2. Major- and trace-element compositions
We used the SINCLAS program of Verma et al. (Reference Verma, Torres-Alvarado and Sotelo-Rodriguez2002) to recalculate the major oxide data on an LOI-free basis and to obtain rock names recommended by the IUGS Sub-commission on the Systematics of Igneous Rocks based on the total alkalis–silica diagram (Le Bas et al. Reference Le Bas, Le Maitre, Streckeisen and Zanettin1986). As given by SINCLAS, all Barda granophyres are of rhyolite composition, whereas the dyke BR4 is a basaltic andesite. Most Alech samples are also of rhyolite composition, including dyke AL4, but sample AL07 from the outcrop with flow folding (Fig. 3b) and dyke AL11 from Chek Hill are dacites. The basaltic andesite dyke BR4 has 7 wt % normative quartz (Supplementary Table S2, available online at https://doi.org/10.1017/S0016756818000924).
The Barda granophyres are mainly metaluminous (A/CNK = mol Al2O3/(CaO+Na2O+K2O) = 0.88–0.93). They are chemically uniform, with SiO2 in the range 70.2–72.9 wt %, TiO2 0.3–0.5 wt %, Al2O3 11.6–12.7 wt % and Fe2O3t 4.4–5.8 wt %. All samples contain very low MgO contents (0.1–0.2 wt %). The alteration-resistant trace elements also have narrow ranges of concentration (Zr = 447–557 ppm, Nb = 49–55 ppm, Y = 87–112 ppm) and ratios of concentrations (Zr/Nb = 9–10, Y/Nb = 1.7–2.3). The values of these ratios are not too different from those of mantle-derived mafic melts with slightly enriched composition and are similar to those of various Deccan (particularly Saurashtra) mafic lavas and dykes (Zr/Nb = 5–26; Y/Nb = 1–9; Cucciniello et al. Reference Cucciniello, Demonterova, Sheth, Pande and Vijayan2015 and references therein).
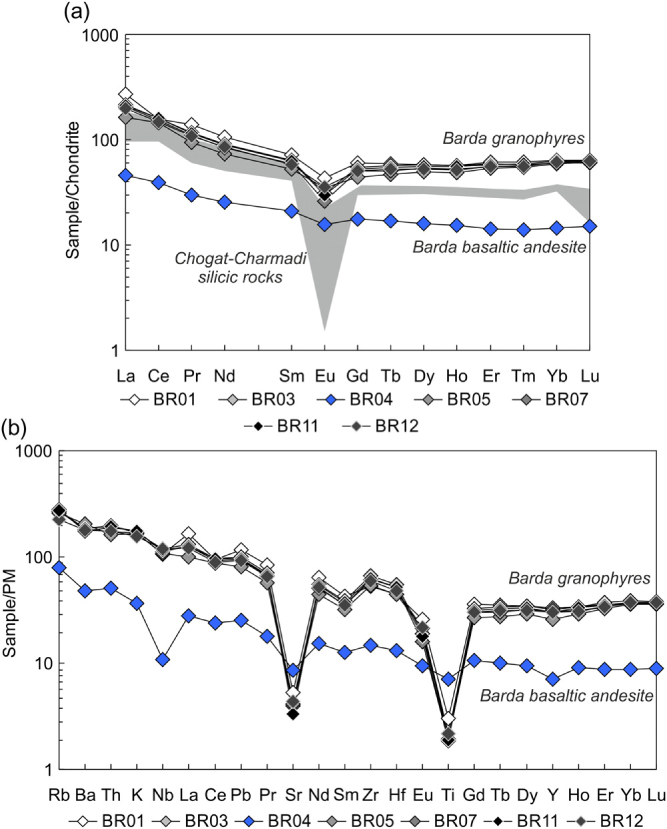
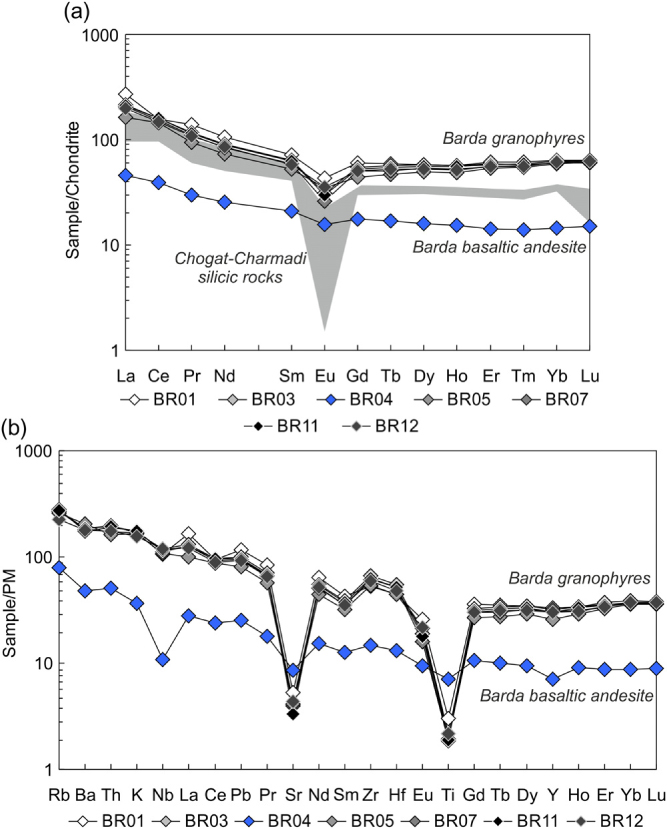
The Barda granophyres show low to moderate light- to heavy REE fractionation in chondrite-normalized patterns (Lan/Ybn = 2.7–4.5; the subscript ‘n’ means chondrite-normalized; Fig. 7a). All granophyres show distinct negative Eu anomalies, with Eun/Eu* = 0.5–0.7, where Eu* = (Smn + Gdn)/2. Basaltic andesite BR4 has lower REE contents than the granophyres and has a small negative Eu anomaly (Eun/Eu* = 0.8) in its chondrite-normalized REE pattern (Fig. 7a). In primitive mantle-normalized multi-element patterns (Fig. 7b) the Barda granophyres show small or no troughs at Nb and marked troughs at Sr and Ti. The basaltic andesite BR4 shows negative Nb, Sr and Ti anomalies in its pattern.
(a) Chondrite-normalized REE patterns of the Barda rocks. Chondrite normalizing values are from Boynton (Reference Boynton and Henderson1984). Also shown for comparison are patterns of some silicic rocks of the Chogat-Chamardi complex (Sheth et al. Reference Sheth, Choudhary, Bhattacharyya, Cucciniello, Laishram and Gurav2011). (b) Primitive mantle-normalized multi-element patterns of the Barda rocks. Normalizing values are from Lyubetskaya & Korenaga (Reference Lyubetskaya and Korenaga2007).
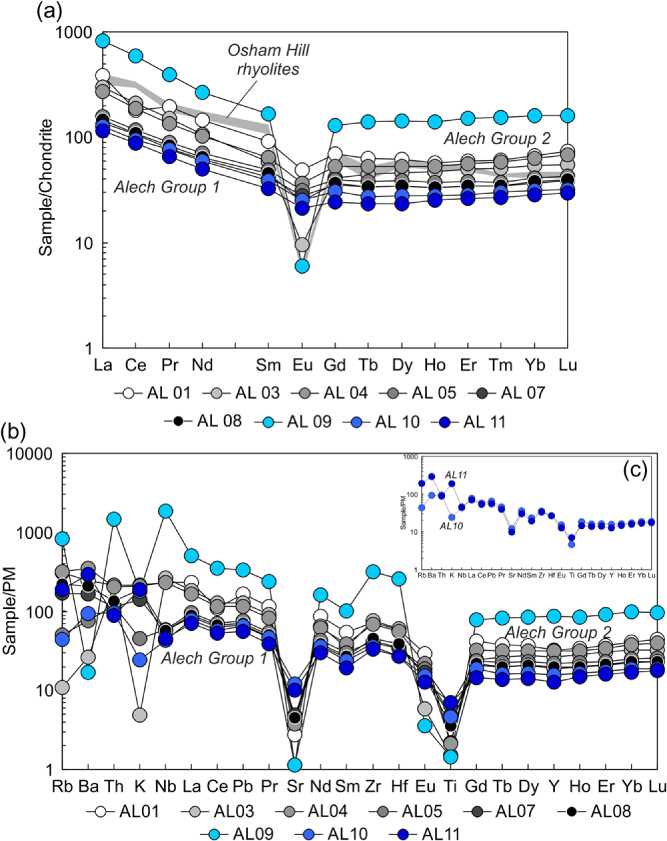
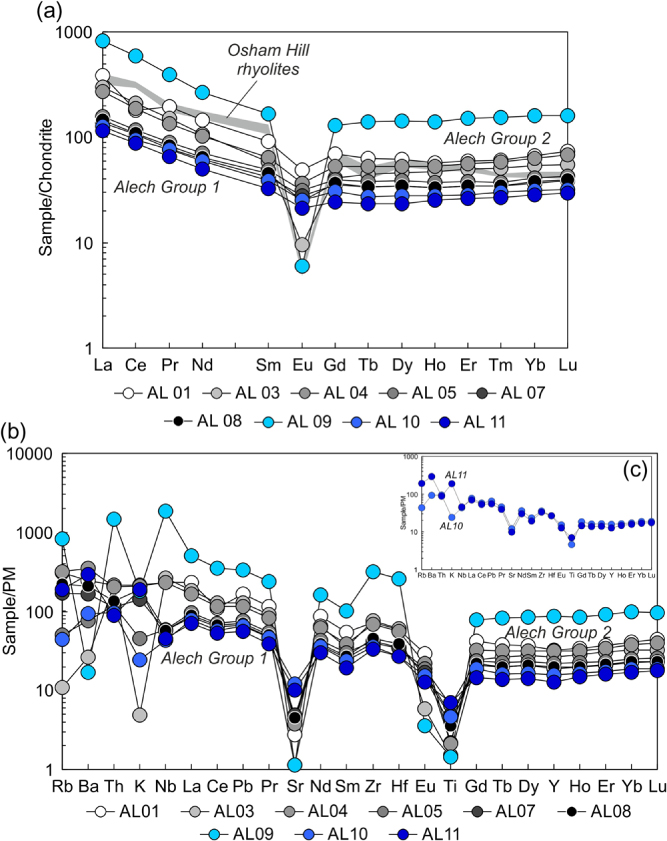
The least altered (LOI <3.4 wt %) of the Alech rhyolites and dacites (samples AL1, 4, 7, 8, 9, with SiO2 = 66.5–72.6 wt %) are weakly peraluminous, with A/CNK = 0.98–1.14, and low (0.3 wt %) or no corundum in the CIPW norm (Supplementary Table S2, available online at https://doi.org/10.1017/S0016756818000924). They can be divided into two groups. The first group (samples AL5, 7, 8, 10, 11) is characterized by low Nb (20–27 ppm) and moderate Zr (282–384 ppm) and Y (43–73 ppm) contents. These rocks are slightly enriched in light REE (LREE), with Lan/Ybn ranging from 3.7 to 4.1. Their REE patterns are relatively flat in the middle and heavy REE (HREE) portions of the pattern (Fig. 8a), with Gdn/Lun ≈ 0.8–1.0. Negative Eu anomalies (Eun/Eu* = 0.6–0.7) are present in the chondrite-normalized REE patterns of this group, and their mantle-normalized incompatible element patterns display troughs at Nb, Sr and Ti (Fig. 8a). The second group (samples AL1, 3, 4, 9) shows significant enrichments in the incompatible elements compared to the first group, with high Nb (108–852 ppm), Zr (584–2650 ppm) and Y (89–291 ppm) concentrations. Their chondrite-normalized patterns are characterized by moderate enrichment in LREE (Lan/Ybn = 4.3–5.7), a very flat HREE pattern and negative Eu anomalies, with the lowest value of Eun/Eu* (0.04) found in the rhyolite AL09 (Fig. 8b). In their mantle-normalized multi-element patterns (Fig. 8b), this group shows troughs at Sr and Ti.
(a) Chondrite-normalized REE patterns of the Alech rocks. Chondrite normalizing values are from Boynton (Reference Boynton and Henderson1984). Also shown for comparison are patterns of Osham Hill rhyolitic rocks (Sheth et al. Reference Sheth, Choudhary, Cucciniello, Bhattacharyya, Laishram and Gurav2012). (b) Primitive mantle-normalized multi-element patterns of the Alech rocks. Normalizing values are from Lyubetskaya & Korenaga (Reference Lyubetskaya and Korenaga2007). (c) Comparison of the primitive mantle-normalized multi-element patterns of Chek Hill rhyolite AL10 and dacite dyke AL11, Alech complex.
Samples AL8 and AL9 were taken from adjacent rhyolite dykes just south of Dhoriyo Nes hamlet (Fig. 2). At Dhoriyo Nes, Maithani et al. (Reference Maithani, Goyal, Banerjee, Gurjar, Ramchandran and Singh1996) have described a few rhyolite dykes with strong enrichments in Nb (up to 1000 ppm), Zr (>1000 ppm) and Y (up to 337 ppm). Our dyke AL9 (852 ppm Nb, 2650 ppm Zr, 291 ppm Y) undoubtedly represents one of them. The associated dyke AL8 does not show these notable Nb–Zr–Y enrichments.
5.c.3. Sr–Nd isotopic compositions
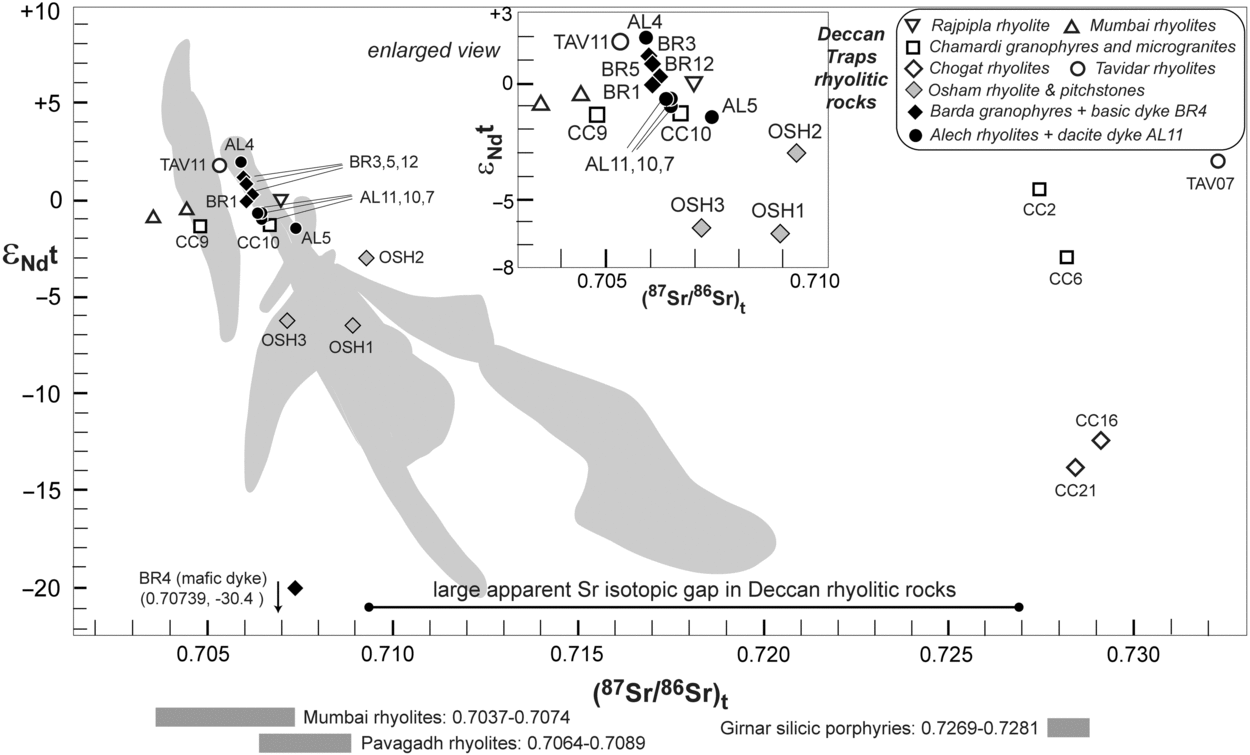
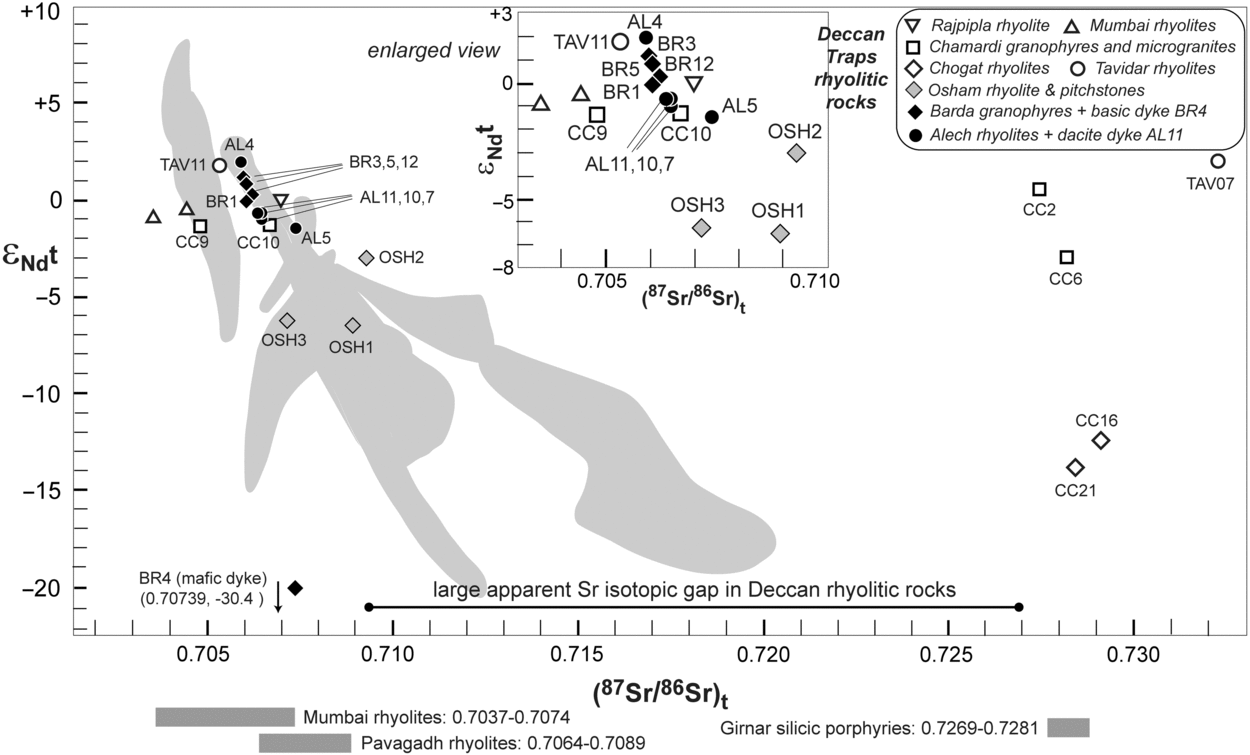
Measured Sr–Nd isotopic ratios of the 12 analysed Barda–Alech rocks have been recalculated as initial ratios at 65 Ma (Table 7; Fig. 9). Six Barda granophyres show a restricted range of (87Sr/86Sr)t from 0.705987 to 0.706176. Their (143Nd/144Nd)t values range from 0.512555 (ϵNdt = 0.0) to 0.512614 (ϵNdt = +1.1). The Barda basaltic andesite dyke BR4 has the highest (87Sr/86Sr)t of 0.707392 and lowest (143Nd/144Nd)t of 0.510996 (ϵNdt = –30.4) of all the analysed samples. Alech rocks of the first group described above (here represented by samples AL5, 7, 10, 11) have higher radiogenic (87Sr/86Sr)t ratios (0.706361–0.707379), and lower radiogenic (143Nd/144Nd)t ratios (0.512485–0.512517, ϵNdt = –1.4 to –0.7), compared to those of the second group (here represented by a single sample AL4) which has (87Sr/86Sr)t = 0.705894 and (143Nd/144Nd)t = 0.512655; ϵNdt = +2.0) and the Barda granophyres (Fig. 9).
Sr–Nd isotopic plot showing data for Deccan Traps silicic rocks, including the Barda–Alech silicic rocks (this study). Data sources are: Rajpipla rhyolite (Mahoney et al. Reference Mahoney, Macdougall, Lugmair, Gopalan and Krishnamurthy1985), Mumbai rhyolites (Lightfoot et al. Reference Lightfoot, Hawkesworth and Sethna1987), Chamardi granophyres and microgranites and Chogat rhyolites (Sheth et al. Reference Sheth, Choudhary, Bhattacharyya, Cucciniello, Laishram and Gurav2011), Osham rhyolite and pitchstones (Sheth et al. Reference Sheth, Choudhary, Cucciniello, Bhattacharyya, Laishram and Gurav2012) and Tavidar rhyolites (Sen et al. Reference Sen, Pande, Hegner, Sharma, Dayal, Sheth and Mistry2012). Nd isotopic data are not available for the Pavagadh rhyolites (Sheth & Melluso, Reference Sheth and Melluso2008), Mount Girnar silicic porphyry (Paul et al. Reference Paul, Potts, Rex and Beckinsale1977), and several other Mumbai rhyolites (Lightfoot et al. Reference Lightfoot, Hawkesworth and Sethna1987), whose Sr isotopic ranges are shown by grey bands under the main figure. Also shown in the background are Sr–Nd isotopic compositions of the Western Ghats stratigraphic formations (light grey fields, Vanderkluysen et al. Reference Vanderkluysen, Mahoney, Hooper, Sheth and Ray2011). All Sr–Nd isotopic data are initial ratios recalculated at 65 Ma and plotted for direct comparison. Note the large gap in Sr isotopic composition between the various silicic rocks. An enlarged view of the little-contaminated silicic rocks of the Deccan Traps, including the Barda–Alech samples of this study, is also provided as an inset figure.
Samples AL10 and AL11 have identical (87Sr/86Sr)t and (143Nd/144Nd)t ratios (Table 6; Fig. 9). AL10 is a tuffaceous-looking rhyolite (possibly also an ignimbrite) forming Chek Hill (226 m, Fig. 2), and AL11 is a dark grey, very fine-grained dyke cutting AL11. Both samples are visibly altered and have high LOI values (4.94 and 4.83 wt %, respectively). They have very similar Th, Nb, Zr, Hf, Ti and REE contents, as shown by their almost overlapping primitive mantle-normalized patterns in Figure 8c, but they differ considerably in Rb, Ba, K and Na, the fluid-mobile elements. The isotopic and trace element data indicate that rhyolite AL10 and the dacite dyke AL11 cutting it were both derived from the same magma reservoir.
6. Discussion
6.a. Emplacement ages
Field relationships (Dave, Reference Dave1971; De & Bhattacharyya, Reference De and Bhattacharyya1971) and the 40Ar–39Ar age data obtained in this study imply that the Barda granophyre plutons were emplaced at 69.5–68.5 Ma into Deccan basalt flows. The granophyre plutons and the local basalts thus significantly pre-date the intense 66–65 Ma Deccan flood basalt phase forming the bulk of the Deccan flood basalts, in the Western Ghats as well as the northern regions including Mount Pavagadh (Baksi, Reference Baksi, Sheth and Vanderkluysen2014; Renne et al. Reference Renne, Sprain, Richards, Self, Vanderkluysen and Pande2015; Schoene et al. Reference Schoene, Samperton, Eddy, Keller, Adatte, Bowring, Khadri and Gertsch2015; Parisio et al. Reference Parisio, Jourdan, Marzoli, Melluso, Sethna and Bellieni2016). Generally, in widely separated areas of the Deccan province, field relationships (and 40Ar–39Ar data) show silicic lavas and intrusions to have been emplaced after thick flood basalt sequences. The best examples are Mount Pavagadh (Chatterjee, Reference Chatterjee1961; Sheth & Melluso, Reference Sheth and Melluso2008; Parisio et al. Reference Parisio, Jourdan, Marzoli, Melluso, Sethna and Bellieni2016), Osham Hill (Wakhaloo, Reference Wakhaloo1967; Sheth et al. Reference Sheth, Choudhary, Cucciniello, Bhattacharyya, Laishram and Gurav2012) and Mumbai (Sheth & Pande, Reference Sheth, Pande, Sheth and Vanderkluysen2014). In other flood basalt provinces of the world (such as the Karoo) also, rhyolitic lavas and ignimbrites have generally erupted towards the close or at the end of the flood basalt volcanism (e.g. Melluso et al. Reference Melluso, Cucciniello, Petrone, Lustrino, Morra, Tiepolo and Vasconcelos2008). The early silicic magmatism in the NW Deccan Traps, represented by the Barda granophyre plutonism, is therefore a novel result of this study.
We have not dated any of the Alech rocks because of their generally weathered nature, and therefore we do not know the age of emplacement of the complex relative to the main tholeiitic phase in the Deccan province at 66–65 Ma. However, the Alech complex, like the Barda complex, postdates the local Deccan basalt flows.
6.b. Petrogenesis
Silicic igneous rocks are common in intraplate extensional settings such as the Basin and Range province (e.g. Colgan et al. Reference Colgan, Dumitru, McWilliams and Miller2006), post-collisional extensional settings (e.g. Nedelec et al. Reference Nedelec, Stephens and Fallick1995) and at rifted continental margins associated with CFB volcanism (e.g. Melluso et al. Reference Melluso, Morra, Brotzu and Mahoney2001, Reference Melluso, Cucciniello, Petrone, Lustrino, Morra, Tiepolo and Vasconcelos2008; Cucciniello et al. Reference Cucciniello, Langone, Melluso, Morra, Mahoney, Meisel and Tiepolo2010, Reference Cucciniello, Conrad, Grifa, Melluso, Mercurio, Morra, Tucker, Vincent and Srivastava2011). These rocks provide important information on tectonic deformation and the generation, storage and transport of silicic magma in the continental lithosphere. Silicic rocks in general, and those in CFB provinces in particular, are known to be produced by several mechanisms, such as advanced fractional crystallization of mafic magmas (e.g. Turner et al. Reference Turner, Foden and Morrison1992; Soesoo, Reference Soesoo2000; McCurry et al. Reference McCurry, Hayden, Morse and Mertzman2008; Melluso et al. Reference Melluso, Cucciniello, Petrone, Lustrino, Morra, Tiepolo and Vasconcelos2008), crustal assimilation with fractional crystallization (AFC) (e.g. Sheth & Melluso, Reference Sheth and Melluso2008; Cucciniello et al. Reference Cucciniello, Langone, Melluso, Morra, Mahoney, Meisel and Tiepolo2010), hybridization between mantle-derived and crustally derived magmas (e.g. Wickham et al. Reference Wickham, Alberts, Litvinovsky, Bindeman and Schauble1996), partial melting of hydrothermally altered basic lavas or intrusions (e.g. Zellmer et al. Reference Zellmer, Rubin, Grönvold and Jurado-Chichay2008; Colón et al. Reference Colón, Bindeman, Ellis, Schmitt and Fisher2015), and anatexis of old basement crust (e.g. Riley et al. Reference Riley, Leat, Pankhurst and Harris2001; Shellnutt et al. Reference Shellnutt, Jahn and Zhou2011, Reference Shellnutt, Bhat, Wang, Brookfield, Dostal and Jahn2012; Zhu et al. Reference Zhu, Peate, Guo and Liu2017).
The data presented in this study show that the Barda granophyres are mainly metaluminous and have high Fe number [0.95–0.98; Fe# = FeOt/(FeOt + MgO)], Ga/Al (3.1–3.3) ratios, Zr, Nb and REE contents (Table 1). These geochemical characteristics (Ga/Al = 3.75; Zr = 528 ppm; Nb = 37 ppm) resemble those of A-type (ferroan) granitoids typical of within-plate settings (e.g. Whalen et al. Reference Whalen, Currie and Chappell1987). Similarly, the Alech rhyolites and dacites have geochemical features typical of silicic rocks of within-plate settings (e.g. Fe# = 0.81–0.99; Ga/Al = 2.6–5.5).
Direct derivation of the Barda–Alech silicic rocks by partial melting of old crustal rocks (e.g. western Indian Precambrian granites) is precluded by the Sr–Nd isotopic data, because these ancient granites have much higher 87Sr/86Sr ratios (e.g. 0.7690, Gopalan et al. Reference Gopalan, Trivedi, Merh, Patel and Patel1979) than the Barda–Alech silicic rocks. Only the Barda basaltic andesite dyke BR4 has a very unradiogenic Nd isotopic composition (ϵNdt = –30.4), similar to some ancient Indian granites (e.g. Jayananda et al. Reference Jayananda, Chardon, Peucat and Capdevila2006). This simply reflects the incorporation of old basement crust in the dyke magma, possibly the same crust whose quartzitic xenoliths are still found in this dyke.
Basic amphibolites, in the presence of a free fluid phase, produce relatively silicic (tonalitic or trondhjemitic) partial melts over a wide melting range (5–30 kbar, 750–1100 °C; e.g. Van der Laan & Wyllie, Reference Van der Laan and Wyllie1991; Winther & Newton, Reference Winther and Newton1991). However, the oldest exposed rocks in Saurashtra are Mesozoic sandstones, and no drillholes into Precambrian basement exist, so it is unknown whether amphibolites exist there. Besides, Archaean basic amphibolites analysed from Rajasthan, NW India, have average 87Sr/86Sr of 0.7151 and ϵNd of –12 (Gopalan et al. Reference Gopalan, Macdougall, Roy and Murali1990), very unlike those of the Barda–Alech silicic rocks.
The absence of primary minerals, such as muscovite, cordierite, garnet, aluminosilicates (andalusite or sillimanite) and tourmaline, in the Barda–Alech rocks (and the presence of aegirine–augite in the Barda granophyres) also excludes an origin for these rocks as anatectic melts of metasedimentary protoliths. In addition, the Barda–Alech rocks have Zr and Y contents much higher than those normally observed in anatectic, S-type leucogranites from pelitic sources worldwide (e.g. Whalen et al. Reference Whalen, Currie and Chappell1987; Bea et al. Reference Bea, Pereira and Stroh1994).
Silicic magmas derived from partial melting of garnet granulites (e.g. Verma, Reference Verma1999) or eclogites (e.g. Rapp et al. Reference Rapp, Shimizu and Norman2003) are characterized by low Y and HREE contents as a consequence of residual garnet (Schnetger, Reference Schnetger1994). The high Y (>43 ppm) and HREE (e.g. Ybn >17) contents observed in the Barda–Alech silicic rocks thus rule out garnet granulite or eclogite sources.
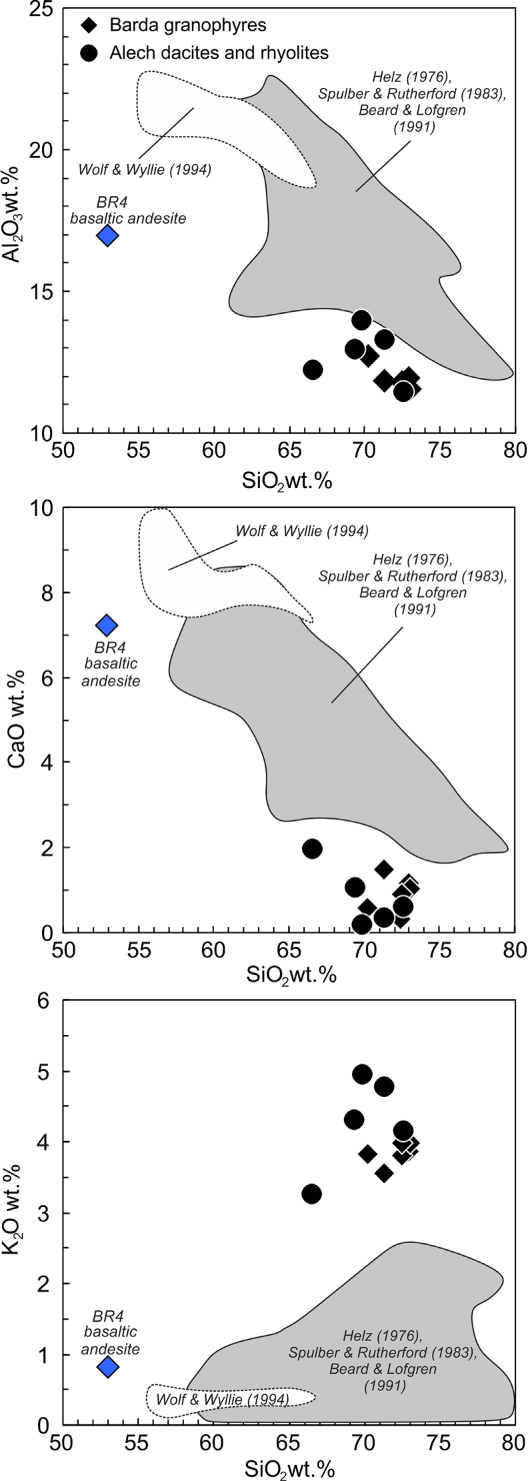
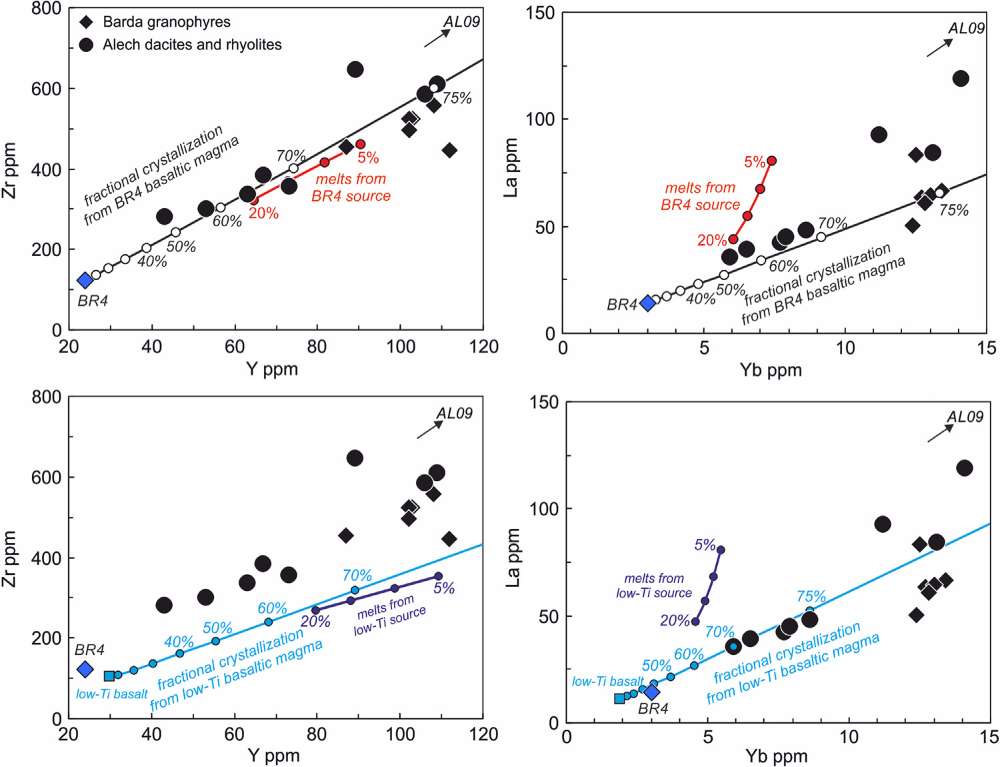
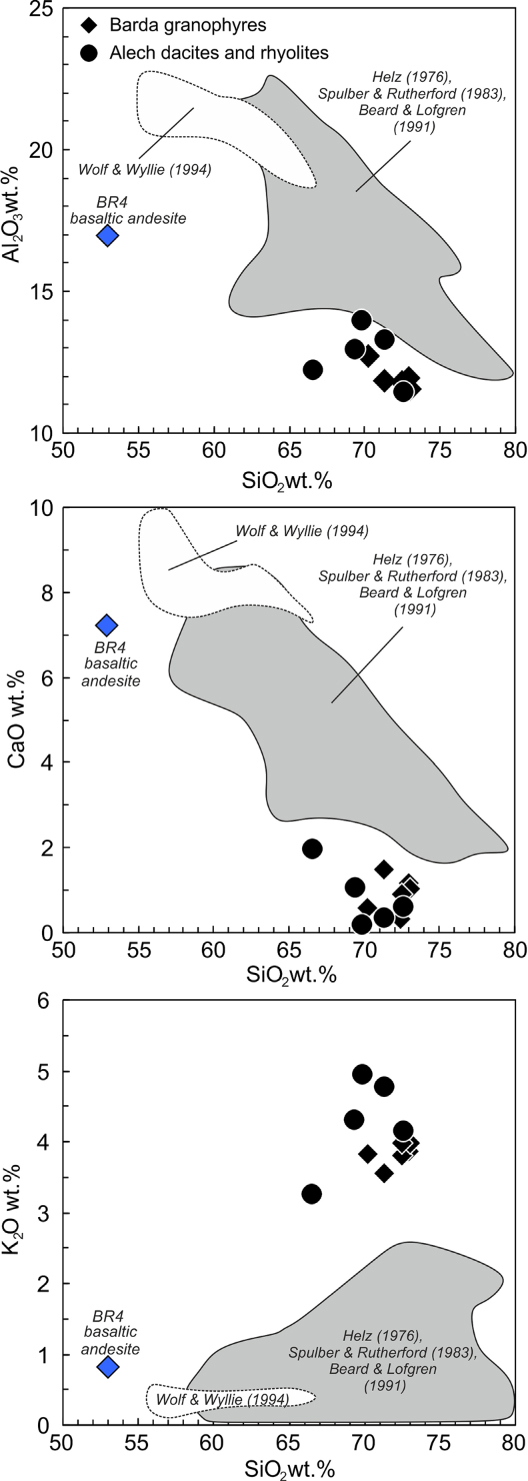
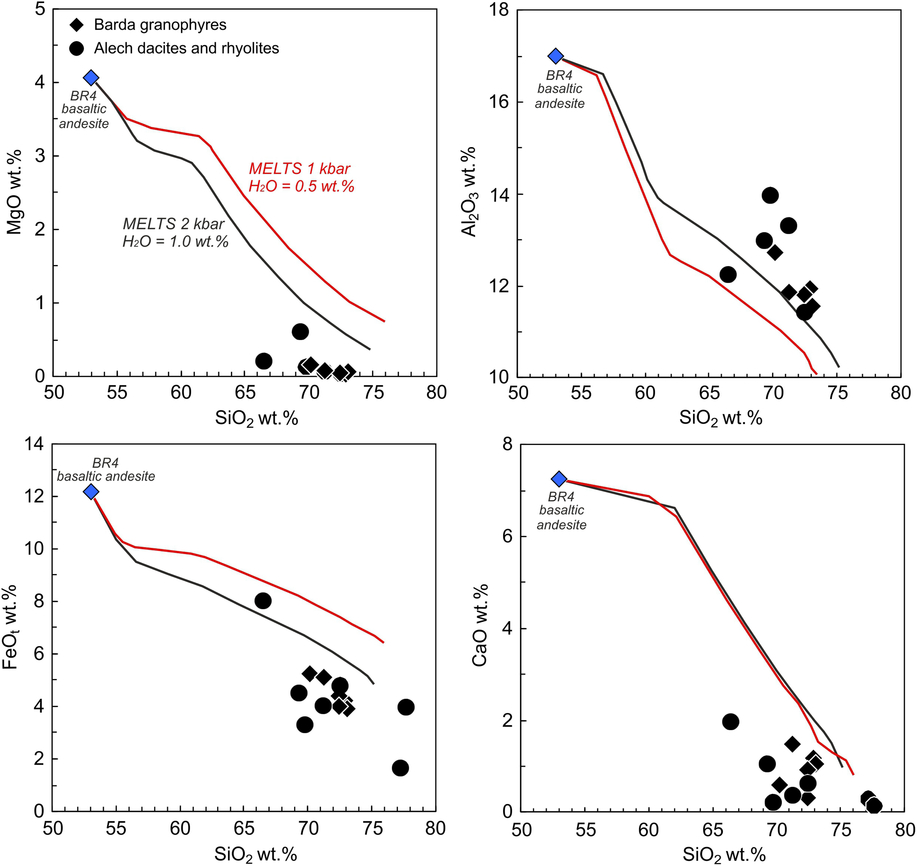
Partial melting of previously emplaced basaltic rocks or gabbroic intrusions, likely hydrothermally altered, is also a plausible hypothesis for the genesis of silicic magmas. This mechanism can explain the absence of compositions intermediate between basalt and dacite–rhyolite, and the mantle-like Sr–Nd isotopic ratios of the Barda–Alech silicic rocks. However, experimental work shows that water-saturated melting of basaltic rocks, amphibolites and greenstones at 1, 3, 6.9 and 10 kbar pressure (Helz, Reference Helz1976; Spulber & Rutherford, Reference Spulber and Rutherford1983; Beard & Lofgren, Reference Beard and Lofgren1991; Wolf & Wyllie, Reference Wolf and Wyllie1994) should produce liquids (SiO2 = 65–75 wt %) with higher Al2O3 (>14 wt %) and CaO (>2 wt %) contents and lower K2O (<2.5 wt %) contents than the Barda–Alech silicic rocks (Fig. 10). We were unable to reproduce the geochemical characteristics of the Barda–Alech silicic rocks by either fractional or batch melting mechanisms from a dry basaltic source, such as basaltic andesite BR4 composition, with no subsequent fractionation (Fig. 11). Partial melting models using other Deccan basalt compositions from Saurashtra (Melluso et al. Reference Melluso, Beccaluva, Brotzu, Gregnanin, Gupta, Morbidelli and Traversa1995) also fail to reproduce the geochemical characteristics of the Barda–Alech silicic rocks (Fig. 11).
Comparison of Barda–Alech silicic rock compositions with those of experimental liquids produced by partial melting of hydrated basaltic rocks, greenstones, and amphibolites. Fields enclose the experimental data of Wolf & Wyllie (Reference Wolf and Wyllie1994), Beard & Lofgren (Reference Beard and Lofgren1991), Spulber & Rutherford (Reference Spulber and Rutherford1983) and Helz (Reference Helz1976).
The small range of Sr–Nd isotopic variation within the Barda granophyres ((87Sr/86Sr)t = 0.705988–0.706066, ϵNdt = 0.0 to +1.1) does not permit significant open-system processes and crustal incorporation within the Barda granophyres. The slight positive correlation between (143Nd/144Nd)t and Nd concentrations, and the absence of Pb peaks and Nb troughs in mantle-normalized incompatible element patterns (Figs. 7b and 8b), also indicates that assimilation of crustal material was negligible in the genesis of the Barda granophyres and Alech samples AL1, 3, 4, 9 (group 2). Crustal contamination may have had some role in the genesis of the Alech samples AL5, 7, 8, 10, 11 (group 1) which have higher (87Sr/86Sr)t of 0.706361–0.707379 and comparatively lower ϵNdt values (–0.7 to –1.4), with Nb troughs in mantle-normalized incompatible element patterns.
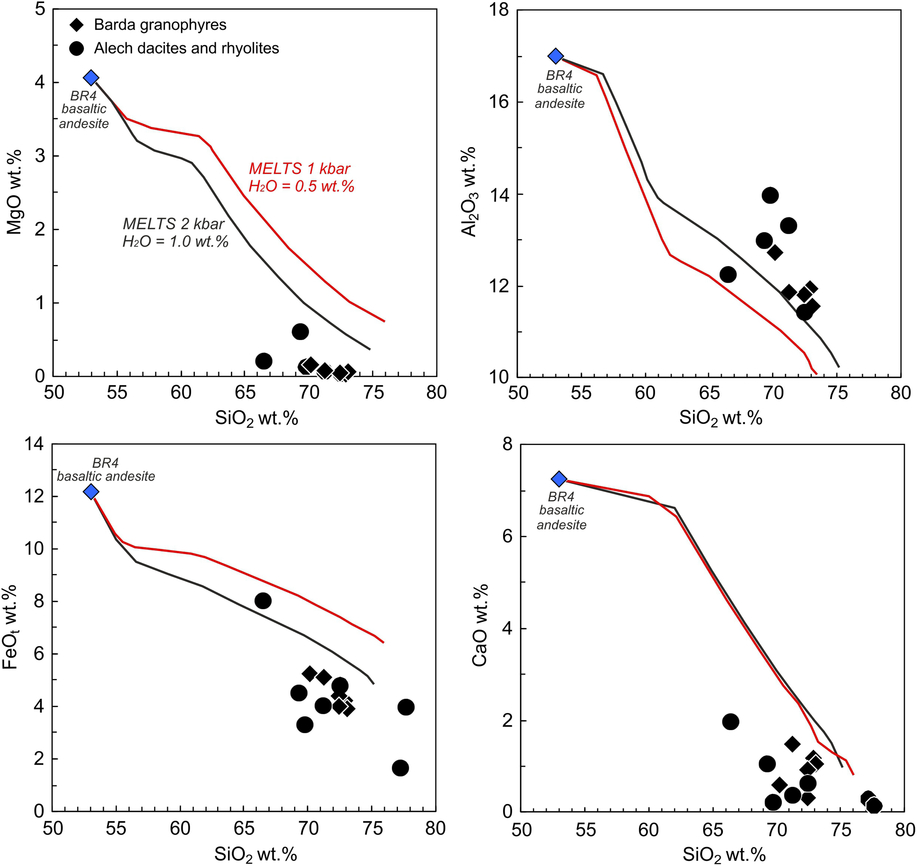
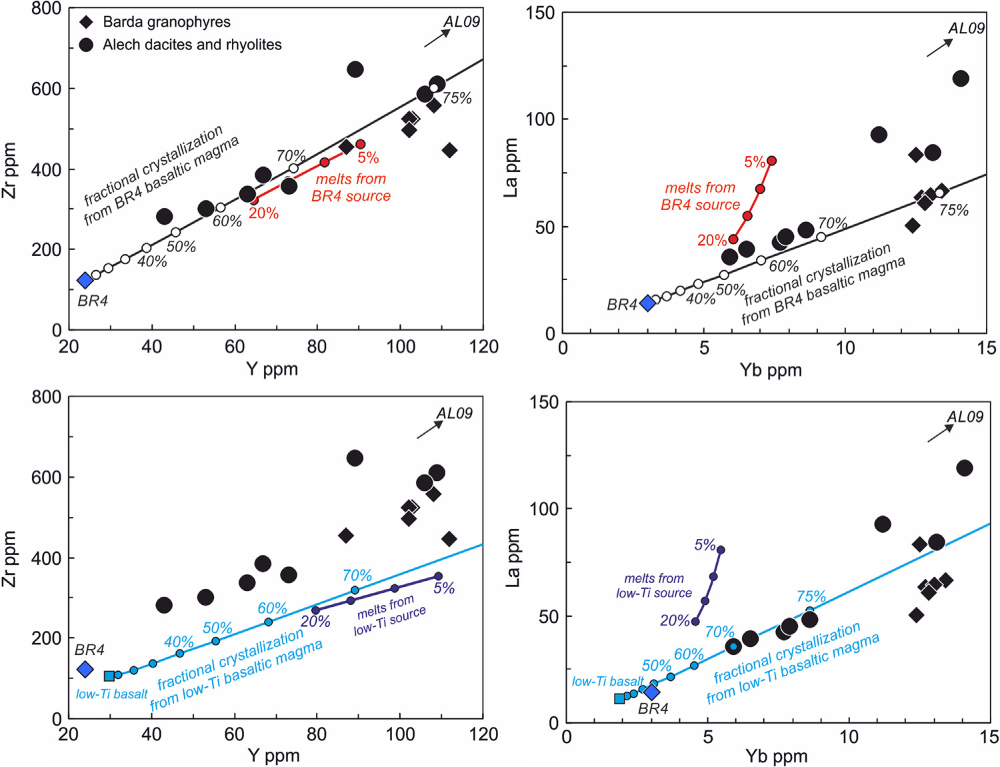
We therefore suggest that a model of advanced, nearly-closed system fractional crystallization of early basaltic melts, stored in crustal magma chambers, can explain the production of the Barda–Alech silicic rocks. Trace element abundance patterns provide convincing evidence for derivation of the Barda granophyres and Alech rhyolites by fractional crystallization of basaltic magma. Negative anomalies of Ba, Sr and Eu in the mantle-normalized multi-element patterns of the silicic rocks are suggestive of fractionation of plagioclase feldspar, whereas negative Ti anomalies suggest fractionation of Ti-bearing oxides (Figs. 7b and 8b). Using the software Rhyolite-MELTS (Gualda et al. Reference Gualda, Ghiorso, Lemons and Carley2012) we calculated the liquid lines of descent of the magmas and the composition of the residual liquid (Fig. 12). Model results indicate that at QFM oxygen buffer conditions and 1–2 kbar pressure with H2O = 0.5–1.0 wt %, the transition from basaltic andesite composition BR4 to a rhyolitic composition (SiO2 = 70.2–73.0 wt %) involves 70 % fractional crystallization, with the crystal extract composed of plagioclase (58 %), clinopyroxene (25 %) and spinel (17 %). Fractional crystallization modelling using Rayleigh fractionation equations (Fig. 11) indicates that the Barda–Alech silicic rocks could be the result of nearly-closed system fractional crystallization (∼70–75 %) of a low-Ti basaltic magma, in broad agreement with the Rhyolite-MELTS modelling results.
Variation of Zr vs Y, and La vs Yb, for Barda–Alech silicic rocks compared with model results for batch partial melting of Deccan mafic rocks and closed-system fractional crystallization (FC) of Deccan mafic magmas. The values on the batch melting model are 5 % melting increments for 5–20 % melting. Fractional melting model results are similar to those of the batch melting model. Bulk distribution coefficients (D) have been estimated using the proportions of minerals in the fractional crystallization extracts (obtained from Rhyolite-MELTS calculations) in combination with mineral–liquid distribution coefficients from the literature (GERM website; http://www.earthref.org). The numbers close to the FC curves indicate the residual liquid fraction (f). Data sources are Melluso et al. (1995, low-Ti basalt) and this study (basaltic andesite BR4). The model source for batch melting has 40 % plagioclase, 40 % clinopyroxene, 10 % olivine and 10 % magnetite in the mode; melting of these minerals is assumed to occur in proportions of 75:15:5:5, respectively (Mahoney et al. Reference Mahoney, Saunders, Storey and Randriamanantenasoa2008). The partition coefficients are from Mahoney et al. (Reference Mahoney, Saunders, Storey and Randriamanantenasoa2008).
Major (wt %) element composition of Barda and Alech rocks plotted vs SiO2 (wt %). The black and red lines represent the fractional crystallization trends predicted by Rhyolite-MELTS software (Gualda et al. Reference Gualda, Ghiorso, Lemons and Carley2012). We performed isenthalpic runs using several sets of experimental conditions [P = 1–2 kbar, H2O = 0.5–1 wt %, and fO2 = QFM (quartz–fayalite–magnetite) buffer].
Note that liquid immiscibility did not have a role in the genesis of the Barda–Alech silicic rocks, as we infer from the absence of typical features of liquid immiscibility (such as Fe-rich globules, De, Reference De1974) in the groundmass of basaltic andesite BR4.
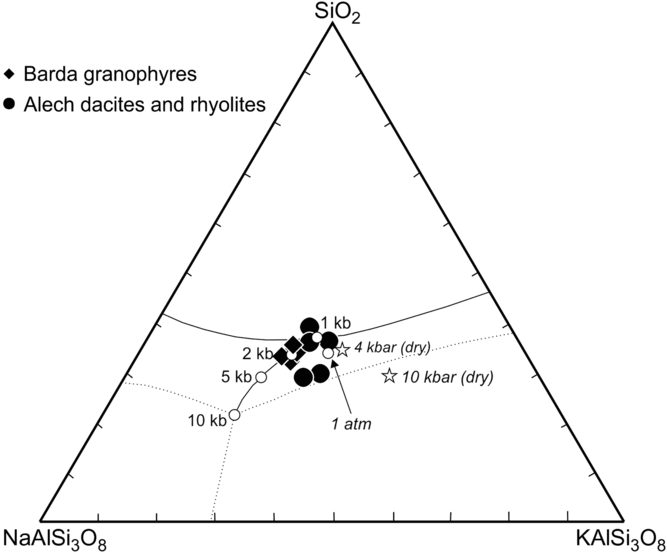
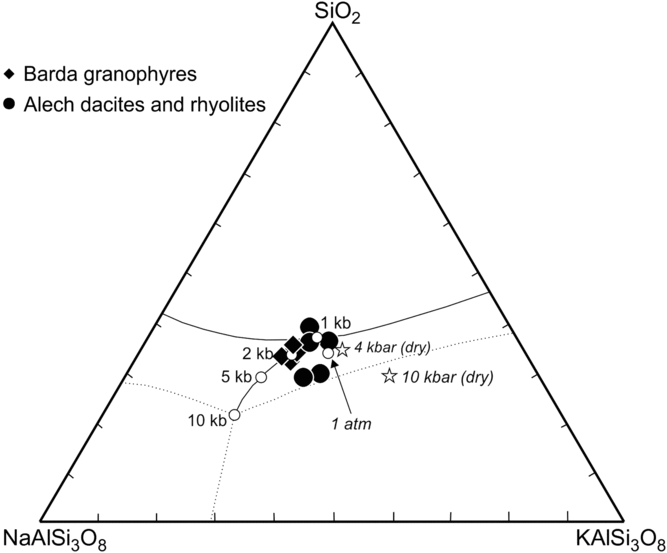
The depth at which Barda–Alech silicic magmas were stored prior to their shallower-level intrusion or extrusion is difficult to assess, as the mineral assemblage is not suitable for geobarometry. However, the presence of a small amount of primary amphibole in some of the Barda silicic rocks (Dave, Reference Dave1971; De & Bhattacharyya, Reference De and Bhattacharyya1971) indicates that the crystallizing magmas were hydrous. A semiquantitative estimate of the pressure of equilibration can be obtained using the synthetic system quartz–albite–orthoclase–H2O (Fig. 13). The Barda granophyres plot close to the water-saturated minimum compositions at 2 kbar and 3 kbar. Pressures for the Alech magmas range from 1 atm to 5 kbar, with most values at the shallower end.
Qtz–Ab–Or system with the compositions of the Barda–Alech silicic rocks plotted. The Qtz–Ab–Or proportions have been calculated from the rocks’ CIPW norms. The white circles correspond to water-saturated minima and eutectic compositions at 1 atm and 0.5–10 kbar (Schairer & Bowen, Reference Schairer and Bowen1935; Tuttle & Bowen, Reference Tuttle and Bowen1958; Luth et al. Reference Luth, Jahns and Tuttle1964; Steiner et al. Reference Subba Rao1975). White triangles correspond to minima for the anhydrous system at 4 and 10 kbar (Huang & Wyllie, Reference Huang and Wyllie1975; Steiner et al. Reference Subba Rao1975).
Residual rhyolitic melt forming by closed-system fractional crystallization of basalt represents a very small percentage of original liquid (e.g. Bowen, Reference Bowen1928; McCurry et al. Reference McCurry, Hayden, Morse and Mertzman2008; Jagoutz & Klein, Reference Jagoutz and Klein2018). Whitaker et al. (Reference Whitaker, Nekvasil, Lindsley and McCurry2008) find that potassic rhyolitic melts can form by very advanced (96–97 %) closed-system fractional crystallization of olivine tholeiite melts with 10.6 wt % MgO. Many occurrences of small volumes of interstitial granophyric or rhyolitic melts are known from Deccan tholeiitic dykes and sills (e.g. Subba Rao, Reference Steiner, Jahns and Luth1971; Sen, Reference Sen1980). What is surprising therefore is the sheer volume of granophyre and rhyolite magma that is concentrated in the Barda and Alech complexes, derived from nearly-closed system fractional crystallization of basaltic magma. This requires a very large basaltic magma chamber in the crust beneath Saurashtra. Interestingly, the Barda and Alech complexes sit atop a pronounced, wide and roughly circular-shaped gravity high and magnetic anomaly (Chandrasekhar et al. Reference Chandrasekhar, Mishra, Poornachandra Rao and Mallikharjuna Rao2002), which may indicate just such a mafic magma chamber in the upper crust (or several smaller, coalesced magma chambers). This anomaly is one of several circular-shaped gravity highs (of 40–60 mGal) and magnetic anomalies (of 800–1000 nT) mapped by Chandrasekhar et al. (Reference Chandrasekhar, Mishra, Poornachandra Rao and Mallikharjuna Rao2002) over the Saurashtra region. They modelled the Barda–Alech gravity–magnetic anomaly with mafic igneous material of density 2.88 g cm−3 in the upper crust, noting that such material in the denser lower crust would not generate an anomaly. Besides, the circular shape of the anomaly rules out Precambrian amphibolites or similar mafic rocks as its cause. Such rocks, if they exist in the Saurashtra crust, would have elongated (and commonly strongly folded) geometries, at all spatial scales, as well seen in surface outcrops in Rajasthan (e.g. Gupta et al. Reference Gupta, Arora, Mathur, Iqbaluddin, Sahai and Sharma1980).
Thus, we suggest that the Barda–Alech silicic rocks are the residual melts from advanced (70–75 %) fractional crystallization in a large mafic magma chamber located in the upper crust under these complexes. The monzodiorite reported from Sajanwala Nes (De & Bhattacharyya, Reference De and Bhattacharyya1971) may represent an intermediate-stage product of the same process. Also, such a large chamber may have produced substantial crustal heating and melting. Our present sampling is necessarily limited, and it is probable that future intensive sampling of the Barda and Alech complexes, including in the high peaks of the former, may reveal many individual plutons or lavas with a substantial crustal input.
6.c. Genesis of silicic rocks of the Deccan Traps
Shellnutt et al. (Reference Shellnutt, Jahn and Zhou2011) and Zhu et al. (Reference Zhu, Peate, Guo and Liu2017), among others, have noted the coexistence of mantle-derived and crustally derived silicic magmas in parts of the Late Permian (260 Ma) Emeishan CFB province of China. Similarly, geochemical–isotopic data available for hitherto analysed silicic rocks of the Deccan Traps (Fig. 9) indicate a combination of these processes, sometimes even for a single rock suite (e.g. Subba Rao, Reference Steiner, Jahns and Luth1971; Chatterjee & Bhattacharji, Reference Chatterjee and Bhattacharji2001; Sheth & Melluso, Reference Sheth and Melluso2008; Sheth et al. Reference Sheth, Choudhary, Bhattacharyya, Cucciniello, Laishram and Gurav2011, Reference Sheth, Choudhary, Cucciniello, Bhattacharyya, Laishram and Gurav2012), as follows:
(i) Advanced fractional crystallization of basaltic magmas: The best example of this mechanism in the Deccan, involving little crustal interaction, is the Barda–Alech silicic rocks of the present study. Some Chogat-Chamardi silicic rocks also appear to have formed in this way (Sheth et al. Reference Sheth, Choudhary, Bhattacharyya, Cucciniello, Laishram and Gurav2011). Potassic rhyolites of Rajpipla (Krishnamurthy & Cox, Reference Krishnamurthy and Cox1980), one of which has been analysed for Sr–Nd isotopic composition (Mahoney et al. Reference Mahoney, Macdougall, Lugmair, Gopalan and Krishnamurthy1985), are also suitable candidates, as is a rhyolite from Tavidar in Rajasthan (Sen et al. Reference Sen, Pande, Hegner, Sharma, Dayal, Sheth and Mistry2012).
(ii) Assimilation and fractional crystallization (AFC): In this process, progressively more fractionated melts are more crustally contaminated, as commonly observed in mafic–felsic suites. At Skye in the British Palaeogene igneous province, the granophyres have (87Sr/86Sr)t values of 0.708–0.716, higher than for associated gabbros (0.703–0.709) (Moorbath & Bell, Reference Moorbath and Bell1965). Similarly, granophyres in the Skaergaard Intrusion in East Greenland have higher Sr isotopic ratios than the bulk of the gabbros forming the intrusion (Leeman & Dasch, Reference Leeman and Dasch1978). Silicic rocks in the Chogat-Chamardi complex are also much more contaminated than the associated gabbros and have been explained by AFC processes involving mafic magmas and old basement crust (Sheth et al. Reference Sheth, Choudhary, Bhattacharyya, Cucciniello, Laishram and Gurav2011). The Mount Pavagadh dacites and rhyolites have relatively high Zr (458–536 ppm), Nb (45–60 ppm) and Y (63–112 ppm) contents and are LREE-enriched (Lan/Ybn = 7.2–11.5), and their (87Sr/86Sr)t varies from 0.70369 to 0.70826 (Sheth & Melluso, Reference Sheth and Melluso2008). These authors modelled the silicic rocks by AFC involving a starting picritic magma and old felsic crust.
(iii) Partial melting of hydrothermally altered basic lavas or intrusions: Lightfoot et al. (Reference Lightfoot, Hawkesworth and Sethna1987) proposed that Mumbai rhyolites, with high incompatible trace element contents (e.g. Zr = 1509–1801 ppm; Nb = 260–319 ppm; Y = 143–177 ppm), low (87Sr/86Sr)t ratios (0.7037–0.7074) and slightly negative ϵNdt values (–0.5 to –1.3) were derived by partial melting of basaltic intrusions in the crust due to heating by other intrusions (or by fractional crystallization of basaltic melts). The Osham Hill silicic lavas (Sheth et al. Reference Sheth, Choudhary, Cucciniello, Bhattacharyya, Laishram and Gurav2012) have low TiO2 (0.12–0.10 wt %) and relatively high Zr (410–437 ppm) and Y (136–148 ppm) contents. They are LREE-enriched, with Lan/Ybn ranging from 7.9 to 8.6. The Osham rhyolites have ϵNdt = –3.1 to –6.5, and (87Sr/86Sr)t values from 0.70709 to 0.70927. Notably, these silicic lavas have the same Al2O3 contents as the underlying mafic flows, and therefore Sheth et al. (Reference Sheth, Choudhary, Cucciniello, Bhattacharyya, Laishram and Gurav2012) considered an origin by fractional crystallization of mafic melts (i.e. involving substantial plagioclase) untenable. They suggested an origin of the Osham silicic lavas by partial melting of hydrothermally altered and K-metasomatized basaltic lavas or crustal intrusions, as proposed for some Icelandic rhyolites (Zellmer et al. Reference Zellmer, Rubin, Grönvold and Jurado-Chichay2008).
(iv) Anatexis of old basement crust: A role for anatexis of ancient basement crust in the genesis of Deccan silicic magmas, as advocated by Subba Rao (Reference Steiner, Jahns and Luth1971), appears valid for some of the Rajula rhyolites (Chatterjee & Bhattacharji, Reference Chatterjee and Bhattacharji2001, Reference Chatterjee, Bhattacharji, Sheth and Pande2004). It also seems valid for several of the Chogat-Chamardi granophyres and rhyolites (Sheth et al. Reference Sheth, Choudhary, Bhattacharyya, Cucciniello, Laishram and Gurav2011), which have TiO2 in the range 0.26–1.1 wt % and moderate to high Zr (373–1209 ppm) and Y (69–117 ppm) contents, and are LREE-enriched, with Lan/Ybn of 3.0–5.0. Their (87Sr/86Sr)t ratios are higher than 0.7275, and ϵNdt values range from +0.6 and –3.0 (Chamardi granophyres) to as low as –12.4 and –13.9 (Chogat rhyolites). The Tavidar rhyolite Tav07 may owe its very high (87Sr/86Sr)t to weathering, however (Sen et al. Reference Sen, Pande, Hegner, Sharma, Dayal, Sheth and Mistry2012).
Considered as a whole, Sr isotopic data for the Deccan silicic rocks hitherto available show a large gap, from about 0.7095 to 0.7275 (Fig. 9), separating those with little or no crustal input from those with very strong crustal input or of entirely crustal derivation. Nd isotopic compositions of the rocks show much greater continuity than Sr isotopic compositions.
7. Conclusions
The Barda and Alech complexes in the Saurashtra region of the Deccan CFB province, India, are the largest silicic complexes in this province. The Barda complex is mainly composed of coalesced granophyre plutons. The Alech complex is made up dominantly of rhyolite and dacite which are probably ring-fracture lavas and lava-like ignimbrites. Despite early studies (Adye, Reference Adye1914; Dave, Reference Dave1971; De & Bhattacharyya, Reference De and Bhattacharyya1971), neither complex has received much study by modern geoanalytical methods.
In this study we have provided basic geological information on both complexes, which we hope to substantially expand on in the future. We have also provided petrographic and mineral chemical data and whole-rock geochemical (major and trace element and Sr–Nd isotopic) data, and 40Ar–39Ar ages of three Barda granophyres. These ages indicate that the Barda granophyre intrusions are 69.5–68.5 Ma in age, and they and the Deccan basalt flows they intrude are thus significantly older (by 3–4 My) than the major 66–65 Ma flood basalt eruptive phase in the Deccan province (Baksi, Reference Baksi, Sheth and Vanderkluysen2014; Renne et al. Reference Renne, Sprain, Richards, Self, Vanderkluysen and Pande2015; Schoene et al. Reference Schoene, Samperton, Eddy, Keller, Adatte, Bowring, Khadri and Gertsch2015; Parisio et al. Reference Parisio, Jourdan, Marzoli, Melluso, Sethna and Bellieni2016). Whereas silicic magmatism (lava flows and intrusions) typically postdates thick sequences of flood basalts in the Deccan Traps, as well as in other CFB provinces of the world, the early silicic magmatism represented by the Barda granophyre plutonism is a novel result of considerable interest. It also indicates that the total duration of Deccan magmatism was no less than 8 Ma (see e.g. Sheth & Pande, Reference Sheth, Pande, Sheth and Vanderkluysen2014 and references therein).
Though xenoliths of probable basement crust (the only ones known so far from Saurashtra) are present in a basaltic andesite dyke cutting the Barda granophyres, geochemical–isotopic data show little involvement of ancient basement crust in the genesis of the Barda–Alech silicic rocks. These data show that partial melting of several types of old basement lithologies (Indian Precambrian granitoids, amphibolites, metasedimentary rocks, garnetiferous granulites or granites), or partial melting of Deccan-age basaltic lavas or gabbro intrusions (possibly hydrothermally altered) within the Saurashtra crust, cannot have produced the Barda–Alech silicic rocks.
On the other hand, the geochemical–isotopic data indicate derivation of the Barda–Alech silicic rocks by prolonged, nearly-closed system fractional crystallization from low-Ti basaltic magmas stored in magma chambers located in the upper or middle crust. From the size of the Barda and Alech complexes (each tens of kilometres in diameter), a very large mafic magma chamber is indicated, and is reflected in the pronounced, circular-shaped gravity high and magnetic anomaly mapped over these complexes (Chandrasekhar et al. Reference Chandrasekhar, Mishra, Poornachandra Rao and Mallikharjuna Rao2002).
The 69–68 Ma Barda granophyre plutonism took place in a within-plate setting, and along what was to become a future (62.5 Ma) rifted continental margin (Bhattacharya & Yatheesh, Reference Bhattacharya, Yatheesh and Mukherjee2015). The Barda granophyre plutonism may be viewed in the larger context of subaerial to shallow-marine 75–68 Ma volcanism that occurred WNW of Saurashtra, forming the Saurashtra Volcanic Platform (Calvès et al. Reference Calvès, Schwab, Huuse, Clift, Gaina, Jolley, Tabrez and Inam2011; Bhattacharya & Yatheesh, Reference Bhattacharya, Yatheesh and Mukherjee2015). The voluminous, basalt fractionation-derived silicic magmatism in the Barda and Alech complexes is important in understanding the temporal evolution of Deccan flood basalt volcanism, and the genesis of silicic magmas in CFB provinces and in anorogenic, intraplate settings in general.
Supplementary material
To view supplementary material for this article, please visit https://doi.org/10.1017/S0016756818000924.
Author ORCIDs
Ciro Cucciniello 0000-0003-1908-0963
Acknowledgements
Field work was supported by the Industrial Research and Consultancy Centre (IRCC, IIT Bombay) grant 09YIA001 to Sheth. Many thanks to Sergio Bravi for the preparation of thin sections and to Roberto de’ Gennaro for his assistance in microprobe work. Funds for EPMA and whole-rock analyses by Cucciniello were provided by Italian MIUR (PRIN 2015, 20158A9CBM to L. Melluso) and Fondi Ricerca di Ateneo (DR_3450_2016 to C. Cucciniello). Pande acknowledges Grant No. IR/S4/ESF-04/2003 from the Department of Science and Technology (Government of India) towards the development of the IIT Bombay-DST National Facility for 40Ar–39Ar Geo-thermochronology. He also thanks the IRCC, IIT Bombay, for maintenance support to the Facility (grant no. 15IRCCCF04). We thank Nilanjan Chatterjee for valuable critical comments on an earlier version of this work. Constructive reviews of the present paper by Greg Shellnutt and Sheila Seaman and the editorial handling of Chad Deering are much appreciated.