




No CrossRef data available.
Article contents
Differential infectivity and immunopathology in murine experimental infections by two natural clones belonging to the Trypanosoma cruzi I lineage
Published online by Cambridge University Press: 09 March 2005
Abstract
Immunopathology of Chagas' disease in Balb/c mice infected with 2 Trypanosoma cruzi clones, belonging to the T. cruzi I lineage and presenting different in vitro virulence (P/209 cl1>SO34 cl4) was compared. In the acute phase, evading mechanisms such as parasite-induced lymphocyte polyclonal activation and T cell immunosuppression were higher in mice infected with the clone giving a higher parasitaemia (P/209 cl1). A similar increase of non-specific isotypes was observed in both infections with IgG2a prevalence. Interestingly, CD8+ cell hypercellularity and lymphocyte immunosuppression were observed during the chronic phase (245 days post-infection) in mice infected by the most virulent clone. In the same way, the parasite-specific antibody response was more intense in P/209 cl1-infected mice over the acute phase. During the chronic phase this response remarkably dropped down in SO34 cl4-infected mice exclusively. Finally, P/209 cl1-infected mice presented a more severe inflammation and tissue damage in heart and quadriceps than SO34 cl4-infected mice. This comparative study showed differences between the two clones: a higher virulence in vivo being clearly associated with a greater ability to induce evasion mechanisms and severe tissue damage.
Information
- Type
- Research Article
- Information
- Copyright
- © 2005 Cambridge University Press
INTRODUCTION
Chagas' disease (American trypanosomiasis) caused by the haemoflagellate protozoan parasite Trypanosoma cruzi, affects nearly 18 million people in endemic regions of Central and South America and is transmitted by haematophagous insects of the Reduviidae family (WHO, 2002). The infection is characterized by an acute phase with intense parasitism, followed by an asymptomatic phase with subpatent parasitaemia. Most of the patients will remain in this phase during the rest of their life. In about 30% of them, however, the infection progresses to a chronic stage consisting of chronic cardiomyopathy and/or gastrointestinal dysfunction (megaviscera). The mechanisms of pathogenesis are still under debate and the understanding of the factors responsible for the development and control of the pathogenesis is hindered by the high diversity of parasite strains.
Most of the recent works converge to a clustering of T. cruzi strains into 2 principal lineages namely T. cruzi I and T. cruzi II (Momen, 1999). Further subdivision of T. cruzi II into 5 subgroups is described while no subdivision is apparent within T. cruzi I (Barnabé, Brisse & Tibayrenc, 2000; Brisse, Dujardin & Tibayrenc, 2000). Although a number of studies have reported that genetic variability among parasite strains could be related to the disease phenotype during murine experimental infections (parasitaemia, histopathology, mortality) other investigators have demonstrated that significant differences occurred even in the case of genetically related T. cruzi clones (Carneiro, Romanha & Chiari, 1991; Andrade & Magalhaes, 1996; Laurent et al. 1997; de Diego, Paulau & Penin, 1998; Revollo et al. 1998; Toledo et al. 2002). On the other hand, current biological and epidemiological data support the existence of a link between T. cruzi II and human infection, whereas T. cruzi I is essentially detected in the sylvatic cycle (Clark & Pung, 1994; Zingales et al. 1999; Di Noia et al. 2002). Some authors proposed that T. cruzi II only was responsible for Chagas disease (Di Noia et al. 2002; Barrett et al. 2003). However, in Venezuela, Colombia, Central America and Mexico, human pathologies are frequently observed, while T. cruzi I lineage is highly predominant (Miles et al. 1981; Higo et al. 1997; Bosseno et al. 2002; Montilla et al. 2002; WHO, 2002).
Infectivity of T. cruzi is a complex process depending on the parasite's ability to complete its replicative intracellular cycle and to evade the host immune response. During the infection, the mammalian host develops both a parasite-specific immune response participating in protective immunity (Krautz, Kissinger & Krettli, 2000), and a non-specific polyclonal lymphocyte activation detrimental to an efficient immunity (Minoprio et al. 1986; Minoprio, 2001). This last mechanism, together with the induction of an immunosuppressive state in the host is believed to contribute to parasite evasion (Ouaissi et al. 2001).
We describe in the present study the biological characterization of 2 T. cruzi clones belonging to the same major lineage (T. cruzi I) but exhibiting different levels of virulence, such as parasite development and host immune response. A broad immunological survey was performed in which the two main parasite evading mechanisms, i.e. the lymphocyte polyclonal activation and the immunosuppression, were examined during the course of the infection. We also measured the parasite-specific humoral response. Through the comparison of immunological and pathological data, this study provides new clues for a better understanding of the biological differences observed between strains even for genetically tightly related ones.
MATERIALS AND METHODS
Parasite strains
The T. cruzi laboratory clones, obtained by microscopical control, P/209 cl1 and SO34 cl4 from strains isolated in Bolivia from a chronic chagasic patient and a Triatoma infestans vector, respectively, were used throughout the study. These clones were originally both classified by isoenzyme typing as zymodeme 20 belonging to T. cruzi I (Brenière et al. 1989, 1991). During the current study, in order to confirm their T. cruzi I classification, the intergenic region of the mini-exon genes was amplified from each clone according to Souto et al. (1996). Moreover, the Tc52 gene was sequenced and aligned with Tc52 sequences of other T. cruzi clones available in Genbank. This analysis confirmed that the two clones belong to T. cruzi I and showed that they differ by one mutation only over 1361 bp for this gene. Epimastigotes used for antigen preparation, were grown at 28 °C in liver tryptose medium (LIT) supplemented with 10% fetal calf serum (FCS, Gibco BRL, Lyon, France), 100 U/ml penicillin and 100 μg/ml streptomycin. Bloodstream trypomastigotes (BT), were obtained from BALB/c mice (IFFA-CREDO, Lyon, France) infected intraperitoneally (i.p.) with tissue culture-derived trypomastigotes recovered from the supernatant of infected monolayers of L929 fibroblasts. Bloodstream trypomastigotes were collected from mice by intracardiac puncture 15 days post-infection (p.i.) and immediately used for the experimental infection assays.
Fibroblast cell infections
L929 fibroblast cells were maintained in complete RPMI 1640 L-glutamine medium (Cambrex, Verviers, France) supplemented with 10% FCS, 100 U/ml penicillin and 100 μg/ml streptomycin (RPMIc). After mitomycin treatment (25 μg/ml, during 30 min), the cells were transferred to a 6-well Costar plate (5×10⁴ cells per well) and incubated overnight at 37 °C in a 5% CO2 atmosphere. Cells were then washed with RPMI, and exposed to tissue culture-derived trypomastigotes in RPMIc from either P/209 cl1 or So34 cl4 (2·5×105 per well). After 3 h, the plates were washed 3 times with RPMI and incubated in RPMIc. Infection kinetics were followed as triplicates at 24, 48, 72, and 96 h p.i. Basically, cell wells were exposed to cold methanol for 10 min, air-dried and Giemsa-stained for 20 min. A total of 600 fibroblasts were examined under a light microscope at every time-point. The infection rate was calculated as the average (triplicate) of the number of infected cells/200 cells. The kinetics of amastigote multiplication was estimated by counting intracellular parasites in 150 infected cells (50 cells/well) at every time-point.
Experimental infections in mice, parasitaemia and tissue collection
Male 6 to 8-week-old BALB/c mice of 20–25 g corporal weight were used in the experimental assay. Six groups of 6 mice each were infected i.p. with 103 BT (either P/209 cl1 or So34 cl4) in 0·5 ml of RPMI medium, or parasite-free RPMI medium (controls). Animal procedures were carried out at the IRD-approved facilities (license no. 34–18). Parasitaemias were determined on individual 5 μl-blood samples taken from the tails and observed under a light microscope for BT counting according to Brener (1962); the limit of detection was 3·5×104 parasites/ml. For the immunopathological survey, 1 group of infected mice (either P/209 cl1 or So34 cl4), along with a group of control mice, was sacrificed at 13, 28, 37, 45, 63 days, (acute phase) and 245 days (chronic phase) p.i. after parasitaemia determination. Spleen, heart, quadriceps and blood were collected from every individual at the different time-points. Hearts and quadriceps were treated for histological analysis. Spleens were used for flow cytometry counting and proliferation assays. Sera were kept at −80 °C until use. Additionally, 100 μl of blood were collected at 245 days p.i and frozen for further individual parasite detection by polymerase chain reaction (PCR).
PCR-based parasite detection in blood samples
Blood samples (100 μl) of infected and control mice, were diluted 1[ratio ]1 (v/v) with ultrapure water and boiled twice for 10 min. After centrifugation (8000 g, 10 min), 10 μl of the supernatants were used as a template for PCR. The amplification of the 195-base-pair (bp) DNA repeat sequences (approximately 9% of the nuclear DNA) was performed according to Moser, Kirchhoff & Donelson (1989), with slight modifications. Briefly, samples were amplified in PCR Master Mix reaction buffer (Promega, Madison, WI, USA) containing 0·2 μM of each primer, TCZ1 and TCZ2 as previously published (Moser et al. 1989), in a total reaction volume of 50 μl. Amplification was performed on a Perkin Elmer, Gene Amp PCR system 2400 (Perkin Elmer, Courtaboeuf, France). PCR initiates with a 5 min at 95 °C step followed by 30 cycles of denaturation (95 °C, 1 min), annealing (53 °C, 1 min, 30 sec), and elongation (72 °C, 2 min). The PCR products were loaded onto 1·5% agarose gels and visualized under UV illumination after ethidium bromide staining.
Spleen cell culture and proliferation assays
Spleens from P/209 cl1 and So34 cl4-infected mice as well as controls were gently dissociated in phosphate buffer saline (PBS, pH 7·4) supplemented with 2% FCS to obtain spleen cell suspensions. After 3 washes, cells were resuspended in 10 ml of the same buffer. An aliquot fraction of the cell suspension was treated with 0·5 μg/ml propidium iodide to exclude dead cells and subjected to flow cytometry to determine total spleen cell counts. Spleen cells adjusted to 107 viable nucleated cells per ml were then cultured (2·5×105 cells/well) for 48 h in a final volume of 200 μl in RPMIc medium supplemented or not (control) with anti-CD3 monoclonal antibody (Pharmingen, San Diego, CA, USA) at 2·5 μg/ml. Proliferative activity of T cells was evaluated after a 16 h-pulse with 1 μCi of [3H] thymidine (Amersham, Arlington Heights, IL, USA). Pulsed spleen cells were harvested on a glass filter using an automated multiple sample harvester (Perkin Elmer, Courtaboeuf, France), and air-dried. Incorporation of [3H]thymidine was then determined by liquid scintillation counting. Assays were carried out in triplicates and the mean of counts per minute (cpm) associated to stimulated and unstimulated (controls) T cells was recorded for every animal. A proliferation index was calculated for every mouse as the ratio of cpm-stimulated T cells over cpm-non-stimulated T cells.
Flow cytometry analysis
Spleen cells prepared as above were washed 3 times with PBS (pH 7·4) containing 2% FCS and distributed into a 96-well microtitre culture plate (100 μl/well) at a concentration of 107 cells/ml. The cells were incubated (v/v) with a saturating concentration (1[ratio ]100) of fluorescein isothiocyanate (FITC)-conjugated rat anti-mouse CD8 (Ly-2) mAb (Pharmingen), FITC-conjugated rat anti-CD4 (L3T4) mAb (Pharmingen), FITC-conjugated goat anti-mouse IgM (Southern Biotechnology, Birmingham, AL) or FITC-conjugated rat anti-mouse macrophage F4/80 antigen (Caltag Laboratories, Burlingame, CA). Propidium iodide (0·5 μg/ml) was added before analysis. Flow cytofluorometric analysis was performed in a fluorescence-activated cell sorter (Becton Dickinson, Mountain View, CA, USA). Detectors for forward (FSC) and side (SSC) light scatter were set on a linear scale, whereas logarithmic detectors were used for all three fluorescence channels (FL-1, FL-2 and FL-3). All data were analysed using the CellQuest software.
Enzyme-linked immunosorbant assay (ELISA) for mice sera
Falcon flexible flat-bottom 96-well microtitre plates (Becton Dickinson, Le Pont de Claix, France) were coated overnight at 37 °C in 50 mM carbonate buffer (pH 9·6) with 16·8 μg/ml rabbit anti-mouse immunoglobulin polyspecific (Tebu, Le Perray-en-Yvelines, France) or 0·8 μg/ml of T. cruzi extracts from P/209 cl1 and So34 cl4 epimastigotes, or 0·8 μg/ml of the Tc24 recombinant protein (Taibi, Espinoza & Ouaissi, 1995). After washing 5 times in PBS pH 7·4 containing 0·5% Tween-20 (PBS-T), the plates were blocked for 2 h at 37 °C with 5% FCS in PBS (200 μl/well), washed 5 times and incubated 2 h at 37 °C with either 50 μl of serum serial dilutions when total immunoglobulins were analysed or 1/200 diluted sera for specific antibody detection, in hypertonic PBS (NaCl 88 g/l) with 10% FCS and Tween-20 0·05% (PBS-H). After washing with PBS-T as mentioned above, the plates were incubated for 30 min at 37 °C with antibodies specific to mouse immunoglobulin isotypes, horseradish peroxidase conjugated (anti-IgM, anti-IgG1, anti-IgG3, anti-IgG2a and anti-IgG2b; Caltag Laboratories) diluted 1[ratio ]1000 in PBS-H buffer. Finally, the plates were incubated in 0·1 M citrate buffer pH 5 containing 400 μg/ml of o-phenylenediamine (Sigma-Aldrich, Steinheim, Germany) and l μl/ml of hydrogen peroxide (30 vol. solution). The reaction was stopped with 50 μl of 2 M HCl. Optical densities were recorded at 490 nm. Results are expressed as the ratio of optical density obtained for each infected mouse over the optical density average of non-infected mice +2 standard deviations.
Histopathological analysis
The hearts and quadriceps collected from the groups of 6 mice (either infected or control mice) were fixed in 4% paraformaldehyde and routinely processed for paraffin embedding for conventional histology. Sections (5 μm thick) were stained with haematoxylin and eosin (H&E). For every animal, a series of 3 successive longitudinal sections of heart and quadriceps was analysed by light microscopy. The proportion of tissue area presenting inflammatory cells was estimated over the total sections of heart and quadriceps and the localization of the heart inflammation was recorded.
Statistical analysis
The comparison between 2 mean values for 2 unpaired series of data was statistically analysed by the nonparametric test of Rank Sum Test using the Statistix software. This test is as powerful as the Two-Sample T Test and exact P-values are given for small sample sizes. The Chi 2 test was used to compare distributions between categories and Chi 2 Yates correction was applied when at least one of the expected values was <5.
RESULTS
In vitro and in vivo infectivity
The T. cruzi P/209 cl1 and So34 cl4 clones were compared for their in vitro infectivity by exposing 5×10⁴ fibroblast cells to a suspension of cell-cultured trypomastigotes (2·5×105) for 3 h. The percentage of infected fibroblasts determined 24 h p.i. was found to be greater in cells infected with P/209 cl1 than in cells infected with So34 cl4 (38·5% and 8·6% respectively; P<0·05). Moreover, P/209 cl1 presented a faster rate of intracellular multiplication than So34 cl4 as evidenced by the follow-up of the intracellular amastigote number over 150 infected cells counted at 24, 48, 72, and 96 h p.i. (Fig. 1; Chi 2, P<10−4). In addition, an early release of trypomastigote forms at 96 h p.i. was observed for P/209 cl1 compared to 168 h p.i. for So34 cl4 (data not shown).

Fig. 1. L929 fibroblasts were infected with Trypanosoma cruzi P/209 cl1 or So34 cl4 and the number of amastigotes per cell was evaluated by counting intracellular parasites under a light microscope in 150 infected cells. Data are presented as the number of fibroblasts infected with 1 to 4, 5 to 20, 21 to 49, and >50 amastigotes per cell 96 h p.i.
Parasite infectivity was also determined in vivo by inoculating mice with 103 BT, and by counting circulating parasites 13, 28, 37, 45, 63, and 245 days p.i. under a light microscope (Fig. 2). A rapid increase in the parasite counts was observed for both clones. At the maximum of parasitaemia (28 days p.i), the parasite load was about 2-fold higher for P/209 cl1 than So34 cl4 (P<0·01). Then, the parasite load decreased in a similar manner in both sets of infected-mice and was almost undetectable in the late acute phase (63 days p.i.) as well as in the chronic phase (245 days p.i.). In order to improve the sensitivity of the parasite detection, blood samples collected 245 days p.i. were analysed by PCR for the amplification of T. cruzi minisatellite DNA repeats. According to this procedure, 3 out of 6 blood samples were positive in the P/209 cl1-infected group, while all other samples (So34 cl4-infected group and controls) were negative.

Fig. 2. Average parasitaemia in blood of Balb/c mice infected with 103 BT trypomastigotes of P/209 cl1 or So34 cl4 during the acute (13, 28, 37, 45, and 63 days p.i.) and chronic phases (245 days p.i.). Data are arithmetic means (±S.D.) of 6 mice per group of infected mice. Black and grey squares refer to BT counts found in P/209 cl1 and So34 cl4-infected mice, respectively. **P<0·001.
Polyclonal activation in infected mice
The spleen cell population was examined over the infection in mice infected with each clone of T. cruzi. During the acute phase, the total number of spleen cells increased in both sets of infected mice reaching a maximum of hypercellularity 37 to 45 days p.i. and then decreased to control levels 63 days p. i. (Fig. 3A). However, 37 days p.i., mice infected with P/209 cl1 presented twice the amounts of cells counted in mice infected with So34 cl4 (P<0·01). Total spleen cell counts were similar to controls in the chronic phase (245 days p.i.) for both groups of infected mice.

Fig. 3. (A) Kinetics of total spleen cell counts from mice infected with P/209 cl1 (black squares), So34 cl4 (grey squares), or from control animals (open circles). (B) Spleen lymphocyte subset populations and macrophages in mice infected with P/209 cl1 (black bars) or So34 cl4 (grey bars) and control (white bars) at 37 days p.i. Data are expressed as the absolute number of cells counted per spleen. Data are arithmetic means (±S.D.) of 6 mice per group. Asterisks indicate time-points showing significant differences between both groups of infected mice (*P<0·05; **P<0·001).
Similarly, for both groups of infected animals, the number of lymphocyte subpopulations (CD4+ and CD8+ T cells, B cells) and macrophages significantly increased from the beginning (13 days p.i.) and all over the course of the acute phase compared to control mice (data not shown). Such a hypercellularity was particularly striking for the CD8+ T cells, which were 30-fold higher 37 days p.i. in mice infected with P/209 cl1 than in control mice (P<0·001, Fig. 3B). At this time the CD4+[ratio ]CD8+ ratio dropped dramatically in both infections as a consequence of the sharp increase in the number of CD8+ (Fig. 4). Furthermore, significant differences in CD4+ T cell and B lymphocyte counts were observed 37 days p.i. between P/209 cl1 and So34 cl4-infected mice, as shown by higher cell numbers for P/209 cl1 (P<0·05, Fig. 3B). In the chronic phase (245 days p.i.), the lymphocyte subpopulations and macrophages almost returned to control levels except for B and CD8+ T cells that still displayed significantly higher counts in mice infected with P/209 cl1 than in controls (P<0·05; data not shown). The CD4+[ratio ]CD8+ ratio remained low (Fig. 4).

Fig. 4. CD4+: CD8+ spleen cell ratio from mice infected with P/209 cl1 (black bars) or So34 cl4 (grey bars) and control (white bars) at 37 and 245 days p.i. Data are arithmetic means (±S.D.) of 6 mice per group. The asterisk indicates the time-point showing a significant difference between both groups of infected mice (*P<0·05).
The magnitude of the total immunoglobulin responses (Ig) was measured during the acute phase (13, 28, 37 and 45 days p.i.). The different isotypes, i.e. IgM, IgG1, IgG2a and IgG2b, were determined by ELISA in the serum of infected and control mice. Both parasite clones induced a significant increase of the IgG2a isotype only. Titres measured 37 and 45 days p.i. were 100-fold and 60-fold higher than in controls in P/209 cl1 and So34 cl4-infected mice, respectively. Nevertheless, no significant difference was observed between both sets of infected animals (P>0·05) (data not shown).
Immunosuppression associated with the infection
Spleen cells isolated from T. cruzi P/209 cl1 or So34 cl4-infected mice at various times over the acute (13 and 37 days p.i.) and chronic phases were analysed for their proliferative response to a specific T cell mitogen, the monoclonal anti-CD3 antibody (Fig. 5). An early inhibition of the proliferative response was observed for both groups of infected mice (13 days p.i.). The inhibition of the T cell proliferation was even stronger 37 days p.i. with a proliferation index 15-fold (P/209 cl1) and 5-fold (So34 cl4) lower than in controls. Moreover, the immunosuppression was significantly more intense in mice infected with P/209 cl1 than in So34 cl4-infected animals (P<0·05, Fig. 5). Surprisingly, in the chronic phase (245 days p.i.), an immunosuppression state was still observed in mice infected with P/209 cl1, while a normal proliferative response was restored in mice infected with So34 cl4 (Fig. 5).

Fig. 5. Ex vivo spleen cell proliferation as measured by [3H]thymidine incorporation in response to anti-CD3 stimulation. A proliferation index was calculated for every mouse as the ratio of [3H]thymidine incorporation (cpm) by mitogen-stimulated over non-stimulated T cells. Data are expressed as arithmetic average (±S.D.) of proliferation index of 6 mice in each group infected with P/209 cl1 (black bars), So34 cl4 (grey bars), or control mice (white bars). Asterisks indicate significant differences in the proliferate response of both groups of infected mice (*P<0·05).
Isotype profile of anti-T. cruzi Ig over the infections
Sera collected from infected and control mice during the acute and chronic phases of the infection were examined to assess the concentrations of antibodies that recognized either total parasite-extracts (from P/209 cl1 and So34 cl4) or the recombinant Tc24 protein specific of T. cruzi. Both infections elicited the production of anti-T. cruzi antibodies (IgM, IgG1, IgG2a, IgG2b and IgG3) during the acute phase (Fig. 6). However, after 9 months (245 days p.i.), high concentrations of parasite-specific antibodies were still present in the serum of P/209 cl1-infected mice, but were almost undetectable in mice infected with So34 cl4. The measurement of antibody expression over the infection ranked IgG2a >IgG1 >IgG2b >IgG3 for both groups of infected mice with a large predominance of IgG2a and a similar expression of the other isotypes. However, the expression of all isotypes was much higher in mice infected with P/209 cl1 than in So34 cl4-infected mice, this result being independent of the T. cruzi extract (from either P/209 cl1 or So34 cl4) used as antigen in the assay (data not shown). When the Tc24 recombinant protein was used as an antigen instead of the whole parasite extract, very similar isotype profiles were obtained for both groups of infected animals with a predominance of the IgG2a isotype. Anti-Tc24 antibodies were expressed during the acute phase at higher concentrations in mice infected with P/209 cl1. Finally, in the chronic phase anti-Tc24 antibodies were detectable in 5 out of 6 P/209 cl1-infected mice (IgG1, IgG2a, IgG2b and IgG3) while they were barely detectable in mice infected with So34 cl4 (data not shown).

Fig. 6. Kinetics of isotype specific antibodies detected by ELISA using total extract of proteins of P/209 cl1 epimastigote forms. A ratio index (R) was calculated for every mouse as the optical density of the infected mice over the average of the optical density of the 6 control mice +2 standard deviations. Data are arithmetic means (±S.D.) of 6 mice per infected group. Asterisks indicate time-points showing significant differences between both groups of infected mice (*P<0·05; **P<0·001).
Inflammation in heart and skeletal muscle over the infection
Heart and skeletal muscles were examined for mice infected with either P/209 cl1 or So34 cl4 and compared to non-infected animals. Detection of parasite nests and inflammatory cells was carried on H&E-stained tissue sections obtained from groups of 6 animals sacrificed during the acute (13, 28, 37, 45, 63 days p.i.) and chronic phases (245 days p.i.) of the infection.
Amastigote nests (pseudocysts) were barely found in the heart and skeletal muscle of infected mice. Indeed, only 2 nests were observed over the whole amount of sections examined. One nest was observed in the skeletal muscle of a So34 cl4-infected mouse during the acute phase (37 days p.i.), whereas the other one was found in the heart of a P/209 cl1-infected mouse during the chronic phase.
Over the acute phase of infection, infiltration of inflammatory cells in heart and skeletal muscle from both sets of infected mice (Fig. 7B,C,E,F) was much higher than in control tissues (Fig. 7A–D). However, P/209 cl1-infected mice presented a much more intense inflammation in both heart and quadriceps than So34 cl4-infected mice did (Table 1). Similarly, the important tissue damage observed in P/209 cl1-infected mice was absent from So34 cl4-infected animals (Fig. 7B and C). The percentage of inflamed heart-tissue in P/209 cl1-infected mice, was lower than 25% in the early acute phase (13 and 28 days p.i.) and increased to more than 50% in the right and left auricles, 45 days p.i, showing both diffuse and focal infiltration patterns (Table 1; Fig. 7B). At that time, a focal and intense inflammation was also observed in the skeletal muscle (Table 1; Fig. 7E) together with the presence of oedema in P/209 cl1-infected mice, only (Table 1; Fig. 7E and F). Inflammation then rapidly decreased in both tissues, and was below 25% in the late acute phase (63 days p.i.).

Fig. 7. Histopathological analysis of cardiac and skeletal muscles at maximum inflammation (45 days p.i.). Heart (A, B, C) and quadriceps (D, E, F) H&E-stained sections from non-infected controls (A, D) or mice infected with P/209 cl1 (B, E) or So34 cl4 (C, F) were examined by light microscopy and photographed with a 10× objective. Bars represent 100 μm. Areas presenting major cell damage or oedema are indicated by an arrow or an asterisk, respectively.
Table 1. Inflammation in heart and skeletal muscle of infected mice (Inflammation intensity of 1 (<25%), 2 (25–50%), 3 (>50%); –, no inflammation; Dif, diffuse; Foc, focal; RV, right ventricle, RA, right auricle; LA, left auricle; End, endocardium; Ap, apex.)

Interestingly, in the chronic phase (245 days p.i), inflammation remained in the cardiac tissue only, with a higher intensity in P/209 cl1-infected mice, where both focal and diffuse infiltrations were observed in 25 to 50% of the heart surface area (auricles and ventricle). Unlike the other clone, heart sections from So34 cl4-infected mice presented less than 25% of affected area (right auricle and ventricle) as a diffuse infiltration.
DISCUSSION
We performed here a comprehensive study of in vivo T. cruzi infection in the mouse model with two distinct clones that belong to the same T. cruzi I lineage but presenting different levels of in vitro virulence.
Together, the in vitro and in vivo infection experiments showed that P/209 cl1 had a higher ability for invading the host organism than So34 cl4. In agreement with a previous report from Toledo et al. (2002), this ability resulted in a higher parasite load over the acute phase along with parasite persistence in blood and tissues during the chronic phase. It has been proposed that the ability of T. cruzi to colonize the host may rely upon two principal evasion mechanisms: the polyclonal lymphocyte activation, which is believed to be detrimental to an efficient and protective immunity (Minoprio et al. 1986; Spinella, Milon & Hontebeyrie-Joskowicz, 1990; Reina-San-Martin et al. 2000), and the immunosuppression of the T cell proliferative response (Ouaissi et al. 2001). In this study, both T. cruzi clones induced a massive lymphocyte polyclonal activation during the acute phase. Indeed, T and B cell counts increased significantly 37 days p.i. compared to control mice, and then declined as the parasite load decreased to finally reach the control level in the chronic phase. This phenomenon was more intense in P/209 cl1-infected mice, presenting twice the amount of T and B cells found in So34 cl4-infected animals. As previously described, the increase of B cell populations was associated with hypergammaglobulinaemia (Spinella et al. 1990). However, no striking difference in the total immunoglubulin concentrations and in the immunoglobulin isotype profiles was observed between both infections. The higher infectivity of P/209 cl1 in mice is therefore unlikely the result of the induction of the B cell polyclonal activation. Conversely, a significantly more intense immunosuppression was observed in P/209 cl1-infected mice than in So34 cl4-infected mice, lasting until the chronic phase for P/209 cl1. Although most of the T. cruzi strains, such as the T. cruzi Y strain, induce immunosuppression during the acute phase only (Garzón et al. 2003), cases of immunosuppression in the chronic phase have been reported (Kierszenbaum, Lopez & Sztein, 1994). Altogether, our data suggest that the efficient colonization and the persistence of P/209 cl1 results from its ability to both efficiently invade the host cells and induce a potent and long-lasting inhibition of T cell proliferative response.
To survive the acute phase, the mammalian host develops a parasite-specific response that efficiently reduces parasite counts in tissues and blood. Lytic antibodies control bloodstream trypomastigotes converting them into a target for complement lysis. In the current study, both infections elicited the production of anti-T. cruzi antibodies during the acute phase. Similar isotype profiles were observed for the two clones, though antibody concentration was higher in P/209 cl1-infected mice. Moreover, antibodies raised against one of these lytic antibodies (Krautz et al. 2000), the Tc24 recombinant protein, showed Ig profiles similar to the anti-T. cruzi antibodies in both infections. Lytic antibodies are likely to be implicated in the parasite load decrease in both sets of infected-mice, the antibody level being related to the parasitaemia intensity.
A seroconversion of anti-T. cruzi and anti-Tc24 antibodies was observed after 245 days in So34 cl4-infected mice. Indeed, during the chronic phase, specific antibodies were still found in all P/209 cl1-infected mice, along with bloodstream trypomastigotes, whereas antibodies and parasites in blood and tissues became barely detectable in mice infected with So34 cl4. The persistence of specific antibodies in individuals infected by T. cruzi is a common component of the immune response while a positive serology turning to negative reflects the absence of the parasite, and thereby signs cure of the infection. Some cases of human spontaneous cure have been reported but are unusual (Francolino et al. 2003). Therefore, the seroconversion in mice infected with So34 cl4 might imply an efficient control of parasite infection, which is consistent with parasite scarcity in tissue sections and blood samples of So34 cl4-infected mice during the chronic phase.
Chagas' disease myocarditis might result from autoimmunity (Kalil & Cunha-Neto, 1996; Leon & Engman, 2003) through the stimulation of both heart T and B cell autoreactive clones expanding during the acute polyclonal lymphocyte activation, or from the induction of parasite-specific antibodies cross reacting with heart and parasite antigens (Reina-San-Martin, Cosson & Minoprio, 2000). Our results showed inflammation of the heart and skeletal muscle for both clones while amastigote nests are barely found in tissues and, simultaneously to parasite clearance from blood and tissues in So34 cl4-infected mice. This result favours the absence of correlation between the parasite persistence and the inflammatory processes in mouse and human infections and supports the autoimmune origin of the chronic inflammation.
A higher inflammatory response, presumably responsible for the tissue damage, was observed during the acute and chronic phases in the cardiac and skeletal muscles of P/209 cl1-infected animals. Interestingly, mice infected with P/209 cl1 showed a major induction of CD8+ T cell hypercellularity. As high numbers of infiltrating CD8+ T cells is a common feature of chronic chagasic cardiomyopathy in humans and susceptible mice chronically infected by T. cruzi (dos Santos et al. 2001), CD8+ T cell infiltration might be involved in the intense inflammation observed in P/209 cl1-infected mice. This hypothesis is supported by the following data: (i) CD8+ significantly outnumbered CD4+ cells during the acute phase when the inflammation process is at the onset, and (ii) higher inflammation in P/209 cl1-infected animals is concomitant with higher numbers of CD8+ cells during the chronic phase while CD4+ cells dropped to control levels for both infections.
In conclusion, we showed here that P/209 cl1 clone induced a more severe disease in Balb/C mice than So34 cl4 clone, in spite of belonging to the same T. cruzi I lineage and being genetically tightly related. These clones differed by (i) their ability to invade the host cells, and (ii) the intensity of the immune system disorders (both polyclonal activation and immunosuppression) induced during the acute phase. Such differences in evasion of the host immune response are most likely responsible for the higher parasite loads and the consequent more intense inflammations observed in P/209 cl1-infected animals during the chronic phase. Indeed, the parasite load in the acute phase was recently proposed as a key factor in the intensity of the Chagas' disease pathology, and the later infection outcome (Marinho et al. 1999).
Finally, significant differences in the host/parasite relationships characterize T. cruzi clones. Regarding the genetic background of the clones used in the current study, our results are in agreement with studies that did not correlate biological properties of strains with genotypes (Carneiro et al. 1991; Steindel et al. 1995). Chagas'disease pathology is rather the result of complex interactions between the host and the parasite, different virulence factors of the parasite being implicated in the immunopathogenesis. Recently, sequence polymorphism and differential expression has been demonstrated for some virulence factors and such variability could explain some phenotypical differences (Dost et al. 2004; Risso et al. 2004). The comparison of genetically related clones presents an advantage over the comparison of clones belonging to very distant lineages (T. cruzi I and T. cruzi II) since their genetic background is very similar and the observed biological differences are more likely to be related to fine differences, such as key DNA mutations and/or differential gene expression of some principal factors, involved in virulence.
These investigations received financial support from the ‘Institut de Recherche pour le Développement’ (IRD). E. Garzón is a recipient of a fellowship from the IRD department of ‘Soutien et Formation pour les Communautés du Sud’. We are grateful to Delphine Destoumieux-Garzón (UMR 5154 CNRS-MNHN, Paris, France) for critical reading of the manuscript as well as to Philippe Boussès from the laboratory of ‘Taxonomie des Vecteurs’ (UR 16 IRD, Montpellier, France) for access to microscopy facilities, as well as to Eric Précigout (University of Pharmacy, Montpellier, France) for access to an automated scintillation counter. Finally, we are indebted to Daniel Moukouanga and Pascal Boutinaud, for their technical assistance in the animal care facility.
References
REFERENCES
ANDRADE, S. G. &
MAGALHAES, J. B. (
1996).
Biodemes and zymodemes of Trypanosoma cruzi strains: correlations with clinical data and experimental pathology.
Revista da Sociedade Brasileira de Medicina Tropical
30,
27–35.Google Scholar
BARRETT, M. P.,
BURCHMORE, R. J.,
STICH, A.,
LAZZARI, J. O.,
FRASCH, A. C.,
CAZZULO, J. J. &
KRISHNA, S. (
2003).
The trypanosomiases.
Lancet
362,
1469–1480.CrossRefGoogle Scholar
BARNABÉ, C.,
BRISSE, S. &
TIBAYRENC, M. (
2000).
Population structure and genetic typing of Trypanosoma cruzi, the agent of Chagas disease: a multilocus enzyme electrophoresis approach.
Parasitology
120,
513–526.CrossRefGoogle Scholar
BOSSENO, M. F.,
BARNABE, C.,
MAGALLON GASTELUM, E.,
LOZANO KASTEN, F.,
RAMSEY, J.,
ESPINOZA, B. &
BRENIERE, S. F. (
2002).
Predominance of Trypanosoma cruzi lineage I in Mexico.
Journal of Clinical Microbiology
40,
627–632.CrossRefGoogle Scholar
BRENER, Z. (
1962).
Therapeutic activity and criterion of cure on mice experimentally infected with Trypanosoma cruzi.
Revista do Instituto de Medicina Tropical de São Paulo
4,
389–396.Google Scholar
BRENIÈRE, S. F.,
CARRASCO, R.,
REVOLLO, S.,
APARICIO, G.,
DESJEUX, P. &
TIBAYRENC, M. (
1989).
Chagas' disease in Bolivia: clinical and epidemiological features and zymodeme variability of Trypanosoma cruzi strains isolated from patients.
American Journal of Tropical Medicine and Hygiene
41,
521–529.CrossRefGoogle Scholar
BRENIÈRE, S. F.,
BRAQUEMOND, P.,
SOLARI, A.,
AGNÈSE, J. F. &
TIBAYRENC, M. (
1991).
An isoenzyme study of naturally occurring clones of Trypanosoma cruzi isolated from both sides of the West Andes highland.
Transactions of the Royal Society of Tropical Medicine and Hygiene
85,
62–66.CrossRefGoogle Scholar
BRISSE, S.,
DUJARDIN, J. C. &
TIBAYRENC, M. (
2000).
Identification of six Trypanosoma cruzi lineages by sequence-characterised amplified region markers.
Molecular and Biochemical Parasitology
111,
95–105.CrossRefGoogle Scholar
CARNEIRO, M.,
ROMANHA, A. J. &
CHIARI, E. (
1991).
Biological characterization of Trypanosoma cruzi strains from different zymodemes and schizodemes.
Memorias do Instituto Oswaldo Cruz
86,
387–393.CrossRefGoogle Scholar
CLARK, C. G. &
PUNG, O. J. (
1994).
Host specificity of ribosomal DNA variation in sylvatic Trypanosoma cruzi from North America.
Molecular and Biochemical Parasitology
66,
175–179.CrossRefGoogle Scholar
DE DIEGO, J. A.,
PAULAU, M. T. &
PENIN, P. (
1998).
Are genotypes of Trypanosoma cruzi involved in the challenge of chagasic cardiomyopathy?
Parasitology Research
84,
147–152.Google Scholar
DI NOIA, J. M.,
BUSCAGLIA, C. A.,
DE MARCHI, C. R.,
ALMEIDA, I. C. &
FRASCH, A. C. (
2002).
A Trypanosoma cruzi small surface molecule provides the first immunological evidence that Chagas' disease is due to a single parasite lineage.
The Journal of Experimental Medicine
195,
401–413.CrossRefGoogle Scholar
DOS SANTOS, P. V.,
ROFFE, E.,
SANTIAGO, H. C.,
TORRES, R. A.,
MARINO, A. P.,
PAIVA, C. N.,
SILVA, A. A.,
GAZZINELLI, R. T. &
LANNES-VIEIRA, J. (
2001).
Prevalence of CD8(+)alpha beta T cells in Trypanosoma cruzi-elicited myocarditis is associated with acquisition of CD62L(Low)LFA-1(High)VLA-4(High) activation phenotype and expression of IFN-gamma-inducible adhesion and chemoattractant molecules.
Microbes and Infection
3,
971–984.CrossRefGoogle Scholar
DOST, C. K.,
SARAIVA, J.,
MONESI, N.,
ZENTGRAF, U.,
ENGELS, W. &
ALBUQUERQUE, S. (
2004).
Six Trypanosoma cruzi strains characterized by specific gene expression patterns. Parasitology Research, Aug 19 [Epub ahead of print].CrossRef
FRANCOLINO, S. S.,
ANTUNES, A. F.,
TALICE, R.,
ROSA, R.,
SELANIKIO, J.,
DE REZENDE, J. M.,
ROMANHA, A. J. &
DIAS, J. C. (
2003).
New evidence of spontaneous cure in human Chagas' disease.
Revista da Sociedade Brasileira de Medicina Tropical
36,
103–107.CrossRefGoogle Scholar
GARZON, E.,
BORGES, M. C.,
CORDEIRO-DA-SILVA, A.,
NACIFE, V.,
MEIRELLES MDE, N.,
GUILVARD, E.,
BOSSENO, M. F.,
GUEVARA, A. G.,
BRENIERE, S. F. &
OUAISSI, A. (
2003).
Trypanosoma cruzi carrying a targeted deletion of a Tc52 protein-encoding allele elicits attenuated Chagas' disease in mice.
Immunology Letters
89,
67–80.CrossRefGoogle Scholar
HIGO, H.,
YANAGI, T.,
MATTA, V.,
AGATSUMA, T.,
KANBARA, H.,
TADA, I.,
DE LEON, M. P.,
MONROY, C. &
TABARU, Y. (
1997).
Genetic structure of Trypanosoma cruzi in Central America and its comparison with South American strains.
International Journal for Parasitology
27,
1369–1374.CrossRefGoogle Scholar
KALIL, J. &
CUNHA-NETO, E. (
1996).
Autoimmunity in Chagas Disease cardiomyopathy: Fulfilling the criteria at last?
Parasitology Today
12,
396–398.Google Scholar
KIERSZENBAUM, F.,
LOPEZ, H. M. &
SZTEIN, M. B. (
1994).
Inhibition of Trypanosoma cruzi-specific immune responses by a protein produced by T. cruzi in the course of Chagas'disease.
Immunology
81,
462–467.Google Scholar
KRAUTZ, G. M.,
KISSINGER, J. C. &
KRETTLI, A. U. (
2000).
The targets of the lytic antibody response against Trypanosoma cruzi.
Parasitology Today
16,
31–34.CrossRefGoogle Scholar
LAURENT, J. P.,
BARNABÉ, C.,
QUESNEY, V.,
NOEL, S. &
TIBAYRENC, M. (
1997).
Impact of clonal evolution on the biological diversity of Trypanosoma cruzi.
Parasitology
114,
213–218.CrossRefGoogle Scholar
LEON, J. S. &
ENGMAN, D. M. (
2003).
The significance of autoimmunity in the pathogenesis of Chagas heart disease.
Frontiers in Bioscience
8,
315–322.Google Scholar
MARINHO, C. R.,
D'IMPERIO LIMA, M. R.,
GRISOTTO, M. G. &
ALVAREZ, J. M. (
1999).
Influence of acute-phase parasite load on pathology, parasitism, and activation of the immune system at the late chronic phase of Chagas' disease.
Infection and Immunity
67,
308–318.Google Scholar
MILES, M. A.,
CEDILLOS, R. A.,
POVOA, M. M.,
DE SOUZA, A. A.,
PRATA, A. &
MACEDO, V. (
1981).
Do radically dissimilar Trypanosoma cruzi strains (zymodemes) cause Venezuelan and Brazilian forms of Chagas' disease?
Lancet
20,
1338–1340.Google Scholar
MINOPRIO, P. (
2001).
Parasite polyclonal activators: new targets for vaccination approaches?
International Journal for Parasitology
31,
588–591.Google Scholar
MINOPRIO, P. M.,
EISEN, H.,
FORNI, L.,
D'IMPERIO LIMA, M. R.,
JOSKOWICZ, M. &
COUTINHO, A. (
1986).
Polyclonal lymphocyte responses to murine Trypanosoma cruzi infection. I. Quantitation of both T- and B-cell responses.
Scandinavian Journal of Immunology
24,
661–668.Google Scholar
MOMEN, H. (
1999).
Taxonomy of Trypanosoma cruzi: a commentary on characterization and nomenclature.
Memorias do Instituto Oswaldo Cruz
94 (Suppl.)
181–184.CrossRefGoogle Scholar
MONTILLA, M. M.,
GUHL, F.,
JARAMILLO, C.,
NICHOLLS, S.,
BARNABE, C.,
BOSSENO, M. F. &
BRENIERE, S. F. (
2002).
Isoenzyme clustering of Trypanosomatidae Colombian populations.
American Journal of Tropical Medicine and Hygiene
66,
394–400.CrossRefGoogle Scholar
MOSER, D. R.,
KIRCHHOFF, L. V. &
DONELSON, J. E. (
1989).
Detection of Trypanosoma cruzi by DNA amplification using the polymerase chain reaction.
Journal of Clinical Microbiology
27,
1477–1482.Google Scholar
OUAISSI, A.,
DA SILVA, A. C.,
GUEVARA, A. G.,
BORGES, M. &
GUILVARD, E. (
2001).
Trypanosoma cruzi-induced host immune system dysfunction: a rationale for parasite immunosuppressive factor(s) encoding gene targeting.
Journal of Biomedicine and Biotechnology
1,
11–17.CrossRefGoogle Scholar
REINA-SAN-MARTIN, B.,
COSSON, A. &
MINOPRIO, P. (
2000).
Lymphocyte polyclonal activation: a pitfall for vaccine design against infectious agents.
Parasitology Today
16,
62–67.CrossRefGoogle Scholar
REVOLLO, S.,
OURY, B.,
LAURENT, J. P.,
BARNABE, C.,
QUESNEY, V.,
CARRIERE, V.,
NOEL, S. &
TIBAYRENC, M. (
1998).
Trypanosoma cruzi: impact of clonal evolution of the parasite on its biological and medical properties.
Experimental Parasitology
89,
30–39.CrossRefGoogle Scholar
RISSO, M. G.,
GARBARINO, G. B.,
MOCETTI, E.,
CAMPETELLA, O.,
GONZALEZ CAPPA, S. M.,
BUSCAGLIA, C. A. &
LEGUIZAMON, M. S. (
2004).
Differential expression of a virulence factor, the trans-sialidase, by the main Trypanosoma cruzi phylogenetic lineages.
Journal of Infectious Diseases
189,
2250–2259.CrossRefGoogle Scholar
SOUTO, R. P.,
FERNANDES, O.,
MACEDO, A. M.,
CAMPBELL, D. A. &
ZINGALES, B. (
1996).
DNA markers define two major phylogenetic lineages of Trypanosoma cruzi.
Molecular and Biochemical Parasitology
83,
141–152.CrossRefGoogle Scholar
SPINELLA, S.,
MILON, G. &
HONTEBEYRIE-JOSKOWICZ, M. (
1990).
A CD4+ TH2 cell line isolated from mice chronically infected with Trypanosoma cruzi induces IgG2 polyclonal response in vivo.
European Journal of Immunology
20,
1045–1051.CrossRefGoogle Scholar
STEINDEL, M.,
TOMA, H. K.,
ISHIDA, M. M.,
MURTA, S. M.,
DE CARVALHO PINTO, C. J.,
GRISARD, E. C.,
SCHLEMPER BR, J. R.,
RIBEIRO-RODRIGUES, R. &
ROMANHA, A. J. (
1995).
Biological and isoenzymatic characterization of Trypanosoma cruzi strains isolated from sylvatic reservoirs and vectors from the state of Santa Catarina, Southern Brazil.
Acta Tropica
60,
167–177.CrossRefGoogle Scholar
TAIBI, A.,
ESPINOZA, A. G. &
OUAISSI, A. (
1995).
Trypanosoma cruzi: analysis of cellular and humoral response against a protective recombinant antigen during experimental Chagas' disease.
Immunology Letters
48,
193–200.CrossRefGoogle Scholar
TOLEDO, M. J.,
DE LANA, M.,
CARNEIRO, C. M.,
BAHIA, M. T.,
MACHADO-COELHO, G. L.,
VELOSO, V. M.,
BARNABE, C.,
TIBAYRENC, M. &
TAFURI, W. L. (
2002).
Impact of Trypanosoma cruzi clonal evolution on its biological properties in mice.
Experimental Parasitology
100,
161–172.CrossRefGoogle Scholar
WORLD HEALTH ORGANIZATION (
2002).
Control of Chagas Disease. Second Report of the WHO Expert committee, Geneva.
ZINGALES, B.,
STOLF, B. S.,
SOUTO, R. P.,
FERNANDES, O. &
BRIONES, M. R. (
1999).
Epidemiology, biochemistry and evolution of Trypanosoma cruzi lineages based on ribosomal RNA sequences.
Memorias do Instituto Oswaldo Cruz
94 (Suppl 1),
159–164.CrossRefGoogle Scholar

Fig. 1. L929 fibroblasts were infected with Trypanosoma cruzi P/209 cl1 or So34 cl4 and the number of amastigotes per cell was evaluated by counting intracellular parasites under a light microscope in 150 infected cells. Data are presented as the number of fibroblasts infected with 1 to 4, 5 to 20, 21 to 49, and >50 amastigotes per cell 96 h p.i.

Fig. 2. Average parasitaemia in blood of Balb/c mice infected with 103 BT trypomastigotes of P/209 cl1 or So34 cl4 during the acute (13, 28, 37, 45, and 63 days p.i.) and chronic phases (245 days p.i.). Data are arithmetic means (±S.D.) of 6 mice per group of infected mice. Black and grey squares refer to BT counts found in P/209 cl1 and So34 cl4-infected mice, respectively. **P<0·001.

Fig. 3. (A) Kinetics of total spleen cell counts from mice infected with P/209 cl1 (black squares), So34 cl4 (grey squares), or from control animals (open circles). (B) Spleen lymphocyte subset populations and macrophages in mice infected with P/209 cl1 (black bars) or So34 cl4 (grey bars) and control (white bars) at 37 days p.i. Data are expressed as the absolute number of cells counted per spleen. Data are arithmetic means (±S.D.) of 6 mice per group. Asterisks indicate time-points showing significant differences between both groups of infected mice (*P<0·05; **P<0·001).

Fig. 4. CD4+: CD8+ spleen cell ratio from mice infected with P/209 cl1 (black bars) or So34 cl4 (grey bars) and control (white bars) at 37 and 245 days p.i. Data are arithmetic means (±S.D.) of 6 mice per group. The asterisk indicates the time-point showing a significant difference between both groups of infected mice (*P<0·05).

Fig. 5. Ex vivo spleen cell proliferation as measured by [3H]thymidine incorporation in response to anti-CD3 stimulation. A proliferation index was calculated for every mouse as the ratio of [3H]thymidine incorporation (cpm) by mitogen-stimulated over non-stimulated T cells. Data are expressed as arithmetic average (±S.D.) of proliferation index of 6 mice in each group infected with P/209 cl1 (black bars), So34 cl4 (grey bars), or control mice (white bars). Asterisks indicate significant differences in the proliferate response of both groups of infected mice (*P<0·05).

Fig. 6. Kinetics of isotype specific antibodies detected by ELISA using total extract of proteins of P/209 cl1 epimastigote forms. A ratio index (R) was calculated for every mouse as the optical density of the infected mice over the average of the optical density of the 6 control mice +2 standard deviations. Data are arithmetic means (±S.D.) of 6 mice per infected group. Asterisks indicate time-points showing significant differences between both groups of infected mice (*P<0·05; **P<0·001).
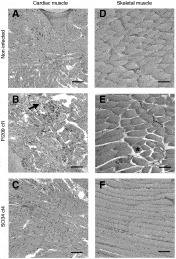
Fig. 7. Histopathological analysis of cardiac and skeletal muscles at maximum inflammation (45 days p.i.). Heart (A, B, C) and quadriceps (D, E, F) H&E-stained sections from non-infected controls (A, D) or mice infected with P/209 cl1 (B, E) or So34 cl4 (C, F) were examined by light microscopy and photographed with a 10× objective. Bars represent 100 μm. Areas presenting major cell damage or oedema are indicated by an arrow or an asterisk, respectively.
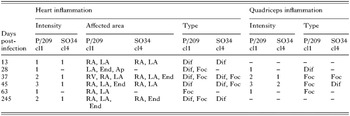
Table 1. Inflammation in heart and skeletal muscle of infected mice
 You have
Access
- 12
- Cited by