INTRODUCTION
The exploitation of marine resources is increasing throughout the world. Recent estimates indicate that fishing activity increased fourfold since 1950 (Watson & Pauly, Reference Watson and Pauly2001). The situation in the Mediterranean Sea is not far off this mark: indeed, most of its resources are overexploited. The situation has got worse over the last ten years due to increased efficiency in fishing devices and methods. Sardinian seas have also seen a considerable increase in the pressure on fishing stocks, mostly on demersal species (Sabatini et al., Reference Sabatini, Cabiddu, Cuccu, Murenu, Pendugiu, Pesci, Follesa and Cau2006), due to the low tonnage to high tonnage replacement of vessels that occurred from 1993 to 2004.
Bottom trawl fishing has considerable effects on demersal fish communities in terms of overall biomass, modification of size distribution and species composition (Pauly, Reference Pauly and Gulland1988; Greenstreet & Hall, Reference Greenstreet and Hall1996; Haedrich & Barnes, Reference Haedrich and Barnes1997; Fogarty & Murawski, Reference Fogarty and Murawski1998), and interference with ecosystem functioning (Greenstreet & Hall, Reference Greenstreet and Hall1996). In particular, deep-sea communities are expected to have low resilience to increasing disturbances due to species’ late maturation, extreme longevity, low fecundity, and slow growth (Koslow et al., Reference Koslow, Boehlert, Gordon, Haedrich, Lorance and Parin2000). Thus, deep-sea fish are potentially much more vulnerable to disturbance than their shallow-water counterparts. Bottom trawling also could potentially provoke long-term changes in sediment nutrient fluxes (Olsgard et al., Reference Olsgard, Schaanning, Widdicombe, Kendall and Austen2008) and could destroy bottom habitats; the long-term consequences of such disturbances are poorly known (Koslow et al., Reference Koslow, Boehlert, Gordon, Haedrich, Lorance and Parin2000). Many researchers have focused on finding ways to assess the consequences of disturbances to deep-water ecosystems (Jennings & Polunin Reference Jennings and Polunin1996; Rochet et al., Reference Rochet, Trenkel, Bellail, Coppin, Le Pape, Mahé, Morin, Poulard, Schlaich, Souplet, Vérin and Bertrand2005). Due to the clear response of biodiversity to fishing (Dulvy et al., Reference Dulvy, Sadovy and Reynolds2003; Hiddink et al., Reference Hiddink, MacKenzie, Rijnsdorp, Dulvy, Nielsen, Bekkevold, Heino, Lorance and Ojaveer2008), we believe that measuring biodiversity, in particular species diversity metrics, can provide important data needed to evaluate the effects of overfishing on ecosystems.
The Sardinian seas, thanks to their peculiar bottom trawl fisheries history and fishing resources monitoring programme, are a good testing ground for evaluating the variation in ecological diversity indices and for determining if these indices are efficient indicators for assessing the state of health of ecosystems. Before the early 1990s, more than 90% of the Sardinian otter trawler fleet was composed of low tonnage wooden boats (<70 GT). Due to the technical limits of these boats, fishermen usually restricted their activity to the coastal zone, being marginally interested in other valuable deeper demersal resources such as red shrimps (Cau et al., Reference Cau, Sabatini, Murenu, Follesa and Cuccu1994). In particular, the bad sea conditions that characterize the western coast and which forced the fishermen to stop fishing for long periods during late spring–summer periods did not allow any fishery development for this area, despite the wide continental shelf with a gentle slope and a gradually sloping continental slope, which provides a highly suitable trawling area. In contrast, weather conditions and a narrow continental shelf slope (in which less towable surface area is available to an increasing number of vessels) on the eastern coast should allow higher exploitation. However, in general, before the 1990s few boats (mainly from the Gulf of Cagliari fishery) were able to conduct systematic shrimp fishing in this area, and the low tonnage wooden fishing trawlers fished the middle slope (>400 m depth) only if there were really good sea conditions (Cau et al., Reference Cau, Sabatini, Murenu, Follesa and Cuccu1994). Beginning in 1991, the Sardinian fishing fleet was renewed as a consequence of government policy (DM 26/07/1995; Sabatini et al., Reference Sabatini, Cabiddu, Cuccu, Murenu, Pendugiu, Pesci, Follesa and Cau2006). The main change involved the replacement of old, low tonnage wooden boats with large deep-sea steel boats.
These seas were also part of the MEDITS (international bottom trawl survey in the Mediterranean) trawl survey programme (Bertrand et al., Reference Bertrand, De Sola, Papaconstantinou, Relini and Souplet2002), which since 1994 has provided information about the status of demersal species. Similar studies conducted in recent years have compared different biogeographical areas (e.g. the Atlantic Ocean and Mediterranean Sea; Blanchard, Reference Blanchard2001) using only certain kinds of indices and low sampling effort (Ungaro et al., Reference Ungaro, Marano, Marsan and Ostmani1998; D'Onghia et al., Reference D'Onghia, Mastrototaro, Matarrese, Politou and Mytilineou2003).
Other studies have concentrated on particular areas with high biodiversity gradients, such as tropical marine ecosystems (Lobry et al., Reference Lobry, Gascuel and Domain2003), or on specialized areas, such as canyons or seamounts, that are characterized by high biomass and abundance (Sabatini et al., Reference Sabatini, Follesa, Locci, Pendugiu, Pesci and Cau2007, Reference Sabatini, Follesa, Locci, Matta, Palmas, Pendugiu, Pesci and Cau2010; O'Hara et al., Reference O'Hara, Rowden and Williams2008; Althaus et al., Reference Althaus, Williams, Schlacher, Kloser, Green, Barker, Bax, Brodie and Schlacher-Hoenlinger2009; Clark & Rowden, Reference Clark and Rowden2009; Clark et al., Reference Clark, Rowden, Schlacher, Williams, Consalvey, Stocks, Rogers, O'Hara, White, Shank and Hall-Spencer2010).
The aim of this study was to examine the temporal trends in four classical ecological diversity indices (Shannon–Weiner's diversity, species richness, Pielou's evenness, and Simpson’s dominance) with regard to capture depths of red shrimp, Aristeus antennatus (Risso, 1816) and Aristaeomorpha foliacea (Risso, 1827), which represent one of the most important deep-water fishing resources in Sardinia (up to 15–20%, as biomass; IREPA, 2005–2010) which correspond to a high economic income. The big interest in these resources has, in fact, driven a major renewal of the Sardinian fishing fleet, which have brought to a differential increase in fishing pressure in specific locations of Sardinian seas over the period 1994–2004. Moreover, to evaluate the dependence of biodiversity on fishing effort, we developed a statistical model of Shannon's diversity index temporal behaviour (H′) via a two-explanatory variable multiple linear regression model. We evaluated the validity and reliability of these indices as measurements of environmental stress and the potential of the model to provide to forecast the biodiversity behaviour in relation to one of its components and fishing effort itself.
MATERIALS AND METHODS
The study area
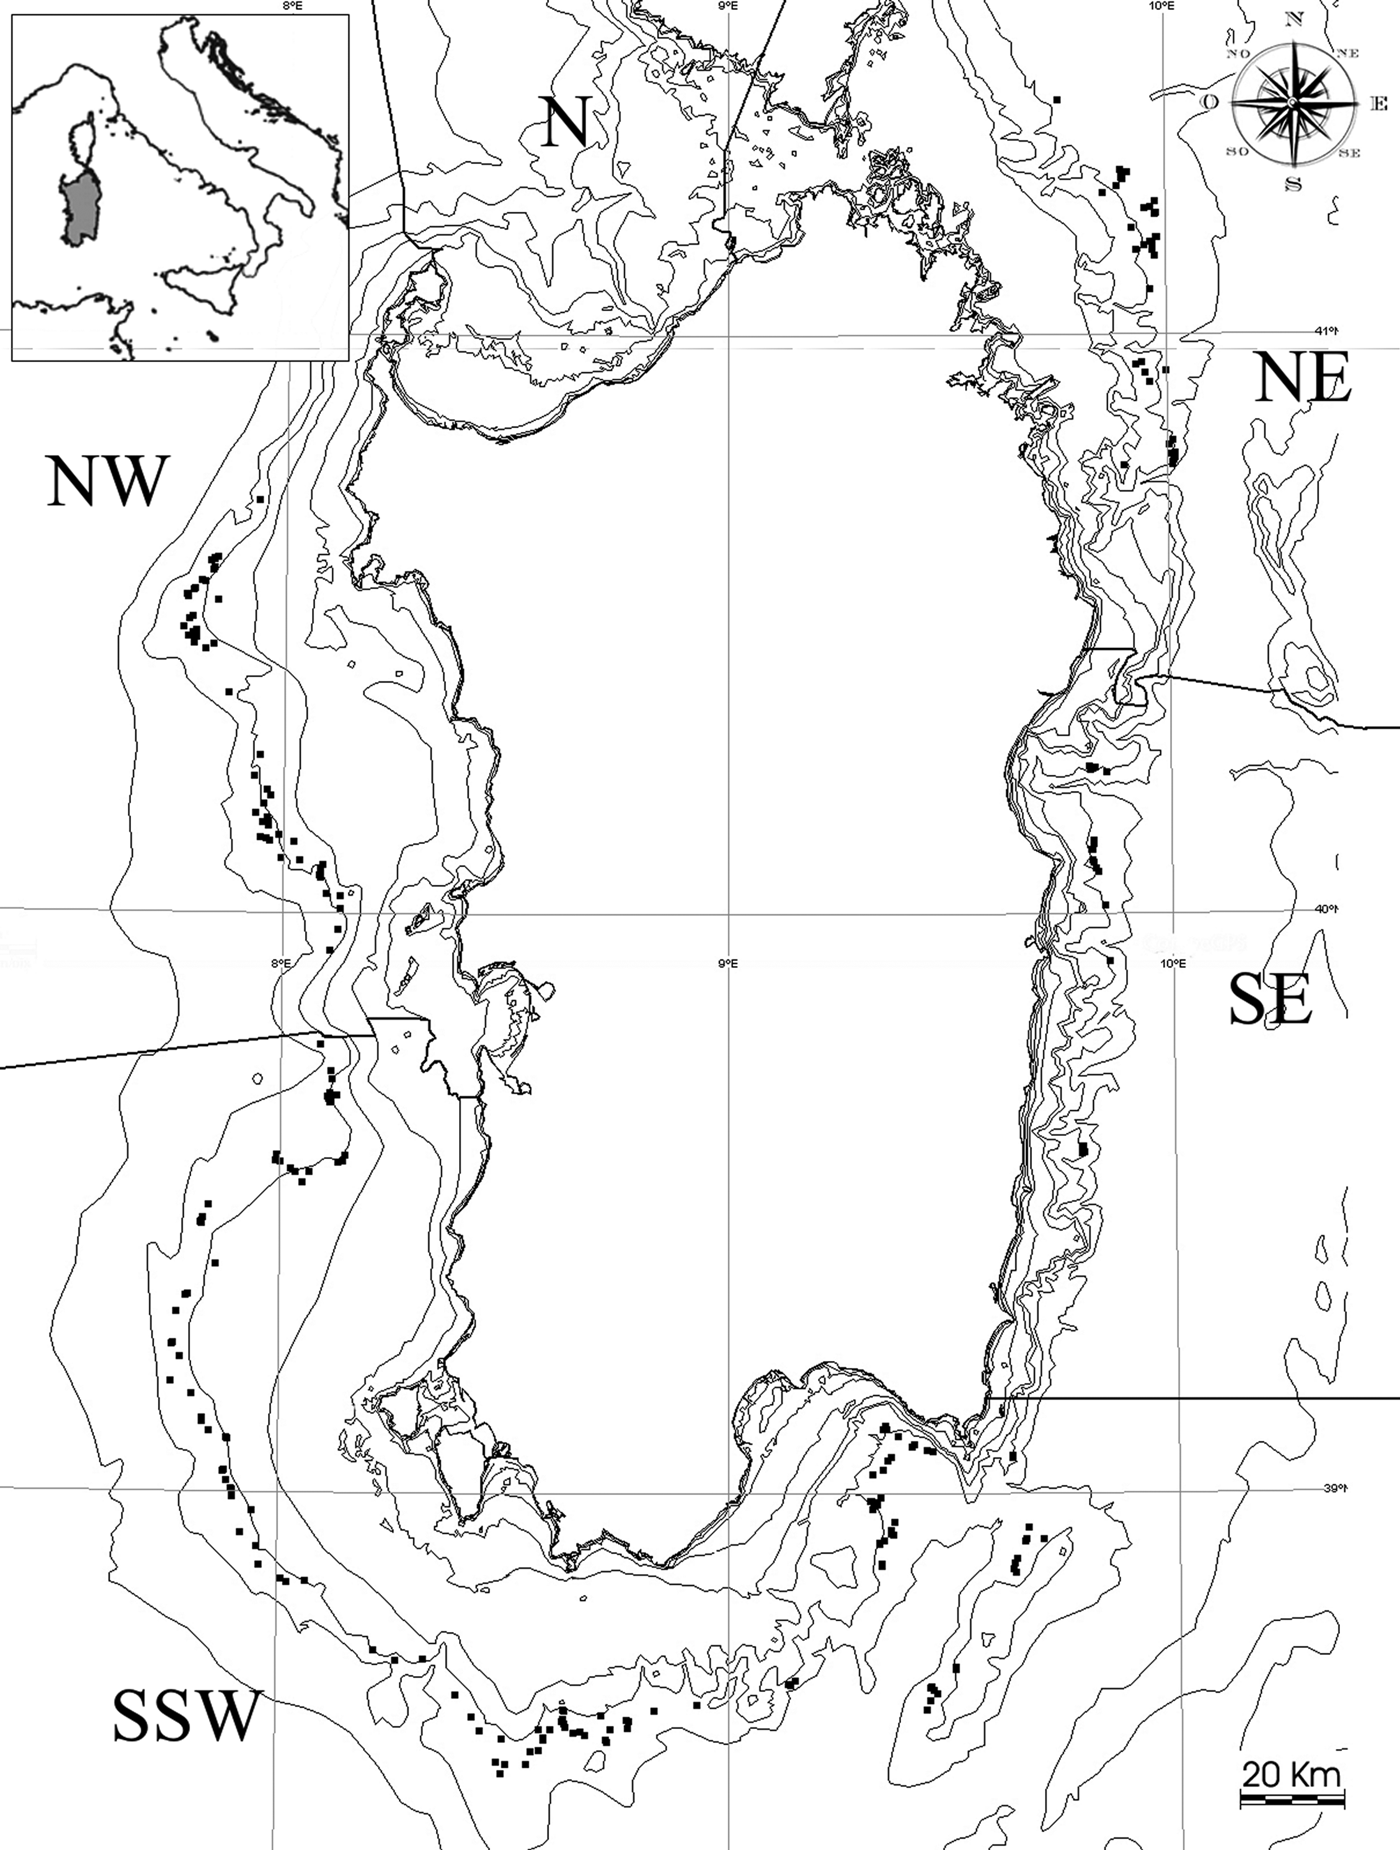
The general geomorphology of Sardinian sea bottoms is heterogeneous. The south-western and western sea-floor is characterized by a wide continental shelf with a gentle slope that ends at a depth of 150–200 m, followed by a gradual continental slope that reaches a depth of 800 m within 15 m. The south-eastern and eastern bottoms are characterized by a narrow continental shelf that terminates at a depth of about 50–100 m and a steep continental slope that reaches 800 m within <6 nm. The sea bottoms we considered for our investigation had a depth that ranged from 400 to 800 m and covered an area of about 4220 km2 (Cau et al., Reference Cau, Sabatini, Murenu, Follesa and Cuccu1994) (Figure 1).
Map of the Sardinian seas with location of the samplings taken between 400 and 800 m during trawl surveys conducted from 1994 to 2004.

While the artisanal and polyvalent fisheries target mainly resources in the continental shelf, prior to the renewal started in 1991 also low tonnage otter trawlers operated mainly near the coastline off their fishing harbour areas; they very rarely (in some cases never) moved to other zones (Cau et al., Reference Cau, Sabatini, Murenu, Follesa and Cuccu1994). The change in the fleet increased the vessels’ workability, and fishing habits changed mainly in two ways: first, slope bottom trawlers progressively moved the fishing pressure toward their primary target, i.e. the deep-sea resources (400–800 m), which until the early 1990s had been little exploited in the Sardinian seas (Sabatini et al., Reference Sabatini, Cabiddu, Cuccu, Murenu, Pendugiu, Pesci, Follesa and Cau2006); second, the improved technical features of the new boats allowed fishermen to conduct longer trips and harvest fishing resources in adjacent areas. According to interviews with fishermen, they are mainly interested in the southern and north-western areas.
Based on differences in fishing effort and fishermen habits (Cau et al., Reference Cau, Sabatini, Murenu, Follesa and Cuccu1994; Sabatini et al., Reference Sabatini, Cabiddu, Cuccu, Murenu, Pendugiu, Pesci, Follesa and Cau2006), we subdivided the seas around Sardinia into five zones: North-Western (NW) 595 km2, North-Eastern (NE) 855 km2, South Eastern (SE) 502 km2, South-South-Western (SSW) 2268 km2, and North (N) 242 km2 (Figure 1). The MEDITS sampling protocol included only one station for the N zone. Therefore, there was not adequate data for this zone and it was excluded from this study.
Data collection
Data were collected over an 11 year period between 1994 and 2004. Eleven trawl surveys (297 hauls in all) were conducted in the seas around Sardinia during the summer months within the framework of the MEDITS research programme. The objective of the MEDITS surveys was to provide information about benthic and demersal species (Bertrand et al., 2002). Samples were collected using a stratified random strategy by means of a local trawler of 168 GT. The fishing gear used was the GOC 73 bottom trawl (Fiorentini et al., Reference Fiorentini, Dremière, Leonori, Sala and Palumbo1999), which was designed for scientific experimental fishing. It had a cod-end mesh size of 20 mm (stretched mesh) (Bertrand et al., Reference Bertrand, De Sola, Papaconstantinou, Relini and Souplet2002). Teleosts, chondrichthyes, decapods, crustaceans and cephalopods captured in each haul were sorted by species, counted, and weighed, as indicated by the survey protocol.
A total of 297 hauls at depths between 400 and 800 m were included in this study, and they are shown on the map in Figure 1. Twenty-seven hauls were conducted each year, and the number of hauls conducted in each area was proportional to the surface width of each zone. Hauls were conducted at the same GPS traces (or marks) each year. The planned duration of trawling at each depth was one hour; however, any haul that lasted at least 40 min was considered valid, which allowed the inclusion of hauls even when problems (i.e. bad weather conditions) occurred. Considering that the target and actually the most captured species at these depths by commercial fisheries are red shrimps, we decided to consider only those hauls where Aristeus antennatus and Aristaeomorpha foliacea were present. The main aim of this choice was to evaluate species strictly associated with red shrimps. Abundance data were standardized (No. h−1) in order to obtain comparable samplings.
To estimate fishing effort, fishing fleet data on the number of trawlers fishing in the survey area were collected from the ‘Regione Autonoma della Sardegna’ fleet archives. We included boats with a tonnage >30 GT that operated during the investigation period.
Biodiversity analysis
The biodiversity analyses have been subdivided in two different steps. The first one analyses the actual situation of ecological diversity trends of Sardinian seas and considers the fishing effort within the same areas. The second one, attempts to relate the ecological diversity directly to the fishing effort, to provide a measure of its influence on the latter in modifying the ecological diversity patterns observed.
1994–2004 EVOLUTION OF BIODIVERSITY: THE ECOLOGICAL DIVERSITY INDICES, THE FISHING EFFORT, AND THE TEST FOR TRENDS
Three indices based on the information statistics, were used to calculate ecological diversity. Species diversity was calculated using the Shannon–Weiner index H′ (Shannon, Reference Shannon1948):
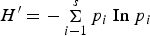 $$H^\prime = - \mathop \Sigma \limits_{i - 1}^s p_i \; {\rm In} \; p_i$$
The quantity p i is the proportion of individuals found of the ith species (Pielou, Reference Pielou1969):
 $$p_i = \displaystyle{{n_i } \over N}$$
where n i is the number of specimens of the ith species and N is the total number of individuals in the sample. The value of the Shannon–Weiner index obtained from empirical data usually falls between 1.5 and 3.5 and rarely surpasses 4 (Magurran, Reference Magurran2004).
For species richness estimations we used the maximum Shannon–Weiner's entropy (Magurran, Reference Magurran2004):
 $$H_{\max } = {\rm In}\; S$$
Maximum entropy is a logarithmic function of only the numerousness of species, and its measurement is used to evaluate the ‘species richness’ component of specific diversity (Ganis, Reference Ganis1991).
Evenness was calculated using Pielou's J′ index (Pielou, Reference Pielou1969), which is presented as the ratio of observed diversity (H′) and maximum diversity (H max):
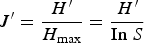 $$J^\prime = \displaystyle{{H^\prime} \over {H_{\max }}} = \displaystyle{{H^\prime} \over {\rm In}\; S}$$
Evenness is a measure of how similar species are in their abundances (Magurran, Reference Magurran2004). J′ varies between 0 (when only one species is present) and 1 (when all species have the same abundance).
A fourth index has also been used to measure the dominance of the species in the investigated communities—the Simpson index:
 $$D = \mathop \Sigma \limits_{i = 1}^s p_i^2 = \mathop \Sigma \limits_{i = 1}^s \left({\displaystyle{{n_i [ n_i - 1\rsqb } \over {N[ N - 1\rsqb }}} \right).$$
The Simpson index is part of another group of diversity indices whose members are weighted according to abundances of the commonest species. In contrast, the information statistics indices described above tend to emphasize the species richness component of biodiversity (Magurran, Reference Magurran2004).
k-dominance curves, which show the cumulative abundance of ranked species (Lambshead et al., Reference Lambshead, Platt and Shaw1983), were calculated for abundance data within years. The results were used in the interpretation of assemblage structure as follows: species assemblage x is more diverse than y if the curve of x is below that of y.
Fishing effort was evaluated by developing four indices derived from fishing fleet number and tonnage data. Two of them used just the number and tonnage row data and were defined, respectively, as No. and GT. The other two were the same indexes weighted by surface potentially available for trawling of each area, and defined as: GT Area−1 and Noboats area−1.
The degree of significance of trends was evaluated using the non-parametric Mann–Kendall test (MK test). The MK test can be stated most generally as a test to establish whether Y values tend to increase or decrease with time (T) (Helsel & Hirsch, Reference Helsel, Hirsch, Helsel and Hirsch2002).
 $$\eqalignno{& H_0\colon \quad {\rm Prob} \; [ Y_j \gt Y_i \rsqb = 0.5 \quad {\rm where \; time} \; T_j \gt T_i \cr & H_1\colon\quad {\rm Prob} \; [ Y_j \gt Y_i \rsqb \ne 0.5 \quad \lpar {\rm two-sided \; test}\rpar}$$
where i = 1, …, (n − 1) and j = (i + 1), …, n
To deal with the presence of ties, the value of τ was estimated using the Goodman and Kruskal method (Goodman & Kruskal, Reference Goodman and Kruskal1963):
 $$\tau = \displaystyle{{N_C - N_D } \over {N_C + N_D }}$$
where N C is the number of concordant values and N D is the number of discordant values.
The estimated τ value then was compared to tabular τα values and the significance level chosen. In this case, we have:
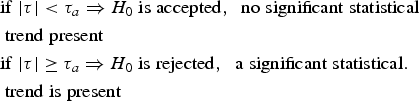 $$\eqalign{& {\rm if}\; \vert \tau \vert < \tau _a \Rightarrow H_0 \; {\rm is \; accepted\comma \; \; no \; significant \; statistical} \cr&{\rm \; trend \; present}\cr & {\rm if}\; \vert \tau \vert \ge \tau _a \Rightarrow H_0 \; {\rm is \; rejected\comma \; \; a \; significant \; statistical.} \cr&{\rm \; trend \; is \; present}}$$
Trend is increasing if τ > 0 and decreasing if τ < 0. For N > 10, τ follows the normal distribution.
The correlation between fishing effort and ecological diversity indices was estimated using a linear regression analysis followed Fisher's F test (ANOVA) (Zar, Reference Zar1999).
1994–2004 SIMULATION OF BIODIVERSITY: THE VARIABLES RELATIONSHIPS AND THE MULTIPLE LINEAR REGRESSION (MLR)
A Spearman rank correlation test is performed in order to have a first idea on relationships existing between variables (diversity and fishing effort indices).
The multiple regression procedure was used to estimate the regression coefficients β0, β1, β2, of the linear equation:
 $$Y_j=\beta _0+\beta _1 X_1+\beta _2 X_2+\varepsilon$$
where the regression coefficients β0, β1, β2, represent the independent contributions of each independent variable X 1X 2 and to the prediction of the dependent variable Y.
Several MLR models were estimated by combining a dependent variable of the biodiversity set (species richness, evenness and dominance) together with a variable of the fishing effort set. The selection criteria for the best model choice were: the statistical significance of the intercept and the dependent variable included in the model (t-test); the proportion of the total variability in the dependent variable that is accounted for by the regression equation (R 2); the P-values of the analysis of variance which test the whole model (F-test). The dependence of residuals was evaluated by means of the Durbin–Watson statistic (D–W statistic) (Durbin & Watson, Reference Durbin and Watson1951a, Reference Durbin and Watsonb). Finally the coefficients of the chosen model were standardized in order to investigate on the actual variable weight in Shannon entropy estimation.
The model coefficient has been evaluated on the whole investigated area and then applied to single zone model estimation. Such procedure, that implied the a priori choice of intercept and regressor coefficients, allowed us to mitigate the influence of environmental variability within analysed areas in order to highlight as possible only the influence of fishing effort on examined assemblages. Moreover this allowed us to describe the diverse reactions of Shannon's entropy sub-zone by sub-zone with only one model.
The different degree of fitting between the predicted data and the single sub-zones observed data, were evaluated by root mean squared error (RMSE), a common model performance index which gives a global idea of the difference between the observed and modelled values (Sousa et al., Reference Sousa, Martins, Pereira and Alvim-Ferraz2006).
RESULTS
The fishing fleet
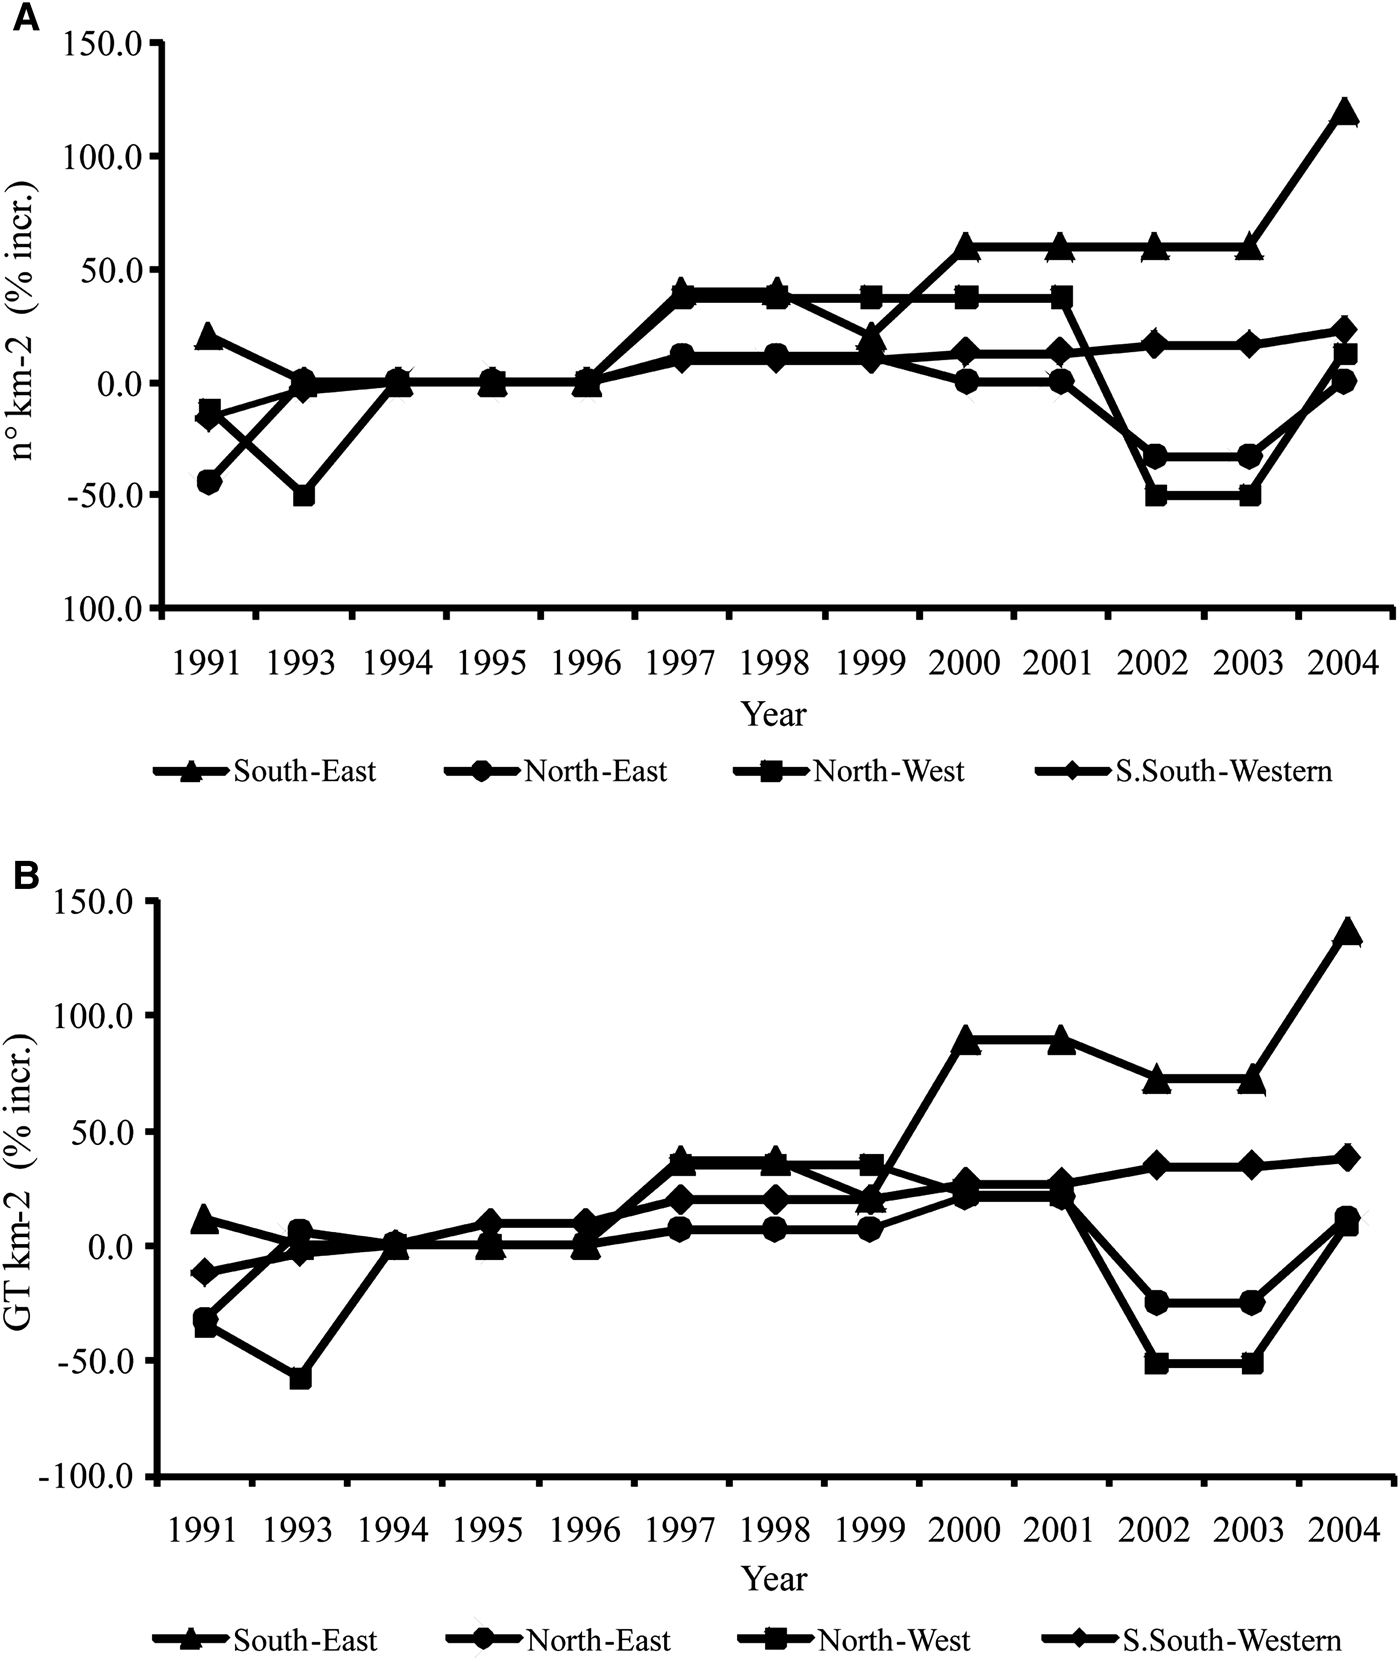
Fishing capacity for deep-sea resources increased by 26.4% (No.boatskm−2) and 48.5% (GT km−2) during the period 1994–2004, resulting in a total number of 67 boats of GT > 30 in 2004 that were operating between a depth of 400 and 800 m over a trawlable area of about 4220 km2.
The increase in fishing effort from 1994 to 2004 is statistically significant for the whole area, but it showed different temporal trends in the four zones studied. The highest increases were recorded in the SE (+120% in number and about +137% in tonnage) and SSW (+22.6% in number and +37.7% in tonnage) zones; MK testing showed statistical significant increase (P < 0.05). The NE area registered no fishing effort increase, whereas the NW area showed an increase of 12.5% in number and 9.3% in tonnage, that was not statistically significant (Figure 2). The annual reductions observed in some zones were due to the technical times necessary for running new boats (construction of the boats, equipping, launching, and bureaucratic procedures) (Figure 2).
Percentage increase in fishing effort (1994 is considered the reference year): (A) No. km−2; (B) GT km−2.
Species caught
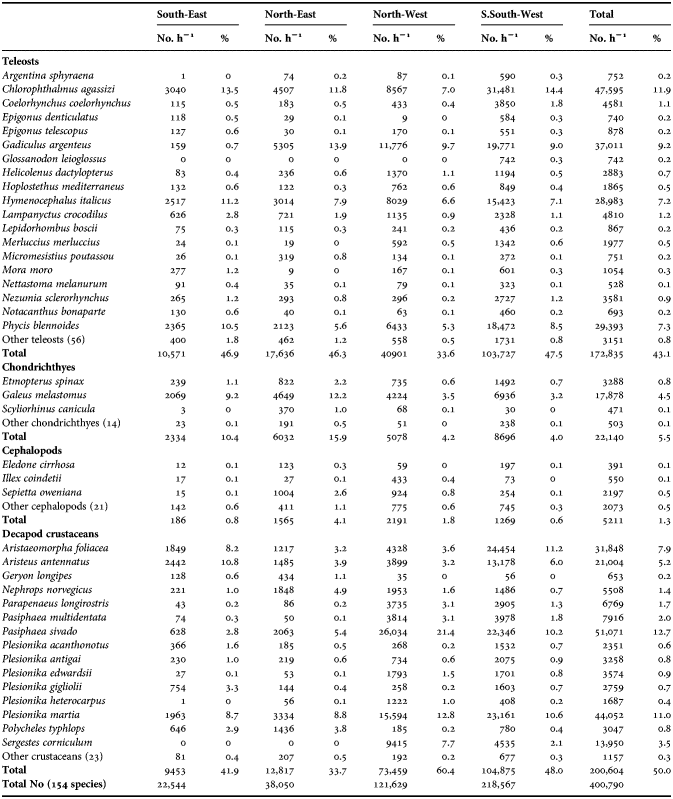
According to the selection criteria adopted, 154 species were collected. Teleosts were dominant (75), followed by decapod crustaceans (38), cephalopods (24), and chondrichthyes (17). Of the 154 species captured, 40 constituted about 98% of the total number of specimens (Table 1). Decapod crustaceans comprised 50% of the total catches and were thus the most abundant systematic class (No. h−1). Aristaeomorpha foliacea and Aristeus antennatus are the two most commercially valuable target species for fisheries that operate at the depths considered. They represent an important component of the total catch (13.1%). However, the most abundant single species was Pasiphaea sivado (12.7% of the total catches), which is of little commercial value and which was caught prevalently in the NW and SSW zones (Table 1). Teleosts comprised 43.1% of the total catch. Of the species present, Chlorophthalmus agassizi, Gadiculus argenteus, Phycis blennoides, and Hymenocephalus italicus constituted about 36% of the total individuals of bony fish (Table 1). Catches of chondrichthyes and cephalopods were fewer (5.5% and 1.3%, respectively) than those of teleosts. Each individual species within these two groups accounted for less than 1% of the total catch, with the exception of Galeus melastomus (4.5%) (Table 1).
List of species by sector.
Temporal trends of ecological diversity indices
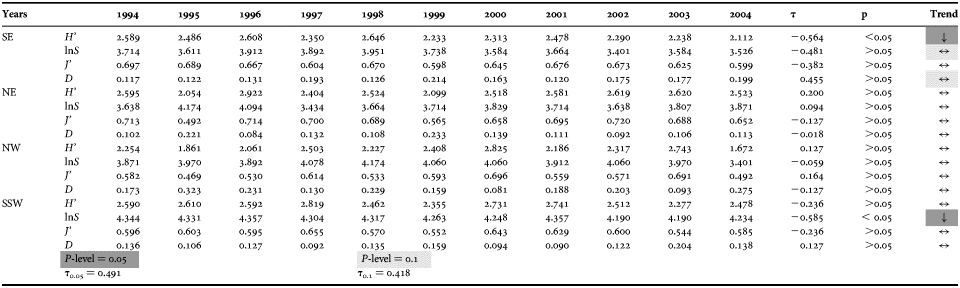
Ecological diversity indices showed oscillating and widely ranging variation in trends, except for species richness (lnS), which showed less extensive variations compared to the other indices (Table 2). Shannon–Weiner's diversity (H′) values ranged between a maximum of 2.922 (NE, 1996) and a minimum of 1.672 (NW, 2004). Higher peaks were recorded during the first half of the period (1994–1999), whereas more stable values were observed in subsequent years. The NW area differed slightly from the others in that its oscillating trend was maintained for the whole period of investigation (Table 2).
Variation of the ecological diversity indices for each zone with time. Trend direction and statistical significance (P < 0.05) of temporal changes in the values of species diversity (H′), species richness (lnS), evenness (J′), and dominance (D) are given. Kendall's τ critical values (τ0.05 and τ0.1) also are provided.
↑, increasing trend; ↓, decreasing trend; ↔, no trend (i.e. no statistical significance detected)
Simpson's index (D) values were analogous but sometimes more pronounced than those for Shannon–Weiner's diversity. In eastern areas (NE and SE), the highest values occurred in 1999. The absolute minimum was recorded for north-eastern Sardinia (D = 0.084, 1996), whereas the absolute maximum was in the NW zone (D = 0.323, 1995) (Table 2).
For NW and SSW Sardinian seas, Pielou's index (J′) also behaved in a similar manner to Shannon–Weiner's diversity. Slight differences were found in the SE and NE zones. In the SE zone, a narrow and regular range of variation was recorded, and it was interrupted by only two decreases (in 1997 and 1999). The NE exhibited a wider range of variation, mainly due to the maximum value of the index recorded in 2002 (0.720); this was the highest value for the study whole period. The minimum value was recorded in the NW zone (0.469, 1995) (Table 2).
Species richness (lnS) varied from between 4.357 (SSW, 1996 and 2001) and 3.401 (SE, 2002 and NW, 2004). Annual variations were less than for the other indices. The first three years of the period investigated showed higher values than the following years for the NE area.
Temporal trend analysis revealed diverse degrees of variation in the SE zone for all ecological diversity indices, with the exception of evenness (Table 2). Species richness showed a moderate decrease over time, likely due to a sustained decline that began in 1998. Such a decrease in species richness affected Shannon–Weiner's diversity, which, during the study period, showed a significant decline (MK test P < 0.05). On the other hand, Simpson's index showed a moderate increase in dominance for the SE area (Table 2).
The SSW area only varied in the species richness, which underwent a constant significant decrease (MK test, P < 0.05), although values here continued to be higher than in the other zones (Table 2).
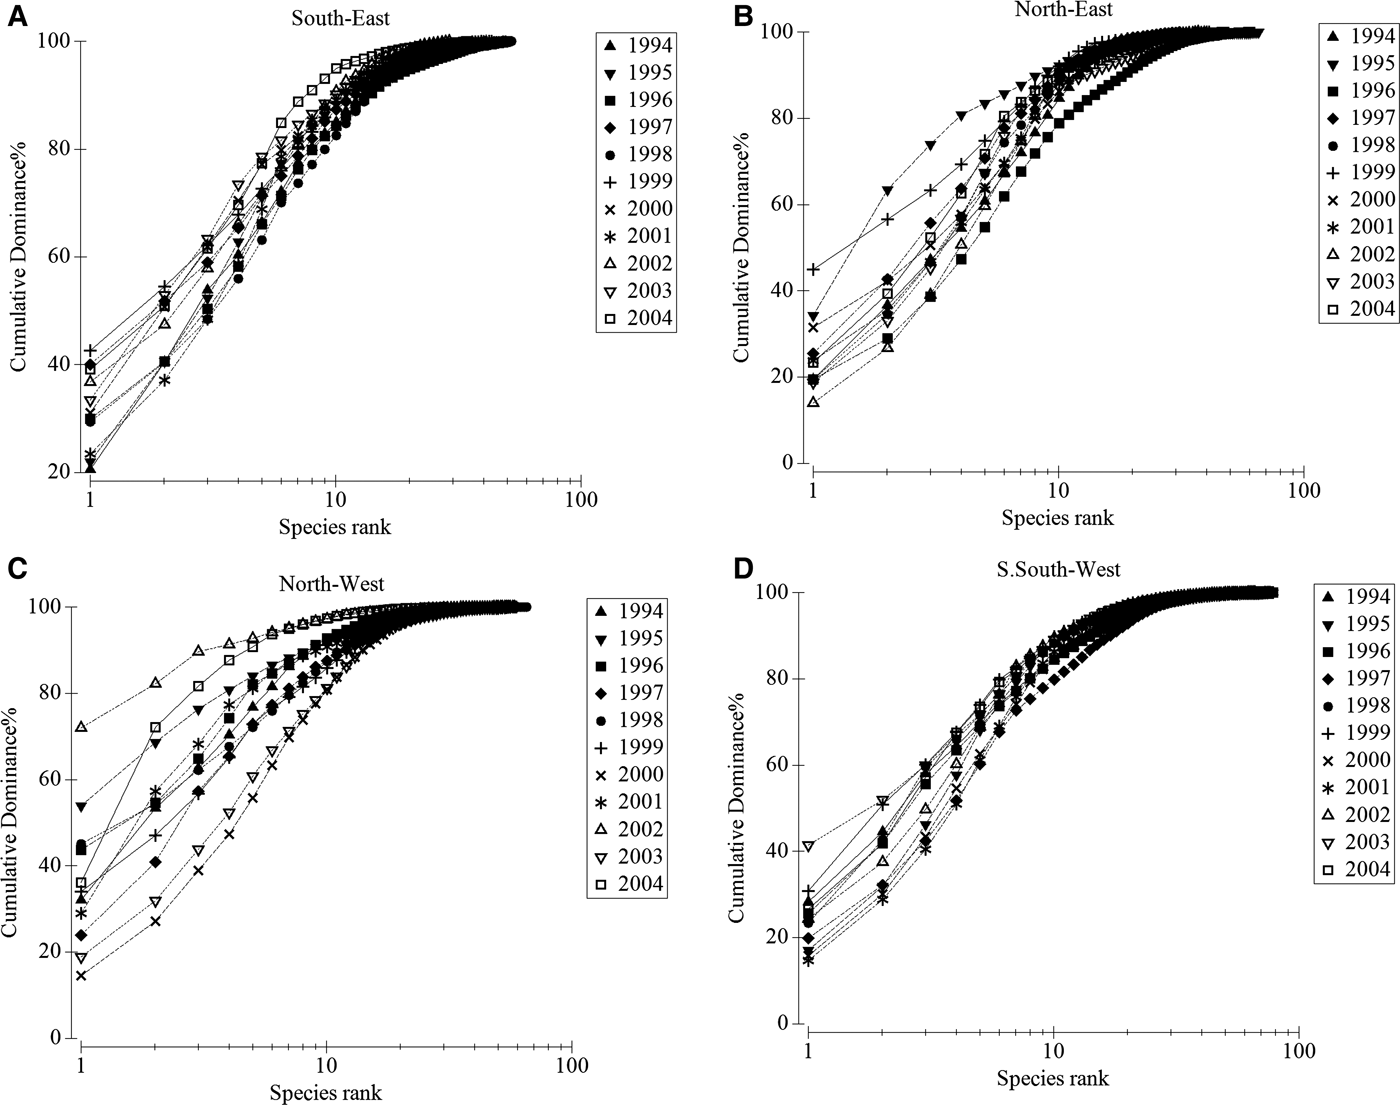
The analysis of the K-dominance curves, which are considered to be particularly robust to the effect of sample size compared to other diversity indices (Zhou et al., Reference Zhou, Zhang, Liu, Tu and Yu2007), provided an additional point of view regarding the temporal variations in species diversity. Under normal annual fluctuations, a temporal trend for the two southern areas was evident. In fact, for the SE and SSW zones, the last years of the study (2002–2004) were less diverse then the starting years (Figure 3). For the NE and NW areas, no clear temporal pattern could be established, thus there was no evidence of temporal changes in these areas.
Comparison of k-dominance curves for the 400–800 m middle-slope assemblages between the years investigated from the (A) SE, (B) NE, (C) NW and (D) SSW zones.
Exploratory analysis of variables
Regarding the biodiversity set the highest CV is for dominance (31%). Shannon index displayed an average of 2.474 ± 0.2090 SD, with a maximum of 2.922 (NE sub-zone; 1996) and a minimum of 1.762 (NW sub-zone; 2004) (Table 3).
Average, standard deviation (SD), maximum, minimum and coefficient of variation of independent variables (lnS, J′; D, GT; N°; GT Area−1; N°Area−1), and Shannon index (H′).

The exploratory correlation analysis showed that several correlation coefficients were significant (for P < 0.05, P < 0.01 and P < 0.001) (Table 4). Only the variable J′; (evenness) showed a significant correlation with all other variables. The highest values of correlation were found mainly for analogous variables, in particular for the fishing effort set (0.94 for GT vs No.). Highly significant correlation values between the two different sets, were found between lnS and N (0.62 P < 0.001), lnS and GT (0.57 P < 0.01). The dependent variable (H′) showed significant correlations with lnS, J′, D (0.35, 0.65 and −0.93, respectively) and Noboats area−1 (−0.34).
Correlation matrix between Shannon index (H′) and independent variables.
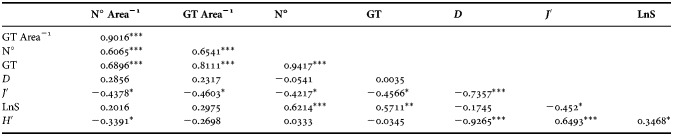
***, P < 0.001; **, P < 0.01; *, P < 0.05.
MULTIPLE REGRESSION ANALYSIS
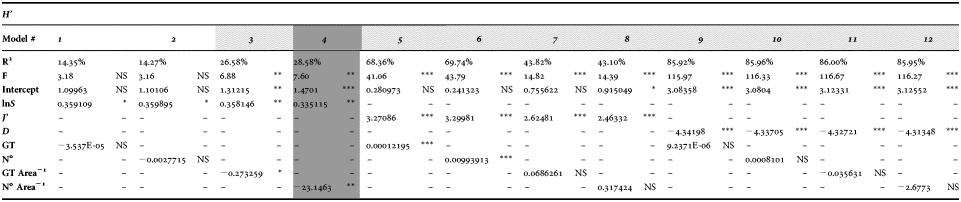
Using multiple regression analysis, 12 different forecasts for Shannon's index H′ time trend behaviour have been generated (Table 5). The variables tested were species richness (lnS), evenness (J′) and dominance (D) (the biodiversity set), together with fishing pressure expressions: GT, No., GT area−1, Noboats area−1 (the fishing effort set). As expected, the biodiversity set contributions were statistical significant in all models. Statistical significance for fishing effort set was found for GT area−1 and Noboats area−1 when in association with lnS, and for GT and N° when in association with J′. No contribution from fishing effort was found when it was in association with dominance.
Multiple regression model selection. Are reported: t-test of the intercept and the dependent variable included in the model (***, P < 0.001; **, P < 0.01; *, P < 0.05; NS, P > 0.05); coefficient of determination (R2); analysis of variance F-test P-values (F).
According to the selection criteria, the best model was No. 4 (Table 5), summarized by the following equation:
 $$\hat{H}^\prime=1.470+0.335 \cdot \ln S - 23.146 \cdot \displaystyle{{No_{boats} } \over {Area}}.\quad {\rm R}^2 = 28.58\percnt$$
This is to say, for a given species richness, Shannon's entropy decreases by 23.146 for each unit increase in fishing effort. More precisely, in the light of the standardized regression coefficient for all factors, it appears that species richness and fishing effort have almost the same impact on biodiversity, (0.449 vs −0.401, respectively). The model also underline that, while species richness is positively correlated with Shannon's entropy, fishing effort affects the biodiversity negatively.
The statistical significance of the model was confirmed by the F-test (P-value = 0.0017). The explanatory variables, species richness lnS (t-test P-value = 0.0028) and fishing effort, Noboats Area−1 (t-test P-value = 0.0069) together with the intercept (t-test P-value = 0.0008), provide a statistically significant contribution on Shannon's entropy estimate (Table 5). The residuals check reveals that there is no indication of serial autocorrelation in the residuals (D–W stat = 2.05607 P-value = 0.3405).
Although other models (5–12) showed higher R2 values than model 4, underlining a better explanatory power, they were excluded because at least one of the coefficients estimated is not statistically significant (NS), invalidating the suitability of those models for H′ estimation. Models 1 and 2 have also been excluded because the F-test condition has not been satisfied (Table 5).
Another model that can successfully be used for estimating of Shannon's entropy is model 3 (R 2 = 26.58%). This model is built with the same species richness as model 4, along with an expression of fishing effort (GT area−1). The whole model and the single contribution of each regressor gave statistically significant results.
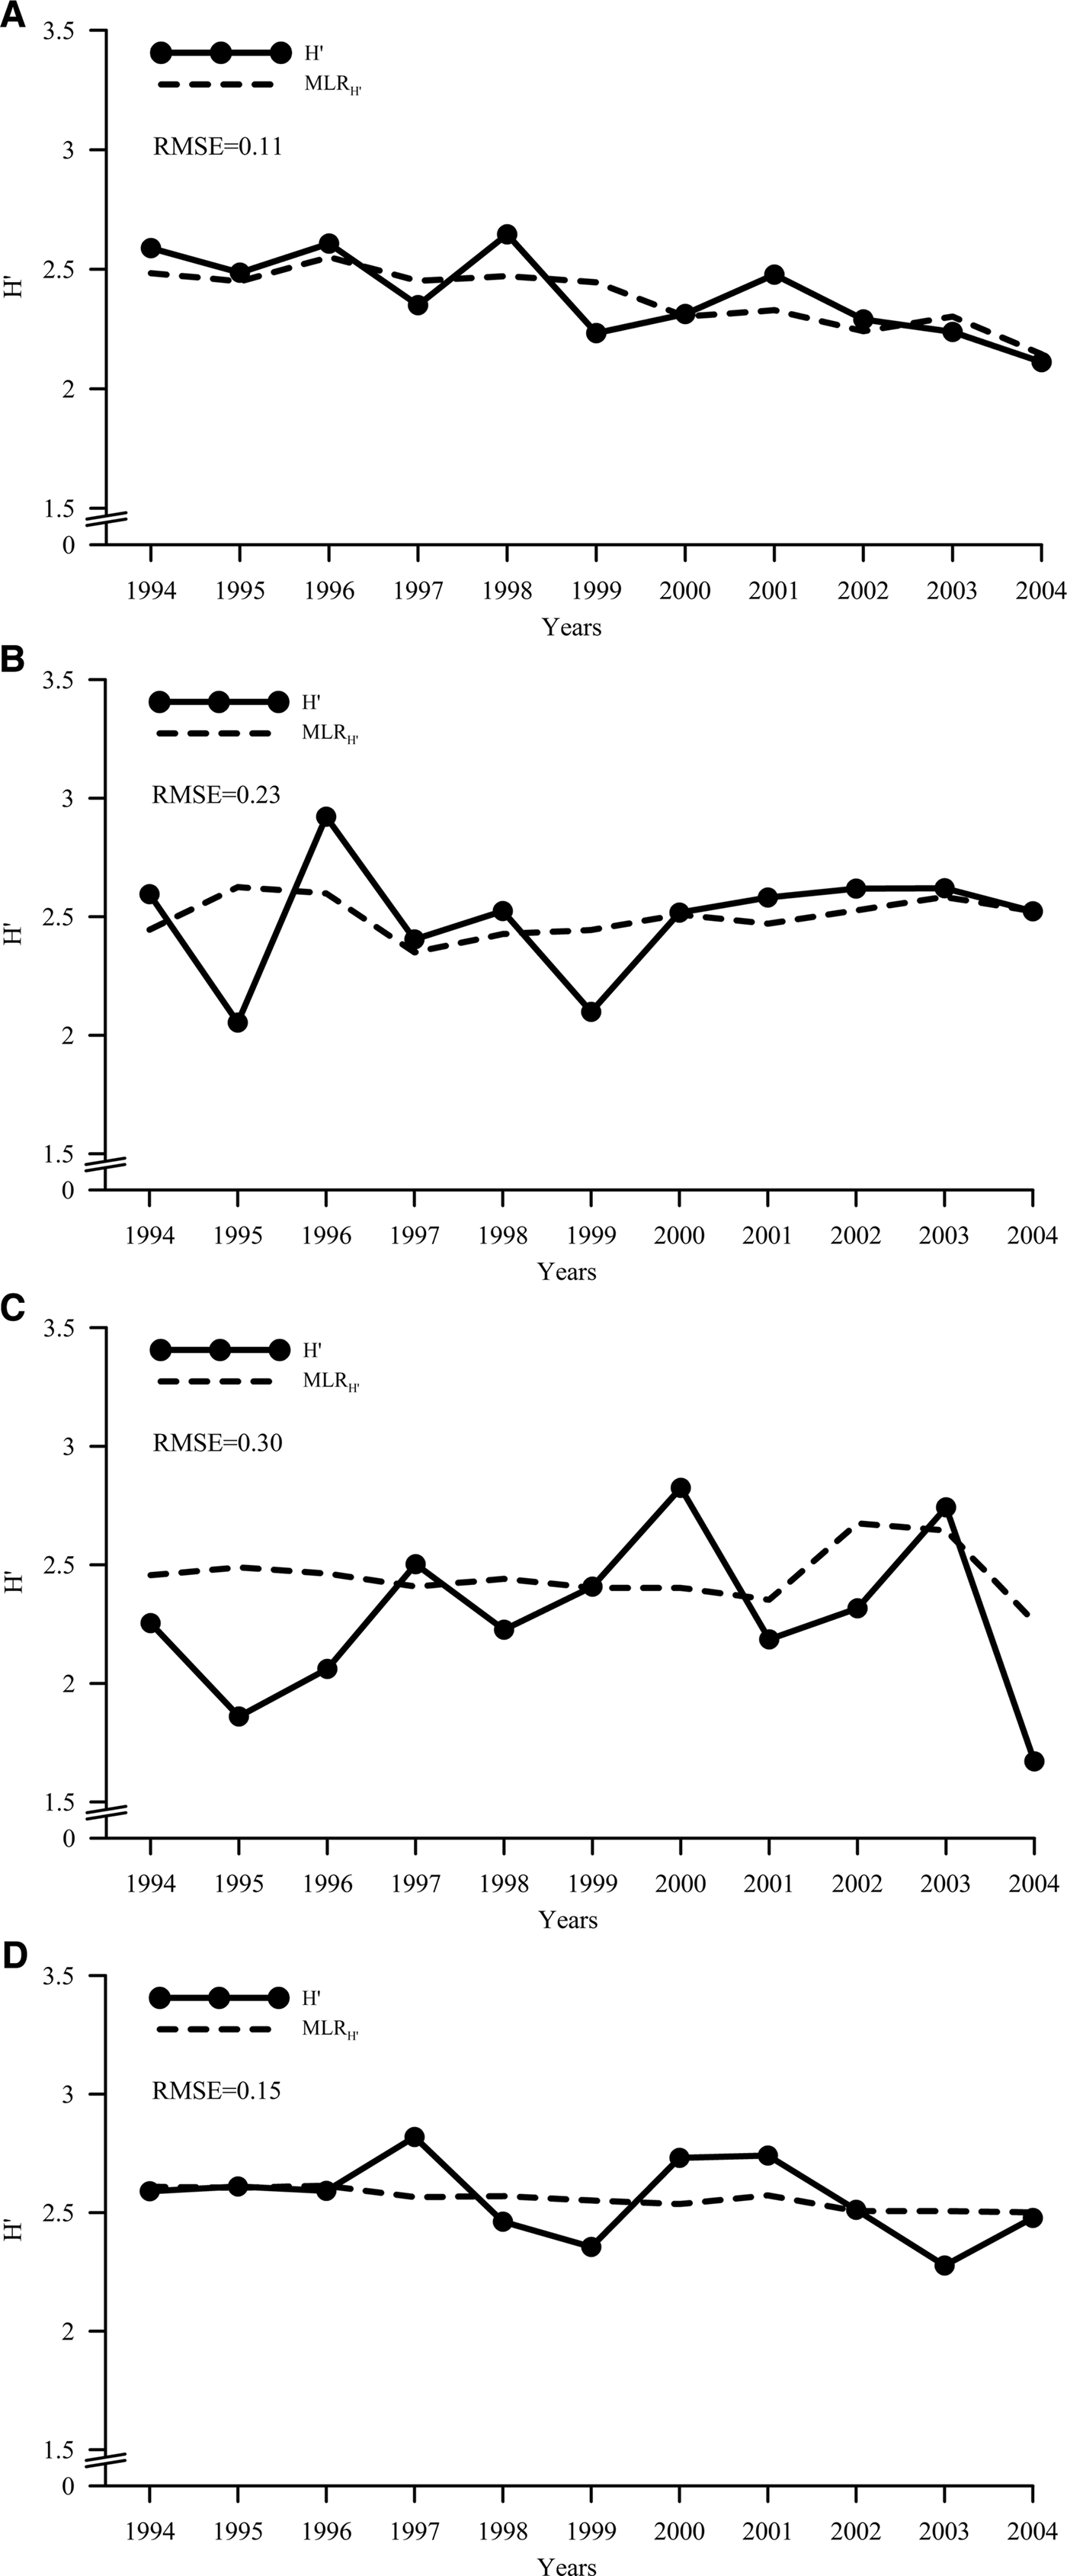
The model performance, i.e. its describing power, was higher in the SE sub-zone (RMSE = 0.11), followed by SSW sub-zone (RMSE = 0.15). Although statistically significant, the describing power was less efficient for NE and NW sub-zone (RMSE = 0.23 and 0.30, respectively) (Figure 4).
Observed (solid line) and predicted (dashed line) biodiversity: (A) SE, (B) NE, (C) NW, (D) SSW sub-zones.
DISCUSSION
The tight correlation between biodiversity and fishing activity is receiving increasing assent (Ungaro et al., Reference Ungaro, Marano, Marsan and Ostmani1998; Blanchard Reference Blanchard2001; D'Onghia et al., Reference D'Onghia, Mastrototaro, Matarrese, Politou and Mytilineou2003; Lobry et al., Reference Lobry, Gascuel and Domain2003; Labropoulou & Papaconstantinou, Reference Labropoulou and Papaconstantinou2004; Hutchings & Baum, Reference Hutchings and Baum2005; Worm et al., Reference Worm, Hilborn, Baum, Branch, Collie, Costello, Fogarty, Fulton, Hutchings, Jennings, Jensen, Lotze, Mace, McClanahan, Minto, Palumbi, Parma, Ricard, Rosenberg, Watson and Zeller2009; Zhou et al., Reference Zhou, Smith, Punt, Richardson, Gibbs, Fulton, Pascoe, Bulman, Bayliss and Sainsbury2010). Our analysis of species richness and abundance, by means of the ecological diversity indices and based on data from 11 annual trawl surveys, revealed different temporal trends in the four zones considered. At depths of 400 and 800 m, only about 25% of the 154 species caught had a high degree of dominance; together they represented 98% of total abundance (No. h−1). Species of bony fish were the most numerous, followed by crustaceans, which were more abundant in terms of number of individuals. These results are in agreement with those reported in other studies from the Eastern and Central Mediterranean (D'Onghia et al., Reference D'Onghia, Mastrototaro, Matarrese, Politou and Mytilineou2003).
There are several causes and factors that can induce variations in ecological diversity (Ungaro et al., Reference Ungaro, Marano, Marsan and Ostmani1998; Lobry et al., Reference Lobry, Gascuel and Domain2003). Climatic changes, for example, are in general directly responsible for important environmental variations, but they apparently affect only surface layers. A temporal analysis of sea temperature data conducted by the ECCO-JPL project (ECCO-JPL Ocean Data Assimilation Project, 1999) did not reveal any significant variation in temperatures for the bathymetric range studied over the time period considered. We believe that bottom trawling activity may be the main source of variation in these assemblages. Temporal variation of ecological diversity indices (diversity, species richness, evenness, and dominance), in fact, seems to be clearly related to fishing effort (Noboats km−2).
The renewal of fishing fleets in Sardinia that resulted from the government policy designed to improve productivity coincided with our period of investigation. The total fishing effort increase it has affected some of the studied zones in different ways. The varying intensity of exploitation enabled us to identify the effects that such disturbance have had on biodiversity and on the structure of the exploited populations, both of which were positively correlated with fishery yield (Ungaro et al., Reference Ungaro, Marano, Marsan and Ostmani1998; Worm et al., Reference Worm, Barbier, Beaumont, Duffy, Folke, Halpen, Jackson, Lotze, Micheli, Palumbi, Sala, Selkoe, Stachowicz and Watson2006).
The government policy was designed to reduce coastal fishing effort, caused, before the early 1990s, by low tonnage wooden boats (Cau et al., Reference Cau, Sabatini, Murenu, Follesa and Cuccu1994) and to increase middle slope fishing via fleet renewal. However, the poor control of the fleet renewal generated an uneven effort among coasts. In fact, the increased fishing pressure in SE Sardinia due to fleet renewal (+120% in number and 137% in tonnage) has caused a reduction in red shrimp biomass (Sabatini et al., Reference Sabatini, Cabiddu, Cuccu, Murenu, Pendugiu, Pesci, Follesa and Cau2006). Our results show that other species associated with red shrimp have also been affected, as indicated by the decrease in species richness, which in turn generated a heavy drop in diversity shown. Put simply, we think that the high frequency of stock reduction in this zone does not allow exploited populations to react to fishing pressure with a growth rate increase (Huston, Reference Huston1979). Despite the high variability in the data, this is particularly evident in the SSW, where some species showed a significant increase in abundance. Such alteration revealed by ecological diversity indices suggests that a significant variation occurred in species composition in the subarea analysed.
SSW Sardinia also exhibited a higher dominance gradient for the last years of the investigation period, but the only statistically significant drop was for species richness. These data suggest that an increased frequency of population reduction led to an initial stage of overexploitation in this zone (confirmed by the data registered for the red shrimp), which reveals a decrease in biomass and an increase in fish mortality (Sabatini et al., Reference Sabatini, Cabiddu, Cuccu, Murenu, Pendugiu, Pesci, Follesa and Cau2006). Nevertheless, a wider trawling area in the SSW relative to the SE and the characteristic turnover of gulf waters, make this zone more resilient to the fishing effort increase (+22.6% in number and 37.7 in tonnage) that has occurred in Sardinian seas.
Northern Sardinia fleets (NE and NW) showed no temporal variation; they maintained a constant level during the whole period of investigation (NE) or exhibited only a slight increase. No significant temporal trend in the ecological diversity indices was observed for these areas, leading us to conclude that the slight variations observed were due to chance or to normal environmental dynamics.
According to our observations, species richness seems to be the index most sensitive to fishing effort. This is particularly evident for the SE and SSW zones. For the SE zone, the most important increase in fishing effort, which began in 2000, coincided with an important decrease in lnS. For the SSW zone, a constant and slow increase in fishing effort resulted in a constant decrease in species richness. No statistical trend was found for the NE zone.
Our results highlight more pronounced and significant variations in ecological diversity indices in consequence of fishing effort evolution. Multiple regression analysis confirmed this statement. Coefficient of determination (R 2) of the selected model, showed that the fitted model explains 28.58% of the H′ variability, underlining that changes in species richness or in fishing effort may generate, acting jointly, more than 1/4 of the variation observed in Shannon's diversity. The models with a higher R 2 were, on the other side, not suitable due to their not statistical significant P-values. So the ‘better’ describing power is actually ineffective, due to a non-significant intercept (models 5 and 6) or because it was generated by only one of the explanatory variables considered (models 7–12).
The application of the model on single sub-zones and its performance measurement by means of RMSE, displayed that the biodiversity of SE and SSW sub-zones is better described than the northern seas one. This may highlight that for southern areas there should be a tighter accordance between fishing effort and species richness. The statistical model can thus provide a better describing power of biodiversity. Otherwise in the Northern sub-zones, where increasing in fishing effort was not statistically significant, the combination between species richness and fishing effort generates a model that describes less well the Shannon's entropy (i.e. higher values of RMSE).
CONCLUSIONS
The indices tested seem to differ in their sensitivity to ecosystem perturbations, and they are able to indicate changes in exploited ecosystems. Although the best method for measuring biodiversity is still under debate (Bianchi et al., Reference Bianchi, Gislason, Graham, Hill, Koranteng, Manickchand-Heileman, Paya, Sainsbury, Sanchez, Jin and Zwanenburg2000; Izsàk & Papp Reference Izsàk and Papp2000; Rochet & Trenkel, Reference Rochet and Trenkel2003; Magurran, Reference Magurran2004), as is its reliability as a tool for ecosystem evaluation (Lobry et al., Reference Lobry, Gascuel and Domain2003), it has been well documented that commercial fisheries affect marine ecosystems due to the persistent modifications they cause in species composition, dynamics, and the structure of exploited populations (Pauly, Reference Pauly and Gulland1988; Haedrich & Barnes, Reference Haedrich and Barnes1997; Fogarty & Murawski, Reference Fogarty and Murawski1998; Bianchi et al., Reference Bianchi, Gislason, Graham, Hill, Koranteng, Manickchand-Heileman, Paya, Sainsbury, Sanchez, Jin and Zwanenburg2000; Loreau et al., Reference Loreau, Naeem, Inchausti, Bengtsson, Grime, Hector, Hooper, Huston, Raffaelli, Schmid, Tilman and Wardle2001; Worm et al., Reference Worm, Barbier, Beaumont, Duffy, Folke, Halpen, Jackson, Lotze, Micheli, Palumbi, Sala, Selkoe, Stachowicz and Watson2006). According to our results, the estimation of diversity, species richness, evenness, and dominance might have a considerable role in ecosystem health assessment, allowing to detect potential modifications in resilience that otherwise would pass unnoticed; they also enable us to predict more considerable and deleterious changes. The peculiarity of the situation in Sardinia, which is characterized by varied geomorphology and was monitored constantly during fleet renewal, provided favourable conditions for this type of study. In the light of the results, it is necessary to frame the usefulness of the model (its forecast capacity) in the context of a short–medium time period. In this framework, the model may be used to estimate the possible diversity value generated by a variation of fishing effort and a certain value of species richness. Thus, due to the tight connection between biodiversity and ecosystem functioning (Dubois et al., Reference Dubois, Commito, Olivier and Retière2006; Worm et al., Reference Worm, Barbier, Beaumont, Duffy, Folke, Halpen, Jackson, Lotze, Micheli, Palumbi, Sala, Selkoe, Stachowicz and Watson2006; Hector & Bagchi, Reference Hector and Bagchi2007), to forecast the health of marine ecosystem subject to fishery exploitation. Even given the influences of the various environmental features that may affect each analysed zone, it was possible to show the influence of anthropogenic pressure on such zones and understand the extent to which it may modify ecosystem dynamics. Our results showed that the mechanisms for diversity variations in the Sardinian red shrimp-related community have been explained, at least in part, by the multiple linear regression model we used. Our future aim may be to increase as possible the knowledge of the ‘unexplained part’. First of all by analysing biodiversity behaviour using other kinds of model (e.g. non linear), including also the environmental variables that mostly affect demersal biodiversity in Sardinian seas.
ACKNOWLEDGEMENTS
The authors are grateful to Matthew Camilleri for his advice, and thank the two anonymous referees for helpful comments on the manuscript.
FINANCIAL SUPPORT
This work was developed and presented under the auspices of the REDS project, financed by European Union (Project ref.: FISH/2004/03-32).